

Abstract
The interaction of myosin and actin in many invertebrate muscles is mediated by the direct binding of Ca2+ to myosin, in contrast to modes of regulation in vertebrate skeletal and smooth muscles. Earlier work showed that the binding of skeletal muscle myosin subfragment 1 to the actin-troponin-tropomyosin complex in the presence of ATP is weakened by less than a factor of 2 by removal of Ca2+ although the maximum rate of ATP hydrolysis decreases by 96%. We have now studied the invertebrate type of regulation using heavy meromyosin (HMM) prepared from both the scallop Aequipecten irradians and the squid Loligo pealii. Binding of these HMMs to rabbit skeletal actin was determined by measuring the ATPase activity present in the supernatant after sedimenting actoHMM in an ultracentrifuge. The HMM of both species bound to actin in the presence of ATP, even in the absence of Ca2+, although the binding constant in the absence of Ca2+ (4.3 × 10³ m−1) was about 20% of that in the presence of Ca2+ (2.2 × 10⁴ m−1). Studies of the steady state ATPase activity of these HMMs as a function of actin concentration revealed that the major effect of removing Ca2+ was to decrease the maximum velocity, extrapolated to infinite actin concentration, by 80–85%. Furthermore, at high actin concentrations where most of the HMM was bound to actin, the rate of ATP hydrolysis remained inhibited in the absence of Ca2+. Therefore, inhibition of the ATPase rate in the absence of Ca2+ cannot be due simply to an inhibition of the binding of HMM to actin; rather, Ca2+ must also directly alter the kinetics of ATP hydrolysis.
During the 1970s, it was generally accepted that regulation of vertebrate skeletal muscle contraction involved a steric blocking of the binding of myosin to actin by the troponin-tropomyosin complex. This model was based on the finding that the relative position of tropomyosin on the actin filament is different in the presence of Ca2+ than in the absence of Ca2+ (2–4). However, it has been recently demonstrated that the binding of myosin to actin persists in the absence of Ca2+ under conditions where troponin-tropomyosin inhibits the actomyosin ATPase activity in vitro (5, 6) and force production in skinned rabbit fibers (7, 8). Apparently, a step in the hydrolysis of nucleotide which occurs after the binding of myosin to actin is inhibited in the absence of Ca2+. There is also evidence that relaxation of vertebrate smooth muscle is due to inhibition of a kinetic step subsequent to the binding of myosin to actin (9) although regulation in this case is mediated by phosphorylation of the myosin rather than by Ca2+ binding to troponin-tropomyosin.
In the present study, we have investigated the effect of Ca2+ on the actin-activated molluscan HMM1 ATPase activity and on the binding of molluscan HMM to actin in the presence of ATP. HMM was prepared from myosin isolated from the striated adductor muscle of the scallop Aequipecten irradians and from the helically smooth mantle retractor muscles of the squid Loligo pealii. As with vertebrate smooth muscle, relaxation of these molluscan muscles is myosin-linked (10). Here, however, rather than controlling phosphorylation of myosin, Ca2+ binds directly to a region of the myosin involving both the heavy and light chains (11). Our results suggest that, as with vertebrate skeletal muscle and smooth muscle myosins, regulation of the actin-activated molluscan myosin ATPase activity involves inhibition of a kinetic step which occurs after the binding of the HMM to actin.
EXPERIMENTAL PROCEDURES
Myosin was isolated from fiber bundles obtained from the striated adductor muscle of the scallop A. irradians and the mantle retractor muscle of the squid L. pealii by standard procedures (12). Myosin was finally dissolved either in 0.6 m NaCl, 10 mm phosphate, 5.0 mm MgCl2, 1.0 mm CaCl2, 0.1 mm EGTA, 3.0 mm NaN3, pH 7.0, prior to HMM production, or in 0.1 m NaCl, 10 mm phosphate, 1.5 mm MgCl2, 1.5 mm CaCl2, 0.1 mm EDTA, 3.0 mm NaN3, pH 7.0, prior to Ca·Mg·S-1 production. Heavy meromyosin was prepared by tryptic digestion (400:1 weight ratio) for 1 min at 23 °C as described earlier (13, 14). The reaction was terminated by addition of soybean trypsin inhibitor at a 2:1 weight ratio to trypsin. Ca·Mg·S-1 was prepared by papain digestion of myosin using procedures first described by Stafford et al. (15). After termination of the digestion by addition of iodoacetic acid to 5 mm, S-l was separated from unreacted iodoacetic acid by further ammonium sulfate fractionation (65% saturation). Actin was prepared both by the procedure of Spudich and Watt (16) as modified by Eisenberg and Kielley (17) and by the procedure of Kendrick-Jones et al. (10). A representative sodium dodecyl sulfate-polyacrylamide gel of the proteins used is shown in Fig. 1. The regulatory and essential light chains of Aequipecten myosin migrate as a single band. The Aequipecten regulatory light chain is clipped during the preparation of Ca·Mg·S-l and is clearly resolved. Preparations of HMM from both Aequipecten and Loligo myosin had the same content of light chains as the original myosin. The molecular weights used for HMM, S-l, and F-actin were 350,000, 120,000, and 42,000, respectively. HMM and S-l concentrations were determined by the biuret assay (18) with crystalline bovine serum albumin as the standard. The actin concentration was determined spectrophotometrically using an absorption coefficient of 1150 cm2/g at 280 nm.
Fig. 1. Sodium dodecyl sulfate-polyacrylamide gel representative of the proteins used.
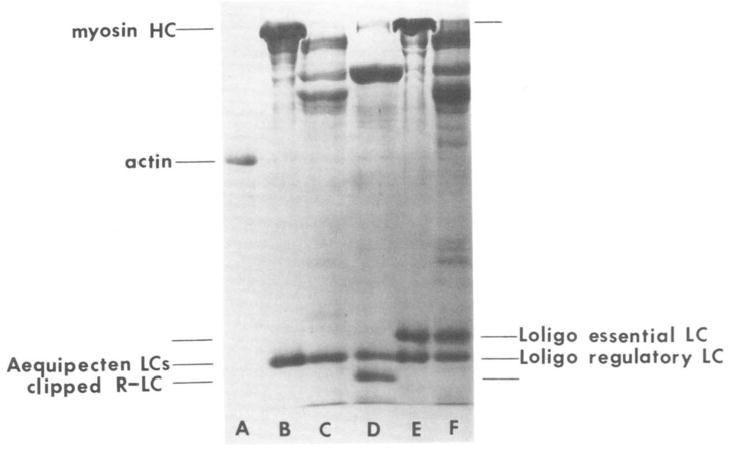
Lane A, 2 μg of rabbit skeletal actin; lane B, 20 μg of Aequipecten myosin; lane C, 30 μg of Aequipecten HMM; lane D, 30 μg of Aequipecten Ca·Mg·S-1; lane E, 20 μg of Loligo myosin; lane F, 30 μg of Loligo HMM. The gel was 12.5% polyacrylamide and run using the Laemmli (19) discontinuous buffer system. LC, light chain; R-LC, regulatory light chain.
Actin-activated ATPase Assays
Actin-activated ATPase assays were measured at 25 °C either by measuring the rate of liberation of [32P]Pi from [γ-32P]ATP (20) or by the pH-stat method (11, 21). ATPase rates were measured in a solution of the following final composition: 1 mm ATP, 1.8 mm MgCl2, 10 mm imidazole, 1 mm dithiothreitol, and 0.5 mm EGTA or 0.5 mm Ca-EGTA (pCa = 4.8), pH 7.0. In assays based on the determination of [32P]Pi, a minimum of four time points were taken to establish the rate. The parameters Vmax and KATPase were determined by using a nonlinear least squares routine based on Marguardt’s compromise (22). The approximate 95% confidence intervals for values of Vmax and KATPase were about 10 and 20%, respectively.
Binding Assays
Binding was measured at 25 °C in the same solution used to measure actin-activated ATPase rates with the addition of 1 mg/ml of bovine serum albumin. The actoHMM was sedimented in an air-driven ultracentrifuge (6) and the free S-l or HMM concentration was determined by an ATPase assay. An NH4+-ATPase assay (6) was used for Aequipecten S-l and HMM, while an actin-activated ATPase assay with 50 μm actin was used for Loligo HMM. Standard curves for Aequipecten HMM and Loligo HMM are shown in Fig. 2 with the rates expressed as a function of the concentration of catalytic sites. The NH4+-ATPase rate of Aequipecten HMM increases linearly with the HMM concentration over a wide range of HMM concentrations; only the usual working range is shown. The addition of 8 μm actin had no effect on the NH4+-ATPase rate although this is more than twice the actin ever present in these assays from the supernatants of binding experiments. The NH4+-ATPase rate of Aequipecten S-l (not shown) was also linear with S-l concentration and unaffected by actin although the rate per catalytic site was only 40% of that of Aequipecten HMM. In contrast to Aequipecten HMM, the NH4+-ATPase activity of Loligo HMM was low (15% of Aequipecten HMM) and this low rate was activated 2-fold by the addition of 8–13 μm actin. This activating effect of actin was observed only if the actin was added to solution prior to the HMM. Because of this unusual effect of actin, the actin-activated Mg2+-ATPase assay was used for Loligo HMM as shown in Fig. 2. Binding constants were determined by the nonlinear least squares routine with the constraint that at the limit of infinite actin concentration all of the HMM is bound. The approximate 95% confidence interval for S-l binding experiments was 20% and for all HMM experiments was within 13%.
Fig. 2. Standard curves for determining the concentration of Aequipecten HMM and Loligo HMM in binding studies.
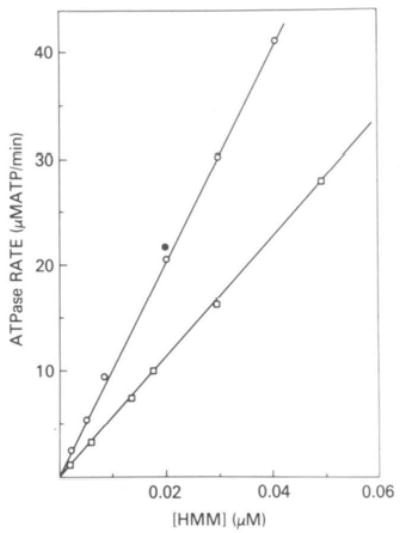
The concentration of Aequipecten HMM (○) was determined by an NH4+-EDTA-ATPase assay containing 5 mm ATP, 0.4 m NH4C1, 35 mm EDTA, and 25 mm Tris, pH 8.0. The effect of 8 μm actin on the rate is indicated (•). The concentration of Loligo HMM (□) was determined by an actin-activated ATPase assay containing 50 μm actin, 1 mm ATP, 1.8 mm MgCl2, 10 mm imidazole, 1 mm dithiothreitol, and 0.5 mm Ca2+-EGTA, pH 7.0.
RESULTS
We began by studying the effect of Ca2+ on the actin-activated ATPase rate of molluscan HMM. Fig. 3 shows double reciprocal plots of ATPase activity versus actin concentration for both Aequipecten striated muscle and Loligo smooth muscle HMM. As can be seen, for Aequipecten HMM, the maximum actin-activated ATPase rate (Vmax) is almost 5-fold greater in the presence of Ca2+ (14 s−1) than in the absence of Ca2+ (3 s−1). Similarly, for Loligo HMM, Vmax in the presence of Ca2+ (35 s−1) is seven times greater than Vmax in the absence of Ca2+ (5 s−1). This effect of Ca2+ on Vmax is not observed with Aequipecten S-l (data not shown). Both in the presence and absence of Ca2+, the value of Vmax, for Aequipecten S-l is similar to the value of Vmax for Aequipecten HMM in the presence of calcium.
Fig. 3. Double reciprocal plots of HMM ATPase activity versus actin concentration.
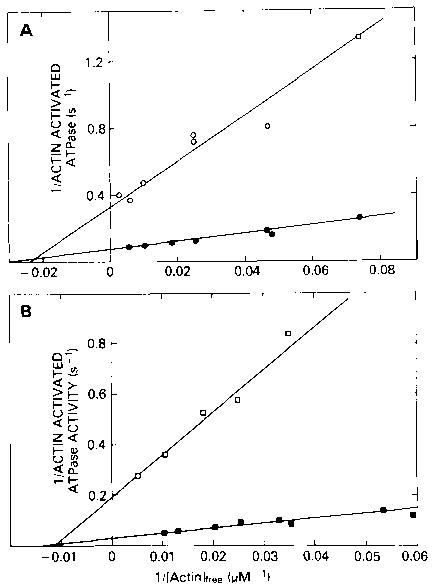
A, Aequipecten HMM; B, Loligo HMM. The | ATPase rates were measured at 25 °C in a solution containing 1 mm ATP, 1.8 mm MgCl2, 10 mm imidazole, 1 mm dithiothreitol, and either 0.5 mm EGTA or 0.5 mm Ca2+-EGTA. All rates are expressed per catalytic site or per “head” and are corrected for the rate at zero actin. For Aequipecten, this correction is 0.3 and 0.13 s−1 in Ca2+ and EGTA, respectively, while for Loligo, the correction is 0.19 and 0.07 s−1 in Ca2+ and EGTA, respectively. Rates are shown in both the presence (• and ▪) and absence (○ and □) of Ca2+.
The double reciprocal plots in Fig. 3 also yield values for KATPase. In the case of Aequipecten HMM, KATPase in the absence of Ca2+ (2.4 × 10⁴ m−1) is only slightly weaker than in the presence of Ca2+ (3.1 × 10⁴ m−1). Similarly for Loligo HMM, the values of KATPase are 1.1 × 10⁴ m−1 and 1.4 × 10⁴ m−1 in the absence and presence of Ca2+, respectively. The large effect of Ca2+ on Vmax for molluscan HMM in conjunction with the very small effect of Ca2+ on KATPase suggests that Ca2+ regulates the ATPase activity by effecting a kinetic step in the ATPase cycle rather than by effecting the binding of HMM to actin. Before reaching such a conclusion, however, there is another possibility which must be ruled out, especially considering the relatively high ATPase activity which occurs in the absence of Ca2+. This residual ATPase activity could be due to a fraction of protein which is not regulated by Ca2+, in which case, our observation that the value of KATPase is the same in the presence and absence of Ca2+ may not be meaningful. It is still possible that in the absence of Ca2+, the HMM which is Ca2+-sensitive does not bind to actin at all and therefore does not contribute to the ATPase activity.
This possibility can only be ruled out by directly measuring the binding of the molluscan HMM to actin in the presence of ATP. As a control on this binding, we first studied the effect of Ca2+ on the association of unregulated Aequipecten Ca·Mg·S-1 with pure actin in the presence of ATP. Fig. 4 shows a double reciprocal plot of S-l bound versus actin concentration in the presence and absence of Ca2+. As can be seen, the double reciprocal plot is linear and has an ordinate intercept of 1, which shows that all of the S-l binds to actin at infinite actin concentration. Despite the large error in the data at the lower actin concentrations due to a 20% correction for aggregated S-l which sedimented even in the absence of actin, it is clear that Ca2+ has no effect on the binding of this unregulated S-l. The best fit to the data in both the presence and absence of Ca2+ gives a value for Kbinding of 4.4 × 10⁴ m−1. This binding constant is similar to the binding constant of rabbit skeletal S-l to actin in the presence of ATP at low ionic strength; it is orders of magnitude weaker than the binding expected in the absence of nucleotide or in the presence of ADP.
Fig. 4. Double reciprocal plot of the fraction of Aequipecten S-l bound to actin, in the presence of ATP, as a function of the free actin concentration.
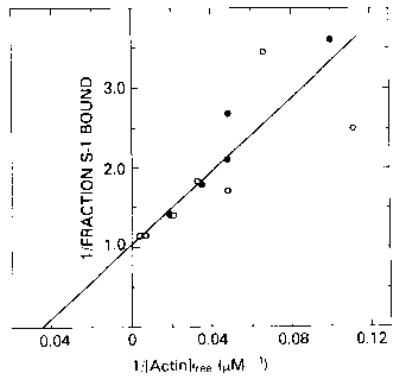
Binding was measured at 25 °C in a solution containing 1 mm ATP, 1.8 mm MgCl2, 10 mm imidazole, 1 mm dithiothreitol, and either 0.5 mm EGTA or 0.5 mm Ca2+-EGTA; the S-l concentration in all assays was 0.04 μm. Data in both the presence (•) and absence (○) of Ca2+ gave an association constant of 4.4 × 10⁴ m−1.
The binding of the Ca2+-regulated Aequipecten HMM and Loligo HMM to rabbit skeletal actin in the presence of ATP is shown in Fig. 5. In both cases, the binding constant of HMM in the presence of Ca2+ (2 × 10⁴ m−1) is similar to the binding constant of Aequipecten S-l to actin. At the highest actin concentration used (200–250 μm), more than 70% of the HMM bound to actin. In the absence of Ca2+, it is clear that HMM binds to actin but with a lower binding constant (4 × 10³ m−1). At the highest actin concentrations, 50–60% of the HMM from both Aequipecten and Loligo is bound. Therefore, most of the HMM is bound to actin under conditions where the ATPase rate is inhibited. At 200 μm actin, for Aequipecten, the amount of HMM bound in the presence of Ca2+ is only 40% greater than the amount bound in the absence of Ca2+ although the rate in the presence of Ca2+ is increased about 5-fold over that in the absence of Ca2+. Similarly, for Loligo, a 7-fold increase in ATPase rate in Ca2+ is accompanied by only a 40% increase in the amount of HMM bound to actin. Therefore, although the binding of molluscan HMM to actin is weakened in the absence of Ca2+, the major part of the inhibition of the ATPase activity must be due to inhibition of a kinetic step in the ATPase cycle, rather than to an effect on binding.
Fig. 5. Double reciprocal plots of the fraction of HMM bound to actin, in the presence of ATP, as a function of the free actin concentration.
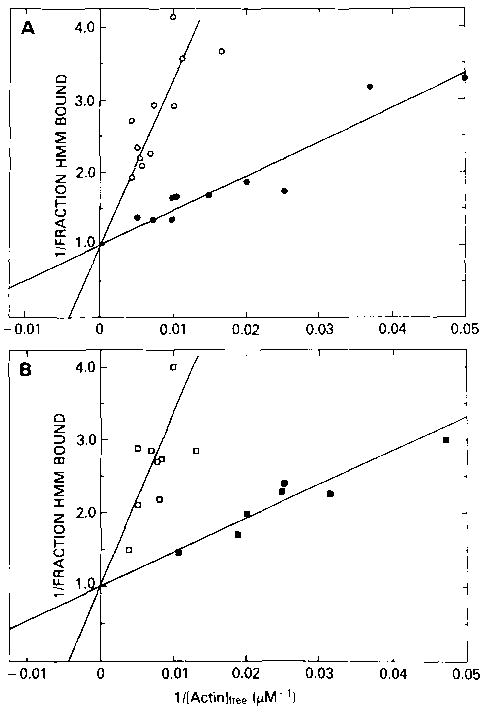
A, Aequipecten HMM; B, Loligo HMM. Binding was measured under the conditions described in the legend to Fig. 3 except that the HMM concentration was 0.03 μm. Binding is shown in both the presence of Ca2+ (• and ▪) and in the absence (○ and □) of Ca2+. The binding constants for Aequipecten HMM are 2.1 × 10⁴ m−1 and 4.1 × 10³ m−1 in the presence and absence of Ca2+, respectively, and for Loligo HMM, are 2.2 × 10⁴ m−1 and 4.4 × 10³ m−1, respectively.
DISCUSSION
The actin activation of scallop myosin ATPase activity is regulated by direct binding of Ca2+ to the myosin molecule. The data presented in this paper suggest that a major part of this Ca2+ regulation involves inhibition of a kinetic step which occurs in the ATPase cycle after the binding of the myosin·ATP complex to actin. The key data supporting this view show that, in the absence of Ca2+ under conditions where more than 50% of the scallop HMM is bound to actin, the ATPase activity is only about 20% of its value in the presence of Ca2+.
The exact amount of inhibition of the kinetic step which occurs in the absence of Ca2+ is difficult to determine because the overall regulation in this system is relatively low; removing Ca2+ only inhibits the ATPase activity about 80%. In contrast, myofibrils or myosin preparations are inhibited by more than 95%. As we pointed out under “Results,” this relatively low Ca2+ sensitivity would occur if a small fraction of the HMM were insensitive to Ca2+. Therefore, the true amount of inhibition of the kinetic step could be greater than the 80% which we observe.
The residual ATPase activity of the Ca2+-insensitive HMM may also obscure the true value of KATPase which occurs in the absence of Ca2+. Our results show that KATPase is not affected by Ca2+ although Kbinding becomes 5-fold weaker in the absence of Ca2+. While it is possible that, in the absence of Ca2+, KATPase is stronger than Kbinding, an alternative explanation is that we are measuring the KATPase value of only a small fraction of Ca2+-insensitive HMM, and the true effect of Ca2+ on KATPase parallels its effect on Kbinding. In this regard, it is of interest to compare the values of Kbinding, KATPase, and Vmax in the molluscan system with the values obtained for these parameters in muscle systems with other regulatory mechanisms. In Table I, values of these parameters obtained with the molluscan S-l and HMM are compared to values of these parameters obtained with the troponin-tropomyosin system of rabbit skeletal muscle and the Ca2+-dependent myosin phosphorylation system of turkey gizzard muscle. In each of the three types of regulatory systems, the removal of Ca2+ has a measurable weakening effect on Kbinding, an effect which ranges from about a factor of 2 for rabbit skeletal muscle S-l to about a factor of 5 for the molluscan proteins.2 Furthermore, in all three systems, Ca2+ affects Vmax more than KATPase The reduction in Vmax is the dominant factor in determining the steady state ATPase rate in the absence of Ca2+. Therefore, it appears to be generally true in a number of systems that regulation of the actomyosin interaction occurs mainly through an effect on a kinetic step in the ATPase cycle (perhaps Pi release) rather than through an effect on the binding of myosin·ATP to actin.
Table I.
Comparison of binding and kinetic constants for invertebrate striated, invertebrate smooth, vertebrate striated, and vertebrate smooth muscle regulatory systems
|
Kbinding |
KATPase |
Vmaxa |
||||
|---|---|---|---|---|---|---|
| Myosin type | Ca2+ | EGTA | Ca2+ | EGTA | Ca2+ | EGTA |
| M−1 | M−1 | s−1 | ||||
| Aequipecten Ca·Mg·S-l | 4.4 × 10⁴ | 4.4 × 10⁴ | 3.7 × 10⁴ | 3.7 × 10⁴ | 15 | 15 |
| Aequipecten HMM | 2.1 × 10⁴ | 4.1 × 10³ | 3.1 × 10⁴ | 2.4 × 10⁴ | 14 | 3 |
| Loligo HMM | 2.2 × 10⁴ | 4.4 × 10³ | 1.4 × 10⁴ | 1.1 × 10⁴ | 35 | 5 |
| Rabbit skeletal S-lb | 2.3 × 10⁴ | 1.3 × 10⁴ | 5 × 10⁴ | 1.7 × 10⁴ | 22 | 0.8 |
| Turkey gizzard HMMc,d | 2.2 × 10⁴ | 5.9 × 10³ | 4 × 10⁴ | 9.5 × 10³ | 0.55 | 0.02 |
This conclusion depends on the assumption that the binding that we are observing between myosin and actin in the presence of ATP is specific. One line of evidence supporting this assumption is the similarity between the values of Kbinding and KATPase;KATPase is certainly a specific parameter. A second line of evidence is the data which show that the binding in the presence of ATP has the same ionic strength dependence as the much tighter binding in the presence of 5′-adenylyl imidodiphosphate (25). We also have data showing that the difference in the KATPase values of the two different light chain-containing species of S-l (26), namely (Al)S-l and (A2)S-1, is correlated with their different values of Kbinding.3 We believe that this is strong evidence that the weak binding observed in the presence of ATP is indeed specific.
In summary, although the regulatory apparatus of molluscan muscle differs from that of vertebrate skeletal and smooth muscle, our data suggest that, here too, a key aspect of the regulatory process is a change in rate of a kinetic step in the ATPase cycle.
Footnotes
A preliminary report of this work was presented at the 27th Annual Biophysical Meeting, San Diego, February 13, 1983 (1).
The abbreviations used are: HMM, heavy meromyosin; S-l, myosin subfragment 1; EGTA, ethylene glycol bis(β-aminoethyl ether)-N,N,N′,N′-tetraacetic acid.
Recent reports by Wagner and Giniger (23) and Wagner and Stone (24) stated that rabbit skeletal muscle HMM shows a much larger Ca2+ effect on binding than we have reported for S-l. Since up to the present time we have been unable to duplicate these results (J. M. Chalovich and E. Eisenberg, unpublished data), we must leave the question of this effect open at this time.
J. M. Chalovich, L. A. Stein, L. E. Greene, and E. Eisenberg, unpublished observation.
References
- 1.Chalovich JM, Chantler PD, Szent-Gyorgyi AG, Eisenberg E. Biophys J. 1983;41:153a. [PMC free article] [PubMed] [Google Scholar]
- 2.Haselgrove JC. Cold Spring Harbor Symp Quant Biol. 1972;37:341–352. [Google Scholar]
- 3.Huxley HE. Cold Spring Harbor Symp Quant Biol. 1972;37:361–376. [Google Scholar]
- 4.Parry DAD, Squire JM. J Mol Biol. 1973;75:33–55. doi: 10.1016/0022-2836(73)90527-5. [DOI] [PubMed] [Google Scholar]
- 5.Chalovich JM, Chock PB, Eisenberg E. J Biol Chem. 1981;256:575–578. [PMC free article] [PubMed] [Google Scholar]
- 6.Chalovich JM, Eisenberg E. J Biol Chem. 1982;257:2432–2437. [PMC free article] [PubMed] [Google Scholar]
- 7.Brenner B, Schoenberg M, Chalovich JM, Greene LE, Eisenberg E. Proc Natl Acad Sci U S A. 1982;79:7288–7291. doi: 10.1073/pnas.79.23.7288. [DOI] [PMC free article] [PubMed] [Google Scholar]
- 8.Schoenberg, M., Brenner, B., Chalovich, J. M., Greene, L. E., and Eisenberg, E. (1984) in Contractile Mechanisms in Muscle (Sugi, H., and Pollack, G. H., ed) Vol. 1, pp. 269–284, Plenum Publishing Corp., New York
- 9.Sellers JR, Eisenberg E, Adelstein RS. J Biol Chem. 1982;257:13880–13883. [PubMed] [Google Scholar]
- 10.Kendrick-Jones J, Lehman W, Szent-Gyorgyi AG. J Mol Biol. 1970;54:313–326. doi: 10.1016/0022-2836(70)90432-8. [DOI] [PubMed] [Google Scholar]
- 11.Chantler PD, Szent-Gyorgyi AG. J Mol Biol. 1980;138:473–492. doi: 10.1016/s0022-2836(80)80013-1. [DOI] [PubMed] [Google Scholar]
- 12.Chantler PD, Szent-Gyorgyi AG. Biochemistry. 1978;17:5440–5448. doi: 10.1021/bi00618a018. [DOI] [PubMed] [Google Scholar]
- 13.Craig R, Szent-Gyorgyi AG, Beese L, Flicker P, Vibert P, Cohen C. J Mol Biol. 1980;140:35–55. doi: 10.1016/0022-2836(80)90355-1. [DOI] [PubMed] [Google Scholar]
- 14.Chantler PD, Sellers JR, Szent-Gyorgyi AG. Biochemistry. 1981;20:210–216. doi: 10.1021/bi00504a035. [DOI] [PubMed] [Google Scholar]
- 15.Stafford WF, Szentkiralyi EM, Szent-Gyorgyi AG. Biochemistry. 1979;18:5273–5280. doi: 10.1021/bi00591a002. [DOI] [PubMed] [Google Scholar]
- 16.Spudich JA, Watt S. J Biol Chem. 1971;246:4866–4871. [PubMed] [Google Scholar]
- 17.Eisenberg E, Kielley WW. J Biol Chem. 1974;249:4742–4748. [PubMed] [Google Scholar]
- 18.Gornall AG, Bardawill CJ, David MM. J Biol Chem. 1949;177:751–766. [PubMed] [Google Scholar]
- 19.Laemmli UK. Nature (Lond) 1970;227:680–685. doi: 10.1038/227680a0. [DOI] [PubMed] [Google Scholar]
- 20.Chock SP, Eisenberg E. J Biol Chem. 1979;254:3229–3235. [PubMed] [Google Scholar]
- 21.Eisenberg E, Moos C. J Biol Chem. 1967;242:2945–2951. [PubMed] [Google Scholar]
- 22.Bevington, P. R. (1969) Data Reduction and Error Analysis for the Physical Sciences, pp. 235–240, McGraw-Hill, New York
- 23.Wagner PD, Giniger E. J Biol Chem. 1981;256:12647–12650. [PubMed] [Google Scholar]
- 24.Wagner PD, Stone DB. Biochemistry. 1982;22:1334–1342. doi: 10.1021/bi00275a003. [DOI] [PubMed] [Google Scholar]
- 25.Greene LE, Sellers JR, Eisenberg E, Adelstein RS. Biochemistry. 1983;22:530–535. doi: 10.1021/bi00272a002. [DOI] [PubMed] [Google Scholar]
- 26.Weeds AG, Taylor RS. Nature (Lond) 1975;257:54–56. doi: 10.1038/257054a0. [DOI] [PubMed] [Google Scholar]