Abstract
Colorectal cancer (CRC) is one of the most common cancers; however, accurately predicting prognosis based on existing molecular subtypes remains challenging. The XELOX regimen, which combines oxaliplatin and capecitabine, is the cornerstone of chemotherapy for CRC treatment. However, there is a notable lack of reliable predictive models for determining the sensitivity of this treatment. This study aimed to establish a novel classification system for CRC and develop a predictive model for XELOX chemotherapeutic sensitivity using serum metabolomics. We recruited 89 patients with CRC and 89 age- and sex-matched healthy controls for untargeted metabolomic studies to identify tumor-specific serum metabolites. The patients were grouped into distinct metabolic subtypes using unsupervised clustering. A serum metabolite combination predictive of the efficacy of XELOX was established using Cox regression analysis in 34 patients with stage III CRC. Using unsupervised clustering based on the serum metabolites, three distinct clusters were identified. Notably, Cluster 3, which was characterized by uniform lipid and amino acid levels, demonstrated the best prognosis. Our analysis revealed that D-glucose 6-phosphate, presqualene diphosphate, and leukotriene B4 levels were negatively correlated with XELOX sensitivity, whereas 15-HETE and N-acetyl-l-methionine levels were positively correlated. Based on these findings, we constructed a predictive model validated in an independent cohort of 34 patients with stage III CRC. In summary, this study identified a novel classification of CRC based on serum metabolites and developed a potential prognostic model for XELOX chemotherapeutic efficacy, which may have direct effects on the treatment and prognosis of CRC.
Supplementary Information
The online version contains supplementary material available at 10.1038/s41598-025-97463-9.
Keywords: Chemotherapeutic sensitivity, Colorectal cancer, Molecular subtypes, Serum metabolomics, XELOX
Subject terms: Gastrointestinal cancer, Predictive markers, Prognostic markers
Introduction
Colorectal Cancer (CRC) is one of the most devastating types of cancer. It ranks third among all cancer types and has the third-highest mortality rate. According to a report by the World Health Organization, more than 1.9 million new cases are diagnosed annually1. Current first-line treatment for late-stage colorectal cancer remains dependent on 5-fluorouracil (5 FU)-based chemotherapy regimens. While immune checkpoint inhibitors (ICIs) such as anti-PD- 1/PD-L1 agents demonstrate remarkable efficacy in microsatellite instability-high (MSI-H) patients, they benefit only a subset (10–15%) of the overall colorectal cancer population2,3. The XELOX regimen (oxaliplatin plus capecitabine) is one of the widely adopted first-line options for advanced colorectal cancer4. However, patients often lose response or develop resistance to chemotherapy, leading to a five-year survival rate of 14.2%5. Therefore, prediction models and new therapeutic targets are urgently needed for precision therapy in patients with CRC. Traditional classification based on histopathology and genomic mutation could not fully predict chemotherapy sensitivity, which should refer to new omics. At present, multi-omics models have showed the potential value on chemotherapy sensitivity prediction based on transcriptome or proteomics6–8.
As colonoscopies are uncomfortable and inconvenient, noninvasive serum-based tests are ideal for lifelong monitoring. Metabolomics is a powerful diagnostic tool for various diseases, including cancers9–11. Metabolites greatly differ between patients with CRC and healthy controls and deeply influence cancer progression. Importantly, changes in serum metabolites reflect the actual status of cancer, including stages12and immune infiltration13 which are important for precision therapy. Wang et al.14 has studied the diagnostic value of the serum metabolome and reported that phenylalanine metabolism strongly influenced FOLFOX-based chemotherapy in colorectal cancer. However, few studies have developed predictive models for sensitivity to XELOX-based chemotherapy.
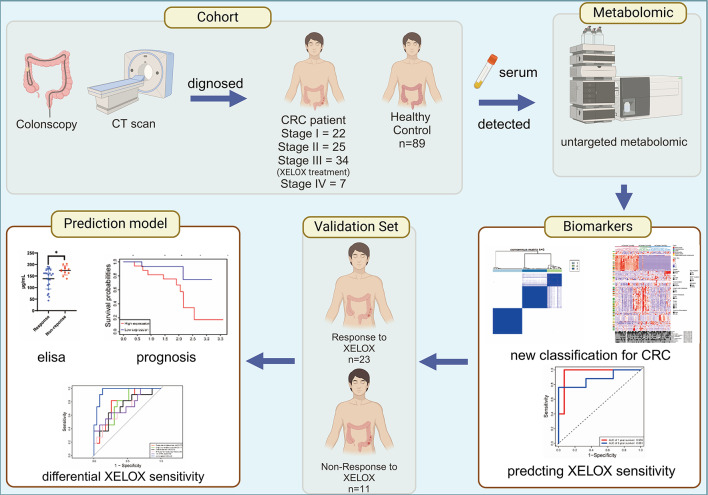
In this study, we recruited 89 patients with CRC and 89 age - and sex-matched healthy controls for serum untargeted metabolomic analysis. We employed a series of multivariate analyses, including principal component analysis (PCA), partial least squares discriminant analysis (PLS-DA), univariate analysis, and pathway analysis, to identify potential serum metabolites associated with colorectal cancer. In addition, unsupervised clustering was used to identify reliable metabolic subtypes and evaluate the prognosis of different metabolic subtypes and their correlation with XELOX treatment sensitivity (Fig. 1). Our analysis revealed that patients with CRC can be grouped into three distinct metabolic subtypes. D-glucose 6-phosphate, presqualene diphosphate, and leukotriene B4 were negatively correlated with XELOX sensitivity, whereas 15-HETE and N-acetyl-L-methionine revealed positive correlations. Based on these findings, we constructed a predictive model that was validated in an independent cohort of 34 patients with stage III CRC.
Fig. 1.
Study design and workflow (Created with Biorender, https://www.biorender.com/). Metabolomics studies were conducted on the serum of 89 healthy controls and 89 CRC patients to identify characteristic tumor metabolites. Unsupervised consensus clustering was used to identify different metabolic subtypes of CRC. Cox proportional hazards regression was used to further analyze the relationship between serum metabolites and XELOX sensitivity in 34 stage III patients receiving XELOX chemotherapy. A predictive model for XELOX sensitivity was developed, and an independent validation cohort was used to validate its effectiveness.
Materials and methods
Sample collection
We selected 89 patients with colorectal cancer confirmed by endoscopy and pathology at Shenzhen Second People’s Hospital. All sample were prospectively collected immediately after the diagnosis of colorectal cancer was confirmed upon the patient’s admission and the patients had not received chemotherapy or any other treatment at the time of serum collection. Age and sex distributions were matched to reduce the influence of age and sex between patients with CRC and healthy controls. Table 1 presents the demographic characteristics and clinicopathological features of the 89 patients with CRC. There were 22 stage I, 25 stage II, 34 stage III, and 7 stage IV cases. Information from one patient was missing because of refusal to undergo further treatment. All the patients with stage III disease (N = 34) received standard XELOX chemotherapy.
Table 1.
Clinical index for patient participated in cohort.
| CRC | Healthy Control | |
|---|---|---|
| N | 89 | 89 |
| Age | 18–75 | 18–75 |
| Gender (Male/Female) | 49/40 | 49/40 |
| Location (Rectal/Colon) | 37/51 | |
| Stage (I/II/III/IV) | 22/25/34/7 | |
| Lymph node metastasis (Yes/No) | 41/47 | |
| Distant metastasis (Yes/No) | 7/81 | |
| Differentiation (Low/High) | 75/13 | |
| KRAS mutation (Yes/No) | 38/50 | |
| BRAF mutation (Yes/No) | 6/82 | |
| Microsatellites stability (MSI/MSS) | 20/68 |
Sample Preparation and LC-MS/MS analysis
100 µL serum was mixed with 300 µL extraction solution (methanol and acetonitrile in a 2:1 ratio by volume) and kept at − 20 °C for 2 h. The mixture then was dried using a freeze vacuum concentrator. 150 µL of a 1:1 (v/v) methanol-water solution was used to reconstituted the dry powder. Waters 2D UPLC system (Waters, USA) linked to a Q Exactive HF high-resolution mass spectrometer (Thermo Fisher Scientific, USA) were used. The system employed an electrospray ionization (ESI) interface in both positive (ESI+) and negative (ESI−) modes. A 1.7-µm BEH C18 column (1.7 μm, 2.1 × 100 mm, Waters, USA) was used for chromatographic separation.
Metabolite profiling analysis
The LC-MS/MS-generated raw data was processed using compound discoverer 3.1 (Thermo Fisher Scientific, USA). The analysis yielded information on molecular weights, retention times, peak areas, and compound identification results. Principal Component Analysis (PCA) was employed to detect outliers and separation patterns. For find out the maximum differences between cases and controls, Partial Least Squares Discriminant Analysis (PLS-DA) was utilized. Differential variables were chosen and validated using the false detection rate (FDR)-corrected Mann-Whitney U test. Metabolites were considered statistically significant if they met the criteria of VIP > 1.5 and P< 0.05 in both multivariate and univariate analyses. Metabolite identification relied on multiple databases, including mzcloud and chemspider (HMDB, KEGG, and lipid maps). Enrichment for metabolic pathway were recognized significant when their P value < 0.05 based on the KEGG database15–17.
Metabolite clustering and clinical relevance analysis of metabolite subtypes
To identify subtypes of colorectal cancer (CRC) tumor tissue samples, consensus clustering (utilizing cCluster, hierarchical clustering, Pearson distance, and complete linkage with 1,000 resampling iterations) and unsupervised hierarchical clustering were employed. Unsupervised consensus clustering was utilized on serum metabolomics data across k = 2 to k = 6 using the R package ConsensusClusterPlus with 1,000 resampling iterations. The clustering k-value refers to the predefined number of groups (clusters) into which data points are partitioned during unsupervised machine learning analysis. For each K, the algorithm generates a consensus matrix (range: 0–1), where each element represents the frequency of two patients being assigned to the same cluster across resamples. A value closer to 1 indicates stable co-clustering. Additionally, corresponding CDF curve was also utilized. The CDF curve quantifies the distribution of consensus indices. A flattening slope in the CDF curve indicates stable clustering, as further increases in k do not substantially improve consensus. Progression-free survival analysis and Kaplan–Meier survival plots were generated using the R packages “survival” and “survminer” to assess the relationship between metabolites subtype and recurrence free survival. Statistical significance was determined using a log-rank test, with P < 0.05 considered significant.
Establishment of prognostic signature of XELOX chemotherapy
Out of 89 CRC patients, 34 with stage III disease underwent XELOX chemotherapy. A univariate Cox analysis was conducted on these 34 individuals to examine the relationship between serum differential metabolite expression and recurrence-free survival (RFS). Optimal metabolites were selected through LASSO regression algorithm. Multivariate Cox proportional hazards regression analysis determined independent prognostic metabolites for RFS, and patient risk scores were calculated using maximum likelihood methods (implemented in R v4.1.2, survival package) and classified as high- or low risk group by median risk score. A heatmap was created to illustrate key metabolite expression, while Kaplan-Meier analysis evaluated prognostic differences between the risk groups. The 1- and 3-year recurrence free survival probabilities were predicted using the risk score, and prognostic performance was assessed via ROC curve analysis.
Validation of the prognostic signature in an independent validation cohort
To assess the model’s predictive capability, a validation cohort consisting of 34 patients with stage III colon cancer undergoing chemotherapy was utilized. The concentration of key metabolites in serum was measured using ELISA. Based on the levels of these crucial metabolites, risk scores were calculated for each patient, and subsequently categorized into high- and low-risk groups. Time-dependent ROC curves were employed to evaluate the prognostic accuracy of the validation cohort.
Statistical analysis
Enrichment analysis and identification of differential metabolites for serum metabolomics were performed using the BGI Omics Explorer Platform. Statistical analyses for ELISA were performed using GraphPad Prism V9.0. The two groups were compared using the Student’s t test. The results were considered statistically significant at P < 0.05.
Results
Metabolite profiling of plasma between patients with CRC and healthy controls
All 178 serum samples were subjected to liquid chromatography-mass spectrometry. The base peak chromatogram, coefficient of variation, and PCA of the quality control revealed that the experiment was stable during data collection and repeatable (Supplementary Figure S1). Mass spectrometry identified 4,262 and 1,457 variables for positive and negative electrospray ionization, respectively (ESI+/ESI−). LC/MS identified 5719 compounds in ESI+/ESI − mode, and 2647 were matched to the database. Metabolites mostly consist of compounds with biological roles, lipids, and phytochemicals. KEGG enrichment analysis revealed the metabolites involved in cell death and growth, membrane transport, and cell signaling transduction (Supplementary Figure S2).
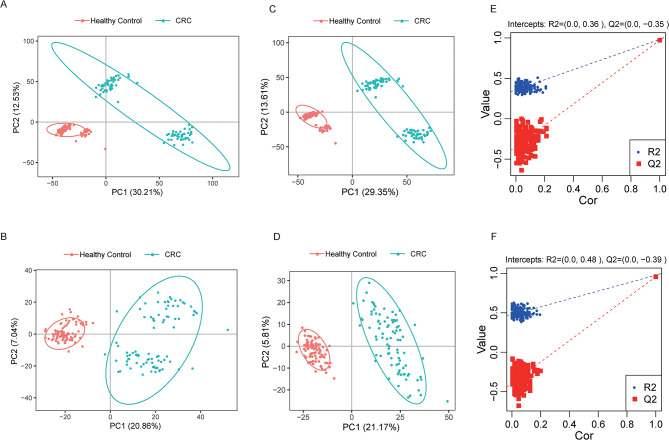
Multivariate analysis was used to determine whether the metabolites identified in our study could discriminate between healthy controls and patients with CRC. Principal component analysis revealed the separation of CRC patients and healthy controls into two clusters in both positive and negative modes (Fig. 2A, B). However, owing to the complications of metabolites, PCA alone, which is an unsupervised method, may not discriminate between the two groups. Thus, a half-supervised method, Partial Least Squares Discrimination Analysis (PLS-DA), was subsequently used, which showed a clear separation between healthy controls and patients with CRC (Fig. 2C, D). Original combined models were tested through 200 permutation tests, which proved that they were valid and not overfitted (P < 0.001; Q2=− 0.35[ESI+]; 0.39[ESI-], Fig. 2E, F).
Fig. 2.
Multivariate analysis of the serum metabolome between patients with CRC and healthy controls. (A, B) PCA between patients with CRC and healthy controls in positive or negative ion mode. (C, D) PLS-DA analysis of patients with CRC and healthy controls in the positive or negative ion mode. (E, F) Permutation test for PLS-DA.
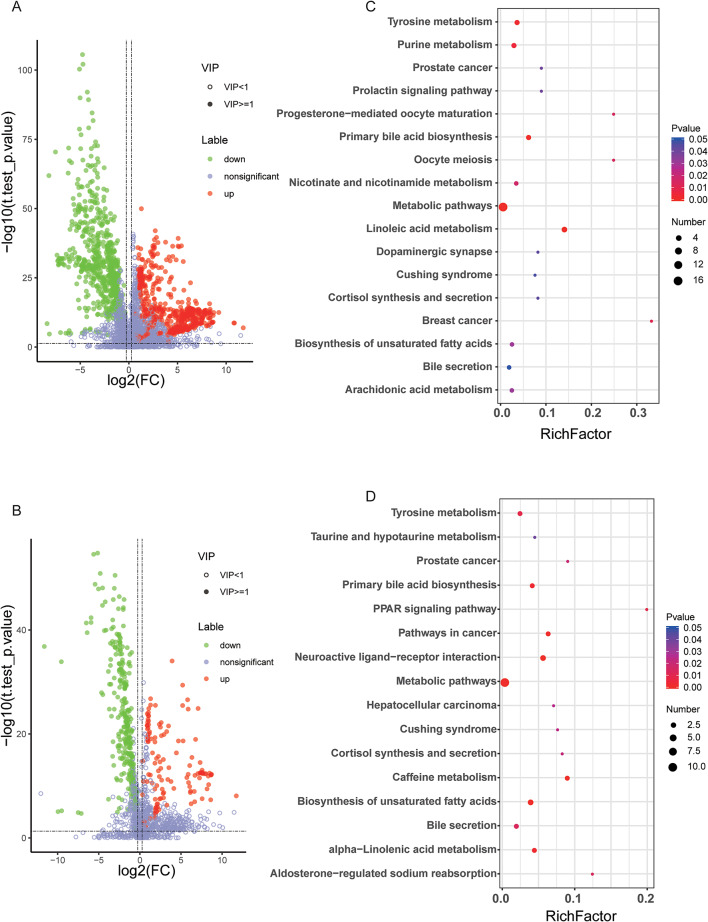
A total of 230 metabolites (73 upregulated and 157 downregulated, CRC vs. HC) were identified with the criteria of VIP score > 1.5, and P-values < 0.05, in the false detection rate (FDR)-corrected Mann–Whitney U tests, which displayed differential abundance between the sera of patients with CRC and healthy controls (Fig. 3A, B; Supplementary Table S2). As 230 differential metabolites were identified, the next step was the discovery of their roles. Based on the KEGG database, the roles of differential metabolites were enriched. As depicted in Fig. 3C and D, pathways were enriched in tyrosine metabolism, taurine and taurine metabolism, the PPAR signaling pathway, biosynthesis and metabolism of bile acids and unsaturated fatty acids, and purine metabolism, which have been reported to be highly related to CRC.
Fig. 3.
Differential metabolites between healthy controls and patients with CRC. (A, B) Volcano plots of differential metabolites (CRC vs. healthy controls) in the positive and negative modes, respectively. (C, D) KEGG analysis of differential metabolites in the positive and negative modes, respectively.
Unsupervised clustering revealed a novel classification system for CRC based on serum metabolites
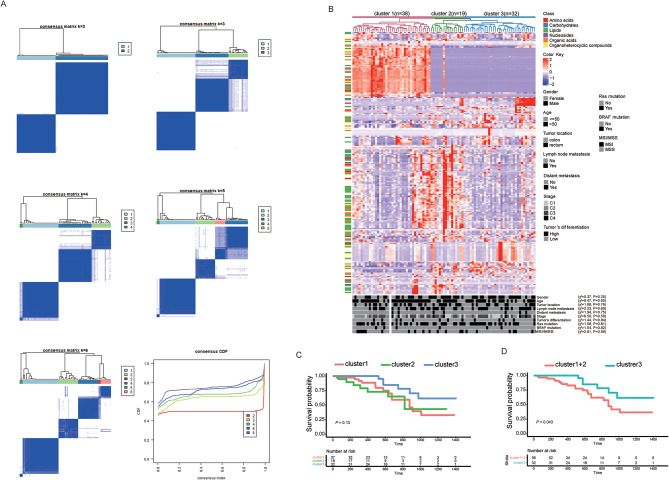
Unsupervised clustering was used to cluster the patients with similar metabolic characteristics. First, we determine the optimal clustering k value (number of groups). Figure 4A depicts the consensus clustering matrix of the 89 colorectal cancer samples from k = 2 to k = 6 and the cumulative distribution function (CDF). As the k value increases from 2 to 6, there is a minimal increase in the CDF after k = 3, suggesting that the optimal k value is 3. In particular, the CRC subtypes defined by the clusters were clearly observed through unsupervised hierarchical clustering (Fig. 4B). Three clusters and clinicopathological characteristics were showed no significant relationship for Chi-square testes yielding a rough approximation. This result uncovered distinct CRC subtypes with unique serum metabolite profiles that were independent of known clinicopathological features. The first cluster, distinguished by high amino acid levels, comprised the largest proportion (66.7%) of early-stage (I and II) patients. The second cluster, marked by the highest lipid concentrations, included 62.5% of early-stage tumors. The third cluster contained the greatest percentage (51.9%) of late-stage (III and IV) tumors and exhibited moderate levels of all metabolites.
Fig. 4.
Classification of patients with CRC through the serum metabolome using unsupervised clustering. (A) Unsupervised clustering methods for classification, where k means varied from 2 to 6. (B) Heat map of signature metabolites among the three subclusters. (C, D) Recurrence-free survival curves for 88 patients classified using unsupervised clustering.
As clusters were identified, we sought to determine the relationship between the clusters and patient prognosis. One patient who was lost to follow-up was excluded from further analyses. Although RFS revealed no significance under the condition of the three clusters, which was due to the relatively small number of events in Cluster2 during follow-up, Cluster 3 retained a better prognosis than the combination of Clusters 1 and 2 (Fig. 4C, D).
Construction and validation of the predictive model for XELOX sensitivity using serum metabolomics
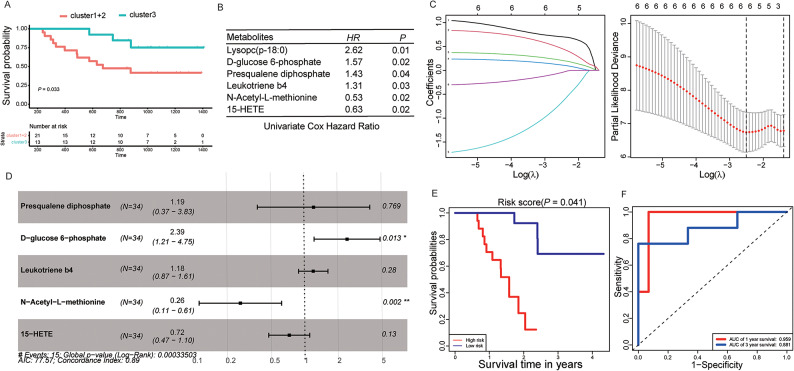
Among 89 patients with CRC, 34 with stage III CRC received XELOX chemotherapy. On classifying these 34 stage III patients according to the above three clusters and comparing their prognoses, the results were consistent with the above results and revealed that Cluster 3 retained a better prognosis than the combination of Clusters 1 and 2 (Fig. 5A). We attempted to identify serum metabolites that affect the efficacy of XELOX chemotherapy. A total of 230 metabolites (different between patients with CRC and normal individuals) were included in the univariate Cox hazard regression analysis, and six metabolites (Lysopc [p- 18:0], D-glucose 6-phosphate, presqualene diphosphate, leukotriene b4, 15-HETE, and N-acetyl-L-methionine) were significantly related to the chemotherapeutic efficacy of XELOX (Fig. 5B). Before differential metabolites were included in the multivariate Cox hazard regression analysis, Lasso Regression was used to remove redundant parameters, and Lysopc (p- 18:0) was excluded (Fig. 5C). Multivariate Cox hazard regression analysis suggested that the prognostic model for XELOX chemotherapeutic efficacy utilizing D-glucose 6-phosphate, presqualene diphosphate, leukotriene B4, 15-HETE, and N-acetyl-L-methionine was significantly correlated with XELOX chemotherapeutic efficacy (Log-Rank P = 0.00033, Fig. 5D). Based on the levels of the five serum metabolites mentioned above, 34 patients with stage III CRC were divided into high- and low-risk groups. The results revealed that the prognosis of the low-risk group was significantly better than that of the high-risk group (Fig. 5E). Moreover, the ROC curve showed excellent prediction (AUC: 0.959 for 1 year and 0.881 for 3 years; Fig. 5F).
Fig. 5.
Identification of differential metabolites related to XELOX sensitivity. (A) RFS curves for stage III patients receiving the XELOX regimen. (B) Univariate Cox Hazard regression for metabolites associated with sensitivity to the XELOX regimen. (C) LASSO regression of simplified metabolites. (D) Multivariate Cox proportional hazards regression analysis. (E) RFS curve for the risk score based on the five metabolites. (F) ROC curve for the combination of metabolites in the prediction of XELOX sensitivity based on LC-MS at 1 and 3 years.
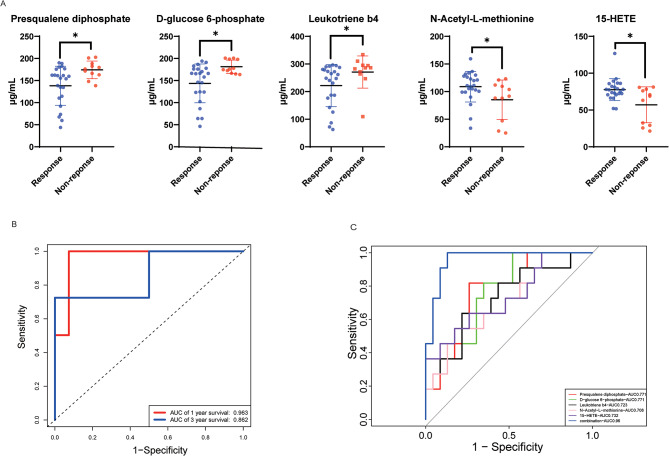
To evaluate the effectiveness of the prediction model, we validated it using an independent cohort of 34 patients with stage III CRC who received XELOX chemotherapy. The clinical characteristic showed no significant between training set and validation set (Table 2). The levels of metabolites in the sera of patients with CRC were determined using ELISA. The serum of patients with recurrence after chemotherapy contained more D-glucose 6-phosphate, presqualene diphosphate, and leukotriene B4 and less 15-HETE and N-acetyl-L-methionine, which was consistent with the results of untargeted metabolomics (Fig. 6A). The ROC curve revealed excellent prediction (AUC: 0.963 for 1 year and 0.862 for 3 years, Fig. 6B). In addition, we observed that the levels of the five metabolites could significantly distinguish patients with recurrent from non-recurrent disease, and the ROC curve showed that the multivariable combination was better than the univariate combination in the validation set (Fig. 6C). These results suggest that our prediction model, which was constructed using serum metabolites, could effectively predict the efficacy of XELOX chemotherapy.
Table 2.
Clinical index for cohort and validation set.
| Cohort | Validation | ||
|---|---|---|---|
| N | 34 | 34 | P > 0.05 |
| Age(> 50/< 50) | 7/27 | 8/26 | P > 0.05 |
| Gender (Male/Female) | 17/17 | 18/16 | P > 0.05 |
| KRAS mutation (Yes/No) | 14/20 | 17/17 | P > 0.05 |
| BRAF mutation (Yes/No) | 4/30 | 3/31 | P > 0.05 |
| Microsatellites stability (MSI/MSS) | 5/29 | 6/28 | P > 0.05 |
Fig. 6.
Prediction model for XELOX sensitivity based on actual metabolite content. (A) ELISA tests for single metabolites between patients who responded or did not respond to the XELOX regimen. (B) ROC curve for the prediction of XELOX sensitivity based on serum metabolites at 1 and 3 years. (C) ROC curve for distinguishing patient responses to XELOX sensitivity based on serum metabolites.
Discussion
CRC is the most common type of cancer worldwide. Owing to recent therapeutic strategies, 5-FU-based chemotherapy such as XELOX or FOLFOX remains the most important regimen. However, such chemotherapy regimens are not suitable for all patients because of loss of response. Therefore, it is important to develop a predictive model for the sensitivity to chemotherapy. The main findings of this study are as follows: (i) New subtypes of CRC were constructed based on metabolites through unsupervised consistent clustering. (ii)We presented a chemotherapy sensitivity prediction model based on serum metabolites.
The XELOX regimen is a treatment option for patients with advanced CRC. Compared to the FOLFOX regimen, a similar effect was observed, with shorter in-hospital stays that were welcomed by patients and oncologists18,19. Despite the ideal effect of XELOX, patients gained drug resistance during therapy20. Hence, a prediction model is urgently needed during different stages of treatment to guide precision therapy. However, few studies have focused on these predictive models. Peng et al.21 observed KRAS, APC, and TP53 mutations were correlated with XELOX sensitivity. However, as harvesting tumor tissue is inconvenient, it is not suitable for long-term monitoring. Therefore, serum testing is considered to be a better method. In this study, we classified CRC through a serum untargeted metabolome and identified several potential biomarkers to estimate sensitivity to XELOX through a non-targeted metabolome.
Previously, glucose metabolism was considered the most important factor in cancer metabolism22. Our research revealed D-glucose 6-phosphate, an important intermediate metabolite of glucose metabolism, predicted XELOX insensitivity. However, as the metabolome develops, reprogramming of lipid and amino acid metabolism has gained attention. These metabolic pathways are related to cellular energy, homeostasis, membrane production, and intracellular signaling23. Moreover, lipid metabolites and amino acids have emerged as potential cancer biomarkers. The concept of “Cancer Hallmark” was introduced in the year 200024and renewed in 201125and 202226, and involves both lipid and amino acid metabolism.
Growing evidence has shown that enhanced lipid metabolism occurs at every stage of colorectal, which provides energy and activates signals that assist in cancer progression27,28. At the same time, differential metabolites from lipidomics have now been used as diagnostic and prognostic biomarkers. Harewood et al.29conclude that low serum SM (OH) C22:0 and PC ae C34:3 levels indicate a low risk of colorectal cancer. Moreover, plasma TG implied a poor prognosis of colorectal cancer30. Our research revealed that patients from cluster 1 who have higher lipid metabolites in serum have a worse prognosis than patients from cluster 3, which was similar to the previous study. Moreover, we found that presqualene diphosphate level was an independent risk factor for XELOX sensitivity. Presqualene diphosphate is an intermediate in cholesterol biosynthesis and has rarely been reported in colorectal cancer. The increase in intermediates indicate obstacles to de novo biosynthesis of cholesterol. De novo biosynthesis of cholesterol enhances the cytotoxic ability of effector T cells through cholesterol rearrangement to the cell membrane31whereas exogenous cholesterol is stored as lipid droplets and hinders the cytotoxic ability32,33. Therefore, we speculated that increased presqualene diphosphate is attributed to the obstruction of CTL de novo biosynthesis. However, their specific biological roles remain to be elucidated. We also found that arachidonic acid metabolism was involved in XEXLOX sensitivity. Although 15-HETE and LTB4 are involved in arachidonic acid metabolism, their effects on colorectal cancer remain controversial. In our study, 15-HETE predicted the sensitivity to the XELOX regimen, whereas LTB4 did not. 15-HETE is an endogenous polyunsaturated fatty acid that is generally converted from phospholipids by ALOX15. Interestingly, 15-HETE has a strong effect on inducing ferroptosis34, and consistent with previous reports, is declining in patients with colorectal cancer35. Therefore, we speculate that 15-HETE promotes ferroptosis of tumor cells, thereby inducing an enhanced immune response in tumor lesions and promoting tumor reduction in chemotherapy-sensitive patients. LTB4 is a potent inflammatory substance mainly secreted by granulocytes such as neutrophils36. It is quite interesting that LTB4 is the down-stream production of 15-HETE, which indicates that intermedia genes (including LTAH, 15-LOX, etc.) may change cytotoxic endogenous PUFAs into harmless metabolites, such as LTB4. Indeed, LTB4R, which is highly expressed on the surface of colon cancer cells, can significantly promote the proliferation of cancer cells and inhibit apoptosis37. The result of our research indicated that the impairment of arachidonic acid metabolism might promote colorectal cancer chemotherapy sensitivity and could be a possible treatment target. In conclusion, abnormally elevated lipid metabolism predicts poor prognosis, and presqualene diphosphate, LTB4, and 15-HETE can be used as independent biomarkers for chemotherapy sensitivity in patients with colorectal cancer.
In addition to lipid metabolites, certain amino acids have been found to correlate with sensitivity to chemotherapy. The change in the amino acid metabolism mode is also closely related to the progression of tumors38. In this study, a positive correlation was found between sensitivity to N-Acetyl-L-methionine and chemotherapy. N-Acetyl-L-methionine is an endogenous metabolite of human metabolism, and its nutritional and metabolic roles are similar to those of L-methionine. Methionine is a biologically active substance widely present in living organisms. It is metabolized in the body to methionine and acetyl-CoA and is involved in biological processes such as protein synthesis, methylation reactions, and sulfur metabolism. At present, there are few studies on N-acetyl-l-methionine, mainly mentioning its antioxidant stress39, and its role in tumors has not been explored. Based on the existing functions, we speculated that N-acetyl-l-methionine might enhance its antitumor effect by providing nutrient components to immune killer cells in vivo.
While this study establishes a novel serum metabolomics-based classification system for colorectal cancer and demonstrates predictive models for XELOX therapeutic response, methodological constraint warrant consideration. The moderate sample size in both discovery and validation cohorts represents a primary limitation, suggesting the necessity to expand validation cohorts in subsequent investigations to enhance the model’s sensitivity and specificity. These limitations primarily stem from the exploratory nature of metabolomic profiling in CRC subtyping, highlighting the imperative for multicenter validation studies with extended sample sizes.
In conclusion, we used an untargeted serum metabolome to identify key metabolites affecting the therapeutic effects of XELOX. Our research showed that patients with average levels of amino acids and lipid metabolites (Cluster 3) had a better prognosis. Moreover, we developed a potential prognostic model for XELOX chemotherapeutic efficacy using D-glucose 6-phosphate, presqualene diphosphate, leukotriene B4, 15-HETE, and N-acetyl-L-methionine, which may have direct effects on CRC treatment and prognosis.
Electronic supplementary material
Below is the link to the electronic supplementary material.
Acknowledgements
This work was supported by Shenzhen Science and Technology Innovation Commission (No.2021293 and No.202231).
Abbreviations
- CRC
Colorectal Cancer
- 5-FU
5- Fluorouracil
- PLS-DA
partial least squares discriminant analysis
- PCA
principal component analysis
- RFS
recurrence-free survival
- FDR
false detection rate
- CDF
cumulative distribution function
Author contributions
Yijie Zhang: Data curation; formal analysis; writing – original draft. Lizhen Ye: Data curation; formal analysis. Ying Qin: Data curation. Cheng Qiu: Data curation. Qingsheng Sun: Data curation; writing – review and editing. Tingting Fan: Data curation; writing – review and editing. Yan Chen: Funding acquisition; project administration; supervision; writing – review and editing. Yuyang Jiang: Funding acquisition; project administration; supervision; writing – review and editing.
Data availability
The data generated during the current study are available from the corresponding author on reasonable request.
Declarations
Competing interests
The authors declare no competing interests.
Ethics statement
Approval of the research protocol by an Institutional Reviewer Board: This study was approved by the Bioethics Committee of Tsinghua Shenzhen International Graduate School. All procedures involving human participants were conducted in strict accordance with the ethical standards of Declaration of Helsinki and complied with the institutional research guidelines. Written informed consent was obtained from all individual participants prior to serum sample collection.
Footnotes
Publisher’s note
Springer Nature remains neutral with regard to jurisdictional claims in published maps and institutional affiliations.
Yijie Zhang and Lizhen Ye contributed equally.
References
- 1.Murphy, C. C. & Zaki, T. A. Changing epidemiology of colorectal cancer - birth cohort effects and emerging risk factors. Nat. Rev. Gastroenterol. Hepatol.21, 25–34. 10.1038/s41575-023-00841-9 (2024). [DOI] [PubMed] [Google Scholar]
- 2.Le, D. T. et al. PD-1 Blockade in tumors with Mismatch-Repair deficiency. N Engl. J. Med.372, 2509–2520. 10.1056/NEJMoa1500596 (2015). [DOI] [PMC free article] [PubMed] [Google Scholar]
- 3.Battaglin, F., Naseem, M., Lenz, H. J. & Salem, M. E. Microsatellite instability in colorectal cancer: overview of its clinical significance and novel perspectives. Clin. Adv. Hematol. Oncol.16, 735–745 (2018). [PMC free article] [PubMed] [Google Scholar]
- 4.Wang, F. et al. The Chinese society of clinical oncology (CSCO): clinical guidelines for the diagnosis and treatment of colorectal cancer, 2024 update. Cancer Commun. (Lond). 10.1002/cac2.12639 (2024). [DOI] [PMC free article] [PubMed] [Google Scholar]
- 5.Epperla, N., Weissman, D. E. & Chemotherapy Response and survival data #99. J. Palliat. Med.19, 1011. 10.1089/jpm.2016.0221 (2016). [DOI] [PubMed] [Google Scholar]
- 6.Tong, M. et al. Multi-omics landscapes of colorectal cancer subtypes discriminated by an individualized prognostic signature for 5-fluorouracil-based chemotherapy. Oncogenesis5, e242. 10.1038/oncsis.2016.51 (2016). [DOI] [PMC free article] [PubMed] [Google Scholar]
- 7.Li, D. et al. Molecular subtypes identified by multiomics analysis based on cuproptosis-related genes precisely predict response to immunotherapy and chemotherapy in colorectal cancer. Mol. Carcinog.62, 1755–1769. 10.1002/mc.23613 (2023). [DOI] [PubMed] [Google Scholar]
- 8.Papaccio, F. et al. Proteotranscriptomic analysis of advanced colorectal cancer patient derived organoids for drug sensitivity prediction. J. Exp. Clin. Cancer Res.42, 8. 10.1186/s13046-022-02591-z (2023). [DOI] [PMC free article] [PubMed] [Google Scholar]
- 9.Wang, M. et al. Discovery of plasma biomarkers for colorectal cancer diagnosis via untargeted and targeted quantitative metabolomics. Clin. Transl Med.12, e805. 10.1002/ctm2.805 (2022). [DOI] [PMC free article] [PubMed] [Google Scholar]
- 10.Chen, D. Q. et al. Identification of serum metabolites associating with chronic kidney disease progression and anti-fibrotic effect of 5-methoxytryptophan. Nat. Commun.10, 1476. 10.1038/s41467-019-09329-0 (2019). [DOI] [PMC free article] [PubMed] [Google Scholar]
- 11.Huang, L. et al. Machine learning of serum metabolic patterns encodes early-stage lung adenocarcinoma. Nat. Commun.11, 3556. 10.1038/s41467-020-17347-6 (2020). [DOI] [PMC free article] [PubMed] [Google Scholar]
- 12.Yang, Y. et al. Profiling the metabolic disorder and detection of colorectal cancer based on targeted amino acids metabolomics. J. Transl Med.21, 824. 10.1186/s12967-023-04604-7 (2023). [DOI] [PMC free article] [PubMed] [Google Scholar]
- 13.Du, Z. et al. Hydroxyphenylpyruvate dioxygenase is a metabolic immune checkpoint for UTX-deficient colorectal cancer. Gastroenterology164, 1165–1179. 10.1053/j.gastro.2023.02.010 (2023). e1113. [DOI] [PubMed] [Google Scholar]
- 14.Wang, H. et al. Serum metabolic traits reveal therapeutic toxicities and responses of neoadjuvant chemoradiotherapy in patients with rectal cancer. Nat. Commun.13, 7802. 10.1038/s41467-022-35511-y (2022). [DOI] [PMC free article] [PubMed] [Google Scholar]
- 15.Kanehisa, M., Furumichi, M., Sato, Y., Matsuura, Y. & Ishiguro-Watanabe, M. KEGG: biological systems database as a model of the real world. Nucleic Acids Res.53, D672–D677. 10.1093/nar/gkae909 (2025). [DOI] [PMC free article] [PubMed] [Google Scholar]
- 16.Kanehisa, M. Toward Understanding the origin and evolution of cellular organisms. Protein Sci.28, 1947–1951. 10.1002/pro.3715 (2019). [DOI] [PMC free article] [PubMed] [Google Scholar]
- 17.Kanehisa, M. & Goto, S. KEGG: Kyoto encyclopedia of genes and genomes. Nucleic Acids Res.28, 27–30. 10.1093/nar/28.1.27 (2000). [DOI] [PMC free article] [PubMed] [Google Scholar]
- 18.Cassidy, J. et al. XELOX (capecitabine plus oxaliplatin): active first-line therapy for patients with metastatic colorectal cancer. J. Clin. Oncol.22, 2084–2091. 10.1200/JCO.2004.11.069 (2004). [DOI] [PubMed] [Google Scholar]
- 19.Gruenberger, B. et al. Importance of response to neoadjuvant chemotherapy in potentially curable colorectal cancer liver metastases. BMC Cancer. 8, 120. 10.1186/1471-2407-8-120 (2008). [DOI] [PMC free article] [PubMed] [Google Scholar]
- 20.Mizushima, T. et al. Postoperative XELOX therapy for patients with curatively resected high-risk stage II and stage III rectal cancer without preoperative chemoradiation: a prospective, multicenter, open-label, single-arm phase II study. BMC Cancer. 19, 929. 10.1186/s12885-019-6122-2 (2019). [DOI] [PMC free article] [PubMed] [Google Scholar]
- 21.Peng, X. et al. Impact of a haplotype (composed of the APC, KRAS, and TP53 genes) on colorectal adenocarcinoma differentiation and patient prognosis. Cancer Genet.268–269, 115–123. 10.1016/j.cancergen.2022.10.002 (2022). [DOI] [PubMed] [Google Scholar]
- 22.Jones, J. C. & Bodenstine, T. M. Connexins and glucose metabolism in cancer. Int. J. Mol. Sci.2310.3390/ijms231710172 (2022). [DOI] [PMC free article] [PubMed]
- 23.Li, Z. & Zhang, H. Reprogramming of glucose, fatty acid and amino acid metabolism for cancer progression. Cell. Mol. Life Sci.73, 377–392. 10.1007/s00018-015-2070-4 (2016). [DOI] [PMC free article] [PubMed] [Google Scholar]
- 24.Hanahan, D. & Weinberg, R. A. The hallmarks of cancer. Cell100, 57–70. 10.1016/s0092-8674(00)81683-9 (2000). [DOI] [PubMed] [Google Scholar]
- 25.Hanahan, D. & Weinberg, R. A. Hallmarks of cancer: the next generation. Cell144, 646–674. 10.1016/j.cell.2011.02.013 (2011). [DOI] [PubMed] [Google Scholar]
- 26.Hanahan, D. Hallmarks of cancer: new dimensions. Cancer Discov. 12, 31–46. 10.1158/2159-8290.CD-21-1059 (2022). [DOI] [PubMed] [Google Scholar]
- 27.Ocvirk, S. & O’Keefe, S. J. D. Dietary fat, bile acid metabolism and colorectal cancer. Semin Cancer Biol.73, 347–355. 10.1016/j.semcancer.2020.10.003 (2021). [DOI] [PubMed] [Google Scholar]
- 28.Pakiet, A., Kobiela, J., Stepnowski, P., Sledzinski, T. & Mika, A. Changes in lipids composition and metabolism in colorectal cancer: a review. Lipids Health Dis.18, 29. 10.1186/s12944-019-0977-8 (2019). [DOI] [PMC free article] [PubMed] [Google Scholar]
- 29.Harewood, R. et al. Association between pre-diagnostic circulating lipid metabolites and colorectal cancer risk: a nested case-control study in the European Prospective Investigation into Cancer and Nutrition (EPIC). EBioMedicine 101, 105024 (2024). 10.1016/j.ebiom.2024.105024 [DOI] [PMC free article] [PubMed]
- 30.Ecker, J. et al. The colorectal cancer lipidome: identification of a robust Tumor-Specific lipid species signature. Gastroenterology161, 910–923. 10.1053/j.gastro.2021.05.009 (2021). e919. [DOI] [PubMed] [Google Scholar]
- 31.Yan, C. et al. Exhaustion-associated cholesterol deficiency dampens the cytotoxic arm of antitumor immunity. Cancer Cell 41, 1276–1293 e1211 (2023). 10.1016/j.ccell.2023.04.016 [DOI] [PubMed]
- 32.Lim, S. A., Su, W., Chapman, N. M. & Chi, H. Lipid metabolism in T cell signaling and function. Nat. Chem. Biol.18, 470–481. 10.1038/s41589-022-01017-3 (2022). [DOI] [PMC free article] [PubMed] [Google Scholar]
- 33.Ma, X. et al. Cholesterol Induces CD8(+) T Cell Exhaustion in the Tumor Microenvironment. Cell Metab 30, 143–156 e145 (2019). 10.1016/j.cmet.2019.04.002 [DOI] [PMC free article] [PubMed]
- 34.Yuan, H. et al. 15-Lipoxygenases and its metabolites 15(S)-HETE and 13(S)-HODE in the development of non-small cell lung cancer. Thorax65, 321–326. 10.1136/thx.2009.122747 (2010). [DOI] [PubMed] [Google Scholar]
- 35.de Lemgruber, S. P. Quantitative analysis of tetrahydrofolate metabolites from clostridium autoethanogenum. Metabolomics14, 35. 10.1007/s11306-018-1331-2 (2018). [DOI] [PubMed] [Google Scholar]
- 36.Sorensen, L. S. et al. Effects of perioperative supplementation with omega-3 fatty acids on leukotriene B(4) and leukotriene B(5) production by stimulated neutrophils in patients with colorectal cancer: a randomized, placebo-controlled intervention trial. Nutrients6, 4043–4057. 10.3390/nu6104043 (2014). [DOI] [PMC free article] [PubMed] [Google Scholar]
- 37.Zhao, S. et al. Inhibition of LTA4H by bestatin in human and mouse colorectal cancer. EBioMedicine44, 361–374. 10.1016/j.ebiom.2019.05.008 (2019). [DOI] [PMC free article] [PubMed] [Google Scholar]
- 38.Muthusamy, T. et al. Serine restriction alters sphingolipid diversity to constrain tumour growth. Nature586, 790–795. 10.1038/s41586-020-2609-x (2020). [DOI] [PMC free article] [PubMed] [Google Scholar]
- 39.Russ, M. et al. Investigation of antioxidative effects of a cardioprotective solution in heart tissue. Mol. Cell. Biochem.461, 73–80. 10.1007/s11010-019-03591-y (2019). [DOI] [PMC free article] [PubMed] [Google Scholar]
Associated Data
This section collects any data citations, data availability statements, or supplementary materials included in this article.
Supplementary Materials
Data Availability Statement
The data generated during the current study are available from the corresponding author on reasonable request.


