

Abstract
This study assessed the contribution of genetic and nongenetic factors to biological aging in American Caucasians. The studied sample included 1402 members of 288 pedigrees from the Framingham Heart Study. The original cohort participants received hand radiography in 1967–1969 (mean age, 58.7 years) and their offspring in 1992–1993 (mean age, 51.6 years). An osseographic score was applied to hand radiographs. Standardized residuals between Osseographic Scoring System-predicted age and actual age were used as a measure of biological age (BA). In variance component genetic analysis, sex, cohort, height, body mass index, and, in women, menopausal status and estrogen use, jointly explained approximately 6% of the total variance of BA. Genetic factors explained an additional 57%. Linkage analysis of covariate-adjusted BA suggested the presence of quantitative trait loci on chromosomes 3p, 7q, 11p, 16q, and 21q. In conclusion, the variation in BA measured by radiography was strongly governed by genetic factors in a sample of American adults.
INTERPERSONAL health differences tend to accumulate and increase as a population ages; the health status among elderly individuals therefore commonly shows tremendous variation. Measurement of the variability seen in human aging is thus an important and active area of basic and clinical gerontological research. Biological age estimates the functional status of an individual in reference to his or her chronological age (1). A measure of biological age typically is derived from several biological parameters (called biomarkers of aging) that correlate with both health status and chronological age (2,3). In the absence of an accurate direct measure of biological aging, regression analysis of several biomarkers is traditionally used to obtain measures of functioning relative to an individual’s chronological peers (1,2,4). The difference between chronological and predicted age can be considered an estimate of biological age, and may help identify individuals at risk for age-related disorders (5).
Most of the proposed methods of biological age determination use comprehensive multifactorial measuring systems or batteries of tests, encompassing a large number of biochemical, physical, mental, and functional parameters that vary closely with age (6). Most recently, new biomarkers of aging and new batteries of tests have been proposed, including changes in telomere length (7,8), skin age score (9), as well as high-density oligonucleotide microarrays to determine gene expression profiles (10).
Age-related loss of bone seems to be a generalized process of tissue atrophy also seen elsewhere in the aging body (11,12). The study of age-related changes in bone can serve as a model for human aging and may provide insight into basic biological changes that take place with increasing age. Certain bone measures are strongly correlated with the state of vital health systems and ultimately survival rates (13–15). Moreover, since degenerative changes in bone accumulate over time, they may reflect individual levels of biological resistance to a changing environment. Unlike other non-skeletal markers proposed as biomarkers of aging (such as physiological and blood chemistry measurements), bone characteristics are relatively stable, as they are not prone to circadian or seasonal rhythms.
Measurable degenerative and compensatory changes, which are evident on hand radiographs, have been combined in an Osseographic Scoring System (OSS) (16). The OSS has been shown to correlate highly with chronological age in adults of different ethnic groups (17), which makes it a suitable biomarker of aging. It was suggested that interpopulation differences in OSS values were dependent on genetic distances between the populations (18). Livshits and colleagues (19), studying a Turkmenian sample, found the OSS to be characterized by a polygenic inheritance, with heritability as high as 30%.
Recent advances in molecular genetics and genetic epidemiology have prompted a number of studies to scan the genome to find chromosomal regions harboring susceptibility loci for various age-dependent diseases such as type II diabetes (20,21), Alzheimer’s disease (22), osteoporosis (23,24), and osteoarthritis (25), as well as exceptional longevity (26). Only one report of the genetic contribution to biological age has been published, to our knowledge (5). Here we report a quantitative genetic analysis of biological aging as measured by the OSS in a pedigree sample from a United States adult population. The aims of our study were to assess the contribution of genetic and nongenetic factors to biological age and to identify quantitative trait loci governing its variation.
Methods
Participants
We investigated these research aims using the population-based Framingham Heart Study. The Framingham Study began in 1948 with the primary goal of evaluating risk factors for cardiovascular disease. Participants from the Original Cohort, aged 28–62 years at baseline, have been examined every 2 years since enrollment. In 1971, the Framingham Offspring Cohort, composed of 71% of all the eligible adult offspring of parents from the Original Cohort, was initiated. Individuals in the Offspring Cohort have been examined approximately every 4 years.
In the Original Cohort (consisting of the parents of those participants in the Offspring Cohort), hand radiographs were obtained twice, in 1967–1969 and 1992–1993. For the purpose of this study, the baseline radiograph was used. As part of a study investigating the heritability of osteoarthritis, participants of the Framingham Offspring Cohort who had at least one parent with hand radiographs were radiographed using the same techniques as in 1993–1995 (25,27). Only right hands were assessed in our study. Of a total of 1702 genotyped Framingham participants, 1402 members of the pedigrees (686 from the Original Cohort and 716 from the Offspring Cohort) were radiographed, comprising 288 pedigrees. These pedigrees are mostly nuclear (with small proportion of extended families ranging 11–27 members) and include the following relative pairs: 800 parent–offspring, 34 grandparent–grandchild, 627 sibling, 479 avuncular, and 348 first cousin pairs.
All Framingham study procedures were approved for both cohorts by the appropriate Institutional Review Boards on human research, and all the participants provided written informed consent.
Modified OSS
To score an X-ray, one examiner (D.K.) studied the phalanges of digits II–V. The first finger (thumb) does not directly project in a standard X-ray and was therefore not utilized. In the standard OSS system (16), the presence or absence of a characteristic, but not its severity, was noted; the score is a sum of the characteristics irrespective of their nature (e.g., porotic or arthritic). In this study, both prevalence and severity, as well as location, of the characteristics were recorded. The following 4 groups of age-related characteristics were graded: 1) bone proliferations (spurs), including apiostoses (tufting of distal phalangeal tuberosity), osteophytes, enthesophytes, and subperiosteal outgrowth (expansion) at midshaft; 2) nontraumatic joint deformity, defined as narrowing of joint cavities, ulnar corrosion, and chondrocalcinosis; 3) bone porosity, defined as scalloping of cortex and resorption of trabeculae (development of lacuna); and 4) sclerosis, defined as enostosis and sclerotic nuclei.
Characteristics were graded on a scale from 0–3 (absent, mild, moderate, and severe) for bone spurs and joint deformity, 0–2 (absent, moderate, severe) for bone porosity, and 0–1 (absent, present) for sclerosis. We used the traditional criteria for scoring radiographs and differential diagnoses of radiological conditions involving hands, as described elsewhere (28,29). Radiographic atlases provided semiquantitative assessments of osteophytes and joint deformities in hand bones (30,31). Methods of assessment of porotic traits (32,33) as well as of osteosclerosis (34) were also suggested in the literature. Our rating of sclerosis did not include subchondral sclerosis, as the OSS reading was performed without magnification. To compute a standard OSS (16), values of each component were recoded in terms of definite presence of an X-ray feature, namely, grade 2 and higher for bone spurs and joint deformity, and grade 1 and higher for the rest of the components. The number of features characterized by definite presence was summed over the 12 phalanges to obtain the OSS score.
The intraobserver reliability was satisfactory: weighted κ for the joint deformity score on an ordinal scale, was 0.79, and for osteophytes, it was 0.75, indicating good agreement. The intraclass correlation for the OSS was 0.96 (95% confidence interval [CI] 0.91–0.99) in men and 0.95 (95% CI, 0.90–0.97) in women, and ranged from 0.86 to 0.96 for 4 groups of the OSS components.
Measurement of Microsatellite Markers
A 5–15 mL blood sample was collected from each participating individual for either genomic DNA extraction or lymphocyte culture or both. For all Framingham participants, DNA was obtained from whole blood specimens collected between 1988 and 1989. In the Original Cohort, DNA was extracted by phenol-chloroform extraction and stored at −80°C. In the Offspring Cohort, DNA was extracted from peripheral lymphocytes using a QIAGEN Blood and Cell Culture DNA Maxi kit (Qiagen GmbH, Hilden, Germany).
The National Heart Lung and Blood Institute Mammalian Genotyping Service in Marshfield, Wisconsin genotyped a set of 401 microsatellite markers covering the genome at an average density of 10 centimorgans (cM) and having an average heterozygosity of 0.77 [Screening Set version 8a (35,36)]. Marker order and map positions were obtained from the Marshfield electronic database (http://research.marshfieldclinic.org/genetics/). The genotyping error rate in the Marshfield laboratory is <1%.
Other Measurements
Information on age, sex, weight, height, alcohol consumption, smoking status, physical activity, and, for women, menopausal status and estrogen use, were obtained at the time of bone imaging (or a previous biennial examination in the Original Cohort).
In brief, weight was measured using a standardized balance beam scale. Height (without shoes) was measured to the nearest .25 inch using a stadiometer. Body mass index (BMI) was calculated in kg/m2. Michels and colleagues (37) have suggested that use of BMI and height in a model is sufficient for body size and body composition adjustments. Total alcohol consumption (ounces/week) was calculated based on a published equation using self-report of the intake of beer, wine, and mixed drinks per week (38). Cigarette smoking was assessed at each examination as number of cigarettes/day, and used in this study as current, former, or nonsmoker at time of X-ray. Physical activity was examined using two questionnaires, the Framingham Physical Activity Index (PAI) for the Original Cohort (39) and the Physical Activity Scale for Elderly (PASE) questionnaire (40) for the Offspring Cohort. Both questionnaires produce scores of typical daily activity, based on hours spent doing heavy, moderate, light, or sedentary activity as well as sleeping. Physical activity scores were normalized for each cohort and sex, and the resulting standardized values were used in the analyses. In women, menopausal status was defined according to the presence or absence of periods in the year prior to X-ray. Estrogen replacement therapy use was evaluated as current use, former use, or never used oral estrogen, patch, or cream, at the date of radiography.
Statistical Analysis
Prior to the analyses, the distribution of the OSS was tested to estimate deviation from normality, resulting in log transformation. OSS values were plotted versus age, for each cohort and sex, to assess relationship between the OSS and age. Regression analysis using the SPSS 10 statistical package (SPSS, Inc., Chicago, IL) was performed for each cohort and sex, to predict age as a function of log-transformed OSS (ln_OSS). When the best-fitting solution was found out of linear, quadratic, and cubic models of regression of ln_OSS (using r2 as a criterion of model fit), a measure of biological age was obtained as a residual between actual and predicted by ln_OSS ages: ΔBA = actual age − predicted age. The residuals, ΔBA, were standardized for each cohort and sex for the genetic analyses.
Variance Component Genetic Analysis
The genetic analyses were performed by using the statistical genetic package SOLAR (version 1.7.3; Southwest Foundation for Biomedical Research, San Antonio, TX). First, contribution of potential covariates to ΔBA variance was evaluated. An initial set of potential confounders included cohort, sex, height, BMI, alcohol intake, smoking, physical activity, and, in women, menopausal status and estrogen use. In men, estrogen use and menopausal status were coded as missing. The general model assumed that the ΔBA was determined by a phenotypic mean, a genetic (polygenic) component, several covariates, and a residual representing the environmental effects not included in the model [as suggested by (41,42)]. Hypothesis testing was conducted using the likelihood ratio test, which compares the maximum likelihoods obtained in a more general and in a restricted (nested) model. The likelihood ratio statistic approximately follows a chi-square distribution with the degrees of freedom equal to the number of constrained parameters (42). The statistical significance of a covariate’s impact upon ΔBA was evaluated by testing whether the variation attributable to the specific covariate is significantly greater than zero, in the polygenic model, by fixing covariate effects estimates at their null. Significant covariates were retained in the final model basing on likelihood ratio test results.
Simultaneous with the effect of covariates, additive genetic effects were estimated. Heritability (h2) of ΔBA was defined in the ‘‘narrow sense,’’ as the proportion of the total trait variation attributable to the additive effects of multiple genes.
Finally, a quantitative trait linkage analysis of covariate-adjusted residuals with a set of 401 microsatellite markers was performed. SOLAR assesses whether relatives who are genetically more similar at a particular locus (as a proportion of marker alleles shared identically by descent [IBD] among all relative pairs) also have more similar values of a trait, providing a summary measure of the relative importance of a given locus (or a closely linked marker) for the trait heritability (42). Genotypes are imputed for untyped individuals, conditional on all other marker data and pedigree structure, and the proportion of marker alleles shared IBD among all relative pairs is estimated. Therefore, individuals who are not genotyped but have phenotype data contribute to the linkage results (43). The hypothesis of linkage was evaluated by testing whether the variation attributable to the specific chromosomal marker is significantly greater than zero, using the likelihood ratio test. The log10 of the ratio of the likelihoods of the polygenic and of marker-specific models yields a logarithm of odds (LOD) score (42); for example, a LOD score of 3.0 indicates that there is 103 times more statistical support for the hypothesis of linkage over the null hypothesis.
To estimate type I error rates, 1000 simulated markers were generated by simqtl routine in SOLAR using our pedigree data under the hypothesis of no linkage. IBD status at each marker was computed, and two-point linkage with a trait was performed. In the analyses, only participants who had ΔBA data available were included; all others were given missing values.
The two-point variance component approach has been expanded to multipoint linkage analysis using identical by descent sharing by relative pairs at genotyped loci, with a constrained linear function to impute sharing at arbitrary points along the chromosome, using observed allele frequencies in genotyped individuals (42). In multipoint analysis, a locus with the highest LOD score from the first scan was included in the model, then the analysis for a second locus was repeated in the second run, conditional on the results of previous scan. Multipoint linkage analysis implemented in SOLAR has been shown to be more powerful than the two-point analysis, since the former contains information from adjacent markers, and potentially provides an unbiased estimate of quantitative trait locus location (42) and fewer false-positive observations (44).
No ascertainment correction was made in this analysis because our pedigrees were a community-based sample selected without respect to the individual bone properties or other aging-related traits.
Results
Offspring Cohort participants were 7 years younger on average; however, they had a broader range of ages than in the Original Cohort (Table 1). Not surprisingly, Offspring Cohort members were heavier and taller, and, in addition, they smoked fewer cigarettes and consumed less alcohol than the Original Cohort. Most of the women in the Offspring Cohort and all the Original Cohort women were post-menopausal at the time of X-ray. The OSS was higher in the Original Cohort, and in both cohorts the OSS distribution was skewed to the right.
Table 1.
Characteristics of the Studied Sample by Cohort
| Original Cohort (N = 686)
|
Offspring Cohort (N = 716)
|
|||||
|---|---|---|---|---|---|---|
| Mean | SD | Mean | SD | |||
| Age (y) | 58.7 | 7.2 | 51.6 | 9.3 | ||
| Age range (y) | 48–78 | 26–80 | ||||
| % Women | 55.5 | 51.0 | ||||
| Osseographic score | 9.9 | 6.2 | 5.3 | 5.7 | ||
| Weight (lb) | 156.7 | 27.5 | 173.1 | 38.0 | ||
| Height (in) | 64.5 | 3.7 | 66.1 | 3.6 | ||
| Body Mass Index | 26.2 | 3.7 | 27.6 | 5.2 | ||
| Alcohol (oz/wk) | 3.7 | 5.7 | 2.6 | 3.6 | ||
| Physical activity* | 33.5 (−0.02) | 5.6 (0.96) | 163.4 (0.02) | 83.6 (1.01) | ||
| Menopausal women (%) | 85.0 | 54.1 | ||||
| Current ERT use in postmenopausal women (%) | 18.6 | 22.8 | ||||
Notes: Physical activity represents the Framingham Physical Activity Index (PAI) for the Original Cohort, and the Physical Activity Scale for Elderly (PASE) for the Offspring Cohort (at exam 6). In parentheses, standardized values.
SD = standard deviation; ERT = estrogen replacement therapy.
Figure 1 provides mean OSS values for each cohort and sex by 3-year intervals. There was a similarity between the mean OSS of men and women at younger ages, while in the older participants, the mean OSS values of women were generally higher than in men.
Figure 1.

Relationship between age and Osseographic Scoring System by cohort and sex. A, Original Framingham Cohort; B, Framingham Offspring Cohort. Mean ± SD (standard deviation) shown for each 3-year interval age group.
Due to the skewed distribution of the OSS, as well as heteroscedasticity of its relationship with age, the OSS values were log-transformed to allow their use in regression analysis. The cohort- and sex-specific regression models for age prediction employed quadratic and cubic terms of the score, since these terms were statistically significant (p < .05), and percent of variance explained by nonlinear models was substantially higher than that of the corresponding linear models. OSS and its derivatives explained from <10% of total variation in age in the Original Cohort and up to 50% in the Offspring Cohort (Table 2); the percentage of explained variation was higher in women than men in each cohort. Residuals between actual age and predicted age ranged from −17.9 to 18.8 in the Original Cohort men and −11.2 to 19.1 in the Original Cohort women, and −20.9 to 19.1 in the Offspring men (−19.9 to 21.8 in Offspring women). The standardized residuals (ΔBA) were approximately normally distributed for each cohort and sex, as suggested by Kolmogorov-Smirnov tests (Figure 2).
Table 2.
Prediction of Age by Cubic Model of Log-Transformed OSS by Cohort and Gender
| Original Cohort
|
Offspring Cohort
|
|||
|---|---|---|---|---|
| Men (N = 305) | Women (N = 381) | Men (N = 351) | Women (N = 365) | |
| Beta ± SE | ||||
| ln_OSS | 0.479 ± 0.190 | 1.363 ± 0.399 | 2.192 ± 0.368 | 2.240 ± 0.328 |
| ln_OSS2 | −0.007 ± 0.008 | −0.086 ± 0.032 | −0.111 ± 0.038 | −0.071 ± 0.032 |
| ln_OSS3 | −0.001 ± 0.001 | −0.002 ± 0.001 | 0.002 ± 0.001 | 0.001 ± 0.001 |
| R2 (cubic model) | 0.084 | 0.093 | 0.319 | 0.496 |
Note: SE = standard error.
Figure 2.
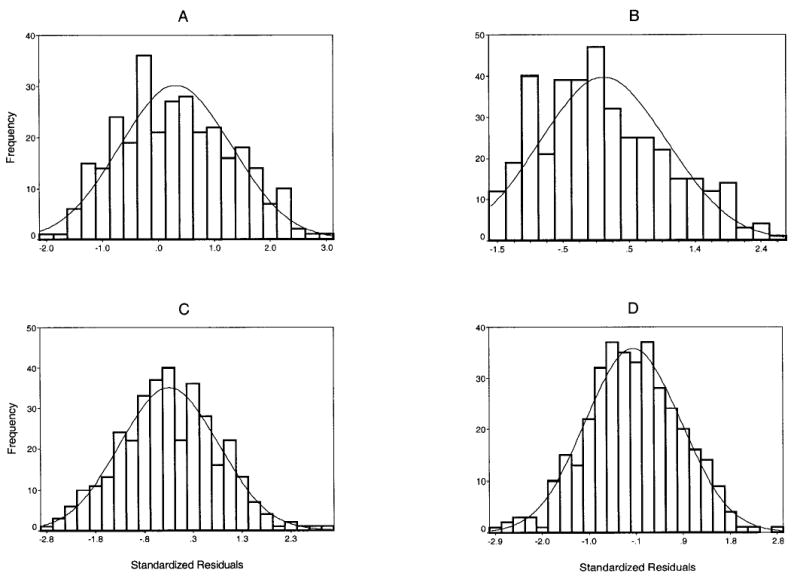
Histograms of standardized residuals (ΔBA) distribution by cohort and sex. A, Original Framingham Cohort males; B, Original Framingham Cohort females; C, Framingham Offspring Cohort males; D, Framingham Offspring Cohort females. The solid line represents normal distribution curve.
Of all potential confounders considered (cohort, sex, anthropometrics, alcohol intake, smoking, physical activity, and, in women, menopausal history), in the variance component analysis, only cohort, sex, height, BMI, and, in women, menopausal status and estrogen use, were retained as significant covariates for ΔBA, using the likelihood ratio test. These characteristics together explained 6.2% of the total variation in the standardized residuals. In the most parsimonious polygenic model, additive genetic factors explained 57.2 ± 5.6% (p < .001) of the variation in ΔBA, suggesting that biological age is highly heritable.
Of the 1000 simulated markers computed to evaluate type I error, the mean number of observed two-point LOD scores > 1.0 was 22 and LOD scores > 2.0 was 2; none had a LOD score ≥3.0, suggesting that the type I error rate is relatively low.
Linkage analysis of biological age was performed with Marshfield microsatellite markers. Results of the genome screen of crude and covariate-adjusted standardized residuals are provided in Table 3. Several loci with suggestive evidence of linkage (LOD ≥ 1.9) were identified, namely on 3p (at 79 cM from pter, with LOD scores 1.9 for crude and 1.8 for adjusted ΔBA), 7q (150 cM; LOD= 2.9 and 2.8), 11p (21 cM; LOD = 3.5 and 3.6), and 16q (125 cM; LOD = 2.3 and 1.8). Multipoint results, in general, resembled the two-point linkage, although they were at a substantially lower magnitude (Figure 3). However, when examining multipoint results on chromosome 21, there was further localization of linkage, with maximum at 27 cM from pter (Table 4). The results were almost identical when standardized residuals were or were not adjusted for covariates.
Table 3.
Results of Genetic Linkage Analysis of Standardized Residuals (Crude and Adjusted for Covariates*)
| Linkage Results
| ||||
|---|---|---|---|---|
| Two-Point LOD Scores** |
||||
| Chromasomal Region | Marker | cM† | Nonadjusted | Adjusted |
| 3p21.2 | GATA6F06 | 79 | 1.86 (0.49) | 1.75 (1.17) |
| 7q34 | GATA32C12 | 150 | 2.87 (0.53) | 2.80 (0.99) |
| 11p15.2 | GATA48E02 | 21 | 3.45 (0.58) | 3.57 (1.04) |
| 16q24.1 | GATA11C06 | 125 | 2.31 (0.59) | 1.83 (0.41) |
Notes: Sex, cohort, body mass index, height, and, in women, estrogen replacement therapy and menopause status.
In parentheses, multipoint LOD scores.
Location in sex-averaged centimorgans from pter (Marshfield map).
Boldface = LOD scores higher than 3.0.
LOD = logarithm of odds; cM = centimorgan.
Figure 3.
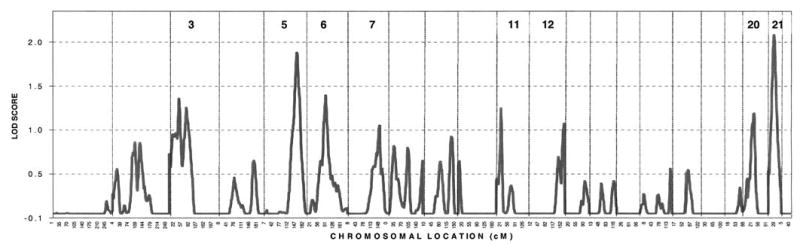
Genome-wide linkage results. Chromosome number for chromosomes with multipoint logarithm of odds (LOD) scores > 1.0 are shown.
Table 4.
Results of Linkage With Microsatellite Markers on Chromosome 21
| Marker
|
Two-point LOD Scores* |
|||
|---|---|---|---|---|
| Marshfield Name | D Number | Location (Sex-Averaged cM) | Nonadjusted | Adjusted† |
| GATA11C12 | D21S1432 | 7.7 | 0.45 (0.83) | 0.19 (0.85) |
| GGAA3C07 | D21S1437 | 16.3 | 0.61 (1.47) | 0.45 (1.34) |
| GATA129D11 | D21S2052 | 27.0 | 0.96 (1.96) | 1.80 (2.03) |
| ATA27F01 | D21S1440 | 41.5 | 0.23 (1.55) | 0.28 (1.00) |
| GATA188F04 | D21S2055 | 44.4 | 1.15 (1.48) | 0.47 (0.77) |
| GATA70B08 | D21S1446 | 62.0 | 0.50 (1.40) | 0.01 (0.54) |
Notes: In parentheses, multipoint LOD scores.
Adjusted for cohort, sex, body mass index, height, and, in women, menopausal status and estrogen use.
Boldface = LOD scores higher than 1.90.
LOD = logarithm of odds; cM = centimorgan.
Discussion
In this study, we evaluated the influence of genetic and nongenetic factors on biological aging, as measured by an OSS, evaluating different features of aging displayed by bone tissue. Residuals between the age predicted by the OSS and the actual age were considered a measure of biological age, both crude and adjusted for measurable confounding factors, including sex, anthropometrics, alcohol consumption, smoking status, physical activity, and, in women, menopausal status and estrogen history. The actual membership in a cohort (parent or offspring) was also considered covariate in the model, to adjust for unmeasured effects, such as a possible birth cohort effect or a secular trend in biological aging. It was found that personal factors such as generation, sex, height, menopausal status, and covariates of a potentially modifiable nature (BMI and estrogen use by women) explained only 6% of the total variation in biological age. A majority (57%) of the biological age variation was contributed by additive genetic sources. The rest, <40% of the variation, was attributable to random, unmeasured factors (e.g., trauma history).
The presence of a substantial heritable component suggested that it was appropriate to perform a linkage analysis of biological age with microsatellite markers. Several loci with suggestive evidence of linkage were identified at chromosomal regions 3p21.2, 7q34, 11p15.2, 16q24.1, and 21q. Two-point LOD scores were 1.75, 2.80, 3.57, 1.83, and 1.80, respectively. However, multipoint LOD scores were substantially lower for the above chromosomal regions, with the exception of 21q. When there are several high two-point LOD scores in a region, the multipoint LOD scores generally will be similar in magnitude to two-point scores. However, when there is only a single elevated two-point LOD score in a region, but lower LOD scores at surrounding markers, multipoint scores will be lower than the two-point scores at that locus. Failure to reproduce two-point LOD scores with multipoint linkage analyses may therefore be a sign of spurious two-point findings, which may be the case for quantitative trait loci on chromosomes 3p, 7q, 11p, or 16q, but not 21q. Adjustment of residuals for covariates did not change the results for the above chromosomal regions, suggesting that these regions contain loci responsible for biological age variation per se. Our statistical genetic analysis implied that these genetic loci have additive effects on the ΔBA. Additionally, simulations analysis performed in this study suggested that the resulting type I error rate in two-point analysis is relatively low. As our simulations point out, we would expect that markers with LOD ≤ 2.0 may be in fact false-positive findings, while the chance that LOD > 2.0 is a false-positive is low.
Interpersonal health differences create discrepancies between biological and chronological age. Biological age may therefore serve as an indicator of general health status and remaining life expectancy, which will predict morbidity and mortality in later life better than actual age. A consensus is growing in gerontology that genotypes that are known to enhance longevity in humans delay development of age-related conditions rather than affecting mechanisms that increase life span (45). Consequently, the study of an individual’s health and functional status in relation to his or her age-matched peers may contribute more useful information than the study of exceptional longevity (26).
Biological age in this study was measured as the difference between actual age and age predicted by composite score using visual manifestations of bone response/bone remodeling. Aging of bone seems to be a generalized process of tissue atrophy as seen elsewhere in the aging body (11). Once the skeleton has reached maturity, bone remodeling is responsible for the complete replacement of old bone tissue with new tissue (46). With advanced age, both new bone placement and quality are altered, since the areas of remodeling change with disease and trauma, and during different phases of life when there are various kinds of work and leisure activity, and variations in muscular strength. The amount of bone reformed and replaced during the remodeling cycle progressively decreases with advanced age due to decreased proliferative capacity of osteoblasts (47,48) as well as cumulative damage of uncorrected molecular errors (49). The longer an individual lives, the more remodeling cycles he or she undergoes, and the more such errors accumulate. Finally, the contribution of catabolic illness, such as surgery, injury, palsy (50), and immobilization (51), may contribute to rapid bone degeneration. The net result of the age-related bone changes in older persons is chronic degenerative disease, which is characterized by the loss of bone mass and bone strength, development of fragility, and the alteration of bone morphology. These processes involve both cortical and trabecular bone compartments, juxta-articular regions, and bones of the axial and appendicular skeleton, and are common for humans of different ethnic groups, both modern and prehistoric (52,53).
The compensatory and adaptive mechanisms that try to protect the skeleton from deficient remodeling are also evident in degenerative bone disease. Thus, endosteal expansion causes subperiosteal outgrowth (54); excessive bone resorption (such as in unloading) brings about heterotopic calcification in neighboring soft tissues. Similarly, as a response to increased mechanical loads, bone grows into the tendon by endochondral ossification of enthesis fibrocartilage, creating an increased surface area (55); osteophytes develop as a response to chondral erosion, ossification, or eburnation (56). Age-related bone and joint changes manifest as visible and measurable traits, which have facilitated paleoanthropological and forensic applications of skeletal aging methods, and have ultimately paved the way for the use of the OSS as an integrative measure of adult bone age (16).
The OSS and its derivatives predicted in cubic regression up to 50% of age in the Offspring Cohort (compared with less than 10% in the Original Cohort). There may be several explanations for such findings. First, OSS has been suggested as a reliable predictor of age in individuals younger than 70 years (17,52), but may not be so in older persons due to high variability of OSS values in this age group. In our sample, 10% of the Original Cohort but only 4% of the Offspring Cohort are older than 70 years. Second, differences in X-ray techniques and quality between radiographs obtained in the late 1960s and early 1990s may have affected our readings. To account for this possibility, we considered a cohort as a covariate in the variance component analysis. Finally, there are known secular trends over the course of this study that may result in differences between the cohorts in the Framingham study. For example, BMI and smoking behavior has changed tremendously from the 1960s to the 1990s, and physical activity has changed as well. Thus, even if we adjust for physical activity, we may not eliminate differences in heavy manual labor, which may affect some of the OSS component prevalences in the Original Cohort, but not in the Offspring Cohort.
Over the last decade, a consensus is growing concerning measurement and interpretation of biological age. Uttley and Crawford developed a battery of biomarkers from pulmonary function, neuromotor performance, blood pressure, blood chemistry, strength and flexibility, and anthropometric variables in their Mennonite samples (2). Duggirala and colleagues (5) have recently reported that biological age measured by the Uttley and Crawford (2) biomarkers had substantial genetic determinants (h2 ranging from 0.27 ± 0.11 to 0.47 ± 0.18). In our study, heritability of ΔBA was even higher, making it possible to perform genetic linkage analysis of this trait. Moreover, our standardized residuals were simultaneously adjusted for a number of potential confounders. Some of the covariates, such as body size (height and BMI), are likely having a substantial genetic component. Thus, controlling for the effect of, for example, BMI on residuals may eliminate the contribution, if any, of gene(s) governing their covariation, allowing us to focus on the ‘‘pure’’ contribution of loci governing biological age only. Other environmental factors, such as physical activity, alcohol intake, smoking, and estrogen history in women, are known risk factors for bone degenerative disease and may thus affect prediction of age by the OSS. However, the overall contribution of the covariates was minimal, and the heritability of the model with adjustment for all significant covariates did not differ from the unadjusted model.
This study has several potential limitations. First, due to the nature of the Framingham Study sample, which is composed of two cohorts, analysis of covariates and risk factors poses a potential problem of correlated data. We applied genetic variance component analysis using our pedigree structure to adjust for kinship and thus to minimize this problem. Second, our sample did not include all originally recruited members of each of the cohorts, but rather those who had survived up until the time of our analysis. Thus, we were only able to explore the contribution of covariates to ΔBA variation in a subsample of the radiographed parents and offspring; these relationships might differ had we examined the larger sample of Framingham participants. Third, the genome scan available in Framingham pedigrees does not allow us to identify genes other than autosomal ones. However, genes contributing to biological age may be of mitochondrial origin, since certain mitochondrial mutations may protect against development of adult-onset diseases (57,58). Finally, in this study, neither gene–environment interactions nor gene–gene (epistatic) relationships were explored. Residual confounding factors and their interactions could have influenced our findings. Study of gene–environment interactions affecting biological age is therefore warranted to assess the contribution of modifiable environmental factors that might affect a genetically determined propensity to age faster or slower than expected from chronological age.
Conclusion
A major portion of total variance in biological age, measured using a composite score from hand bone radiography, has been explained by additive genetic factors, and to a lesser degree, by measured and unmeasured environmental factors. Several quantitative trait loci were identified, which may contain promising candidate genes governing biological aging.
Acknowledgments
From the Framingham Heart Study (supported by NIH/NHLBI Contract N01-HC-25195). We gratefully acknowledge the Framingham Study members who participated in this study, as well as the study coordinators, who contributed to the success of this work.
Footnotes
This work was supported by the National Institutes of Health (NIA R03 AG20321-01 to D. Karasik as well as NIAMS/NIA RO1 AR41398 to D. P. Kiel and NIAMS AR47785 to D. T. Felson).
References
- 1.Borkan GA, Norris AH. Assessment of biological age using a profile of physical parameters. J Gerontol. 1986;35:177–184. doi: 10.1093/geronj/35.2.177. [DOI] [PubMed] [Google Scholar]
- 2.Uttley M, Crawford M. Efficacy of a composite biological age score to predict ten-year survival among Kansas and Nebraska Mennonites. Hum Biol. 1994;66:121–144. [PubMed] [Google Scholar]
- 3.Nakamura E, Lane MA, Roth GS, Ingram DK. A strategy for identifying biomarkers of aging: further evaluation of hematology and blood chemistry data from a calorie restriction study in rhesus monkeys. Exp Gerontol. 1998;33:421–443. doi: 10.1016/s0531-5565(97)00134-4. [DOI] [PubMed] [Google Scholar]
- 4.Bell B. Significance of functional age for interdisciplinary and longitudinal research in aging. Aging Hum Dev. 1972;3:145–147. [Google Scholar]
- 5.Duggirala R, Uttley M, Willams K, Arya R, Blangero J, Crawford M. Genetic determination of biological age in the Mennonites of the Midwestern United States. Genet Epidemiol. 2002;23:97–109. doi: 10.1002/gepi.1126. [DOI] [PubMed] [Google Scholar]
- 6.Dean W, Morgan RF. In defense of the concept of biological aging measurement—current status. Arch Gerontol Geriatr. 1988;7:191–210. doi: 10.1016/0167-4943(88)90002-7. [DOI] [PubMed] [Google Scholar]
- 7.Benetos A, Okuda K, Lajemi M, et al. Telomere length as an indicator of biological aging: the gender effect and relation with pulse pressure and pulse wave velocity. Hypertension. 2001;37:381–385. doi: 10.1161/01.hyp.37.2.381. [DOI] [PubMed] [Google Scholar]
- 8.Rikkert M. Visual estimation of biological age of elderly subjects: good interrater agreement. Gerontology. 1999;45:165–167. doi: 10.1159/000022080. [DOI] [PubMed] [Google Scholar]
- 9.Guinot C, Malvy DJ, Ambroisine L, et al. Relative contribution of intrinsic vs extrinsic factors to skin aging as determined by a validated skin age score. Arch Dermatol. 2002;138:1454–1460. doi: 10.1001/archderm.138.11.1454. [DOI] [PubMed] [Google Scholar]
- 10.Weindruch R, Kayo T, Lee CK, Prolla TA. Gene expression profiling of aging using DNA microarrays. Mech Ageing Dev. 2002;123:177–193. doi: 10.1016/s0047-6374(01)00344-x. [DOI] [PubMed] [Google Scholar]
- 11.Plato C, Fox K, Tobin J. Skeletal Changes in Human Aging. New York: Oxford University Press; 1994.
- 12.Sehl ME, Yates FE. Kinetics of human aging: I. Rates of senescence between ages 30 and 70 years in healthy people. J Gerontol Biol Sci. 2001;56A:B198–B208. doi: 10.1093/gerona/56.5.b198. [DOI] [PubMed] [Google Scholar]
- 13.Hak A, Pols H, van Hemert A, Hofman A, Witteman J. Progression of aortic calcification is associated with metacarpal bone loss during menopause: a population-based longitudinal study. Arterioscler Thromb Vasc Biol. 2000;20:1926–1931. doi: 10.1161/01.atv.20.8.1926. [DOI] [PubMed] [Google Scholar]
- 14.Kiel DP, Kauppila LI, Cupples LA, Hannan MT, O’Donnell CJ, Wilson PW. Bone loss and the progression of abdominal aortic calcification over a 25 year period: the Framingham Heart Study. Calcif Tissue Int. 2001;68:271–276. doi: 10.1007/BF02390833. [DOI] [PubMed] [Google Scholar]
- 15.Johansson C, Black D, Johnell O, Oden A, Mellstroem D. Bone mineral density is a predictor of survival. Calcif Tissue Int. 1998;63:190–196. doi: 10.1007/s002239900513. [DOI] [PubMed] [Google Scholar]
- 16.Pavlovsky O, Kobyliansky E. Population Biology of Human Aging. Florence, Italy: Angelo Pontecorboli Press; 1999.
- 17.Karasik D, Yakovenko K, Barakh I, et al. Comparative analysis of age prediction by markers of bone change in the hand as assessed by roentgenography. Am J Hum Biol. 1999;11:31–44. doi: 10.1002/(SICI)1520-6300(1999)11:1<31::AID-AJHB3>3.0.CO;2-L. [DOI] [PubMed] [Google Scholar]
- 18.Livshits G, Vainder M, Pavlovsky O, Kobyliansky E. Population biology of human aging: ethnic and climatic variation of bone age scores. Hum Biol. 1996;68:293–314. [PubMed] [Google Scholar]
- 19.Livshits G, Vainder M, Pavlovsky O, Kobyliansky E. Population biology of human aging: segregation analysis of bone aging characteristics. Hum Biol. 1996;68:539–554. [PubMed] [Google Scholar]
- 20.Luo T, Zhao Y, Li G, et al. A genome-wide search for type II diabetes susceptibility genes in Chinese Hans. Diabetologia. 2001;44:501–506. doi: 10.1007/s001250051649. [DOI] [PubMed] [Google Scholar]
- 21.Stern MP. The search for type 2 diabetes susceptibility genes using whole-genome scans: an epidemiologist’s perspective. Diabetes Metab Res Rev. 2002;18:106–113. doi: 10.1002/dmrr.268. [DOI] [PubMed] [Google Scholar]
- 22.Myers A, Wavrant De-Vrieze F, Holmans P, et al. Full genome screen for Alzheimer disease: stage II analysis. Am J Med Genet. 2002;114:235–244. doi: 10.1002/ajmg.10183. [DOI] [PubMed] [Google Scholar]
- 23.Deng HW, Mahaney MC, Williams JT, et al. Relevance of the genes for bone mass variation to susceptibility to osteoporotic fractures and its implications to gene search for complex human diseases. Genet Epidemiol. 2002;22:12–25. doi: 10.1002/gepi.1040. [DOI] [PubMed] [Google Scholar]
- 24.Karasik D, Myers R, Cupples L, et al. Genome screen for quantitative trait loci contributing to normal variation in bone mineral density: the Framingham Study. J Bone Miner Res. 2002;17:1718–1727. doi: 10.1359/jbmr.2002.17.9.1718. [DOI] [PubMed] [Google Scholar]
- 25.Demissie S, Cupples L, Myers R, Aliabadi P, Levy D, Felson D. Genome Scan for Quantity of Hand Osteoarthritis: The Framingham Study. Arthritis Rheum. 2002;46:946–952. doi: 10.1002/art.10149. [DOI] [PubMed] [Google Scholar]
- 26.Puca A, Daly M, Brewster S, et al. A genome-wide scan for linkage to human exceptional longevity identifies a locus on chromosome 4. PNAS. 2001;98:10505–10508. doi: 10.1073/pnas.181337598. [DOI] [PMC free article] [PubMed] [Google Scholar]
- 27.Felson D, Couropmitree N, Chaisson C, et al. Evidence for Mendelian gene in a segregation analysis of generalized radiographic osteoarthritis. Arthritis Rheum. 1998;41:1064–1071. doi: 10.1002/1529-0131(199806)41:6<1064::AID-ART13>3.0.CO;2-K. [DOI] [PubMed] [Google Scholar]
- 28.Kricun M, Edeiken J. Atlas of hand bones in systemic disease. Baltimore, MD: Williams & Wilkins; 1973.
- 29.Kellgren J, Lawrence JS. Radiologic assessment of osteoartrosis. Ann Rheum Dis. 1957;16:494–501. doi: 10.1136/ard.16.4.494. [DOI] [PMC free article] [PubMed] [Google Scholar]
- 30.Altman R, Hochberg M, Murphy WJ, Wolfe F, Lequesne M. Atlas of individual radiographic features in osteoarthritis. Osteoarthritis Cartil. 1995;(Suppl A):3–70. [PubMed]
- 31.Kallman D, Wigley F, Scott W, Hochberg M, Tobin J. New radiographic grading scales for osteoarthritis of the hand. Arthritis Rheum. 1989;32:1584–1591. doi: 10.1002/anr.1780321213. [DOI] [PubMed] [Google Scholar]
- 32.Lovejoy CO, Meindl RS, Mensforth RP, Barton TJ. Multifactorial determination of skeletal age at death: a method and blind tests of its accuracy. Am J Phys Anthropol. 1985;68:1–14. doi: 10.1002/ajpa.1330680102. [DOI] [PubMed] [Google Scholar]
- 33.Walker R, Lovejoy C. Radiographic changes in the clavicle and proximal femur and their use in the determination of skeletal age at death. Am J Phys Anthropol. 1985;68:67–78. doi: 10.1002/ajpa.1330680107. [DOI] [PubMed] [Google Scholar]
- 34.Evans RA, Hughes WG, Dunstan CR, et al. Adult osteosclerosis. Metab Bone Dis Relat Res. 1983;5:111–117. doi: 10.1016/0221-8747(83)90011-5. [DOI] [PubMed] [Google Scholar]
- 35.Weber JL, May PE. Abundant class of human DNA polymorphisms which can be typed using the polymerase chain reaction. Am J Hum Genet. 1989;44:388–396. [PMC free article] [PubMed] [Google Scholar]
- 36.Yuan B, Vaske D, Weber JL, Beck J, Sheffield VC. Improved set of short-tandem-repeat polymorphisms for screening the human genome [Letter] Am J Hum Genet. 1997;60:459–460. [PMC free article] [PubMed] [Google Scholar]
- 37.Michels K, Greenland S, Rosner B. Does body mass index adequately capture the relation of body composition and body size to health outcomes? Am J Epidemiol. 1998;147:167–172. doi: 10.1093/oxfordjournals.aje.a009430. [DOI] [PubMed] [Google Scholar]
- 38.Felson DT, Kiel DP, Anderson JJ, Kannel WB. Alcohol consumption and hip fractures: the Framingham Study. Am J Epidemiol. 1988;128:1102–1110. doi: 10.1093/oxfordjournals.aje.a115052. [DOI] [PubMed] [Google Scholar]
- 39.Shawe D, Hesp R, Gumpel J, Sambrook P, Reeve J. Physical activity as a determinant of bone conservation in the radial diaphysis in rheumatoid-arthritis. Ann Rheum Dis. 1993;52:579–581. doi: 10.1136/ard.52.8.579. [DOI] [PMC free article] [PubMed] [Google Scholar]
- 40.Washburn R, Smith K, Jette A, Janney C. The physical-activity scale for the elderly (PASE)—development and evaluation. J Clin Epidemiol. 1993;46:153–162. doi: 10.1016/0895-4356(93)90053-4. [DOI] [PubMed] [Google Scholar]
- 41.Lange K, Boehnke M. Extensions to pedigree analysis. IV. Covariance components for multivariate traits. Am J Med Genet. 1986;14:513–524. doi: 10.1002/ajmg.1320140315. [DOI] [PubMed] [Google Scholar]
- 42.Almasy L, Blangero J. Multipoint quantitative-trait linkage analysis in general pedigrees. Am J Hum Genet. 1998;62:1198–1211. doi: 10.1086/301844. [DOI] [PMC free article] [PubMed] [Google Scholar]
- 43.Levy D, DeStefano AL, Larson MG, et al. Evidence for a gene influencing blood pressure on chromosome 17. Genome scan linkage results for longitudinal blood pressure phenotypes in subjects from the Framingham heart study. Hypertension. 2000;36:477–483. doi: 10.1161/01.hyp.36.4.477. [DOI] [PubMed] [Google Scholar]
- 44.Moser KL, Jedrey CM, Conti D, et al. Comparison of three methods for obtaining principal components from family data in genetic analysis of complex disease. Genet Epidemiol. 2001;21:S726–S731. doi: 10.1002/gepi.2001.21.s1.s726. [DOI] [PubMed] [Google Scholar]
- 45.Holloszy JO. The biology of aging. Mayo Clin Proc. 2000;75(Suppl): S3–S8; discussion S8–S9. [PubMed]
- 46.Manolagas SC. Birth and death of bone cells: basic regulatory mechanisms and implications for the pathogenesis and treatment of osteoporosis. Endocrine Rev. 2000;21:115–137. doi: 10.1210/edrv.21.2.0395. [DOI] [PubMed] [Google Scholar]
- 47.Mosekilde L. Trabecular microarchitecture and aging. In: Orwoll E, ed. Osteoporosis in Men. San Diego: Academic Press; 1999:313–332.
- 48.Kveiborg M, Flyvbjerg A, Rattan SI, Kassem M. Changes in the insulin-like growth factor-system may contribute to in vitro age-related impaired osteoblast functions. Exp Gerontol. 2000;35:1061–1074. doi: 10.1016/s0531-5565(00)00125-x. [DOI] [PubMed] [Google Scholar]
- 49.Nagy IZ. On the true role of oxygen free radicals in the living state, aging, and degenerative disorders. Ann N Y Acad Sci. 2001;928:187–199. doi: 10.1111/j.1749-6632.2001.tb05649.x. [DOI] [PubMed] [Google Scholar]
- 50.Kiel DP. Adult bone maintenance. In: Markus R, ed. Atlas of Clinical Endocrinology. III. Osteoporosis. Philadelphia: Current Medicine; 2000:29–39.
- 51.Bauman W, Spungen A, Wang J, Pierson R, Schwartz E. Continuous loss of bone during chronic immobilization: a monozygotic twin study. Osteoporosis Int. 1999;10:123–127. doi: 10.1007/s001980050206. [DOI] [PubMed] [Google Scholar]
- 52.Karasik D, Arensburg B, Tillier A-M, Pavlovsky O. Skeletal age assessment of fossil hominids. J Archaeol Sci. 1998;25:689–696. [Google Scholar]
- 53.Rothschild B, Sebes J, Rothschild C. Antiquity of arthritis: spondyloarthropathy identified in the Paleocene of North America. Clin Exp Rheum. 1998;16:573–575. [PubMed] [Google Scholar]
- 54.Seeman E. Reduced bone formation and increased bone resorption: rational targets for the treatment of osteoporosis. Osteoporosis Int. 2003;14(Suppl 3):S2–S8. doi: 10.1007/s00198-002-1340-9. [DOI] [PubMed] [Google Scholar]
- 55.Benjamin M, Rufai A, Ralphs J. The mechanism of formation of bony spurs (enthesophytes) in the Achilles tendon. Arthritis Rheum. 2000;43:576–583. doi: 10.1002/1529-0131(200003)43:3<576::AID-ANR14>3.0.CO;2-A. [DOI] [PubMed] [Google Scholar]
- 56.Calvo E, Palacios I, Delgado E, et al. High-resolution MRI detects cartilage swelling at the early stages of experimental osteoarthritis. Osteoarthritis Cartil. 2001;9:463–472. doi: 10.1053/joca.2001.0413. [DOI] [PubMed] [Google Scholar]
- 57.Tanaka M, Gong JS, Zhang J, Yoneda M, Yagi K. Mitochondrial genotype associated with longevity. Lancet. 1998;351:185–186. doi: 10.1016/S0140-6736(05)78211-8. [DOI] [PubMed] [Google Scholar]
- 58.Niemi AK, Hervonen A, Hurme M, Karhunen PJ, Jylha M, Majamaa K. Mitochondrial DNA polymorphisms associated with longevity in a Finnish population. Hum Genet. 2003;112:29–33. doi: 10.1007/s00439-002-0843-y. [DOI] [PubMed] [Google Scholar]