

Abstract
Estradiol (E2) and other steroids have recently been shown to initiate various intracellular signaling cascades from the plasma membrane, including those stimulating mitogen-activated protein kinases (MAPKs), and particularly extracellular-regulated kinases (ERKs). In this study we demonstrated the ability of E2 to activate ERKs in the GH3/B6/F10 pituitary tumor cell line, originally selected for its enhanced expression of membrane estrogen receptor-α (mERα). We compared E2 to its cell-impermeable analog (E2 conjugated to peroxidase, E2–P), and to the synthetic estrogen diethylstilbestrol (DES). Time-dependent ERK activation was quantified with a novel fixed cell-based immunoassay developed to efficiently determine activation by multiple compounds over multiple parameters. Both E2 and DES produced bimodal responses, but with distinctly different time courses of enzyme phosphorylation (activation) and inactivation; E2–P induced a monophasic ERK activation. E2 also phosphorylated ERKs in concentration-dependent manner with two concentration optima (10−14 and 10−8 M). Inhibitors were employed to determine pathway (ER, EGFR, membrane organization, PI3 kinase, Src kinase, Ca2+) involvement and timing of pathway activations; all affected ERK activation as early as 3–6 min, suggesting simultaneous, not sequential, activation. Therefore, E2 and other estrogenic compounds can produce rapid ERK phosphorylations via nongenomic pathways, using more than one pathway for signal generation.
Keywords: Non-genomic, Membrane estrogen receptor, Signaling pathway inhibitors, Ca2+, Src kinase, PI3K, EGF receptor
1. Introduction
Recent studies have demonstrated that E2 can regulate cell proliferation, apoptosis, vasodilatation, regulated hormone release, cell differentiation, and other specific cell functions by rapid (from seconds to a few minutes) stimulation of signaling pathways in different cell types [1,2]. This occurs in addition to classical genomic effects mediated by estrogen receptors (ERs) [3]. A transcriptionally inactive form of ER (classical nuclear receptor with only the ligand-binding domain remaining) can activate signaling cascades leading to cell survival and DNA synthesis [4,5]. Other examples of signaling pathways initiated by E2 include increased levels of intracellular Ca2+, modulation of potassium channels, cAMP production, nitric oxide formation, interaction with G protein-coupled receptors and G proteins, and stimulation of mitogen-activated protein (MAP) kinases [6–13].
One type of MAP kinase, the extracellular-regulated kinases (ERK 1 and 2), can be activated by dual phosphorylation on Thr183 and Tyr185. The ERK 1/2 cascade has been shown to be involved in cell differentiation, proliferation, and increased cell motility and migration—all responses that can be initiated by estrogens as well. These responses can also be activated by many other mitogens, such as EGF, PDGF, thromboxane A2, angiotensin II, and insulin [13]. Classical ERK 1/2 pathway activations start from receptor tyrosine kinases (RTKs) after ligand binding and auto-phosphorylation. The adaptor protein Shc can then recognize the phosphorylated site on the receptor, bind to it, and become phosphorylated itself. Another entry point into this pathway is phosphorylation of Shc by Src family kinases. The receptor–Shc complex then further binds with the adapter protein GRB and the nucleotide exchange factor SOS to catalyze the conversion of GDP to GTP bound on the small G protein Ras. Ras, in turn, interacts with the kinases Raf and MEK that subsequently affect ERKs. One consequence is that ERKs translocate to the nucleus and alter the phosphorylation status of transcription factors. Additionally, other pathways (involving G proteins, Src, [Ca2+]i elevation, and PI3K/Akt) can lead to ERK activation [14,15]. Therefore, there are many different elements of the signaling web that can lead to ERK activation, and resultant cell functions. Some of these pathways (PI3K and Src activation, Ca2+ level changes, channel openings) are stimulated by E2 [7,16,17]. ERK phosphatases are inducible by stimuli that activate ERK pathways, providing negative feedback control for ERK activity [18].
Additionally, E2 can share the signaling pathways of EGF. E2 was recently shown to activate a metalloproteinase which in turn releases a soluble form of EGF (heparin or sHB-EGF) by cleavage from its membrane-anchored tether [11,19]. Consequently, sHB-EGF is able to bind to EGF receptor and activate MAP kinases through the classical RTK pathway.
To produce rapid non-genomic effects, ERs are thought to be located in or near the plasma membrane, where they can access the machineries of signal generation. Multiple antibodies (Abs) directed against different epitopes of nuclear ERα recognize antigen on the plasma membrane of live or fixed prolactin-producing pituitary cells [20,21], as well as in other cell types [22–24]. Multiple studies now suggest that mERs can associate with membrane rafts and caveolae [25,26]. These specialized structures contain high concentrations of cholesterol and sphingolipids, and provide a location for the interaction of different types of receptors, integrins, G proteins and other signaling molecules [27]. Localization of mER in these structures may allow the sharing of signals that ERs transduce, thus causing integration and simultaneous triggering of multiple signaling cascades.
To address the ERK-linked signaling consequences of estrogens in lactogenic pituitary tumor cells selected for mERα expression [28,29], we assessed the effects of various specific signaling pathway inhibitors to determine the involvement of signaling partners and the sequencing of the multiple signaling events. To accomplish this more effectively, we developed a quantitative plate immunoassay for ERK phosphorylation status. This allowed us to efficiently compare the ability of different estrogenic compounds (E2, E2–P and DES) to activate ERKs over an extensive time course.
2. Experimental
Phenol red-free DMEM and horse serum were purchased from Gibco-BRL (Grand Island, NY). Defined, supplemented, fetal calf and goat sera were obtained from Hyclone (Logan, UT). From Vector Laboratories (Burlingame, CA), we purchased biotinylated universal anti-mouse/rabbit IgG, Vectastain ABC-AP (avidin:biotinylated enzyme complex with alkaline phosphatase) detection system, levamisol (endogenous alkaline phosphatase subtype inhibitor), and para-nitrophenol–phosphate (pNpp, the substrate for our alkaline phosphatase reaction). Phospho-p44/42 ERK monoclonal Ab, and lysis buffer were obtained from Cell Signaling Technology (Beverly, MA). Anti-ERK Abs from rabbit (for total ERK detection) were purchased from Promega Corporation (Madison, WI). Anti-ERα Ab (MC-20) was purchased from Santa Cruz Biotechnology (Santa Cruz, CA). Precast 10% polyacrylamide gels were purchased from Invitrogen (Carlsbad, CA), and all other reagents were purchased from Sigma Chemical Co. (St. Louis, MO). All test compounds were compared to vehicle-treated controls appropriate for the individual compound (usually 0.01–0.001% ethanol or DMSO). In order to eliminate free E2 molecules from the E2–P reagent, just prior to using it in the assays we removed any free steroid by centrifugal ultra-filtration with Millipore filters (cutoff 10,000 MW). Steroid release from the conjugate takes a much longer time [30] than our experimental time course.
3. Cell culture
GH3/B6/F10 and GH3/B6/D9, clonal rat prolactinoma cell lines, were selected for high and low expression (respectively) of mERα [31]. Cells were routinely cultured in DMEM medium containing 12.5% horse serum, 2.5% defined-supplemented calf serum and 1.5% fetal calf serum. For individual experiments, cells were deprived of steroids for 48 h after plating by substituting DMEM medium containing only 1% serum that had been charcoal-stripped four times.
4. Western blots
We used approximately 120,000 cells/25 cm2 culture flask (Corning Incorporated, Corning, NY) for MAPK assay. Cells were treated with different hormones and blocking agents for the times indicated, usually over a 60 min time course. Cells were then rinsed twice with ice-cold PBS and solubilized in 0.5 ml of lysis buffer (20 mM Tris, 150 mM NaCl, 1 mM EDTA, 1 mM EGTA, 1% Triton X-100, 2.5 mM sodium pyrophosphate, 1 mM β-glycerolphosphate, 1 mM Na3VO4, 1 μg/ml leupeptin, 1 mM PMSF, 1 mM DTT) at 4 °C. After sonication (four 5 s bursts), the insoluble materials were removed by centrifugation at 15,000 × g for 10 min. The extract was treated with SDS sample buffer and boiled 5 min. Aliquots were assayed for protein concentration (BioRad) and 50 μg/lane total protein was subjected to 10% SDS–PAGE, followed by transfer to a nitrocellulose membrane. The membrane was probed with primary Ab against activated (phosphorylated) ERK 1/2 (pMAP; diluted 1:2000) overnight at 4 °C. Secondary Ab conjugated with horseradish peroxidase was then applied for 1 h at RT. Relative spot density was determined from light scans of the resulting films using NIH Scion Image software (Scion Corporation, Frederick, MD). The same cell extract was used for ERα detection in separate Western blotting with 2 μg/ml MC-20 Ab. To confirm equal protein loading in individual lanes, the membrane was stripped and reprobed with Ab against total ERK (diluted 1:5000; tMAP).
5. Fixed cell-based 96-well ELISA
Cells were plated at approximately 10,000 cells/well in a 96-well poly-d-lysine coated plate (Corning Incorporated) and then exposed to medium (containing 1% serum stripped of steroids) for 48 h. The cells were then treated with hormones and other reagents for 3–60 min, followed by fixation with 2% paraformaldehyde/0.2% picric acid at 4 °C for 48 h. After fixation, the cells were washed twice with PBS and incubated with blocking buffer (2% BSA, 0.1% Triton X-100 in PBS) for 1 h at RT. Primary Ab for pMAP kinase (diluted 1:400 in PBS containing 1% BSA and 0.1% Triton X-100) was added to cells for an overnight incubation at 4 °C. Cells were then washed (3 × 5 min) in PBS. Biotin-conjugated secondary Ab (1:300) in PBS/0.1% BSA was then added for a 1 h incubation at RT. The cells were again washed 3× in PBS, and then 100 μl Vectastain ABC-AP solution was added into each well and incubated for 1 h at RT. Levamisole (2 drop/10 ml ABC solution) was added to block endogenous cellular alkaline phosphatase activity. The cells then underwent four 0.1% Triton X-100/PBS washes (5 min each) and then one wash with PBS only. Vectastain alkaline phosphatase substrate pNpp solution was prepared immediately before use according to the manufacturer’s instructions and added to each well (100 μl). After optimizing conditions, an incubation of 30 min in the dark at 37 °C was chosen as being within the linear range of the assay and producing low measurement errors. The signal from para-nitrophenol (pNp) was monitored at 405 nm absorbance in a model 1420 Wallac microplate reader (Perkin-Elmer, Boston, MA).
6. Crystal violet (CV) cell quantification assay
This procedure for normalization of the pNp signal to cell number [28] involved washing alkaline phosphatase reaction reagents from the plate twice with ddH2O, then drying the plates at RT for at least 12 h. Crystal violet solution (0.1% in water, filtered) was then added to each well (50 μl/well) and incubated for 30 min at RT. The cells were then washed at least 3× with ddH2O and dried at RT. Dye was released from the cells with 50 μl/well acetic acid (10% in water) at RT for 30 min. The A590 was then read in a model 1420 Wallac microplate reader.
7. Statistics
Data were compared for significance of differences using Sigma Stat 2 (Jandel Scientific, San Rafael, CA) and the one-way ANOVA test.
8. Results
8.1. Fixed cell-based ELISA (plate assay)
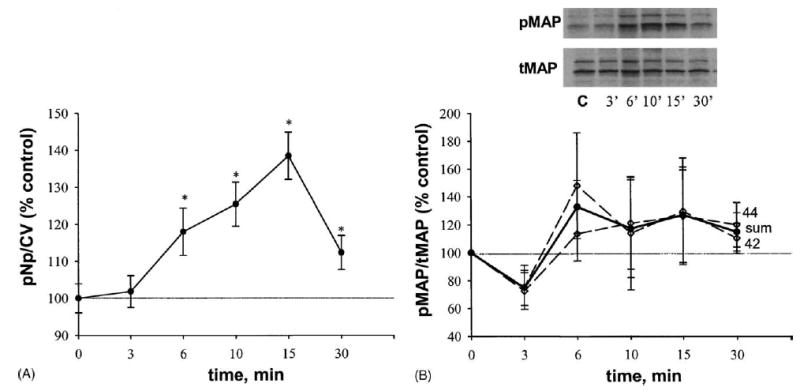
Western blotting analyses of the activation/phosphorylation of signaling molecules are laborious and difficult to quantitate. Quantification of bands via densitometry requires subjective judgments about which part of the bands to scan, and what to designate as a background signal. These considerations predispose the data to variations that can only be overcome by numerous repetitions. Small, though important regulatory changes are not likely to be measured as significant with such systems. Plate assays with a machine-read signal reduce variability and allow simultaneous analysis of a large number of samples. We initially optimized the system with the more robust ERK 1/2 activation by EGF, and subsequently used this response as a positive control to establish other conditions for our method. In Fig. 1, the vertical axes show the pNp signal representing the phosphorylated MAP kinase level (all panels) normalized by cell number in individual wells (CV assay). The signal from vehicle-treated cells (control) was significantly higher than background (using only secondary Ab, and designated “no. 1 Ab”) at primary anti-phospho-ERK Ab dilutions of 1:1000 and lower. EGF-treated cells showed a significant response at all primary Ab concentrations (Fig. 1A). Western blot analysis of the EGF response (see inset in Fig. 1B) showed a transient activation of ERK 1/2, consistent with the plate assay measurement. However, the plate assay demonstrated statistical significance with minimal experimental repetition. The maximum ERK activation was achieved after 5 min incubation with EGF, followed by a rapid decrease in the level of phosphorylation.
Fig. 1.
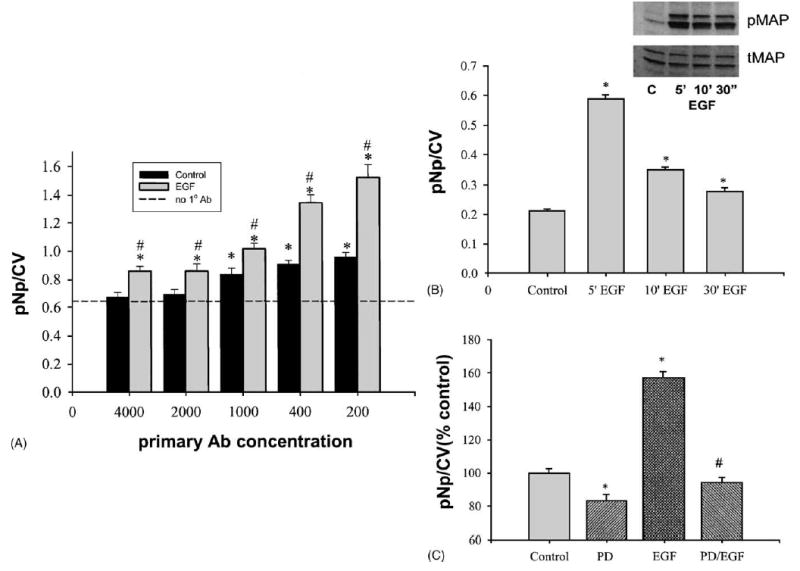
Optimization conditions for the fixed cell-based ELISA for MAPKs. Values are means ± S.E.; n: the number of wells from a 96-well plate. (A) Signal from control cells (treated with 0.001% acetic acid vehicle) vs. EGF-treated (50 ng/ml, 5 min) cells (n = 29) at different primary pMAP Ab concentrations. pNp/CV stands for the pMAP signal normalized to the CV signal. *: Statistically significant (P < 0.05) vs. nonspecific binding (no. 1 Ab); #: statistically significant (P < 0.05) vs. vehicle-treated cells (n = 8). Background (signal from nonspecific binding) was not subtracted from data in this graph, so that the relative amount of background signal could be viewed. (B) Western blot (inset) and plate assay (n = 16) show time-dependent pMAP kinase changes after EGF treatment. pMAP kinase Ab was used at 1:2000 and 1:400 dilutions for these methods, respectively. C: control for the inset; *: statistically significant (P < 0.05) EGF-treated cells vs. vehicle-treated controls. (C) Plate assay results (n = 30) after PD (10 μM, 20 min pretreatment) action. *: Statistically significant (P < 0.05) from control; #: statistically significant (P < 0.05) from EGF-treated cells.
Administration of MEK inhibitor PD-98059 (PD) prevented ERK stimulation by EGF, as well as decreased the basal level of phosphorylation (Fig. 1C). These data further support the specificity of our cell-based ELISA application. For the Western blot, measurement of the total MAP kinase value for normalization required stripping of the phosphokinase signal from the nitrocellulose membrane before reprobing. In the plate assay we ran separate assays of phosphokinase and total kinase, and the final value was normalized to measurements of the number of cells in each well. Because signals from both phosphorylated ERKs (pMAP) and total ERKs (tMAP) linearly increased with cell density (Fig. 2A and B) we used the CV assay for ERK signal normalization in all subsequent assays. While activation of ERKs by EGF treatment was significantly increased, total ERKs did not change with any cell treatments.
Fig. 2.
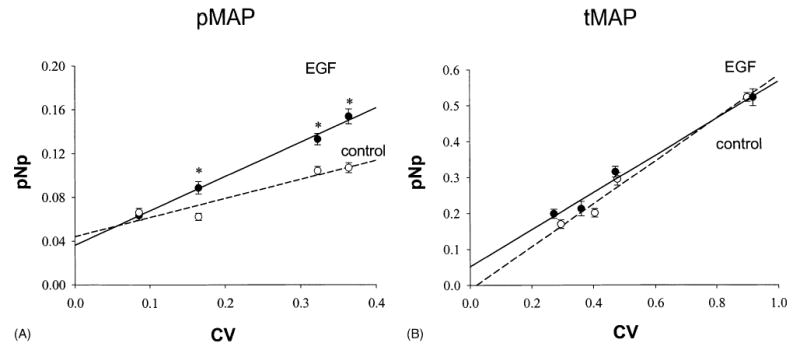
Signals from pMAP kinase (n = 8) and tMAP kinase (n = 8) directly correlate with cell density in both control and EGF treatment groups. Values are means ± S.E.; n: the number of wells from a 96-well plate; *: statistically significant (P < 0.05) EGF-treated cells vs. vehicle-treated controls.
8.2. E2-triggered ERK activations, and inhibition of this by various specific, signaling pathway inhibitors
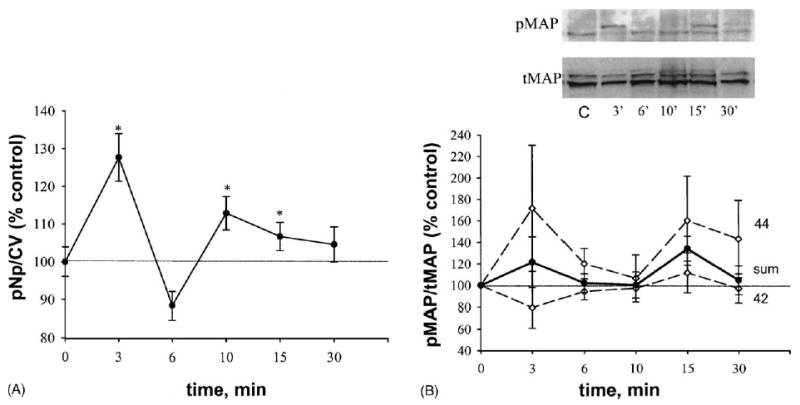
Western blot analysis demonstrated rapid time-dependent pMAP kinase activation in the GH3/B6/F10 cell line after treatment with 1 nM E2 (Fig. 3A). Repeating these immunoblot experiments up to four times still did not show significant changes between treatment and control groups. The plate assay demonstrated a significant difference between control and E2-treated cells after both 3 and then 15–30 min (Fig. 3B, solid line) with few experimental repetitions. When the values for p42 and p44 from Western analysis were summed (see solid line in Fig. 3A), temporal response curves were the same shape in both assays, though significant changes were only evident in the plate assay. Cells with very low mERα (GH3/B6/D9 cells), treated with the same estradiol concentration, did not show any change in ERK status, compared with control (Fig. 3B, dashed line). E2 at a 3 min time-point caused a concentration-dependent phosphorylation of ERK 1/2 with two concentration optima of 10−14 M as well as 10−9 to 10−8 M (Fig. 3C).
Fig. 3.
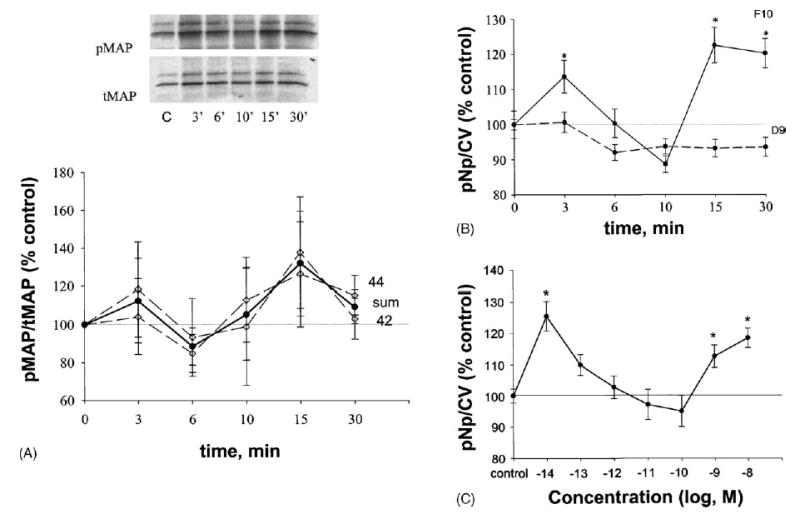
E2 (1 nM) effects on ERK 1/2 phosphorylation. *: Statistical significance (P < 0.05) when compared with ethanol (EtOH, 0.00001%) vehicle-treated controls. Data are represented as % of control level, which was set to 100%. (A) Western analysis (four experiments); each band was scanned to produce a densitometry value and the values presented are means±S.E. “Sum” (solid line) indicates the average between ERK 1 (44) and ERK 2 (42) phosphorylation values. The inset shows a single representative Western blot. C: vehicle-treated control. (B) Plate assay; values are means ± S.E. with 100% set as control; solid line represent E2 action in GH3/B6/F10 cell line (n = 75–90 wells/point taken from six different plates); dash line: D9 (n = 83–90 wells/point taken from three different plates). (C) Plate assay; values are means ± S.E. with 100% set as control (n = 66 wells/point taken from three different plates).
Because others have described several pathways for MAP kinase activation in various cell types [14,32], we next tested those pathways reported to be active in the pituitary lactotroph cell context. We used specific inhibitors for different pathways at each time point where ERK activation had been shown: ICI 187 634 (ICI) and Ag 1468 (AG 14), are antagonists of estrogen and EGF receptors, respectively. Nystatin (Nys) is a cholesterol-binding antibiotic which disrupts caveolar architecture [33]. BAPTA-AM (B-TA) is a Ca2+ chelator. PP2 is an Src kinase inhibitor, and Ly 294002 (Ly) a PI3 kinase inhibitor. As a negative control for inhibitory activity we used AG 9, an inactive analog of AG 14. Most inhibitors, except AG 14 and PP2, did not change the basal level of ERK phosphorylation (Fig. 4), based on the plate assay (A) as well as on immunoblot results (data not shown). Monitoring of cell number in these assays (CV assay) did not demonstrate any change (data not shown); therefore, cell toxicity was not the cause of inhibitions in these assays, as expected, since these inhibitor concentrations were chosen from the scientific literature where no toxicities have been reported previously at these concentrations.
Fig. 4.
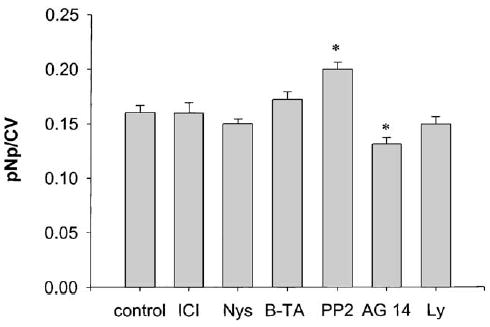
Effects of different types of inhibitors on basal levels of MAP kinase phosphorylation. Cells were pretreated with 1 μM ICI 182, 870 (ICI) for 40 min, 50 μg/ml Nystatin (Nys) for 40 min, 10 μM BAPTA-AM (B-TA) for 40 min, 10 μM PP2 (PP2) for 20 min, 10 μM Ly 294002 (Ly) for 40 min, 250 nM AG 14 tyrphostin (AG 14) for 20 min, 250 nM nonactive tyrphostin analog AG 9 (AG 9) for 20 min or 0.1% DMSO vehicle (control) for 40 min, followed by plate assay. Values are means ± S.E.; n = 120–140 wells from nine different plates; *: statistical significance (P < 0.05) vs. cells treated with DMSO vehicle alone.
In Fig. 5 (and subsequent Figs. 7 and 9), inhibitors were divided into two groups for clarity of presentation. Group A contained compounds that can interfere with receptor–ligand interactions: ICI, AG 14 and its inactive analog AG 9, and Nys. Group B included B-TA, PP2 and Ly, whose substrates are mostly localized in the cell’s cytoplasm adjacent to the cell membrane and are part of the signaling cascades initiated at the membrane. When these inhibitors were used in combination with 1 nM E2 (Fig. 5), all were able to reduce MAP kinase activation at some time points up to 30 min. Group B compounds and Nys all inhibited the response by 3 min. However, receptor inhibitors ICI and AG 14 showed a somewhat later onset of inhibition (6 min) than the other compounds. Interestingly, these compounds also showed blocking effects for a longer time period (30 min) than did Nys and the inhibitors for downstream signaling molecules (panel B). The inactive AG 9 showed no inhibition of ERK activation at any time point.
Fig. 5.
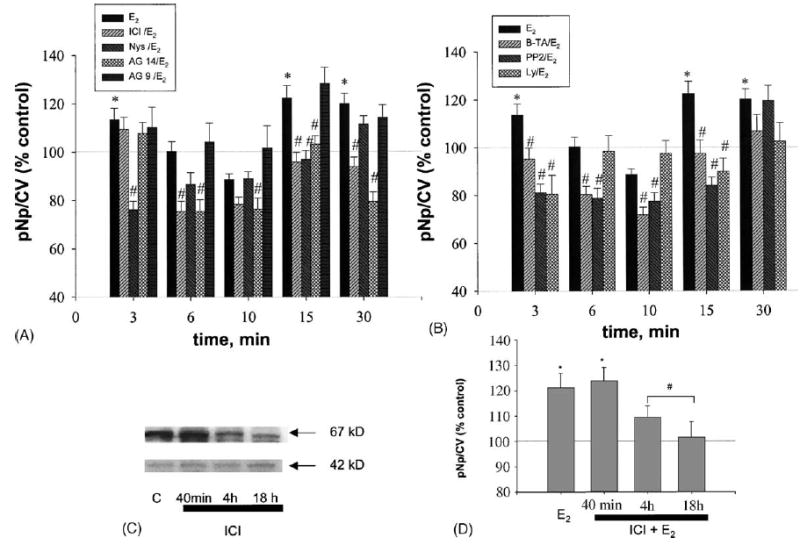
Effects of different inhibitors on E2-induced MAP kinase activation. (A, B) Cells were pretreated with inhibitors (see Fig. 4 for times, concentrations and abbreviations) and then stimulated with E2 (1 nM) for the times indicated. Values are means ± S.E.; n = 40–90 wells from three to six different plates; *: statistical significance for E2 treatment (P < 0.05) vs. vehicle control; #: statistical significance (P < 0.05) vs. time-specific E2 alone stimulated controls. (C) Cell extracts were probed by immunoblot analysis for ERα levels at different times of ICI treatment (upper panel). Total ERK 42 levels were also monitored (lower panel) to demonstrate that a different protein did not change during this treatment time course. (D) The effect of different times of ICI pretreatment was assessed for effects on the 3 min E2-induced ERK activation. Values are means ± S.E.; n = 60 wells from three different experimentsl; *: statistical significance for E2 treatment (P < 0.05) vs. vehicle control; #: statistical significance for ICI treatments compared to 3 min E2 treatment alone (P < 0.05).
Fig. 7.
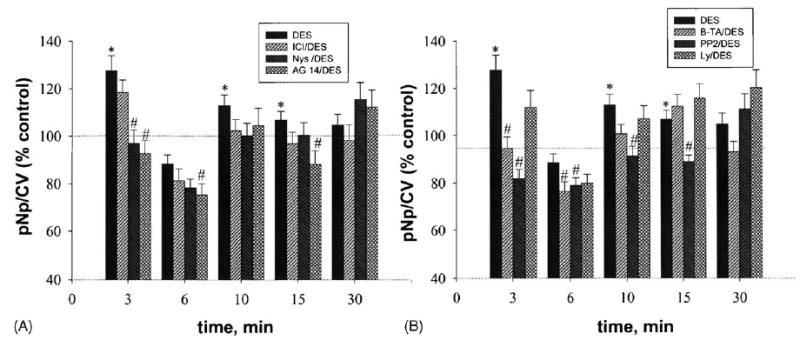
Inhibitors diminish MAP kinase activation by DES at different time points. Cells were pretreated with inhibitors and then stimulated with DES (1 nM). Values are means ± S.E.; n = 39–79 wells from three to six plates; *: statistical significance for DES treatment (P < 0.05) vs. vehicle control; #: statistical significance (P < 0.05) vs. time-specific DES-stimulated values.
Fig. 9.
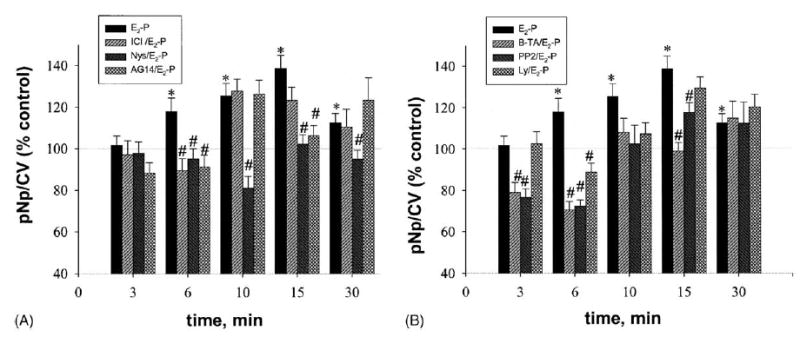
Inhibitors decrease MAP kinase responses to E2–P at different time points. Cells were pretreated with inhibitors and then stimulated with E2–P (1 nM based on E2 present in the conjugate). Values are means ± S.E.; n = 35–90 wells from three to six plates; *: statistical significance for E2–P treatment (P < 0.05) vs. EtOH (0.00001%) vehicle control; #: statistical significance (P < 0.05) vs. time-specific E2–P.
Long treatments with ICI can downregulate ERα protein levels and this could cause inhibitions of estrogen-induced ERK activation. However, we were interested in looking only at acute inhibitions due to ICI competitive antagonism of receptor binding. Therefore we tested the effects of the length of ICI pretreatment on ERα receptor levels via immunoblot analysis (Fig. 5C) and then on ERK activation (Fig. 5D). Since ERα downregulation was not seen at 40 min (only after 4 h of ICI pretreatment), in all our studies we used a 40 min ICI preincubation where protein levels were unaffected. Additionally, these data demonstrate that when ERα protein levels do decline, the E2 induction of ERK activation declines.
8.3. Diethylstilbestrol-triggered ERK activations, and inhibition of this by various specific, signaling pathway inhibitors
DES (1 nM), a synthetic analog of E2, was also tested for its ability to produce rapid ERK activation, using the plate immunoassay. A significant increase in ERK phosphorylation was achieved after 3 min, with a second activation at 10–15 min (Fig. 6A). The second peak of activation was possible, because there was an inactivation (perhaps dephosphorylation) at 6 min, similar to that seen with E2. Comparison to the response curves revealed by immunoblot analysis (Fig. 6B) showed a similar trend, but without significant statistical differences from control, due to large variations in the immunoblot data. Inhibitors were also tested at all time points (Fig. 7). Nys decreased MAP kinase phosphorylation only at 3 min, AG 14 had a later effect (at 15 min), and ICI did not reduce ERK activation significantly (Fig. 7A). B-TA inhibited ERK activation only at 3 min, while PP2 was able to prevent activation at all time points up to 15 min. It appears that PI3 kinase does not participate in DES signaling pathways leading to ERK activation as no statistically significant inhibitions were observed with Ly (Fig. 7B).
Fig. 6.
DES (1 nM) effects on ERK 1/2 phosphorylation. *: Statistical significance (P < 0.05) vs. EtOH (0.00001%) vehicle-treated controls. Data are presented as % of control values, which were set to 100%. (A) Plate assay, means ± S.E.; n = 65–79 wells from six different plates. (B) Western analysis, four experiments, each band scanned to produce a densitometry value; values presented are means ± S.E. “Sum” (solid line) indicates the average between ERK 1 (44) and ERK 2 (42) phosphorylation values. Inset is a representative Western blot where C indicates vehicle-treated control.
8.4. E2–peroxidase activation of ERKs, and inhibition of this via various pathway inhibitors
Since E2–P cannot enter cells rapidly under the conditions we used, we compared its effects on ERK activation and the utilization of signaling pathways, to those of E2 and DES. With this impeded ligand we observed a very different temporal pattern of ERK activation, which was monophasic and delayed (Fig. 8A) compared to the other estrogens tested. Significant stimulation occurred at all times after 6 min, and the maximal stimulation was at 15 min. Immunoblot analysis (Fig. 8B) showed no significant activations, though again a trend toward activation was seen. Specific compound inhibition patterns differed significantly from those seen with E2 and DES (Fig. 9). Nys was able to prevent this delayed ERK activation at all time points. AG 14 was effective as an inhibitor only at 6 and 15 min. ICI and Ly had blocking effects only at 6 min; B-TA and PP2 blocked ERK phosphorylation at 6 and 15 min. Though the ERK activations with this compound were monophasic, some of the inhibitions showed bimodal characteristics.
Fig. 8.
E2–P (1 nM) effects on MAP kinase phosphorylation. *: Statistical significance (P < 0.05) vs. EtOH (0.00001%) vehicle-treated controls. Data are presented as % of control values, which were set to 100%. E2 was administrated at 1 nM (calculated based on the amount of E2 present in the conjugate). (A) Plate assay, means ± S.E.; n = 85–90 wells from six plates. (B) Western analysis, three experiments, each band scanned to produce a densitometry value; values presented are means ± S.E. “Sum” (solid line) indicates the average of ERK 1 (44) and ERK 2 (42) phosphorylation values. The inset shows a Western blot after E2–P treatment at the same time points; C: vehicle-treated control.
9. Discussion
Our studies demonstrated rapid activation of a kinase signaling endpoint (ERKs) by E2 and different estrogenic mimetics. Using a spectrum of compounds that specifically inhibit signaling pathways known to lead to ERK activation, we demonstrated the utilization of all of these mechanisms in pituitary tumor cells bearing membrane ERα. Temporal patterns of activation between different types of estrogens were evident from our studies, and demonstrate why it is important to carefully document mechanistic pathways and their timing. Where a compound did not engage a pathway (for instance, DES and PI3K), differences may signify altered ligand-induced receptor conformations and thus interaction interfaces for signaling partners. Such details should enlighten our search to understand the functional consequences of administering different estrogenic compounds experimentally and therapeutically.
We established a fixed cell-based ELISA method with differences in methodology compared to the independently published method of Versteeg et al. [34]. Comparison of the two protocols reveals that fixation methods for permeabilizing cells and preserving kinase activity through the multiple assay wash steps requires choosing different conditions for different cell types. Signal visualization can be based on any enzymatic reaction, such as peroxidase [34] or alkaline phosphatase (used in our study), giving flexibility in choosing conditions that will give low backgrounds and reaction product compatibility with existing instruments equipped with different wave-length capabilities. Cell permeabilization and wash procedures must utilize appropriate detergents for a given cell type and its membrane constitution. We also tested NP-40, IGEPAL, and Tween-20, and all of them gave only small signal/background ratios in our cell system (data not shown). Only Triton X-100 increased this ratio to the levels seen in our study. The effectiveness of this method is also strongly dependent upon primary Ab specificity and signal strength. The primary anti-phospho 42/44 MAP kinase Ab that we used gave some additional bands in our Western analysis. However, the intensity of these bands was not dependent upon any cell treatment that we applied, and was thus part of the background of each measurement. Therefore, our fixed cell-based ELISA provides a quantitative measurement of ERK protein expression and phosphorylation for pituitary lactotrophs, and could be applied to a variety of investigations of the regulation of this system, or to other systems with appropriate optimization.
Rapid and transient ERK 1/2 phosphorylation after E2 action has been previously established in a variety of different cell types. These include MCF-7 breast cancer cells [16], endothelial cells [35], cells of neuronal origin [36], adipocytes [37], and a bone cell line [38]. We showed that the GH3/B6/F10 rat pituitary tumor cell line (with high mERα expression) produced a bimodal E2-induced ERK activation during a 30 min time period after hormone application. The level of mER was critical for those responses, since in GH3/B6/D9 cells (with very low mER expression [28]) E2 did not have any effect on the ERKs during the same time frame. Others who have demonstrated ERK activation in non-selected GH3 cells [39] showed different patterns of activation, which may be explained by their use of other culture conditions (48–72 h culture in DMEM with 10% 3× dextran-coated charcoal-stripped FBS) or the pretreatment of their cells with 100 nM ICI for 2–3 days which would significantly lower ERα levels. Additionally, differences may be due to the fact that our cells were previously selected for the ability to respond to E2 along with their increased levels of mERα.
We were able to demonstrate a gap in ERK 1/2 activation between 3 and 15 min peaks—apparent inactivation below baseline levels of phosphorylation. These periods of “dephosphorylation” demonstrated by our data could be the result of phosphatase activation, desensitization of the stimulatory pathways, and/or kinase degradation (though such rapid recovery argues against the latter). Such deactivation and reactivation profiles may be very important for specific estrogenic stimulatory effects, as other hormones are known to operate in an oscillatory fashion. Concentration-dependent effects of E2 on ERK phosphorylation correlates well with a bimodal dose-response curve for prolactin release observed in our cells previously [40].
DES was able to mimic the bimodal E2 pattern of activation with a slight time offset in the second peak of activation Comparison of Western blots showed that DES preferentially stimulated ERK 1. ERK isoforms can be discriminating with regard to the target proteins they phosphorylate: ERK 1 targets Elk1, whereas ERK 2 exhibits a preference for c-Myc [41]. Other differences are shown by ERK 1−/− mice being viable and fertile, while disruption of the ERK 2 locus leads to embryonic lethality [42]. However, the specific role of the two ERKs is still largely unexplained. Different E2 versus DES actions on MAPK phosphorylation may elicit different biological responses, but this area is still relatively unexplored. E2–P generated a pattern of ERK activation that was delayed in time and was no longer bimodal. Impeded ligands may experience a limitation of movement in the plasma membrane, delaying this activation. Other differences are that each molecule of peroxidase carries two to three molecules of E2, while E2 and DES act as monovalent estrogens. Such multivalency of impeded ligand conjugates may artificially cluster ligand-bound receptors in the membrane, in addition to limiting movement. With the E2–BSA conjugated impeded ligand, we also previously saw different temporal response patterns of response in comparison to E2 stimulation [21].
Multiple upstream regulators for ERK stimulation by steroids in one tissue have not previously been well established; in other studies the involvement of individual pathways in a given cell type have been demonstrated. Collectively, pathways previously identified in various cell types include action through the EGF receptor/Shc phosphorylation [11,16,43], Src kinase [44,45], intracellular Ca2+ level changes [46], and PI3 kinase [37]. Most of these signaling molecules belong to complexes which reside in specific plasma membrane structures called caveolae [47]. Our combined studies using specific inhibitors for each of these pathways demonstrated the activation of multiple pathways in a single cell context. Nys (disrupting caveolar membrane organization), PP2 (inhibiting Src kinase) and B-TA (Ca2+ chelator) all affected both phases of E2 and DES responses, as well as the monophasic E2–P response. Others [39] have reported that in GH3 cells, Src did not participate in the MAP kinase activation cascade, nor was it phosphorylated by estrogen treatment. However, this discrepancy could be explained by differences between the GH3 cell sublines. Such differences in the regulation of signal cascades between GH3 cell type variants have been previously demonstrated [48].
Both DES and E2–P were insensitive or mostly insensitive to ICI treatment, although this compound can block E2 and DES action on the genomic level. E2 stimulation was insensitive to ICI blockage at its earliest time point assessed (3 min). This could mean either that the ER that participates at the beginning of the response is a unique protein, or that the unique conformation of ER in the plasma membrane, when bound to these compounds early in the process, prevents binding competition by ICI. Our past studies indicated that ERβ was not present in GH3/B6/F10 cells at the protein level [20,28], so we do not think that it is a participant in this response.
Only E2 was able to activate the PI3 kinase pathway, shown by the Ly insensitivity of E2–P responses (except at 6 min) and of DES. The EGF receptor antagonist AG 14 was more potent for E2- and DES-stimulated responses, although it was able to block E2–P action at some stages. Again, it is possible that different estrogenic compounds create receptor conformations that are more or less likely to interface with other signaling partners. Such knowledge may facilitate the tailoring of compounds for estrogenic treatments or exposure preventions based on their specific pathway engagement leading to particular functions.
Although E2–P was active in stimulating ERKs at 30 min, no pathway inhibitors tested were capable of blocking this later stage of its activation, with the exception of Nys, a compound that disrupts membranes. Perhaps that is because this impeded ligand–ER complex cannot leave the membrane, and so is still subject to membrane inactivations at this late stage. Most inhibitors cannot affect ERK activation by unimpeded estrogens as late as 30 min; maybe the response cascade has passed beyond the influence of the membrane signaling molecules at this point. ERK activation is thus a downstream event, which cannot be stopped by upstream molecule inhibitors once the signal has reached beyond this level.
The ability of inhibitors to cause phosphorylations and apparent dephosphorylations of kinases on their own are not often displayed in studies of these pathways. Reduction of ERK basal level phosphorylation by AG 14 could be due to the presence of some amount of EGF-like factor tethered to cell surfaces [49] that could be released during the 48 h preincubation. If this occurred, then AG 14 could have had its antagonistic effect on the cell-introduced amount of EGF ligand. Alternatively, AG 14 could activate some phosphatases, as tyrphostin increases alkaline phosphatase activity in Caco-2 cells [50]; AG 14 belongs to the tyrphostin family of inhibitors. PP2’s action as an ERK stimulator can possibly be explained by the ability of this compound to affect enzymes other than Src kinases at a concentration of 10 μM [6,51].
There are still inadequate data to conclude how the membrane estrogen receptor is connected to the cell membrane and to each of its signaling partners. A possible scenario is that ERs complex with other signaling molecules such as G proteins or G protein-coupled receptors (GPCR). Our data demonstrate that more than one pathway is needed for ERK activation, since blocking a single pathway is sufficient to block this downstream response. However, all of the signaling mediators analyzed in our study can belong to one signaling scheme which starts with G protein coupling [10,11,14,19]. Other membrane steroid receptors have recently been shown to interact with G proteins directly [52].
Quantitative methods for measuring ERK activation in a cell model selected to display membrane-initiated estrogen effects allowed us to assay multiple signaling pathways and compare them to one another. Thus we could demonstrate that multiple pathways are involved, and that different types of estrogenic ligands have unique temporal signaling patterns. The combinatorial signaling contributions to this important estrogen-induced regulatory pathway also demonstrate that our understanding of these important processes and their underlying mechanisms is only beginning. The fact that different compounds, including xenoestrogens, affect the signaling machinery with subtle but measurable differences, leads to the hope that we can utilize this knowledge for prevention and remediation of negative estrogenic effects.
Acknowledgments
This work was supported by NIEHS grant no. 010987. We are grateful for the skilled editing and scientific comments of Dr. David Konkel.
References
- 1.Watson CS. Signaling themes shared between peptide and steroid hormones at the plasma membrane. In: Science’s signal transduction knowledge environment; 1999. http://www.stke.org/cgi/content/full/OC_sigtrans;1999/12/pel [DOI] [PMC free article] [PubMed]
- 2.Ho KJ, Liao JK. Nonnuclear actions of estrogen. Arterioscler Thromb Vasc Biol. 2002;22(12):1952–61. doi: 10.1161/01.atv.0000041200.85946.4a. [DOI] [PubMed] [Google Scholar]
- 3.Hamilton TH. Control by estrogen of genetic transcription and translation. Science. 1968;161:649–61. doi: 10.1126/science.161.3842.649. [DOI] [PubMed] [Google Scholar]
- 4.Castoria GMV, Di Domenico M, Bilancio A, Ametrano D, Migliaccio A, Auricchio F. Non-transcriptional action of oestradiol and progestin triggers DNA synthesis. EMBO J. 1999;18(9):2500–10. doi: 10.1093/emboj/18.9.2500. [DOI] [PMC free article] [PubMed] [Google Scholar]
- 5.Kousteni S, Bellido T, Plotkin LI, O’Brien CA, Bodenner DL, Han L, et al. Nongenotropic, sex-nonspecific signaling through the estrogen or androgen receptors: dissociation from transcriptional activity. Cell. 2001;104(5):719–30. [PubMed] [Google Scholar]
- 6.Haynes MP, Li L, Sinha D, Russell KS, Hisamoto K, Baron R, et al. Src kinase mediates phosphatidylinositol 3-kinase/Akt-dependent rapid endothelial nitric-oxide synthase activation by estrogen. J Biol Chem. 2003;278(4):2118–23. doi: 10.1074/jbc.M210828200. [DOI] [PubMed] [Google Scholar]
- 7.Nadal A, Rovira JM, Laribi O, Leonquinto T, Andreu E, Ripoll C, et al. Rapid insulinotropic effect of 17-β-estradiol via a plasma membrane receptor. FASEB J. 1998;12(13):1341–8. doi: 10.1096/fasebj.12.13.1341. [DOI] [PubMed] [Google Scholar]
- 8.Aronica SM, Kraus WL, Katzenellenbogen BS. Estrogen action via the cAMP signaling pathway: stimulation of adenylate cyclase and cAMP-regulated gene transcription. Proc Natl Acad Sci USA. 1994;91:8517–21. doi: 10.1073/pnas.91.18.8517. [DOI] [PMC free article] [PubMed] [Google Scholar]
- 9.Prevot V, Croix D, Rialas CM, Poulain P, Fricchione GL, Stefano GB, et al. Estradiol coupling to endothelial nitric oxide stimulates gonadotropin-releasing hormone release from rat median eminence via a membrane receptor. Endocrine. 1999;140(2):652–9. doi: 10.1210/endo.140.2.6484. [DOI] [PubMed] [Google Scholar]
- 10.Doolan CM, Harvey BJ. A Galphas protein-coupled membrane receptor, distinct from the classical oestrogen receptor, transduces rapid effects of oestradiol on [Ca(2+)](i) in female rat distal colon. Mol Cell Endocrinol. 2003;199(12):87–103. doi: 10.1016/s0303-7207(02)00303-9. [DOI] [PubMed] [Google Scholar]
- 11.Filardo EJ, Quinn JA, Bland KI, Frackelton AR. Estrogen-induced activation of Erk-1 and Erk-2 requires the G protein-coupled receptor homolog, GPR30, and occurs via trans-activation of the epidermal growth factor receptor through release of HB-EGF. Mol Endocrinol. 2000;14(10):1649–60. doi: 10.1210/mend.14.10.0532. [DOI] [PubMed] [Google Scholar]
- 12.Kelly MJ, Lagrange AH, Wagner EJ, Ronnekleiv OK. Rapid effects of estrogen to modulate G protein-coupled receptors via activation of protein kinase A and protein kinase C pathways. Steroids. 1999;64(12):64–75. doi: 10.1016/s0039-128x(98)00095-6. [DOI] [PubMed] [Google Scholar]
- 13.English J, Pearson G, Wilsbacher J, Swantek J, Karandikar M, Xu S, et al. New insights into the control of MAP kinase pathways. Exp Cell Res. 1999;253(1):255–70. doi: 10.1006/excr.1999.4687. [DOI] [PubMed] [Google Scholar]
- 14.Belcheva MM, Coscia CJ. Diversity of G protein-coupled receptor signaling pathways to ERK/MAP kinase. Neurosignals. 2002;11(1):34–44. doi: 10.1159/000057320. [DOI] [PMC free article] [PubMed] [Google Scholar]
- 15.Moelling K, Schad K, Bosse M, Zimmermann S, Schweneker M. Regulation of Raf-Akt cross-talk. J Biol Chem. 2002;277(34):31099–106. doi: 10.1074/jbc.M111974200. [DOI] [PubMed] [Google Scholar]
- 16.Migliaccio A, Didomenico M, Castoria G, Defalco A, Bontempo P, Nola E, et al. Tyrosine kinase/P21 (RAS)/MAP-kinase pathway activation by estradiol–receptor complex in MCF-7 cells. EMBO J. 1996;15(6):1292–300. [PMC free article] [PubMed] [Google Scholar]
- 17.Simoncini T, Hafezi-Moghadam A, Brazil DP, Ley K, Chin WW, Liao JK.Interaction of oestrogen receptor with the regulatory subunit of phosphatidylinositol-3-OH kinase Nature 20004076803538–41.[in process citation] [DOI] [PMC free article] [PubMed] [Google Scholar]
- 18.Keyse SM. Protein phosphatases and the regulation of mitogen-activated protein kinase signalling. Curr Opin Cell Biol. 2000;12(2):186–92. doi: 10.1016/s0955-0674(99)00075-7. [DOI] [PubMed] [Google Scholar]
- 19.Razandi M, Pedram A, Park ST, Levin ER. Proximal events in signaling by plasma membrane estrogen receptors. J Biol Chem. 2003;278(4):2701–12. doi: 10.1074/jbc.M205692200. [DOI] [PubMed] [Google Scholar]
- 20.Norfleet AM, Thomas ML, Gametchu B, Watson CS. Estrogen receptor-α detected on the plasma membrane of aldehyde-fixed GH3/B6/F10 rat pituitary tumor cells by enzyme-linked immunocytochemistry. Endocrine. 1999;140(8):3805–14. doi: 10.1210/endo.140.8.6936. [DOI] [PubMed] [Google Scholar]
- 21.Pappas TC, Gametchu B, Watson CS. Membrane estrogen receptors identified by multiple antibody and impeded ligand labeling. FASEB J. 1995;9(5):404–10. doi: 10.1096/fasebj.9.5.7896011. [DOI] [PubMed] [Google Scholar]
- 22.Dan P, Cheung JC, Scriven DR, Moore ED. Epitope dependent localization of estrogen receptor-α, but not β, in en face arterial endothelium. Am J Physiol Heart Circ Physiol. 2002;284(4):H1295–306. doi: 10.1152/ajpheart.00781.2002. [DOI] [PubMed] [Google Scholar]
- 23.Powell CE, Soto AM, Sonnenschein C. Identification and characterization of membrane estrogen receptor from MCF7 estrogen-target cells. J Steroid Biochem Mol Biol. 2001;77(23):97–108. doi: 10.1016/s0960-0760(01)00040-1. [DOI] [PubMed] [Google Scholar]
- 24.Taleghany N, Sarajari S, DonCarlos LL, Gollapudi L, Oblinger MM. Differential expression of estrogen receptor alpha and beta in rat dorsal root ganglion neurons. J Neurosci Res. 1999;57(5):603–15. [PubMed] [Google Scholar]
- 25.Chambliss KL, Yuhanna IS, Mineo C, Liu P, German Z, Sherman TS, et al. Estrogen receptor alpha and endothelial nitric oxide synthase are organized into a functional signaling module in caveolae. Circ Res. 2000;87(11):E44–52. doi: 10.1161/01.res.87.11.e44. [DOI] [PubMed] [Google Scholar]
- 26.Razandi M, Oh P, Pedram A, Schnitzer J, Levin ER. ERs associate with and regulate the production of caveol in: implications for signaling and cellular actions. Mol Endocrinol. 2002;16(1):100–15. doi: 10.1210/mend.16.1.0757. [DOI] [PubMed] [Google Scholar]
- 27.Anderson RGW, Jacobson K.Cell biology—a role for lipid shells in targeting proteins to caveolae, rafts, and other lipid domains Science 200229655741821–5.[review] [DOI] [PubMed] [Google Scholar]
- 28.Campbell CH, Watson CS. A comparison of membrane vs. intracellular estrogen receptor-α in GH3/B6 pituitary tumor cells using a quantitative plate immunoassay. Steroids. 2001;66:727–36. doi: 10.1016/s0039-128x(01)00106-4. [DOI] [PubMed] [Google Scholar]
- 29.Norfleet AM, Clarke C, Gametchu B, Watson CS. Antibodies to the estrogen receptor-α modulate prolactin release from rat pituitary tumor cells through plasma membrane estrogen receptors. FASEB J. 2000;14:157–65. doi: 10.1096/fasebj.14.1.157. [DOI] [PMC free article] [PubMed] [Google Scholar]
- 30.Gaetjens E, Pertschuk LP. Synthesis of fluorescein labelled steroid hormone–albumin conjugates for the fluorescent histochemical detection of hormone receptors. J Steroid Biochem. 1980;13:1001–3. doi: 10.1016/0022-4731(80)90177-6. [DOI] [PubMed] [Google Scholar]
- 31.Pappas TC, Gametchu B, Yannariello-Brown J, Collins TJ, Watson CS. Membrane estrogen receptors in GH3/B6 cells are associated with rapid estrogen-induced release of prolactin. Endocrine. 1994;2:813–22. [Google Scholar]
- 32.Lowes VL, Ip NY, Wong YH. Integration of signals from receptor tyrosine kinases and g protein-coupled receptors. Neurosignals. 2002;11(1):5–19. doi: 10.1159/000057317. [DOI] [PubMed] [Google Scholar]
- 33.Ushio-Fukai M, Hilenski L, Santanam N, Becker PL, Ma Y, Griendling KK, et al. Cholesterol depletion inhibits epidermal growth factor receptor transactivation by angiotensin II in vascular smooth muscle cells: role of cholesterol-rich microdomains and focal adhesions in angiotensin II signaling. J Biol Chem. 2001;276(51):48269–75. doi: 10.1074/jbc.M105901200. [DOI] [PubMed] [Google Scholar]
- 34.Versteeg HH, Nijhuis E, van den Brink GR, Evertzen M, Pynaert GN, van Deventer SJ, et al. A new phosphospecific cell-based ELISA for p42/p44 mitogen-activated protein kinase (MAPK), p38 MAPK, protein kinase B and cAMP-response-element binding protein. Biochem J. 2000;350(Pt 3):717–22. [PMC free article] [PubMed] [Google Scholar]
- 35.Russell KS, Haynes MP, Sinha D, Clerisme E, Bender JR. Human vascular endothelial cells contain membrane binding sites for estradiol, which mediate rapid intracellular signaling. Proc Natl Acad Sci USA. 2000;97(11):5930–5. doi: 10.1073/pnas.97.11.5930. [DOI] [PMC free article] [PubMed] [Google Scholar]
- 36.Watters JJ, Campbell JS, Cunningham MJ, Krebs EG, Dorsa DM. Rapid membrane effects of steroids in neuroblastoma cells—effects of estrogen and mitogen activated protein kinase signalling cascade and C-FOS immediate early gene transcription. Endocrine. 1997;138(9):4030–3. doi: 10.1210/endo.138.9.5489. [DOI] [PubMed] [Google Scholar]
- 37.Dos Santos EG, Dieudonne MN, Pecquery R, Le MV, Giudicelli Y, Lacasa D. Rapid nongenomic E2 effects on p42/p44 MAPK, activator protein-1, and cAMP response element binding protein in rat white adipocytes. Endocrine. 2002;143(3):930–40. doi: 10.1210/endo.143.3.8678. [DOI] [PubMed] [Google Scholar]
- 38.Endoh H, Sasaki H, Maruyama K, Takeyama K, Waga I, Shimizu T, et al. Rapid activation of MAP kinase by estrogen in a bone cell line. Biochem Biophys Res Commun. 1997;235(1):99–102. doi: 10.1006/bbrc.1997.6746. [DOI] [PubMed] [Google Scholar]
- 39.Watters JJ, Chun TY, Kim YN, Bertics PJ, Gorski J. Estrogen modulation of prolactin gene expression requires an intact mitogen-activated protein kinase signal transduction pathway in cultured rat pituitary cells. Mol Endocrinol. 2000;14(11):1872–81. doi: 10.1210/mend.14.11.0551. [DOI] [PubMed] [Google Scholar]
- 40.Watson CS, Norfleet AM, Pappas TC, Gametchu B. Rapid actions of estrogens in GH3/B6 pituitary tumor cells via a plasma membrane version of estrogen receptor-α. Steroids. 1999;64:5–13. doi: 10.1016/s0039-128x(98)00107-x. [DOI] [PubMed] [Google Scholar]
- 41.Denhardt DT. Signal-transducing protein phosphorylation cascades mediated by Ras/Rho proteins in the mammalian cell: the potential for multiplex signalling. Biochem J. 1996;318(Pt 3):729–47. doi: 10.1042/bj3180729. [DOI] [PMC free article] [PubMed] [Google Scholar]
- 42.Pouyssegur J, Lenormand P. Fidelity and spatio-temporal control in MAP kinase (ERKs) signalling. Eur J Biochem. 2003;270(16):3291–9. doi: 10.1046/j.1432-1033.2003.03707.x. [DOI] [PubMed] [Google Scholar]
- 43.Levin ER. Bidirectional signaling between the estrogen receptor and the epidermal growth factor receptor. Mol Endocrinol. 2003;17(3):309–17. doi: 10.1210/me.2002-0368. [DOI] [PubMed] [Google Scholar]
- 44.Song RX, McPherson RA, Adam L, Bao Y, Shupnik M, Kumar R, et al. Linkage of rapid estrogen action to MAPK activation by ERalpha-Shc association and Shc pathway activation. Mol Endocrinol. 2002;16(1):116–27. doi: 10.1210/mend.16.1.0748. [DOI] [PubMed] [Google Scholar]
- 45.Nethrapalli IS, Singh M, Guan X, Guo Q, Lubahn DB, Korach KS, et al. Estradiol (E2) elicits SRC phosphorylation in the mouse neocortex: the initial event in E2 activation of the MAPK cascade? Endocrine. 2001;142(12):5145–8. doi: 10.1210/endo.142.12.8546. [DOI] [PubMed] [Google Scholar]
- 46.Improta-Brears T, Whorton AR, Codazzi F, York JD, Meyer T, McDonnell DP. Estrogen-induced activation of mitogen-activated protein kinase requires mobilization of intracellular calcium. Proc Natl Acad Sci USA. 1999;96(8):4686–91. doi: 10.1073/pnas.96.8.4686. [DOI] [PMC free article] [PubMed] [Google Scholar]
- 47.Razani B, Woodman SE, Lisanti MP. Caveolae: from cell biology to animal physiology. Pharmacol Rev. 2002;54(3):431–67. doi: 10.1124/pr.54.3.431. [DOI] [PubMed] [Google Scholar]
- 48.Manfroid I, Martial JA, Muller M. Inhibition of protein phosphatase ppl in gh3b6, but not in gh3 cells, activates the mek/erk/c-fos pathway and the human prolactin promoter, involving the coactivator cbp/p300. Mol Endocrinol. 2001;15(4):625–37. doi: 10.1210/mend.15.4.0615. [DOI] [PubMed] [Google Scholar]
- 49.Iwamoto R, Yamazaki S, Asakura M, Takashima S, Hasuwa H, Miyado K, et al. Heparin-binding EGF-like growth factor and ErbB signaling is essential for heart function. Proc Natl Acad Sci USA. 2003;100(6):3221–6. doi: 10.1073/pnas.0537588100. [DOI] [PMC free article] [PubMed] [Google Scholar]
- 50.Basson MD, Emenaker NJ, Rashid Z. Effects of modulation of tyrosine phosphorylation on brush border enzyme activity in human Caco-2 intestinal epithelial cells. Cell Tissue Res. 1998;292(3):553–62. doi: 10.1007/s004410051084. [DOI] [PubMed] [Google Scholar]
- 51.Bain J, McLauchlan H, Elliott M, Cohen P. The specificities of protein kinase inhibitors: an update. Biochem J. 2003;371(Pt 1):199–204. doi: 10.1042/BJ20021535. [DOI] [PMC free article] [PubMed] [Google Scholar]
- 52.Zhu Y, Rice CD, Pang Y, Pace M, Thomas P. Cloning, expression, and characterization of a membrane progestin receptor and evidence it is an intermediary in meiotic maturation of fish oocytes. Proc Natl Acad Sci USA. 2003;100(5):2231–6. doi: 10.1073/pnas.0336132100. [DOI] [PMC free article] [PubMed] [Google Scholar]