

Abstract
There is a critical need for data-mining methods that can identify SNPs that predict among-individual variation in a phenotype of interest and reverse-engineer the biological network of relationships between SNPs, phenotypes, and other factors. This problem is both challenging and important in light of the large number of SNPs in many genes of interest and across the human genome. A potentially fruitful form of exploratory data analysis is the Bayesian or Belief network. A Bayesian or Belief network provides an analytic approach for identifying robust predictors of among-individual variation in a disease endpoints or risk factor levels. We have applied Belief networks to SNP variation in the human APOE gene and plasma apolipoprotein E levels from two samples: 702 African-Americans from Jackson, MS, and 854 non-Hispanic whites from Rochester, MN. Twenty variable sites in the APOE gene were genotyped in both samples. In Jackson, MS, SNPs 4036 and 4075 were identified to influence plasma apoE levels. In Rochester, MN, SNPs 3937 and 4075 were identified to influence plasma apoE levels. All three SNPs had been previously implicated in affecting measures of lipid and lipoprotein metabolism. Like all data-mining methods, Belief networks are meant to complement traditional hypothesis-driven methods of data analysis. These results document the utility of a Belief network approach for mining large scale genotype–phenotype association data.
Keywords: belief networks, Bayesian networks, genetic epidemiology, apolipoprotein E, SNPs, graphical modeling
INTRODUCTION
Progress in identifying DNA sequence variation in a large number of biological, expressional, and positional candidate genes, along with the emerging availability of a genomewide collection of single nucleotide polymorphisms (SNPs), indicates a need for a data-mining approach for genotype–phenotype studies. Data mining, in this context, is a process to extract previously unsuspected information or patterns, such as relationships among variables, from data in large databases (Han and Kamber, 2001). Classical statistical methods, for example multivariable regression or contingency table analysis, are ill suited for high dimensional problems, such as large-scale genotype–phenotype association studies, because they are “single inference procedures” instead of the more appropriate “joint inference procedures,” and methods for combining results across multiple “single inference procedures” are inefficient (Rothman, 1990). Data-mining methods are not meant to replace classical statistical methods, and ideally the two would be used in a complementary fashion. The former can be considered as hypothesis-generating methods, while the latter are for hypothesis testing (Rothman and Greenland, 1998).
A Bayesian or Belief network modeling provides a robust analytic approach for identifying both predictors of between-individual variation in a phenotype of interest and other potentially interesting interactions between genetic, physiological, and environmental variables within the (genotype–phenotype) domain of interest. A Belief network is a graphical representation of a joint probability distribution among a number of random variables (Pearl, 1988). Belief network analyses are, therefore, “joint inference procedures.” The network’s topology depicts a graphical relationship among the variables, or nodes (i.e., which variables are dependent on or conditionally independent of which other variables). The edges connecting the nodes indicate dependence. The edge directionality is somewhat arbitrary (see Discussion) and is not intended to imply a causation; rather, it is employed for the mathematical convenience and to distinguish (again, somewhat arbitrarily) between the “parent” and the “offspring” nodes. The edge strength indicates the relative magnitude of the dependency between two variables, given the other interrelationships. An edge between two SNPs is indicative of strong linkage disequilibrium, and, therefore, Belief networks can simultaneously take into account linkage disequilibrium while doing genotype–phenotype association analyses.
Fortunately, in a typical application in human genetics, researchers are primarily interested in predicting only one or two primary variables (e.g., a disease endpoint or risk factor level), and it is typically the case that these target variables are influenced by only a limited number of other variables (a property known as local sparseness). As a result, application of Belief networks to even a large number of SNPs allows one to isolate the subnetwork around a target variable and examine the relationship between this variable and its predictors. In many cases, the target variable is one for which investigators may be interested in predicting a state or level in future clinical applications. One formal definition of such a subnetwork is known as the Markov blanket of the variable of interest (Pearl, 1988). By definition, the Markov blanket of a node A is the “parents” of A, the “children” of A, and the nodes sharing a “child” with A. Given its Markov blanket, the target variable is independent of all of the other variables in the network, and dependencies within the Markov blanket may be checked for statistical robustness using bootstrapping, cross-validation, information-theoretic, and Bayesian (posterior probability) criteria. A useful introduction to Belief networks can be found in Heckerman (1995) and, in a less formal fashion, Krause (1998).
APOE encodes a 299 amino acid single-chain protein that is a crucial factor in cholesterol and triglycerides metabolism and transport. In humans, three common protein isoforms are known: E2, E3, and E4. Population-based and clinical case-control studies have consistently revealed an association of the APOE isoforms with cardiovascular disease, cardiovascular disease risk factor levels, and Alzheimer’s disease (Utterman, 1987; Mahley and Rall, 2000). In addition to the common APOE isoforms, there is considerable other APOE gene variation that may be related to interindividual differences in traits of interest. Lai et al. 1998 generated high-density SNP maps around the human APOE locus on chromosome 19 and identified 10 SNPs showing a large allele frequency differential between populations. Stengård et al. 2002 identified multiple APOE SNP variations influencing plasma apoE levels.
In this study, Belief networks were applied to SNP variation in the human APOE gene and plasma lipid and apolipoprotein levels from two samples: African-Americans from Jackson, MS, and non-Hispanic whites from Rochester, MN. This study had three objectives: 1) to evaluate Belief Network methods, for the first time, in assessing the association between disease risk factors levels and human gene variation, 2) to determine whether the Belief network methods identified the previously implicated APOE gene variations as predictors of the plasma apoE levels, and 3) to identify other SNPs in the APOE gene influencing plasma apoE levels, as well as other potentially interesting and previously unsuspected dependencies.
MATERIALS AND METHODS
The reader is referred to Stengård et al. 2002 and Nickerson et al. 2000 for a detailed description of the data used in this study. APOE gene variation was characterized in two stages. In the first stage, 5.5 kb encompassing the APOE gene were sequenced in a sample of 72 individuals from multiple populations. Subsequently, 20 variable sites were scored in a sample of 702 individuals from Jackson, MS, and 854 individuals from Rochester, MN. Four SNPs out of these 20 are located in the coding region of the APOE gene, including sites 3937 and 4075 that code for the well-known E2, E3, and E4 protein isoforms. In addition, the following data were available: levels of plasma cholesterol, high-density lipoprotein cholesterol, triglycerides, and apolipoproteins E, AI, and B. Because of allele frequency differences between the two samples, and because of the overwhelming influence of population-of-origin when the samples were pooled (see Results), results are presented here separately for the two samples.
The Belief networks were constructed, analyzed, and visualized using freely available open-source libraries (Intel Research Open-Source Probabilistic Networks Library (PNL), www.intel.com/research/mrl/pnl/ and University of Helsinki B-course, b-course.cs.helsinki.fi) with various source code modifications related to the model selection and heuristic search algorithms, and bootstrap and simulations framework implementations. The network topologies that scored the highest posterior probabilities (a Bayesian scoring criterion based largely on marginal likelihood computations; see Heckerman (1995) and references therein) were chosen as ones representing the best predictive relationships among all of the input variables. The BIC (Bayesian information criterion) approximation (Schwarz, 1978) of the posterior probability criterion was also used when constructing some of the networks.
A multinomial model for the data was assumed because the majority of the variables (SNPs, race, gender) were discrete, and the remaining variables were discretized into 10 (or fewer) categories. Discretizing into fewer categories led to generating more dependencies in the Markov blankets of the nodes of interest (higher sensitivity), which counterbalanced the loss of information (because of discretization) when discovering potentially interesting dependencies. A simple hybrid multinomial/linear Gaussian model was also tried (results not shown), leading to topologically different Belief networks that made much less biological sense. Ideally, a sophisticated hybrid model (in which “children” of the multinomial nodes can be linear Gaussian) would represent the best of both worlds. We are presently implementing such a model. For now, assuming the purely multinomial model with varying degrees of discretization is indicated in our context (SNP databases). Searching through model space was performed by hill-climbing with random restarts, until the Belief network converged to a stable topology. As a rule, about ten million network topologies were evaluated for each experiment, requiring no more than 5–15 CPU minutes on a Pentium IV workstation. Other search methods, such as simulated annealing and beam search, were tried as well (usually leading to the topologically very similar networks)—however, they proved to be somewhat slower to converge. In general, the resulting Belief network topologies proved to be extremely robust to alterations in search algorithm and topology priors, notably in the Markov neighborhoods of the nodes of interest (apoE levels).
Once a Belief network was constructed from the data, we were interested in estimating the significance of particular features of the network, such as the strength of the relationship between two variables. The magnitude of the relationship between two nodes is defined as the edge strength. The edge strength between two nodes is expressed as the ratio of posterior probabilities of the network with the edge present versus absent. Therefore, the higher the number, the more support there is for that particular edge. A complementary way of assessing the significance of an edge is to apply nonparametric bootstrapping with replacement (Friedman et al., 1999). For the application reported here, 500-fold bootstrap was used. For each bootstrap sample, a Belief network is created and the edge of interest is scored as present or absent. For each edge of interest, the number of times out of 500 that it is present in the bootstrap samples is calculated and expressed as a percentage. In the applications presented here, a bootstrap value of greater than 75% is considered significant evidence for the existence of an edge, and a bootstrap value of greater than 95% is considered highly significant evidence. These cut-off values are stricter than those recently used in the area of gene-array expression analysis (Friedman et al., 2000). Like other cut-off values for “statistical significance,” the exact number is rather arbitrary, and interested readers are encouraged to adjust the demarcations and labels according to their own interest and application.
SIMULATION EXPERIMENTS
Although both bootstrap and posterior probability criterion can validate the reconstructed networks, we have also carried out a series of simulation experiments to test the accuracy of the network topology reconstruction by using artificial datasets generated from the known (“true,” predefined) Belief networks. We have largely followed the simulation schemes described by Sprites and Meek (1995) and Myllymaki et al. 2002; however, our model networks were closer to the actual (APOE) datasets analyzed in this study. For simplicity, only a multinomial model was assumed. The model networks consisted of 25 and 50 nodes and reflected different amounts of “sparseness” (average number of edges connected to a node being set at 1, 3, and 5). Five hundred– and 1,000-strong datasets were generated from these networks. We were interested predominantly in how many dependencies present in the model networks were not recovered by the Belief network reconstruction algorithm. In smaller networks (25 nodes), both 500 and 1,000 datasets were sufficient to recover most dependencies (from 76% to 100%, depending on the sparseness factor), certainly an encouraging result. With 50 nodes, the proportion varied from 47% to 92%. Interestingly, this type of simulation experiment design (comparing graph topologies and computing topological differences) is very similar to that of a typical simulation study in phylogenetic analysis (see, for example, Piontkivska [2004] and references therein), and we believe that much of the enormous experience accumulated within the latter domain can be profitably applied to designing and carrying out Belief network performance simulations.
Belief networks are known to avoid overfitting (in other words, they avoid generating the spurious dependencies, or edges, that reflect only the noise in the data). This is because most of the model selection criteria used to evaluate the candidate networks penalize (implicitly or explicitly) for the model complexity. Following the simulation scheme of Van Allen and Greiner (2000) and using the same model networks as described in the previous paragraph, we looked at whether the choice of the model selection criteria affected the extent of over- (or under-) fitting in our domain. Preliminary results suggest that the posterior probability Bayesian criterion achieves the correct balance, whereas BIC and MDL (minimum description length [Rissanen, 1987]), two well-established and interrelated statistical and information-theory scoring criteria, usually slightly underfit, especially for small samples. On the contrary, two resampling-based criteria, bootstrap and cross-validation, usually overfit to some extent, and either would be a potentially effective choice if a higher sensitivity is desired. (We remind the reader that the posterior probability criterion and, to a lesser extent, BIC, were the criteria predominantly used throughout this study.)
We are presently conducting a series of rigorous simulation experiments, aimed at ascertaining the performance of the Belief network reconstruction algorithms within the genetic epidemiology domain, that will be published elsewhere.
RESULTS
All Belief networks were generated from the data only, with no consideration of prior/expert biological knowledge of any kind. We were particularly interested in the apoE level node and its Markov blanket, although the cholesterol and apoB nodes were also of interest. (Note: In this section, Belief network node labels appear in bold for clarity.) The Belief network learned from the sample of 702 individuals from Jackson, MS, is shown in Fig. 1. The relative strengths of the edges of the network are shown in Table 1. The bootstrap support for the edges in the plasma apoE level–centered subnetwork are shown in Table 2. Only SNPs 4036 and 4075 belong to the apoE level node Markov blanket. Triglyceride levels belong to the apoE level Markov blanket as well. Posterior probability support for the edge between SNP 4036 and apoE level nodes is not strong, but the corresponding bootstrap value (Table 2) is high enough to support the existence of this edge.
FIG. 1.
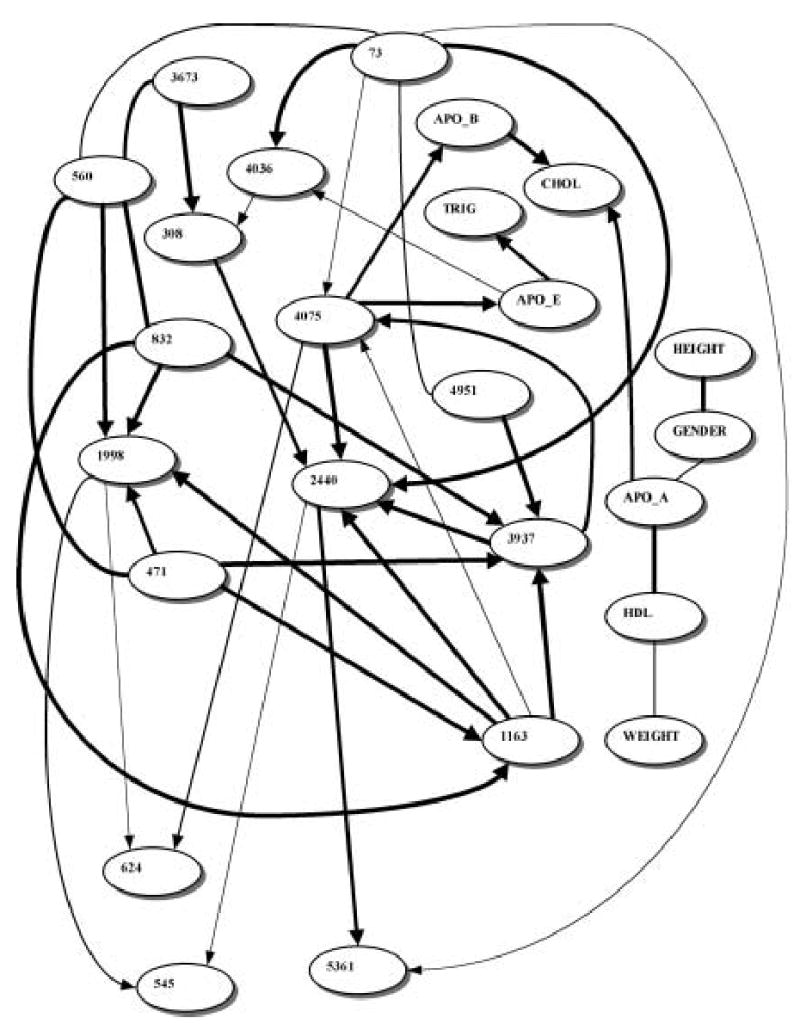
Learned Belief network relating APOE SNPs to plasma apoE levels in Jackson, MS. Node legends: numbers refer to corresponding SNPs (see Fig. 1 in Nickerson et al. [2000] for an APOE SNP map). APO_E, APO_A, APO_B, TRIG, CHOL, and HDL stand for levels of apolipoproteins E, AI and B, triglycerides, cholesterol and high-density lipoprotein cholesterol, respectively. Line thickness corresponds to the relative edge strength (see Table 1.)
Table 1.
Relative Edge Strengths in the Jackson, MS Networka
| Node 1 | Node 2 | Edge strength |
|---|---|---|
| APO_E | TRIG | 970916 |
| SNP 3937 | SNP 4075 | 190785 |
| SNP 4075 | APO_B | 105196 |
| SNP 471 | SNP 1998 | 73280 |
| APO_A | CHOL | 51954 |
| SNP 560 | SNP 3673 | 13854 |
| SNP 2440 | SNP 5361 | 9439 |
| SNP 308 | SNP 2440 | 2505 |
| SNP 4075 | APO_E | 2221 |
| SNP 4075 | SNP 624 | 880 |
| SNP 73 | SNP 560 | 374 |
| HDL | WEIGHT | 261 |
| SNP 1998 | SNP 545 | 50 |
| SNP 73 | SNP 4951 | 45 |
| GENDER | APO_A | 18 |
| SNP 1163 | SNP 4075 | 5.95 |
| APO_E | SNP 4036 | 4.68 |
| SNP 73 | SNP 4075 | 4.04 |
| SNP 1998 | SNP 624 | 3.44 |
| SNP 2440 | SNP 545 | 2.99 |
| SNP 73 | SNP 5361 | 2.81 |
| SNP 4036 | SNP 308 | 1.17 |
For each edge, its strength is the ratio of the posterior probability of the model containing the edge to the posterior probability of the identical model with the edge removed. Due to the limited software resolution there is no significant difference between the values above 1,000,000. Twenty edges with such values are considered highly significant and are not shown here. However, they are drawn in Fig. 1.
Table 2.
Bootstrap Values and Strengths for the Edges Belonging to the Markov Blanket of the apoE Node in the Jackson, MS Network
| Node 1 | Node 2 | Edge strengtha | Bootstrap valueb |
|---|---|---|---|
| SNP 4036 | APO_E | 4.68 | 76% |
| SNP 4075 | APO_E | 2221 | 85% |
| TRIG | APO_E | 970916 | 98% |
The edge strength observed in the study sample.
The percentage of times the edge was scored as present out of 500 bootstrap samples.
Figure 2 depicts the belief network learned from 854 individuals from Rochester, MN. SNPs 3937 and 4075 belong to the apoE level Markov blanket. Tables 3 and 4 show the relative strengths of the edges and bootstrap support for the edges in the apoE level Markov blanket, respectively. In this network, cholesterol and triglyceride levels also belong to the apoE level Markov blanket.
FIG. 2.
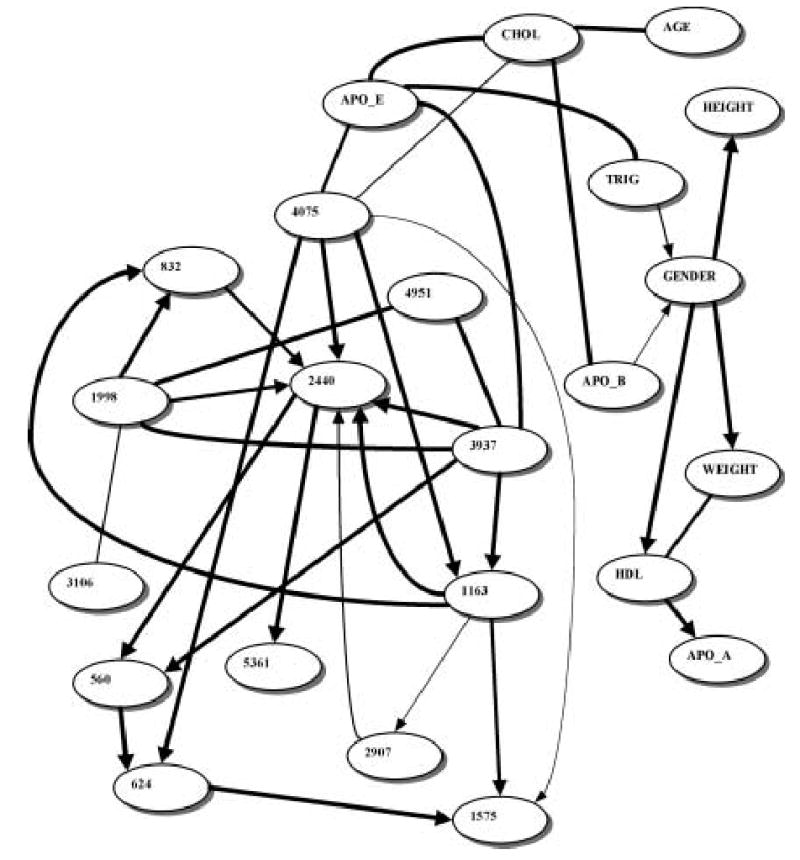
Belief network learned from the Rochester, MN dataset. All designations are as in Fig. 1. Line thickness corresponds to the relative edge strength (see Table 3.)
Table 3.
Relative Edge Strengths in the Rochester, MN Networka
| Node 1 | Node 2 | Edge strength |
|---|---|---|
| APO_E | SNP 4075 | 191513 |
| WEIGHT | HDL | 74236 |
| SNP 1163 | SNP 1575 | 19032 |
| SNP 832 | SNP 2440 | 11575 |
| SNP 1998 | SNP 2440 | 2331 |
| CHOL | SNP 4075 | 248 |
| SNP 1998 | SNP 3106 | 78 |
| TRIG | GENDER | 59 |
| SNP 2907 | SNP 2440 | 12 |
| SNP 4075 | SNP 1575 | 7.92 |
| APO_B | GENDER | 4.95 |
| SNP 1163 | SNP 2907 | 2.68 |
For each edge, its strength is the ratio of the posterior probability of the model containing the edge to the posterior probability of the identical model with the edge removed. Due to the limited software resolution there is no significant difference between the values above 1,000,000. Twenty-five edges with such values are considered highly significant and are not shown here. However, they are drawn in Fig. 2.
Table 4.
Bootstrap Values and Strengths for the Edges Belonging to the Markov Blanket of the apoE Node in the Rochester, MN Network
| Node 1 | Node 2 | Edge strengtha | Bootstrap valueb |
|---|---|---|---|
| SNP 3937 | APO_E | >106 | 97% |
| SNP 4075 | APO_E | 191513 | 98% |
| TRIG | APO_E | >106 | 99% |
| CHOL | APO_E | >106 | 100% |
The edge strength observed in the study sample.
The percentage of times the edge was scored as present out of 500 bootstrap samples.
Before analyzing these two datasets separately, a combined analysis (with the race included as a covariate) was performed (results not shown). The Race node in the resulting network had a Markov blanket of a very low sparseness (i.e., was connected with great many other nodes). This phenomenon is know as “shielding” (with the node in question effectively shielding most of the remaining variables from each other in a conditional independence sense), and it is an effective indicator of a hidden admixture (or stratification). If a certain node in a Belief network (such as, in our context, Race or Gender) is connected to many more nodes than average, separate subset analyses are indicated. The straightforward biological interpretation (in case of Race) is, of course, strong racial differences in allele frequencies (causing Race node to be connected with a large number of SNP nodes.)
DISCUSSION
We present here an application of a Belief network strategy to the analysis of multiple APOE SNPs and plasma cholesterol and apoE levels, and we discuss how the Belief network results should be interpreted. Tables 1–4 suggests that the two SNPs influencing the apoE level most directly are SNP 3937 and SNP 4075. Interestingly, these two SNPs are exactly the ones responsible for the three well-known and often-studied APOE alleles. Therefore, the Belief network modeling was capable of extracting that knowledge from the APOE epidemiological data without any prior information or guidance. Some of the Belief networks generated in this study (Fig. 1) also suggest that SNP 4036 might be influencing the apoE level (although to a somewhat lesser extent.) It should be noted here that SNP 4036 is also one of the four coding APOE SNPs and it has been previously associated with type III hyperlipoproteinemia in a single family (Rall et al., 1989).
It is important to keep in mind the difference between fitting a single “perfect” model to the data and extracting pronounced (robust) features from the same data. Belief networks are essentially exploratory tools, in that they suggest which dependencies are more likely and, consequently, what association studies are likely to be worth pursuing further. These further studies may be conducted in terms of inferring prediction equations for a single target variable using the Markov blanket of that variable from a Belief network. In our case, SNPs 3937, 4036, and 4075 are clearly obvious candidates for comprehensive association studies if apoE level is the phenotype of interest. However, directed edges (i.e., one with arrows in Figs. 1 and 2) between these SNPs and the phenotype do not necessarily imply causation, and all dependencies and directions observed in a Belief network should not be taken literally. A directed edge only means that the Belief network containing it has a higher posterior probability given the observed data than the equivalent Belief network containing a reverse edge. (If these posterior probabilities are not significantly different, the edge is shown as undirected.)
Belief networks are a data-mining tool, meaning that Belief network modeling is a data-driven exploratory approach for knowledge discovery and hypothesis generation. It should not be directly compared to traditional statistical tools that are user driven and pursue mainly hypothesis verification or rejection. A perfect knowledge discovery framework would, in fact, incorporate both—first hypothesis generation via data-mining tools and then hypothesis verification via traditional statistical tools (see Smyth [2000, 2001] for general discussion and Morowitz [2001] for a philosophical contrast). In the present application, confidence in the existence of an inferred edge was obtained using bootstrapping. Unfortunately, there is little literature pertaining to the use of bootstrapping in Belief network applications, and this remains an important area of investigation.
The purpose of Belief network modeling is to provide a graphic visualization of the joint probability distribution of the variables within the domain and to pinpoint probable dependencies (generate new hypotheses). Therefore, rigorous statistical justification of the resulting models is not a primary concern. However, it is difficult to accept a model without an indication of its robustness and support. In addition to the bootstrapping, comparing the posterior probabilities of models with and without a certain feature (e.g., an edge between two nodes) is another effective way to estimate support for that feature. In the results provided here, such methods support the existence of a predictive relationship between SNPs 3937, 4036, and 4075 and plasma apoE levels (i.e., apoE). However, like methods for relating a large number of SNPs to interindividual variation in a phenotype of interest, their appropriateness and statistical properties are as yet uncertain. This said, it is possible to “translate” Bayesian (such as posterior probability) criteria values into the traditional p-values, at least for a dataset of fixed size (see Raftery [1995] for practical guidelines and philosophical discussion).
Belief network modeling also has practical utility for predicting future outcomes. Given exact values for some predictive variables (e.g., SNPs) and the learned Belief network, the posterior probability distributions for the target variables (e.g., plasma apoE levels) can be computed (see Pearl [1988]) for a general description of a probabilistic inference algorithm for Belief networks). Of course, in Belief networks any node can be either a predictive or a target variable. By concentrating largely on the Markov blanket of the target variable, Belief network modeling can be reduced to naïve Bayes classification, which has many attractive properties compared to other classifiers (Kononenko, 1990). These properties include computational efficiency, scalability, and high prediction accuracy, comparable to that of, for example, support vector machines and decision tree forests.
Other desirable properties of Belief network modeling include absence of overfitting (assuming posterior probability is used as a model selection criterion [Heckerman, 1995], the resulting network neither overfits nor underfits the data [Van Allen and Greiner, 2000]) and high statistical power. Specifically, simulation experiments conducted by us and elsewhere (Myllymaki et al., 2002) on the artificial datasets of the dimensionality and sparseness comparable to the datasets analyzed in the present study indicate that approximately 1,000 data points would be sufficient to reliably recover true Belief network topology of a useful (25 nodes) size. For the datasets of much higher dimensionality, a variable set reduction (by filtering or wrapping) is recommended before the Belief network application, so that one can concentrate on the Markov blanket(s) of interest and take advantage of the high computational efficiency and power that Belief network modeling brings to the high-local-sparseness systems.
In this study, Belief network modeling of multiple APOE SNPs and plasma cholesterol and apoE levels led to the identification of the SNPs 3937, 4036, and 4075 as the useful predictors of the apoE plasma level. However, the amount of potentially interesting hypotheses generated via Belief network modeling was, in fact, much higher—every strongly supported edge (dependency) depicted in Figs. 1 and 2 is a valid hypothesis. Many of these hypotheses, although of less biological interest than the dependencies in the apoE Markov blanket, are original and would have been difficult to obtain automatically using a non-dependency-modeling analysis technique. This underscores the efficiency of Belief networks as the data exploration method, particularly for the novel and largely unexplored datasets. Ideally, Belief network modeling would be a “middle-tier” data-mining tool, following the variable/feature set reduction by either filtering or wrapping and, in turn, followed by a traditional hypothesis verification stage. It should be noted that although in this (“SNP-searching”) application Belief networks can be compared to various classifiers/estimators, their primary appeal lies in the automated hypothesis generation ability. While it is possible to use classifiers such as support vector machines, decision trees, and bagging and boosting extensions thereof to search for genotype–phenotype associations, none of these techniques is capable of reverse-engineering the biological networks such as those shown in Figs. 1 and 2.
Availability of a large collection of SNPs throughout the human genome and improvements in SNP genotype technologies pave the way for large-scale genomic SNP association studies. Analytic methods are needed to identify regions of the genome containing collections of genes and SNPs for further hypothesis-driven research. Even within a gene, there are often very large numbers of SNPs that may be potentially important for the gene’s effect on a target variable. Methods are needed to select sites (i.e., a relatively small subset of SNPs) for further study. Belief network modeling, while being such a method, also possesses the unique ability to reconstruct and validate a biological network of dependencies between SNPs, phenotypes, and other genetic and nongenetic factors. In general, Belief network modeling is capable of combining data-driven approaches with user- or hypothesis-driven approaches. Therefore, Belief networks and similar or competing methods (or a combination thereof) are likely to become a regular part of the human geneticists toolbox in the coming years.
Acknowledgments
We thank Tomi Silander for access to B-course source code and Anatolii Litvinenko for technical assistance. This work was supported in part by grants from the National Heart Lung and Blood Institute and the Institute of General Medical Sciences. This work began as part of the MDCODe project, and the authors would like to acknowledge the laboratory of Dr. Debora Nickerson at the University of Washington for generating the SNP data used in this analysis and Dr. Kenneth Weiss at Penn State University for many valuable discussions.
References
- Boerwinkle E, Utermann G. Simultaneous effects of the apolipoprotein E polymorphism on apolipoprotein E, apolipoprotein B, and cholesterol metabolism. Am J Human Genet. 1988;42:104–112. [PMC free article] [PubMed] [Google Scholar]
- Friedman, N., Goldszmidt, M., and Wyner, A. 1999. Data analysis with Bayesian networks: A bootstrap approach. Proc. 15th Conf. on Uncertainty in Artificial Intelligence, UAI, 196–205.
- Friedman N, Linial M, Nachman I, Pe’er D. Using Bayesian networks to analyze expression data. J Comp Biol. 2000;7:601–620. doi: 10.1089/106652700750050961. [DOI] [PubMed] [Google Scholar]
- Han, J., and Kamber, M. 2001. Data Mining: Concepts and Techniques, Morgan Kaufmann, San Francisco, CA.
- Heckerman, D. 1995. A tutorial on learning with Bayesian networks. Technical report MSR-TR-95-06, Microsoft Research.
- Kononenko, I. 1990. Comparision of inductive and naive Bayesian learning approaches to automatic knowledge aquisition, in B. Wielinga, J. Boose, B. Gaines, G. Schreiber, and M. van Someren, eds., Current Trends in Knowledge Acquisition, IOS Press, Amsterdam, Netherlands.
- Krause, P.J. 1998. Learning Probabilistic Networks. www.auai.org/bayesUS_krause.ps.gz
- Lai E, Ripley J, Purvis I, Roses A. A 4-Mb high-density single nucleotide polymorphism-based map around human APOE. Genomics. 1998;54:31–38. doi: 10.1006/geno.1998.5581. [DOI] [PubMed] [Google Scholar]
- Mahley RW, Rall SC., Jr Apolipoprotein E; far more than a lipid transport protein. Ann Rev Genomics Human Genet. 2000;1:507–537. doi: 10.1146/annurev.genom.1.1.507. [DOI] [PubMed] [Google Scholar]
- Morowitz H. Bacon, Popper, and the human genome: Data base mining and theoretical biology. Complexity. 2001;6:14–15. [Google Scholar]
- Myllymaki P, Silander T, Tirri H, Uronen P. B-course: A web-based tool for Bayesian and causal data analysis. Int J Art Intell Tools. 2002;11:369–387. [Google Scholar]
- Nickerson DA, Taylor SL, Fullerton SM, Weiss KM, Clark AG, Stengård JH, Salomaa V, Boerwinkle E, Sing CF. Sequence diversity and large-scale typing of SNPs in the human apolipoprotein E gene. Genome Res. 2000;10:1532–1545. doi: 10.1101/gr.146900. [DOI] [PMC free article] [PubMed] [Google Scholar]
- Pearl, J. 1988. Probabilistic Reasoning in Intelligent Systems, Morgan Kaufmann, San Mateo, CA.
- Piontkivska H. Efficiencies of maximum likelihood methods of phylogenetic inferences when different substitution models are used. Mol Phylogenet Evol. 2004;31:865–873. doi: 10.1016/j.ympev.2003.10.011. [DOI] [PubMed] [Google Scholar]
- Raftery, A.E. 1995. Bayesian model selection in social research (with discussion), in P.V. Madsen, ed., Sociological Methodology, 111–196, Blackwells, Cambridge, MA.
- Rall SC, Jr, Newhouse YM, Clarke HR, Weisgraber KH, McCarthy BJ, Mahley RW, Bersot TP. Type III hyperlipoproteinemia associated with apolipoprotein E phenotype E3/3. Structure and genetics of an apolipoprotein E3 variant. J Clin Invest. 1989;83:1095–1101. doi: 10.1172/JCI113988. [DOI] [PMC free article] [PubMed] [Google Scholar]
- Rissanen J. Stochastic complexity (with discussion) J. R. Statist. Soc., Ser. B. 1987;49:223–239. and 253–265. [Google Scholar]
- Rothman KJ. No adjustments are needed for multiple comparisons. Epidemiology. 1990;1:43–46. [PubMed] [Google Scholar]
- Rothman, K.J., and Greenland, S. 1998. Modern Epidemiology, Lippincott-Raven, Philadelphia.
- Schwarz G. Estimating the dimensions of a model. Annals Statist. 1978;6:461–464. [Google Scholar]
- Smyth, P. 2000. Data mining: Data analysis on a grand scale? Technical report UCI-ICS 00-20. [DOI] [PubMed]
- Smyth, P. 2001. Data mining at the interface of computer science and statistics, in R.L. Grossman, C. Kamath, V. Kumar, and R. Namburu, eds., Data Mining for Scientific and Engineering Applications, 35–61, Kluwer, New York.
- Sprites, P., and Meek, C. 1995. Learning Bayesian networks with discrete variables from data. Proc. 1st Int. Conf. on Knowedge Discovery and Data Mining
- Stengård JH, Clark AG, Weiss KM, Kardia S, Nickerson DA, Salomaa V, Ehnholm C, Boerwinkle E, Sing CF. Contributions of 18 additional DNA sequence variations in the gene encoding apolipoprotein E to explaining variation in quantitative measures of lipid metabolism. Am J Human Genet. 2002;71:501–517. doi: 10.1086/342217. [DOI] [PMC free article] [PubMed] [Google Scholar]
- Utermann G. Apolipoprotein E polymorphism in health and disease. Am Heart J. 1987;113:433–440. doi: 10.1016/0002-8703(87)90610-7. [DOI] [PubMed] [Google Scholar]
- Van Allen, T., and Greiner, R. 2000. Comparing model selection criteria for Belief networks. Technical report, University of Alberta Department of Computer Science. www.cs.ualberta.ca/~greiner/BN-results.html#Criteria