Abstract
The cardiomyopathy (CM)-loop of the heavy chain of class-II myosins begins with a highly conserved Arg residue (whose mutation in human β-cardiac myosin II results in familial hypertrophic cardiomyopathy). The CM-loop of Dictyostelium myosin II (R397-Q407) is essential for its biological functions and biochemical activities. We found that the CM-loop of smooth muscle myosin II substituted partially and the CM-loop of β-cardiac myosin II much less well for growth, capping of surface receptors and development, and the actin-activated MgATPase and in vitro motility activities of purified myosins. There was little correlation between the biochemical and biological activities of the two chimeras and 19 point mutants but only the five mutants with kcat/Kactin values equivalent to wild-type myosin supported essentially full biological function. The three point mutations of R397 equivalent to those that result in hypertrophic cardiomyopathy in humans had minimal biological effects and different biochemical effects. The A400V mutation rendered full-length wild-type myosin almost completely inactive, both in vitro and in vivo, and the reverse V400A mutation in the cardiac CM-loop chimera restored almost full activity, even though the sequence still differed from wild-type in 7 of 11 positions. Transient kinetic studies of acto-subfragment-1 (S1) showed that the chimeras and the Ala/Val, Val/Ala mutations do not affect the equilibrium or the association and dissociation rate constants for either ATP or ADP binding to acto-S1 or the rate of ATP-induced dissociation of acto-S[0–9] We conclude that the Ala/Val, Val/Ala mutations affect the release of Pi from acto-S1·ADP·Pi. In addition, Val at position 400 substantially reduces the affinity of actin for S1 in the absence of nucleotide.
Class-II myosins consist of two identical heavy chains (HC1), a pair of regulatory light chains and a pair of essential light chains. Each HC has a motor domain with an ATPase and an actin-binding site, a neck region to which one regulatory light chain and one essential light chain bind and a tail domain which forms an α-helical coiled-coil rod with the tail of its partner HC. Myosin II molecules associate through their HC tails forming bipolar filaments that interact with actin filaments to form the biologically functional complex. The social amoeba Dictyostelium discoideum contains only a single gene for each of the three myosin II polypeptides, the genes are readily disrupted by homologous recombination (1-3) and replaced by wild-type or mutated genes, and the myosin is easily purified. Experiments with HC-null (i.e. myosin II-null) cells have established that Dictyostelium myosin II is required for cytokinesis of vegetative amoebae in suspension culture, development to fruiting bodies under starvation conditions (4–6) and capping of concanavalin A surface receptors (7, 8). By expressing mutant heavy (or light) chains in the appropriate null mutant, one can relate these three biological functions of the mutant myosins to their biochemical activities and structural properties.
To support its biological functions, DdMII must be both enzymatically active (9, 10) and polymerization-competent (5, 8, 11) but neither regulation of ATPase activity by regulatory light chain phosphorylation (12, 13) nor regulation of polymerization by phosphorylation of three regulatory Thr residues in the tail (11, 14, 15), is required. However, some constructs with modified tails do not support development even though they are both enzymatically active and polymerization-competent (16, 17).
In this paper, we focus on the biological and biochemical properties of chimeras and point mutants in the CM-loop, a surface loop at the tip of the upper 50K domain of the HC (Fig. 1) that is one of the actin/myosin interfaces (19, 20) in the rigor (nucleotide-free) complex (21, 22). Mutations of the first residue of this loop in human β-cardiac myosin II, Arg403, to Gln, Trp or Leu, are three of the point mutations that cause familial hypertrophic cardiomyopathy (23, 24), hence the name CM-loop. The CM-loop also contains the TEDS-site (25), which is an Asp or Glu in most myosins but in a few (mostly class-I) myosins is either Ser or Thr whose phosphorylation can regulate actin-activated MgATPase activity (26–32).
Fig. 1. Ribbon representation of the motor domain of Dictyostelium myosin II.
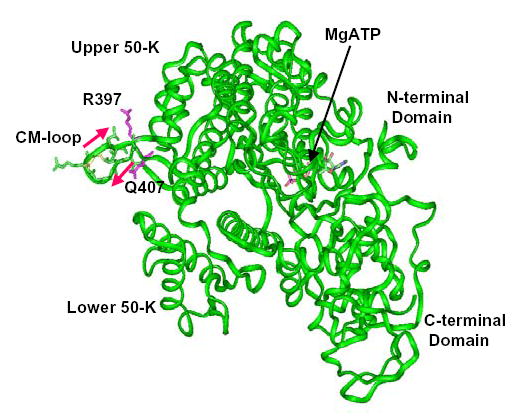
This is an adaptation of the structure of Bauer et al. (18) with the locations of the CM-loop (R397-Q407) and the TEDS-site (D403) in the upper 50-K domain indicated.
The CM-loop of DdMII extends from R397 to Q407 with D403 at the TEDS-rule site (Fig. 1). We found the CM-loop to be essential for growth of Dictyostelium in suspension culture, Con A-induced capping and development to fruiting bodies. The CM-loop of chicken smooth muscle myosin II could substitute partially for the DdMII loop but the CM-loop of human β-cardiac myosin II almost not at all. Studies of the two chimeric myosins and 19 point mutants in their CM-loops showed good correlation between the effects of CM-loop mutations on development and growth, and both were more sensitive to mutations in the CM-loop than was capping of Con A receptors. There was no overall correlation between the ability of the myosins to support these three biological functions and either the in vitro motility activity or the kcat or Kactin of the actin-activated MgATPase activity of the purified myosins. However, Wt DdMII and the five myosin mutants that restored full biological activity had a higher ratio of kcat/Kactin, a measure of coupling between the actin binding and ATPase sites, than any of the other constructs. The three mutations that cause hypertrophic cardiomyopathy in humans had equivalent, small effects on the biological functions of DdMII but very different effects on its biochemical activities. The single point mutation A400V in the Wt CM-loop profoundly inhibited and the reverse mutation V400A in the Sm and Ca CM-loop chimeras strongly enhanced their biological and biochemical properties. Steady-state MgATPase activities of S1 constructs and full-length myosins were very similar. Transient kinetics showed that interchanging Ala and Val did not substantially affect the ATP binding kinetics of acto-S1, the affinity of acto-S1 for ADP or the rate of dissociation of ADP from acto-S1, leading to the conclusion that the effects of the Ala/Val, Val/Ala mutations on steady-state ATPase activity resulted from changes in the rate of Pi release from the acto-S1·ADP·Pi complex. In addition, Val at position 400 decreased the affinity of actin for S1 in the absence of nucleotide by as much as 175-fold.
EXPERIMENTAL PROCEDURES
Plasmid construction and cell culture
All mutations in the CM-loop were obtained by standard methods using PCR with pTIKL MyD (33) as the template. The S-1 heavy chain was truncated at position E843 and fused with a FLAG tag, DYKDDDK, at the C-terminus to facilitate purification. All sequences were confirmed. The cDNAs in pTIKL were electroporated into HS1 cells (14). Individual clones were selected and maintained on plates in the presence of 12 μg/ml geneticin (G418) sulfate (Life Technologies, Great Island, NY) in HL5 medium containing 60 μg/ml each of penicillin and streptomycin; large-scale cultures were grown in the same medium either in conical flasks on a rotary shaker at 145 rpm or on 25X25-cm square plates at 22 °C.
Biological assays
Growth in suspension culture was quantified as described (34) beginning with an initial cell density of 1x10⁵ cells/ml for all cell lines. Doubling times were calculated from cell densities after three days.
To evaluate Con A-induced capping, 30 μg/ml tetramethyl rhodamine isothiocyanate-conjugated Con A (Molecular Probes, Eugene, OR) was added to washed cells in starvation buffer at room temperature (7, 17). The cells were fixed at 5 and 25 min, permeablized in −20 °C acetone containing 1% formalin for 15 min (35) and the coverslips were washed and mounted to visualize the Con A caps. Capping stages were scored for 100 cells.
To assay development, cells were harvested by low-speed centrifugation, washed twice with starvation buffer and small aliquots of amoebae placed on agar plates in starvation buffer (16, 17). Phenotypes were observed and photographed under a dissection microscope after 48 h when development of all cell lines had reached its final stage. The final stage of development was scored for at least 100 aggregates and the assays were repeated at least two times.
Biochemical assays
Wt and mutant myosins were purified as described (33) and S1s were purified by FLAG-affinity chromatography; their purity was analyzed by SDS-PAGE on 4–20% gels and they were stored in liquid N2 until use. Rabbit muscle actin (36) and Dictyostelium myosin light chain kinase (37) were prepared as described. Myosin concentrations were determined by the Bradford method with bovine serum albumin as standard; S1 concentrations were determined by absorption at 280 nm using an extinction coefficient of 0.7 cm2/mg at 280 nm and by the Bradford assay with the same results; actin concentrations were determined by absorption at 290 nm using an extinction coefficient of 0.62 cm2/mg.
Steady-state ATPase activity was assayed in 20 mM imidazole, pH 7.5, 4 mM MgCl2, 25 mM KCl, 2 mM [γ -32P]ATP, 150 nM myosin head or 150 nM S1, and F-actin at the indicated concentrations. The production of 32Pi was determined (39) after incubation at 30 °C for 12 min, during which period the reaction rates were constant. Assays of myosin were initiated by addition of monomeric myosin that had been fully phosphorylated by Dictyostelium myosin light chain kinase (38) as determined by urea-glycerol PAGE. Actin was polymerized in the presence of gelsolin (Sigma) at a 1:60 molar ratio to reduce its viscosity. Curves were fitted to all of the data points using SigmaPlot to determine kcat at saturating concentration of F-actin and Kactin, the concentration of F-actin required for half-maximal activity.
The modified protocol of Sellers et al. (40) was used to determine in vitro motility activity at 30 °C in buffer containing 3 mM MgCl2 and 2 mM ATP. Regulatory light chain phosphorylation was carried out after binding the myosin to the slide by adding Dictyostelium myosin light chain kinase in kinase buffer and incubating for 10 min.
Stopped-flow Assays
All stopped flow measurements were done in a SF-2001 stopped-flow apparatus (KinTek Corp., Austin, TX) at 25 °C in buffer containing 20 mM HEPES, pH 7.5, 4 mM MgCl2, 100 mM KCl and 1 mM DTT. Pyrene-labeled actin was excited at 365 nm and the emitted light was selected using a 400-nm long-pass cutoff filter. Experimental traces were fitted using KinTek software, SigmaPlot 2001 and Origin 6.0 (Microcal Software).
Results
The DdMII CM-loop is essential and cannot be replaced by the CM-loop of smooth or cardiac muscle myosin
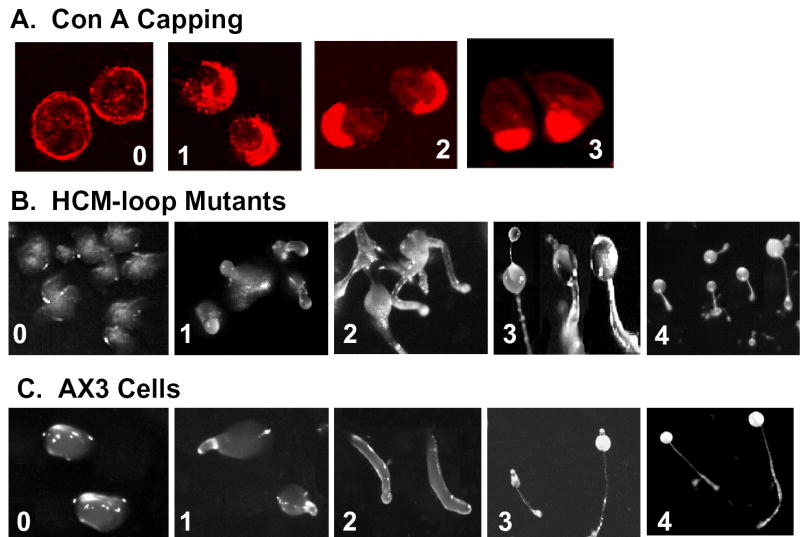
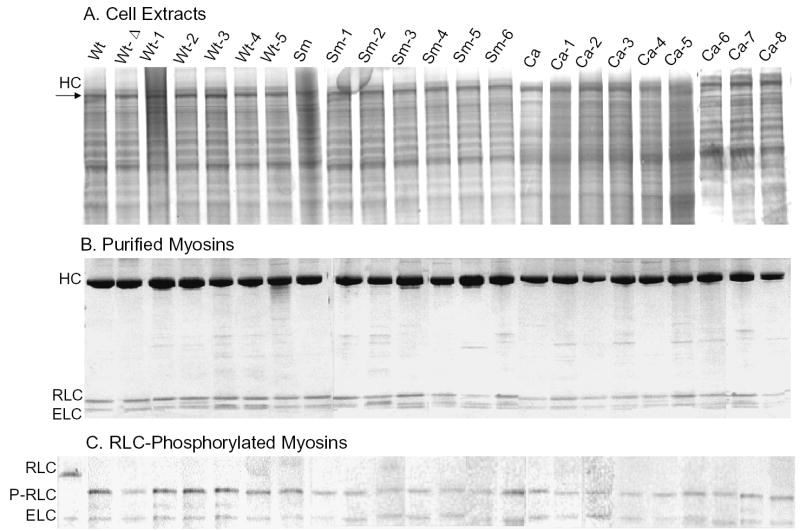
The CM-loop of DdMII extends from Arg397 to Gln407 (Fig. 1). We first tested the ability of the CM-loops of chicken gizzard smooth muscle myosin II (residues 406–416) and human β-cardiac muscle myosin II (residues 403–413) to substitute for the DdMII CM-loop when the Wt and chimeric HCs were expressed in DdMII HC-null (HS1) cells. The Sm-loop differs from the Dd-loop at 5 of the 11 residues (blue in Table IA); the Ca-loop differs at 8 positions from the Dd-loop (blue and green in Table IA) and at 5 positions from the Sm-loop (green in Table IA). We determined the cells’ doubling times and their abilities to cap Con A receptors and to develop beyond the mound stage when placed in starvation medium. We scored four stages of capping, 0 to 3 (Fig. 2A) and five stages of development, 0 to 4 (Fig. 2B); each stage was the end-point for one or more of the mutant cell lines. The morphology of the mutants at their final developmental stage (Fig. 2B) was often abnormal and more variable compared to the parent AX3 cells at the corresponding stages (Fig. 2C). As determined by SDS-PAGE of cell lysates, all of the myosin constructs were expressed in equivalent amounts (Fig. 3A).
Table I. Activity of chimeras and point mutants of Dictyostelium myosin II CM-loop.
Residues in the Sm-loop and Ca-loop that differ from the Wt-loop are in blue; residues in the Ca-loop that differ from both the Sm-loop and Wt-loop are in green. Point mutants are underlined. Capping and development activity are reported as the average of 100 samples. To eliminate one possible source of variation, the same preparation of F-actin was used for all of the assays, which were completed within three days
| ATPase
|
||||||||||
|---|---|---|---|---|---|---|---|---|---|---|
| Loop | Sequence | Dbl. Time | Capping Stage | Develop. Stage | kcat s−1 | Kactin μM | kcat/Kactin, s−1μM−1 | Motility μms−1 | ||
| A. Sm and Ca chimeras | ||||||||||
| Wt | 397RILAGRDLVAQ407 | 12 | 3 | 3.9 | 9 | 80 | 0.11 | 1.4±0.3 | ||
| Sm | RIKVGRDVVQK | 17 | 3 | 3.5 | 10 | 201 | 0.05 | 0.6±0.2 | ||
| Ca | RVKVGNEYVTK | 45 | 1 | 1 | 2 | 102 | 0.02 | 0.4±0.1 | ||
| Wt-Δ | None | -a | 0 | 0 | 0.1b | ND | ND | 0 | ||
| Null | - | -a | 0 | 0 | - | - | - | - | ||
| B. Point mutations in Ca-loop chimera | ||||||||||
| Ca-1 | RVKVGNEVVTK | 44 | 1 | 1 | 2 | 103 | 0.02 | 0.5±0.1 | ||
| Ca-2 | RVKVGREYVTK | 33 | 2 | 1.7 | 3 | 147 | 0.02 | 0.6±0.1 | ||
| Ca-3 | RVKVGNEYVQK | 26 | 2 | 2.1 | 2 | 102 | 0.02 | 0.4±0.1 | ||
| Ca-4 | RVKVGNEVVQK | 33 | 3 | 2.1 | 2 | 112 | 0.02 | 0.6±0.1 | ||
| Ca-5 | RVKVGREVVTK | 23 | 3 | 3 | 2 | 171 | 0.01 | 0.7±0.1 | ||
| Ca-6 | RVKVGREVVQK | 26 | 3 | 3.6 | 3 | 80 | 0.04 | 0.6±0.1 | ||
| C. Point mutations in Sm-loop chimeras | ||||||||||
| Sm-1 | RILVGRDVVQK | 16 | 3 | 3.7 | 5 | 192 | 0.03 | 0.5±0.2 | ||
| Sm-2 | RILVGRDVVQQ | 34 | 3 | 2.8 | 3 | 133 | 0.02 | 0.6±0.1 | ||
| Sm-3 | RIKVGRDVVAK | 24 | 3 | 3.4 | 2 | 86 | 0.02 | 0.5±0.1 | ||
| Sm-4 | RILAGRDVVQK | 13 | 3 | 3.8 | 7 | 31 | 0.22 | 0.5±0.1 | ||
| Sm-5 | RILAGRDVVAQ | 14 | 3 | 3.9 | 11 | 89 | 0.12 | 1.5±0.3 | ||
| D. Ala/Val mutations at position 400 | ||||||||||
| Sm-6 | RIKAGRDVVQK | 15 | 3 | 3.8 | 9 | 24 | 0.38 | 0.4±0.1 | ||
| Ca-7 | RVKAGNEYVTK | 15 | 3 | 3.7 | 11 | 221 | 0.05 | 1.3±0.2 | ||
| Ca-8 | RVKAGREVVQK | 15 | 3 | 3.8 | 9 | 59 | 0.15 | 0.8±0.1 | ||
| Wt-1 | RILVGRDLVAQ | 36 | 1 | 1 | 1 | 26 | 0.04 | 0.3±0.1 | ||
| Wt-2 | RIKAGRDLVAQ | 14 | 3 | 3.9 | 12 | 141 | 0.09 | 1.1±0.1 | ||
| E. Hypertrophic cardiomyopathy mutations | ||||||||||
| Wt-3 | QILAGRDLVAQ | 17 | 3 | 3.7 | 10 | 285 | 0.04 | 1.7±0.3 | ||
| Wt-4 | LILAGRDLVAQ | 17 | 3 | 3.4 | 1 | 195 | 0.01 | 0.7±0.2 | ||
| Wt-5 | WILAGRDLVAQ | 16 | 3 | 3.5 | 1 | 176 | 0.01 | 0.8±0.2 | ||
Did not double.
ATPase activity at 160 μM F-actin; activity too low to determine kcat and Kactin.
Fig. 2. Illustrations of stages for evaluating capping of concanavalin A receptors and development.
A, Con A capping stages reached by myosin II-null cells expressing myosin constructs: 0, null cell; 1, Ca-1; 2, Ca-2; 3, Wt. B, representative developmental stages reached by myosin II-null cells expressing myosin constructs: 0, Wt-Δ; 1, Wt-1; 2, Ca-2; 3, Sm; 4, Wt. C, developmental stages of AX3 cells at the following times: 0, 8 h (mounds),; 1, 12 h (tipped mounds); 2, 18 h (slugs); 3, 22 h (immature fruiting bodies); 4, 24 h (mature fruiting bodies).
Fig. 3. Electrophoretic analysis of total cell extracts expressing wild-type and mutant myosins, the purified myosins and the myosin light chains after phosphorylation of the regulatory light chains.
A, SDS-PAGE of equivalent amounts of null cells expressing either Wt myosin II heavy chain and each of the 22 mutant heavy chains. B, SDS-PAGE of purified myosins used for biochemical assays before phosphorylation of the regulatory light chains. The positions of the heavy chain (HC) and regulatory (RLC) and essential (ELC) light chains are shown. C, urea-glycerol PAGE of the purified myosins after phosphorylation of the regulatory light chains. Note that almost all of the minor impurities were removed when the myosins were polymerized after phosphorylation. The first lane is unphosphorylated Wt. Positions of the unphosphorylated regulatory light chain (RLC), phosphorylated regulatory light chain (P-RLC) and essential light chains (ELC) are shown.
Null cells expressing Wt HC (Wt, Table IA) grew at the same rate and to the same maximum cell density (not shown) as the parent AX3 cells, capped Con A receptors like AX3 cells and developed fully to normal fruiting bodies, although complete development required 48 h rather than the 24 h required for AX3 cells. Null cells expressing the Sm-loop chimera (Sm, Table IA) grew more slowly, and only to half the maximum density (not shown), than cells expressing Wt heavy chain, capped normally and had partially impaired development. Cells expressing the Ca-loop chimera (Ca, Table IA) were greatly impaired: growth, capping and development were only slightly better than cells expressing Wt-Δ, which were similar to myosin II-null cells (Table IA).
The purified Wt myosin had the same actin-activated MgATPase (Table IA) and in vitro motility activities as myosin purified from wild-type AX3 cells (not shown). The Sm-chimera had the same kcat, a somewhat higher Kactin and about half the in vitro motility activity of Wt myosin (Table IA); the Ca-chimera had a much lower kcat, about the same Kactin and one-third the in vitro motility activity of Wt (Table IA). Although there were small variations in their basal (no F-actin) MgATPase activities (not shown), all of the constructs except Wt-Δ were substantially (20 to 200-fold) activated by F-actin. Wt-Δ was the only construct with no measurable in vitro motility activity (Table IA).
With these “base-line” values for the Wt and chimeric myosins, we made a series of point mutations in the Ca-loop to make its sequence more like the sequence of the Sm-loop and in the Sm-loop to make its sequence more like the sequence of the Wt-loop. All of the point mutants were expressed in HS1 cells at equivalent levels to Wt DdMII (Fig. 3A) and all of the purified myosins were of high purity (Fig. 3B, C).
Point mutations in the Ca-loop chimera
Two of the five differences in sequence between the Ca-loop and Sm-loop (green in Table IA) are conservative substitutions (Val for Ile at position 398 and Glu for Asp at position 403). Therefore, we focused on the three other positions, Asn402, Tyr404 and Thr406.
Mutation Y404V (Ca-1, Table IB) had no effect on the chimeric myosin’s ability to support growth, capping or development; mutation N402R (Ca-2, Table IB) slightly improved all three biological properties; and mutation T406Q (Ca-3, Table IB) improved growth a little more than the N402R mutation. The double mutation Y404V and T406Q (Ca-4, Table IB) supported capping activity better than either of the single mutations Ca-1 and Ca-3 alone but neither growth nor development was not improved. Double mutation N402R and Y404V (Ca-5, Table IB) substantially improved growth, capping and development relative to the Ca-loop chimeras with the single mutations, Ca-2 and Ca-1. The triple mutation N402R, Y404V and T406Q (Ca-6, Table IB) further enhanced the ability of the Ca-chimera to support development.
Although five of the six Ca-chimera mutants supported biological functions better than the parent Ca-chimera, the biochemical activities of all of the myosins were essentially the same (Table IB); kcat and in vitro motility activities were similarly low and Kactin values varied by no more than a factor of two. Notably, although the capping and development activities of Ca-6 were essentially identical to those of the Sm-chimera, Ca-6 had a much lower kcat and a lower Kactin than the Sm-chimera (Table IB). Thus, the improved biological functions of the Ca-chimera mutants cannot be directly attributed to any single biochemical property.
Point Mutations in the Sm-loop Chimera
Because one of the five differences (blue in Table IA) between the Sm-loop and Wt-loop is conservative (Val for Leu at position 404), we focused on the four other differences. Sm-loop mutation K399L (Sm-1, Table IC) had little, if any, effect on the ability of the Sm-chimera to support growth, capping or development; this mutation lowered the kcat for actin-activated MgATPase activity but had no effect on Kactin or in vitro motility (Table IC). Double mutation K399L and K407Q (Sm-2, Table IC) was deleterious to growth and development and reduced kcat and Kactin but capping and in vitro motility were unaffected. Single mutation Q406A (Sm-3, Table IC) also reduced growth but had little effect on capping and development and substantially lowered both kcat and Kactin with no effect on in vitro motility. On the other hand, double mutation K399L and V400A (Sm-4, Table IC) improved growth and development, while capping remained at a high level, and lowered Kactin substantially but with little change in kcat and no change in in vitro motility. Quadruple mutation K399L, V400A, Q406A and K407Q (Sm-5, Table IC) had no additional effect on the biological functions or actin-activated MgATPase activity but it was the only one of the Sm-loop constructs with in vitro motility activity as high as that of Wt.
None of the three single point mutations that made the Sm-chimera sequence more similar to the Dd Wt-loop sequence (Sm-1, Sm-2 and Sm-3) improved biological function and all decreased kcat. Only Sm-4 and Sm-5 supported biological activities better than the Sm-chimera and similarly to Wt; these two constructs had kcat values similar to Sm and Wt and Kactin values less than Sm and equivalent to or less than the Kactin of Wt.
Importance of Ala at Position 400
Because Sm-4 (with double mutation K399L and V400A) was biologically and biochemically as active as Sm-5 (which had two additional mutations), and much more active than Sm-1 (with single mutation K399L), Sm-loop mutation V400A seemed to be important. Therefore, we tested directly the apparent importance of Ala at position 400. The Sm-loop chimera with single mutation V400A (Sm-6, Table ID) supported growth and development almost as well as Wt-myosin and retained the high capping activity of the Sm-chimera. While this mutation did not increase in vitro motility activity, Kactin was substantially reduced and kcat remained at the high level of the Sm-chimera (Table ID).
The effects of single mutation V400A on the properties of the Ca-chimera were even more pronounced. Despite the remaining seven differences in sequence, this single mutation (Ca-7, Table ID) increased the ability of the Ca-chimera to support biological functions essentially to the level of Wt myosin and increased kcat (5-fold) and in vitro motility (3-fold) to the levels of Wt myosin, but Kactin doubled. The effects of the V400A mutation in the background of three other mutations in the Ca-chimera were similar (Ca-8 vs. Ca-6, Table B, D).
Conversely, the reverse mutation in the Wt-loop, A400V, dramatically inhibited Wt myosin’s ability to support growth, capping and development as well as reducing kcat and in vitro motility (Wt-1, Table ID). In contrast, mutation of the adjacent residue in the Wt-loop, L399K, had no effect on any of the biological functions or in vitro activities of the myosin other than small increases in both kcat and Kactin (Wt-2, Table ID).
Effects of hypertrophic cardiomyopathy mutations at position 407
The three mutations in the DdMII Wt-loop, R397Q, R397L and R397W (Wt-3, Wt-4, Wt-5, Table IE), that correspond to the mutations in human β-cardiac myosin II that cause hypertrophic cardiomyopathy mildly and equivalently inhibited Wt myosin’s ability to support growth and development but had no effect on Con A-induced capping (Table IE). However, their biochemical properties differed substantially. The R397L and R397W mutants (Wt-4 and Wt-5) had very much lower kcat values and lower in vitro motility activities than Wt (Table IE) whereas the kcat and in vitro motility activity of the R397Q mutant (Wt-3) were the same as Wt; Kactin was higher than Wt for all three mutants.
Steady-state ATPase activities of S1
The six S1 constructs were highly purified by FLAG-affinity chromatography (Fig. 4). The basal MgATPase activities of Wt, Sm and Ca were similar and none was affected by the A400V or V400A mutation (Table II). In all cases, the activities had simple hyperbolic dependence on F-actin concentration (Fig. 5) and, when fit by the Michaelis-Menten equation, gave kcat and Kactin values (Table II) that were very similar to those found for the full-length myosins (Table IA, D). The kcat for Ca was about 20% of the values for Wt and Sm, which were essentially identical, and the Kactin for Sm was slightly higher than the values for Wt and Ca. The A400V mutation of Wt (Wt-1) decreased kcat by 90% and Kactin by 50%, the V400A mutation of Ca (Ca-7) caused a five-fold increase in kcat and doubled Kactin, and the same mutation in Sm (Sm-6) dramatically lowered Kactin with no effect on kcat, which was already as high as Wt. These data confirm the importance of Ala at position 400 for actin-activated MgATPase activity of Dictyostelium myosin II.
Fig. 4. SDS-PAGE of purified subfragment 1s.
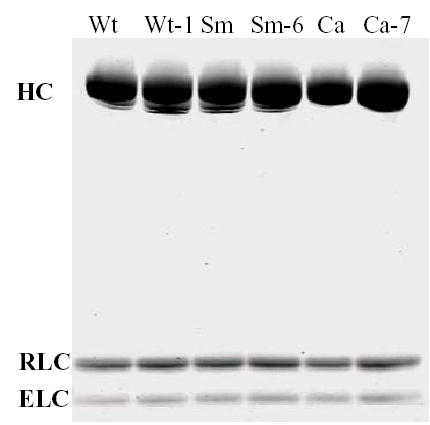
HC, heavy chain, residues 1-843 with C-terminal FLAG-tag; RLC, regulatory light chain; ELC, essential light chain.
Table II.
Kinetic constants for the acto-S1 kinetic cycle
| Wt | Wt-1 | Sm | Sm-6 | Ca | Ca-7 | |
|---|---|---|---|---|---|---|
| Steady-state ATPase | ||||||
| Basal (s−1) | 0.12 | 0.11 | 0.11 | 0.11 | 0.13 | 0.11 |
| kcat (s−1) | 11 | 1 | 9 | 8 | 2 | 11 |
| Kactin (μM) | 80 | 38 | 116 | 5 | 67 | 178 |
| kcat/Kactin (s−1μM−1) | 0.13 | 0.02 | 0.08 | 1.6 | 0.02 | 0.06 |
| ATP binding to A·M | ||||||
| K1′k+2′ (μM−1s−1) | 0.18 | 0.49 | 0.32 | 0.20 | 0.48 | 0.41 |
| k+2′ (s−1) | 263 | 754 | 427 | 421 | 580 | 423 |
| 1/K1′ (μM)a | 1461 | 1539 | 1334 | 2105 | 1208 | 1032 |
| ADP binding to A·M | ||||||
| K5′ (μM) | 161 | 182 | 276 | 261 | 261 | 217 |
| Actin binding to myosin | ||||||
| k−6 (μM−1s−1) | 0.93 | 0.94 | 2.6 | 2.4 | 1.4 | 1.5 |
| k+6 (s−1) | 0.0007 | 0.13 | 0.006 | 0.0002 | 0.065 | 0.003 |
| K6 (μM)b | 0.0008 | 0.14 | 0.002 | 0.0001 | 0.046 | 0.002 |
Calculated from k+2′/K1′k+2′. Similar values were obtained from the hyperbolic fits of Fig. 5A (not shown).
Calculated from k−6 and k+6.
Fig. 5. Steady-state actin-activated MgATPase activity of S1.
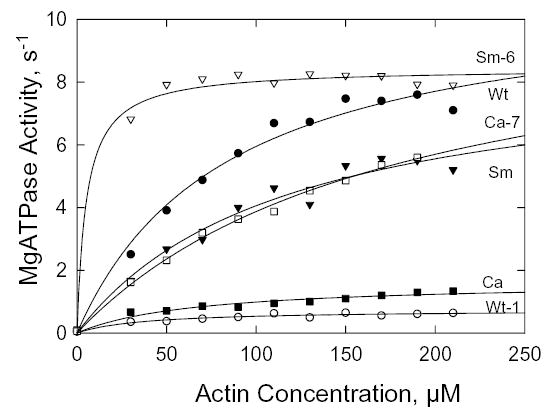
The data were corrected for the ATPase activities of F-actin and S1 alone and fit to the hyperbolic Michaelis-Menten equation. The values for kcat and Kactin are reported in Table II.
Binding of ATP to acto-S1
For kinetic analysis, we used the model (41–44) of the myosin ATPase cycle in the presence and absence of F-actin shown in Fig. 6, where M is myosin, A is actin and A·M is actomyosin. The kinetic constants are defined with all reactions proceeding from left to right on each row and from upper row to lower row (rate constants are positive in these directions). The major path when F-actin is present is identified by boldface type. When ATP is mixed with A·M, a rapid equilibrium is reached (step 1′, Fig. 6) followed by isomerization of the ternary complex A·M(ATP) to A·M·ATP (step 2′, Fig. 6), which is the rate-limiting step in the dissociation of F-actin at high ATP concentrations (steps 1′, 2′ and 8, Fig. 6). The fluorescence of pyrene-labeled F-actin decreases when it binds to S1 but pyrene-labeled F-actin in the weak binding state (A·M·ATP, Fig. 6) has high fluorescence similar to unbound F-actin (43, 44). Therefore, the binding of ATP to AM can be measured by the exponential increase in fluorescence when ATP is added to pyrene-labeled AM. The observed rate constant for F-actin dissociation is:
Fig. 6. Kinetic model for the acto-S1 ATPase cycle.

The upper line shows the steps when myosin is associated with F-actin and the lower line for myosin alone. The principal pathway for acto-S1 ATPase is in bold type; step 4′ is rate-limiting. A, actin; M, myosin, A·M, actomyosin.
When K1′ [ATP] <<1:
and K1′k+2′ is the second order rate constant for binding of ATP to acto-S1.
Experimentally, the time course of fluorescence increase was a single exponential at every ATP concentration for all constructs (not shown) and kobs as a function of ATP concentration was hyperbolic for all constructs (Fig. 7A). The plateau value of kobs is k+2′ (Fig. 7A); the slope of the curve at low ATP concentrations is K1′k+2′ (Fig. 7B); K1′ can then be calculated. The rate constants and the calculated dissociation constants, 1/K1′, were similar for Wt, Sm and Ca (Table II). Also, the Ala/Val mutation in Wt (Wt-1) and the Val/Ala mutations in Sm and Ca (Sm-6 and Ca-7) had little effect on the kinetics of ATP binding (Table II).
Fig. 7. ATP-induced dissociation of acto-S1.
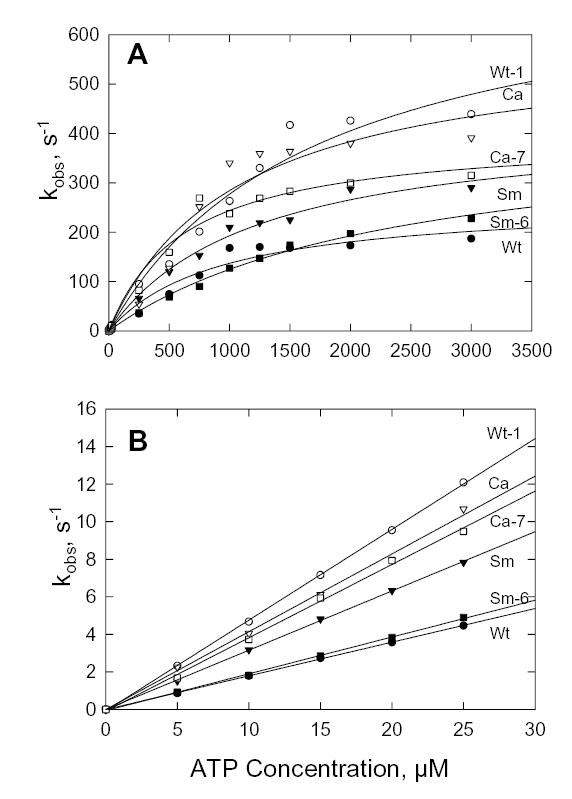
A, dependence of kobs on ATP concentration calculated from the increase in fluorescence when 0.25 μM pyrene-labeled acto-S1 was mixed with ATP; data were fit to the Michaelis-Menten equation. B, kobs at low ATP concentrations. The slopes of the curves give the second order rate constants, K1′k+2′ (Table II).
Binding of ADP to acto-S1
Binding of ADP to S1 in the absence of F-actin was monitored by the increase in fluorescence upon mixing N-methylanthraniloyl-ADP with S1 (43, 44). A large signal was observed for all six S1 constructs and k+5 for ADP release was calculated to be about 4 s−1 for all six constructs (data not shown); this is, as expected, much faster than the basal steady-state MgATPase activity of about 0.1 s−1 (Table II), which is limited by the rate constant of Pi release (step 4, Fig. 6). However, under the same conditions, no signal was detected when N-methylanthraniloyl-ADP was mixed with acto-S1.
Therefore, we evaluated the binding of ADP to acto-S1 indirectly by measuring ADP inhibition of ATP-induced dissociation of pyrene-labeled acto-S1. ADP inhibits ATP-induced dissociation of acto-·S1 by competing with ATP for the nucleotide binding site, i.e. step 5′ (in the reverse direction) competes with step 1′ (Fig. 6). The rate constant of dissociation of F-actin from pyrene-labeled acto-S1 induced by 500 μM ATP with ADP concentrations from 0 to 800 μM was measured by the increase in pyrene fluorescence. All curves were monophasic (not shown) and fit by single exponentials. This indicates that equilibrium between A·M and A·M·ADP is rapidly achieved and
, where k0 is the observed dissociation rate constant of F-actin in the absence of ADP and K5′ is the ADP concentration for 50% inhibition of k0. The plots of kobs versus ADP concentration were hyperbolic (Fig. 8A-C)). K5′ for Wt was 160 μM and about 260 μM for Sm and Ca (Table II) and was not affected by either the Ala/Val mutation in Wt (Wt-1) or the reverse Val/Ala mutations in Sm and Ca (Sm-6 and Ca-7); i.e., the curves for kobs/k0 vs. ADP (Fig. 8D-F) are superimposable. Moreover, the plots of kobs versus ADP concentration (Fig. 8A-C) show that the rate constant of F-actin dissociation was increased by the Ala/Val mutation of Wt (Wt-1) and not significantly decreased by the Val/Ala mutations of Sm and Ca (Sm-6 and Ca-7, respectively). The fact that single exponential transients were observed implies that ADP release from acto-S1 was not slower than ATP binding, i.e. k5′>80 s-1 in all cases, which is many times higher than the steady-state kcat values. We conclude that the effects of the Ala/Val and Val/Ala mutations on steady-state acto-S1 ATPase activities were not the result of changes in the rate constant of ADP release from acto-S1 (step 5′, Fig. 6).
Fig. 8. ADP-inhibition of ATP-induced dissociation of acto-S1.
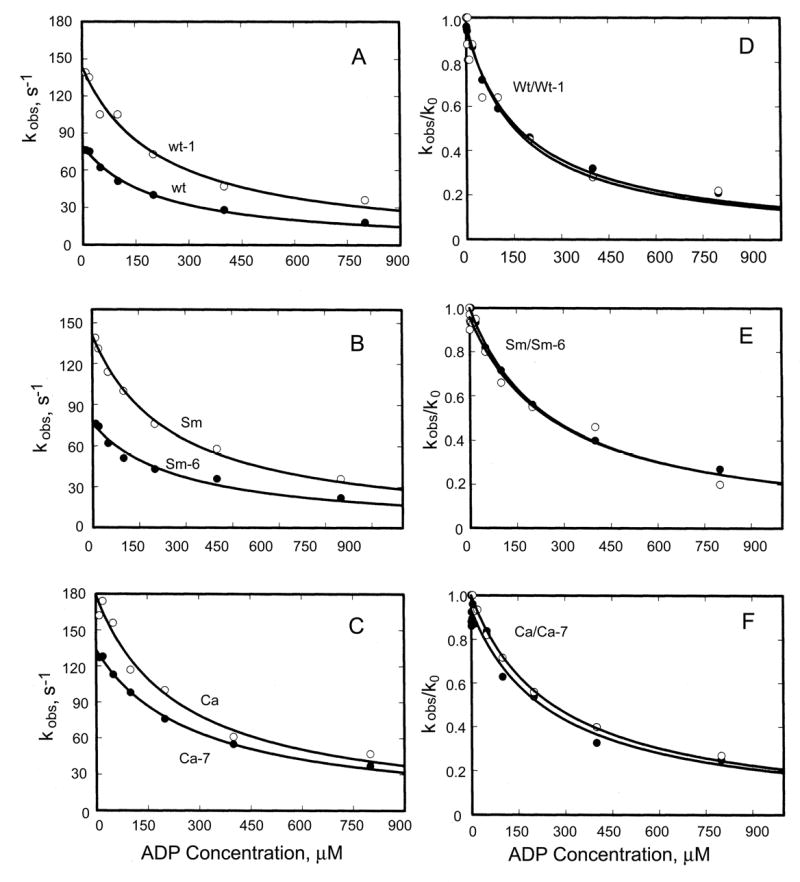
A-C, kobs when 500 μM ATP was mixed with 0.25 μM pyrene-labeled acto-S1 that had been preincubated with the indicated concentrations of ADP. D-F, ratio of kobs in the presence of ADP to k0 in the absence of ADP; ADP concentration when kobs/k0 = 0.5 is k5′ (Table II).
Binding of F-actin to S1
In the absence of ATP, S1 and F-actin form a stable rigor acto-S1 complex and the fluorescence of pyrene F-actin is quenched. The time course of quenching was a single exponential for all constructs (not shown) and the calculated quenching rate constants, kobs, were linearly dependent on the F-actin concentration (Fig. 9). The slopes of kobs versus actin concentration, which is the second order rate constant for binding of actin to myosin (k−6 in Fig. 6), were slightly greater for the chimeras Sm and Ca than for Wt but the Ala/Val and Val/Ala mutations had no effect on these constants (Table II).
Fig. 9. S1 binding to F-actin.
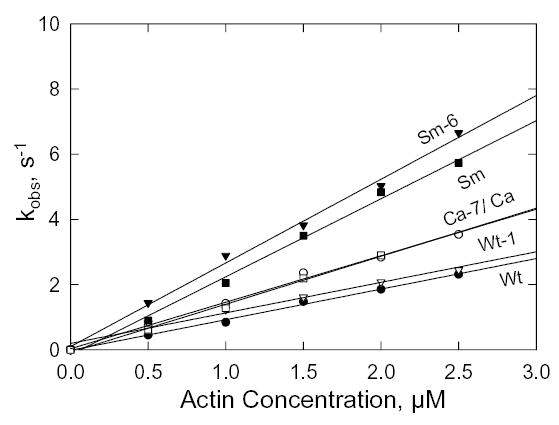
Kobs for the quenching of fluorescence of pyrene-labeled actin added to 0.25 μM S1 in the absence of nucleotide. The slopes of the lines are the second order rate constants, k−6 (Table II). At 0.5 μM F-actin, the actin/S1 concentration ration is too low for pseudo-first order kinetics and, therefore, the values for kobs are approximations but they are consistent with the rest of the data.
Dissociation of F-actin from acto-S1
The dissociation rate constant of F-actin from the acto-S1 complex in the absence of ATP was determined by monitoring the increase in fluorescence when pyrene-labeled acto-S1 was mixed with an excess of unlabeled F-actin (ratio of 80:1). The data shown in Fig. 10 were fit by single exponentials to obtain the dissociation rate constants, k+6 (Fig. 6). The dissociation rate constants for Sm and Ca were 10-fold and 100-fold greater than for Wt (Table II) and the calculated equilibrium dissociation constants were 2-fold and 50-fold greater, respectively (Table II). The Ala/Val mutation in Wt (Wt-1) increased both k+6 and the equilibrium dissociation constant more than 100-fold (Table II), whereas the reverse mutation Val/Ala in SM (Sm-6) and especially in Ca (Ca-7) substantially reduced both k+6 and K6 (Table II).
Fig. 10. Dissociation of pyrene-labeled F-actin from acto-S1.
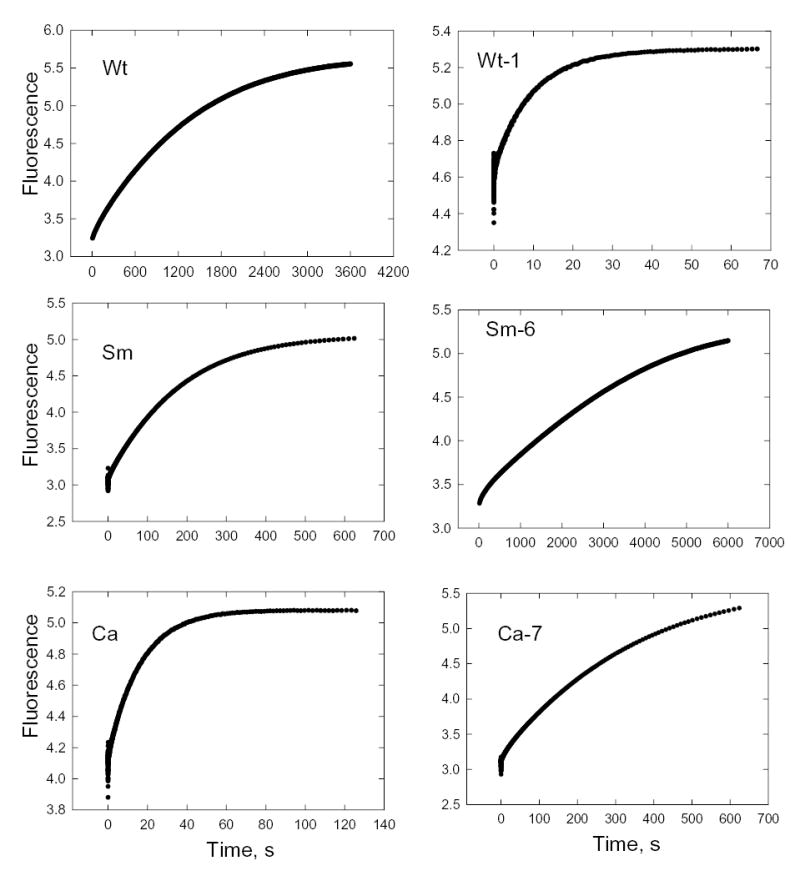
Unlabeled F-actin (20 μM) was mixed with 0.25 μM pyrene-labeled acto-S1 and the increase in fluorescence measured as the unlabeled actin displaced the labeled actin. The data were fit by single exponentials to calculate k+6 (Table II).
DISCUSSION
Biology and biochemistry of full-length myosins
Our finding development of cells expressing various CM-loop mutants could stop at any of the four development stages was unexpected as Springer et al. (45) had found a requirement for myosin II only at two steps, the mound stage (stage 0, Fig. 2C) and development of the mature fruiting body (stage 4, Fig. 2C). Our results may have been an indirect consequence of incomplete or inappropriate sorting of pre-stalk and pre-spore cells at the mound stage (46-48) that allowed mounds to progress to subsequent, and often morphologically aberrant, intermediate stages but not to complete development.
There was no correlation between growth and capping of Con A receptors (for example, constructs such as Ca-3, Ca-4 and Ca-6 with 2-3 times the doubling time of Wt supported complete capping) but growth correlated well with development (only those constructs that supported essentially normal growth, Wt, Sm-4, Sm-5, Sm-6, Ca-8 and Wt-2, supported development to average stage 3.8 or 3.9).
The CM-loop is essential for actin-activated MgATPase and in vitro motility activity but mutations in the loop had a greater effect on kcat (up to 10-fold) than on Kactin (up to 3-fold) and in vitro motility (up to 5-fold). Also, whereas kcat and in vitro motility activity of the loop mutants were never higher than Wt values, Kactin of loop mutants could be lower (one-third) or higher (3-times) than Wt. Similarly, there was no overall correlation among the three biochemical properties of the purified myosins. For example, while eight of the mutant constructs (Wt-2, Wt-3, Sm, Sm-4, Sm-5. Sm-6, Ca-7, Ca-8) had a kcat similar to Wt only four of these (Wt-2, Wt-3, Sm-5, Ca-7) had in vitro motility activities similar to Wt, and the Kactin values of these eight myosins varied from 50% to 300% of Wt.
None of the three biochemical properties that were assayed correlated with the ability of the constructs to support capping of Con A receptors; myosins that supported full capping activity had kcat values as low as 10% of Wt, Kactin values from half to twice that of Wt and in vitro motility activities as low as one-third of Wt. The ability of the myosins to support growth and development correlated partially with their kcat values. The five constructs that supported essentially Wt levels of growth and development (Wt-2, Sm-4, Sm-5, Sm-6, Ca-8) had essentially the same kcat as Wt but so did three constructs (Wt-3, Sm, Ca-7) that supported less than full growth and/or development.
The ratio kcat/Kactin (Table I), a measure of coupling between the actin-binding and catalytic sites, correlated best with growth and development; kcat/Kactin was 0.09 s−1μM−1 or higher for Wt myosin and the five mutants (Wt-2, Sm-4, Sm-5, Sm-6, Ca-8) that supported both growth and development as well as Wt myosin whereas kcat/Kactin for all other constructs was between 0.01 and 0.05 s−1μM−1. Thus, a kcat/Kactin equivalent to that of wild-type myosin appears to be required for myosins to support full development and essentially normal growth but Con A receptors can be capped efficiently by myosins with a kcat/Kactin only one-tenth of Wt myosin.
How do our results compare to others? Sasaki et al. (49) found that a Wt-Δ mutant with residues Ile398-Val405 replaced by AlaGly had 85% lower actin-activated MgATPase and in vitro motility activities and 60% higher Kactin than Wt myosin, and could not support growth in suspension culture or development to fruiting bodies in starvation medium. These results are qualitatively similar to our results but the inhibition of biochemical activities they reported is less than the essentially total inhibition that we observed for our Wt-Δ construct. Our results for the R397Q mutant differ from those of Fujita et al. (50) who found a 67% decrease in kcat, a 100% increase in Kactin and a 40% reduction of in vitro motility activity whereas we found no inhibition of kcat or in vitro motility and a three-fold increase in Kactin for this mutant (Wt-3, Table IE).
Reports of the biochemical effects of the hypertrophic cardiomyopathy mutation R403Q in vertebrate myosins differ substantially from one another and from our results for Dictyostelium myosin II. This mutation has been found to increase (51–53), decrease (54–57) or not affect (58) in vitro motility activity and to increase (52, 53) and decrease (58) actin-activated MgATPase activity of vertebrate myosin II. The only report of the biochemical effect of the R403W mutation in vertebrate myosins found a gain of function in expressed chicken smooth muscle myosin (49).
Kinetics of acto-subfragment-1
Interestingly, and somewhat unexpectedly, kcat and Kactin for the S1 constructs were the same as for the full-length myosins despite the fact that the former are single-headed molecules and the latter are short filaments with about 50–100 heads per filament (17) (assuming that the monomeric myosin polymerized when added to the assay mixture, as seems likely). The simplest explanation may be that, because Dictyostelium myosin II has a very low duty ratio of about 0.006 (59), no more than one head of filamentous myosin might be bound to actin at any time. The Kactin of Wt S1 in our experiments, 80 μM, is similar to most reported values for Dictyostelium S1 (60, 61) but our kcat for Wt, 11 s−1, is 4-fold higher than that generally reported by others (for example, refs. 60, 61). This is puzzling, especially as our transient kinetic data for Wt S1 are very similar to published values (61–65). The difference in steady-state values is not due to differences in methods of determining protein concentrations or assay temperatures and it seems unlikely that the difference is due to the different methods for measuring steady-state ATPase activity; one difference is that our S1 had a C-terminal FLAG tag whereas the constructs used in the other reports had a C-terminal poly-His tag.
Which step in the acto-S1 kinetic cycle (Fig. 6) is responsible for the different steady-state acto-S1 ATPase activities (kcat) of the chimeras and the Ala/Val mutations? Steps 1′, 2′ and 8 were not affected by the Ala/Val mutations as the second order rate constants K1′k+2′ for those steps were very similar for all of the constructs and had no correlation to the kcat values (Table II). Steps 3 and 9 were also probably not affected because the Kactin values, which are related to the actin·S1 dissociation constant in the weak actin-binding states, were essentially the same for Wt, Sm and Ca, the differences between Wt and Wt-1 and between Ca and Ca-7 were very much less than the differences in their kcat values, and the much larger difference between Kactin for Sm and Sm-6 did not correlate with a change in kcat (Table II). Step 5′ was not responsible as the observed dissociation rate constants were similar for all of the constructs and all were greater than kcat for Wt. Therefore, step 4′, Pi release from A·M·ADP·Pi, which is the rate-limiting step for wild-type Dictyostelium myosin, is also the rate-limiting step in the two chimeras and is the step that is affected by Ala/Val, Val/Ala mutations at position 400. Because of the very low affinities of S1·ATP and S1·ADP·Pi for F-actin it is not practical to determine the rate constants for Pi release.
In addition to its effect on acto-S1 MgATPase activity, substitution of Val for Ala at position 400 substantially reduced the affinity of S1 for F-actin in the absence of nucleotide by increasing the dissociation rate constant, k+6, with little effect on the association rate constant, k−6 (Table II). The differences in the affinities of the rigor complexes may be independent of the effects of Ala/Val mutations on catalytic activity as the strength of the rigor complex should have little or no effect on the kinetics of the acto-S1 MgATPase cycle. However, as Sasaki et al. (49) have suggested for other mutations in the CM-loop, weakening of the rigor complex might contribute to the poor biological functions of the full-length myosin mutants.
Sasaki et al. (49) proposed that the interactions between the CM-loop and F-actin are predominantly hydrophobic in nature. However, in our experiments the conservative substitution of Val for Ala, which would have little effect on the hydrophobicity of the CM-loop, substantially decreased the affinity of the rigor complex and acto-S1 MgATPase activity of Wt while the reverse substitution of Ala for Val in the Ca chimera increased both enzymatic activity and stability of the rigor complex. Moreover, Fujita-Becker et al. (66) reported that phosphorylation of Ser at the TEDS-site in the CM-loop of Dictyostelium myosin ID, which would decrease hydrophobicity, increased both rigor complex stability and acto-S1 MgATPase activity. The possibility should be considered that conformational changes in the CM-loop resulting from all of these modifications of the CM-loop may have compromised myosin's overall steric complementarity with F-actin. This might also explain why a CM-loop whose sequence has evolved to function in cardiac myosin, for example, is non-functional when substituted for the CM-loop of Dictyostelium myosin.
In summary, we have shown that the CM-loops of chicken smooth muscle myosin and human β-cardiac muscle myosins cannot substitute for the CM-loop of Dictyostelium myosin II; i.e. the sequence requirements for a functional CM-loop depend on the sequence of the heavy chain in which it resides. Strikingly, however, and despite their many sequence differences, the single point mutation V400A is sufficient to restore essentially full biochemical activity and biological function to the chimeras while the single reverse point mutation A400V greatly impairs both the biochemical activity and biological function of wild-type Dictyostelium myosin II. The biochemical property of the purified Wt and 22 mutant myosins that correlates best with their abilities to support full biological activity (more specifically normal growth and development to fruiting bodies) is a high kcat/Kactin ratio. Steady-state and transient kinetics indicate that the step affected by the chimeric myosins and the Ala/Val, Val/Ala point mutations is Pi release from the acto-S1·ADP·Pi complex. Finally, substitution of Val for Ala at position 400 substantially reduced the affinity of S1 for F-actin in the absence of nucleotide.
Acknowledgments
We thank Dr. Kae-Jung Hwang for preparing Fig. 1 and Dr. James Sellers for advice and assistance.
Footnotes
The abbreviations used are: Ca, cardiac muscle myosin II; CM, cardiomyopathy; Con A, concanavalin A; Dd, Dictyostelium discoideum; DdMII, Dictyostelium discoideum myosin II; HC, heavy chain; Sm, chicken smooth muscle myosin II; S1, subfragment -1; Wt, wild-type Dictyostelium myosin II.
References
- 1.De Lozanne A, Lewis M, Spudich JA, Leinwand LA. Proc Natl Acad Sci U S A. 1985;82:6807–6810. doi: 10.1073/pnas.82.20.6807. [DOI] [PMC free article] [PubMed] [Google Scholar]
- 2.Warrick H, De Lozanne A, Leinwand L, Spudich JA. Proc Natl Acad Sci U S A. 1986;83:9433–9433. doi: 10.1073/pnas.83.24.9433. [DOI] [PMC free article] [PubMed] [Google Scholar]
- 3.Chen P, Ostrow BD, Tafuri SR, Chisholm RL. J Cell Biol. 1994;127:1933–1944. doi: 10.1083/jcb.127.6.1933. [DOI] [PMC free article] [PubMed] [Google Scholar]
- 4.Knecht DA, Loomis WF. Science. 1987;236:1081–1086. doi: 10.1126/science.3576221. [DOI] [PubMed] [Google Scholar]
- 5.De Lozanne A, Spudich JA. Science. 1987;236:1086–1091. doi: 10.1126/science.3576222. [DOI] [PubMed] [Google Scholar]
- 6.Manstein DJ, Titus MA, De Lozanne A, Spudich JA. EMBO J. 1989;8:923–932. doi: 10.1002/j.1460-2075.1989.tb03453.x. [DOI] [PMC free article] [PubMed] [Google Scholar]
- 7.Pasternak CL, Flicker PF, Ravid S, Spudich JA. J Cell Biol. 1989;109:203–210. doi: 10.1083/jcb.109.1.203. [DOI] [PMC free article] [PubMed] [Google Scholar]
- 8.Fukui Y, De Lozanne A, Spudich JA. J Cell Biol. 1990;110:367–378. doi: 10.1083/jcb.110.2.367. [DOI] [PMC free article] [PubMed] [Google Scholar]
- 9.Yumura S, Uyeda TQP. Mol Biol Cell. 1997;8:2089–2099. doi: 10.1091/mbc.8.10.2089. [DOI] [PMC free article] [PubMed] [Google Scholar]
- 10.Zang JH, Spudich JA. Proc Natl Acad Sci U S A. 1998;95:13652–13657. doi: 10.1073/pnas.95.23.13652. [DOI] [PMC free article] [PubMed] [Google Scholar]
- 11.Egelhoff TT, Lee RJ, Spudich JA. Cell. 1993;75:363–371. doi: 10.1016/0092-8674(93)80077-r. [DOI] [PubMed] [Google Scholar]
- 12.Ostrow BD, Chen P, Chisholm RL. J Cell Biol. 1994;127:1945–1955. doi: 10.1083/jcb.127.6.1945. [DOI] [PMC free article] [PubMed] [Google Scholar]
- 13.Uyeda TQP, Spudich JA. Science. 1993;262:1867–1870. doi: 10.1126/science.8266074. [DOI] [PubMed] [Google Scholar]
- 14.Egelhoff TT, Brown SS, Spudich JA. J Cell Biol. 1991;112:677–688. doi: 10.1083/jcb.112.4.677. [DOI] [PMC free article] [PubMed] [Google Scholar]
- 15.O’Halloran TJ, Spudich JA. Proc Natl Acad Sci U S A. 1990;87:8110–8114. doi: 10.1073/pnas.87.20.8110. [DOI] [PMC free article] [PubMed] [Google Scholar]
- 16.Kubalek EW, Uyeda TQP, Spudich JA. Mol Biol Cell. 1992;3:1455–1462. doi: 10.1091/mbc.3.12.1455. [DOI] [PMC free article] [PubMed] [Google Scholar]
- 17.Shu S, Liu X, Parent CA, Uyeda TQP, Korn ED. J Cell Sci. 2002;115:4237–4249. doi: 10.1242/jcs.00112. [DOI] [PubMed] [Google Scholar]
- 18.Bauer CB, Holden HM, Thoden JB, Smith R, Rayment I. J Biol Chem. 2000;275:38494–38499. doi: 10.1074/jbc.M005585200. [DOI] [PubMed] [Google Scholar]
- 19.Rayment I, Rypniewski WR, Schmidt-Base K, Smith R, Tomchick DR, Benning MM, Winkelmann DA, Wesenberg G, Holden HM. Science. 1993;261:50–58. doi: 10.1126/science.8316857. [DOI] [PubMed] [Google Scholar]
- 20.Schröder RR, Manstein D, Jahn W, Holden H, Rayment I, Holmes KC, Spudich JA. Nature. 1993;364:171–174. doi: 10.1038/364171a0. [DOI] [PubMed] [Google Scholar]
- 21.Coureaux PD, Wells AL, Ménétrey J, Yengo CM, Morris CA, Sweeney HL, Houdusse A. Nature. 2003;425:419–423. doi: 10.1038/nature01927. [DOI] [PubMed] [Google Scholar]
- 22.Holmes KG, Angert I, Kull FJ, John W, Schröder RR. Nature. 2003;425:423–427. doi: 10.1038/nature02005. [DOI] [PubMed] [Google Scholar]
- 23.Geisterfer-Lowrance AA, Kass S, Tanigawa G, Vosberg HP, McKenna W, Seidman CE, Seidman JG. Cell. 1993;62:999–1006. doi: 10.1016/0092-8674(90)90274-i. [DOI] [PubMed] [Google Scholar]
- 24.Dausse E, Komajda M, Fetler L, Duborg O, Dufuor C, Carrier L, Wisnewsky C, Bercovici J, Hengstenberg C, al-Mahdawi S. J Clin Invest. 1993;92:2807–2813. doi: 10.1172/JCI116900. [DOI] [PMC free article] [PubMed] [Google Scholar]
- 25.Bement WM, Mooseker MS. T Cell Motil Cytoskel. 1995;31:87–92. doi: 10.1002/cm.970310202. [DOI] [PubMed] [Google Scholar]
- 26.Brzeska H, Korn ED. J Biol Chem. 1996;271:16983–16986. doi: 10.1074/jbc.271.29.16983. [DOI] [PubMed] [Google Scholar]
- 27.Lee W, Bezanilla M, Pollard TD. J Cell Biol. 2000;151:789–799. doi: 10.1083/jcb.151.4.789. [DOI] [PMC free article] [PubMed] [Google Scholar]
- 28.Brzeska H, Lynch TJ, Martin B, Korn ED. J Biol Chem. 1989;264:19340–19348. [PubMed] [Google Scholar]
- 29.Lee SF, Côté GP. J Biol Chem. 1995;270:11776–11782. doi: 10.1074/jbc.270.20.11776. [DOI] [PubMed] [Google Scholar]
- 30.Wu C, Lytvyn V, Thomas DY, Leberer E. J Biol Chem. 1997;272:30623–30626. doi: 10.1074/jbc.272.49.30623. [DOI] [PubMed] [Google Scholar]
- 31.Wang ZY, Wang F, Sellers JR, Korn ED, Hammer JAIII. Proc Natl Acad Sci U S A. 1998;95:4146–4151. [Google Scholar]
- 32.Novak KD, Titus MA. Mol Biol Cell. 1998;9:75–88. doi: 10.1091/mbc.9.1.75. [DOI] [PMC free article] [PubMed] [Google Scholar]
- 33.Liu X, to K, Lee RJ, Uyeda TQP. Biochem Biophys Res Commun. 2000;271:75–81. doi: 10.1006/bbrc.2000.2582. [DOI] [PubMed] [Google Scholar]
- 34.Shu S, Liu X, Korn ED. Proc Natl Acad Sci U S A. 2003;100:6499–6504. doi: 10.1073/pnas.0732155100. [DOI] [PMC free article] [PubMed] [Google Scholar]
- 35.LeBlanc-Straceski JM, Fukui Y, Sohn RL, Spudich JA, Leinwand LA. Cell Motil Cytoskel. 1994;27:313–326. doi: 10.1002/cm.970270404. [DOI] [PubMed] [Google Scholar]
- 36.Spudich JA, Watt S. J Biol Chem. 1971;246:4866–4871. [PubMed] [Google Scholar]
- 37.Smith SL, Spudich JA. EMBO J. 1996;15:6075–6083. [PMC free article] [PubMed] [Google Scholar]
- 38.Ruppel KM, Uyeda TQP, Spudich JA. J Biol Chem. 1994;269:18773–18780. [PubMed] [Google Scholar]
- 39.Pollard TD, Korn ED. J Biol Chem. 1973;248:4682–4690. [PubMed] [Google Scholar]
- 40.Sellers JR, Cuda G, Wang F, Homsher E. Methods Cell Biol. 1993;39:3923–3949. doi: 10.1016/s0091-679x(08)60159-4. [DOI] [PubMed] [Google Scholar]
- 41.De La Cruz EM, Wells AL, Rosenfeld SS, Ostap EM, Sweeney HL. Proc Batl Acad Sci U S A. 1999;96:13726–13731. doi: 10.1073/pnas.96.24.13726. [DOI] [PMC free article] [PubMed] [Google Scholar]
- 42.De La Cruz EM, Ostap EM, Sweeney HL. J Biol Chem. 2001;276:32373–32381. doi: 10.1074/jbc.M104136200. [DOI] [PubMed] [Google Scholar]
- 43.Wang F, Kovács M, Hu A, Limouze J, Harvey EV, Sellers JR. J Biol Chem. 2003;278:27439–27448. doi: 10.1074/jbc.M302510200. [DOI] [PubMed] [Google Scholar]
- 44.Kovács M, Wang F, Hu A, Zhang Y, Sellers jR. J Biol Chem. 2003;278:38122–18140. doi: 10.1074/jbc.M305453200. [DOI] [PubMed] [Google Scholar]
- 45.Springer ML, Patterson B, Spudich JA. Development. 1994;120:2651–2660. doi: 10.1242/dev.120.9.2651. [DOI] [PubMed] [Google Scholar]
- 46.Eliott S, Joss GH, Spudich A, Williams KL. J Cell Sci. 1993;104:475–466. doi: 10.1242/jcs.104.2.457. [DOI] [PubMed] [Google Scholar]
- 47.Doolittle KW, Reddy I, McNally JG. Develop Biol. 1995;167:118–129. doi: 10.1006/dbio.1995.1011. [DOI] [PubMed] [Google Scholar]
- 48.Clow PA, Chen TL, Chisholm RL, McNally JG. Development. 2000;127:2715–2728. doi: 10.1242/dev.127.12.2715. [DOI] [PubMed] [Google Scholar]
- 49.Sasaki N, Asukagawa H, Yasuda R, Hiratsuka T, Sutoh K. J Biol Chem. 1999;274:37840–37844. doi: 10.1074/jbc.274.53.37840. [DOI] [PubMed] [Google Scholar]
- 50.Fujita H, Sugiura S, Mommura S, Omata M, Sugi H, Sutoh K. J Clin Invest. 1997;99:1010–1015. doi: 10.1172/JCI119228. [DOI] [PMC free article] [PubMed] [Google Scholar]
- 51.Palmiter KA, Tyska MJ, Haeberle JR, Alpert NR, Fananapazir L, Warshaw DM. J Musc Res Cell Motil. 2000;21:609–620. doi: 10.1023/a:1005678905119. [DOI] [PubMed] [Google Scholar]
- 52.Tyska MJ, Hayes E, Giewat M, Seidman CE, Seidman JG, Warshaw DM. Circ Res. 1999;86:737–744. doi: 10.1161/01.res.86.7.737. [DOI] [PubMed] [Google Scholar]
- 53.Yamashita H, Tsyka MJ, Warshaw DM, Lowey S, Trybus KM. J Biol Chem. 2000;275:28045–28052. doi: 10.1074/jbc.M005485200. [DOI] [PubMed] [Google Scholar]
- 54.Cuda G, Fananapazir L, Epstein ND, Sellers JR. J Musc Res Cell Motil. 1997;18:275–283. doi: 10.1023/a:1018613907574. [DOI] [PubMed] [Google Scholar]
- 55.Sata M, Ikebe M. J Clin Invest. 1996;98:2866–2873. doi: 10.1172/JCI119115. [DOI] [PMC free article] [PubMed] [Google Scholar]
- 56.Sweeney HL, Straceski AJ, Leinwand LA, Tikunov BA, Faust L. J Biol Chem. 1994;269:1603–1605. [PubMed] [Google Scholar]
- 57.Roopnarine O, Leinwand LA. Biophys J. 1998;75:3023–3030. doi: 10.1016/S0006-3495(98)77743-4. [DOI] [PMC free article] [PubMed] [Google Scholar]
- 58.Wang F, Harvey EV, Conti MA, Wei D, Sellers JR. Biochemistry. 2000;39:5555–5560. doi: 10.1021/bi000133x. [DOI] [PubMed] [Google Scholar]
- 59.Robinson DN, Cavet G, Warrick HM, Spudich JA. BMC Cell Biol. 2002;3:4. doi: 10.1186/1471-2121-3-4. [DOI] [PMC free article] [PubMed] [Google Scholar]
- 60.Giese KC, Spudich JA. Biochemistry. 1997;36:8465–8473. doi: 10.1021/bi963141f. [DOI] [PubMed] [Google Scholar]
- 61.Furch M, Geeves MA, Manstein DJ. Biochemistry. 1998;37:6317–6326. doi: 10.1021/bi972851y. [DOI] [PubMed] [Google Scholar]
- 62.Ritchie MD, Geeves MA, Woodward SKA, Manstein DJ. Proc Natl Acad Sci U S A. 1993;90:8619–8623. doi: 10.1073/pnas.90.18.8619. [DOI] [PMC free article] [PubMed] [Google Scholar]
- 63.Woodward SKA, Geeves MA, Manstein DJ. Biochemistry. 1995;34:16056–16064. doi: 10.1021/bi00049a020. [DOI] [PubMed] [Google Scholar]
- 64.Kurzawa SE, Manstein DJ, Geeves MA. Biochemistry. 1997;36:317–323. doi: 10.1021/bi962166b. [DOI] [PubMed] [Google Scholar]
- 65.Batra R, Geeves MA, Manstein DJ. Biochemistry. 1999;38:6126–6134. doi: 10.1021/bi982251e. [DOI] [PubMed] [Google Scholar]
- 66.Fujita-Becker S, Dürrwang U, Erent M, Clark RJ, Geeves MA, Manstein DJ. J Biol Chem. 2005;280:6064–6071. doi: 10.1074/jbc.M412473200. [DOI] [PubMed] [Google Scholar]


