Abstract
The amygdala central nucleus (CeA) plays an important part in associative learning. Although most research has focused on functions of its descending projections to brainstem areas involved in autonomic and somatomotor responses, the ascending projections of CeA also play critical roles in learning. For example, a CeA-nigrostriatal pathway is important for acquiring orienting responses (ORs) to conditioned stimuli (CSs) that signal food delivery. In this study, the function of this CeA-nigrostriatal pathway in appetitive conditioning of rats was considered in more detail.
In experiment 1, we combined anatomical tracing and methods for detecting neuronal activation to examine whether CeA neurons that project to the substantia nigra pars compacta (SNc) are activated by a visual CS for food. After injection of the retrograde tracer Fluoro-Gold (FG) into SNc, the rats received pairings of a visual CS with food. After a test with the CS alone, the brains were prepared to assess FG labeling and CS-induced Fos expression in CeA with immunohistochemical procedures. Colocalization of Fos and FG in CeA neurons was visualized with confocal-fluorescence microscopy. The CS induced Fos expression in CeA, and a majority of these Fos-positive neurons were also FG positive, indicating activation of the CeA-SNc pathway by the CS. In experiment 2, lesions that disconnected CeA and SNc prevented the acquisition of conditioned ORs but did not affect the acquisition of conditioned food-related responses or the display of unconditioned ORs. These experiments demonstrate a role for amygdalo-nigral circuitry in learned modulation of attention to signals for biologically significant events.
Keywords: amygdala, central nucleus, substantia nigra, appetitive conditioning, retrograde labeling, Fos activation, dorsolateral striatum
Introduction
Considerable research has examined the role of the amygdala central nucleus (CeA) in the expression of amygdala-dependent learning through its descending projections to many brainstem sites (Price and Amaral, 1981). For example, lesions or transient inactivation of CeA disrupt the performance of several components of conditioned fear that are mediated by separate CeA projections to the central gray, the pontine reticular formation, the dorsal vagal motor nucleus, and other somatomotor and autonomic regions (Kapp et al., 1979; Sananes and Campbell, 1989; Campeau and Davis, 1995; Carrive et al., 2000; Nader et al., 2001).
Other research shows that the ascending projections of CeA also play critical roles in learning. For example, the acquisition of conditioned orienting responses (ORs) to stimuli paired with food delivery depends on the integrity of a circuit that includes CeA and dorsolateral striatum (DLS) (Han et al., 1997). Novel stimuli often elicit ORs, which may include both autonomic (Kapp et al., 1979; Hunt and Campbell, 1997) and motor (Holland, 1977) components. If a novel stimulus is presented repeatedly without significant consequences, ORs typically habituate. However, if that event is paired with a biologically significant event such as food or shock, ORs may be maintained, becoming conditioned to the stimulus (Holland, 1979; Kapp et al., 1979).
In a pavlovian appetitive conditioning task in which a visual CS is paired with food, rats acquire two distinctive conditioned behaviors: orienting to the light source (ORs) and approaching the site of food delivery (food-cup responses). However, conditioned ORs were not acquired by rats with neurotoxic lesions that either destroyed CeA bilaterally (Gallagher et al., 1990) or disconnected CeA from DLS (Han et al., 1997). Nevertheless, rats with those lesions showed normal acquisition of conditioned food-cup responses and normal unconditioned ORs to the CS before conditioning. Because there are no direct projections between CeA and DLS, Han et al. (1997) suggested that this circuit is mediated by the heavy efferent projections of CeA to substantia nigra pars compacta (SNc) (Pitkänen, 2000), which in turn sends substantial dopaminergic projections to DLS (Beckstead et al., 1979).
Here, we examined the function of this ascending projection of CeA to SNc in conditioned orienting. In experiment 1, we combined anatomical tracing and methods for detecting neuronal activation to determine whether CeA neurons that project to SNc are activated by a visual conditioned stimulus (CS) paired with food. A retrograde tracer, Fluoro-Gold (FG), was injected into SNc to label CeA neurons that project directly to SNc. Rats then received pairings of a visual CS with food. Finally, the induction of Fos (the protein product of the immediate-early gene c-fos), often used as a marker for neuronal activation (Sagar et al., 1988), was assessed after test exposure to the visual CS. The observation of neurons double-labeled with Fos and FG indicated that CeA neurons projecting directly to SNc were activated by the CS. To identify a critical role for these projections, in experiment 2, we examined the effects of neurotoxic lesions that disconnected CeA and SNc on the acquisition of conditioned ORs to a visual CS paired with food.
Materials and Methods
Subjects. Experimentally naive, male Long-Evans rats (Charles River Laboratories, Raleigh, NC), initially weighing 350-400 g, were housed individually in a climate-controlled vivarium on a 14/10 h light/dark cycle (lights on at 7:00 A.M.) with ad libitum access to water. They were fed ad libitum during acclimation and the postoperative recovery period. Starting 7 d before training until the completion of the study, they were placed on a restricted diet to maintain 85% of free-feeding body weight.
Surgery. Rats were anesthetized with isoflurane gas (Abbott Laboratories, North Chicago, IL), placed in a stereotaxic frame (Kopf Instruments, Tujunga, CA), and surgery was conducted under aseptic conditions. For experiment 1, the retrograde axonal tracer Fluoro-Gold (Fluorochrome, Denver, CO) was prepared in 0.9% sterile saline at a 4% concentration. FG is an appropriate retrograde tracer for studying direct projections because it does not transport transsynaptically and is not readily taken up by fibers of passage. A volume of 0.1 μl was injected unilaterally into the SNc of 16 rats over a 2 min period via a 30-gauge needle using a Hamilton microsyringe and an infusion pump (Sage Instruments, Boston, MA). The injection site was balanced, such that there were equal numbers of rats with FG injections into the left or right SNc. FG was injected into the lateral SNc, the primary source of its projections to DLS (Beckstead et al., 1979). The coordinates were -5.3 posterior and ±2.4 lateral from bregma and -7.4 ventral from the skull surface, according to Paxinos and Watson (1986). Rats began behavioral training 10 d after surgery.
In experiment 2, 36 rats received unilateral ibotenic acid lesions of CeA and 6-OHDA lesions of SNc in either the contralateral (n = 20) or ipsilateral (n = 16) hemisphere. Because projections of CeA to SNc are ipsilateral, contralateral lesions of CeA and SNc prevent communication between those two regions. Notably, these lesions spare functions sub-served by each region unilaterally, except for those that require CeA-SNc communication. In contrast, ipsilateral lesions destroy the same amount of tissue in each region as the contralateral lesions but leave communication between CeA and SNc intact in one hemisphere. Thus, the ipsilaterally lesioned rats served as appropriate controls for the assessment of effects of CeA-SNc disconnection in the contralaterally lesioned rats. The CeA lesions were made using stereotaxic coordinates 2.4 mm posterior to bregma and 4.3 mm from the midline, with infusions at a depth of 7.9 mm from the skull surface. Each CeA lesion was made using 0.25 μl of 10 μg/μl ibotenic acid (Sigma, St. Louis, MO) in PBS solution, infused with a Hamilton 2.0 μl syringe over a 6 min period. Each SNc lesion was made using 1.0 μl of 6 μg/μl 6-OHDA (Sigma) in a PBS/0.1% (w/v) ascorbic acid vehicle, infused over a 6 min period at the same stereotaxic coordinates used for tracer injections in experiment 1. The lesion sites were balanced, so there were equal numbers of each lesion type in each hemisphere. After surgery, all rats received a single 0.015 ml subcutaneous injection of buprenorphine hydrochloride for amelioration of pain and were allowed to recover from surgery for 10 d before behavioral testing.
Apparatus. The behavioral training apparatus consisted of four individual chambers (22.9 × 20.3 × 20.3 cm). Each chamber had aluminum front and back walls, clear acrylic sides and top, and a floor made of stainless steel rods (0.48 cm in diameter, spaced 1.9 cm apart). A food cup, fitted with phototransistors for detecting head entries, was recessed in the center of the front wall 2 cm above the floor. A jeweled 6 W lamp, mounted on the front panel of the chamber, 15 cm above the food cup (panel light), served as the source of the visual CS in experiment 1 and one of the CSs in experiment 2. Each chamber was enclosed in a sound-attenuated box, in which constant dim illumination was provided by a 6 W red light and ventilation fans provided masking noise (70 dB). Another 6 W lamp, located on the inside wall of this box, 10 cm from the front wall of the experimental chamber, served as a second visual CS (house light) in experiment 2. A television camera was mounted within each box, and images were recorded during behavioral training and testing.
Behavioral procedures. In experiment 1, rats received pavlovian appetitive conditioning, in which a light served as the CS and food served as the unconditioned stimulus (US). Rats were divided into three groups: unpaired (n = 6), paired I (n = 5), and paired II (n = 4). Rats in the unpaired group served as controls for conditioning. Groups paired I and II were experimental groups that received two different amounts of training to determine whether neuronal activation levels in CeA would differ depending on the extent of training. All rats were trained first to eat from the recessed food cup by delivering two 45 mg pellets (Research Diets, New Brunswick, NJ) with intertrial intervals (ITI) ranging from 2-6 min over two 64 min sessions. In the next session (day 1), all rats were given eight 10 s light-alone presentations (2-6 min ITI) to habituate their unconditioned orienting responses to light. After the habituation session, rats in the paired groups received eight 10 s light presentations (2-6 min ITI) followed immediately by the delivery of two food pellets. Rats in the unpaired group received eight presentations of the 10 s light and eight food deliveries, explicitly unpaired. On day 2, the paired groups received another session of 16 light-food pairings, and the unpaired group received 16 presentations of light and food explicitly unpaired. On day 3, rats in the paired I and unpaired groups received a 16 min test session in which four 10 s light-alone presentations were given. The rats in group paired II were given an additional 32 light-food pairings over 2 d before undergoing the 16 min test session.
Experiment 2 used a discriminative conditioning procedure, which permitted more sensitive, within-subjects comparisons for the occurrence of associative learning. The rats first received two 32 min sessions of pretesting of the two visual CSs, the panel light and house light, to examine unconditioned ORs. Each session included four 10 s presentations of each CS, randomly intermixed. The rats then received two sessions of food-cup training, as in experiment 1. Finally, all rats received 16 32 min sessions of discrimination training, in which one visual CS was reinforced with food delivery (CS+), and the other was nonreinforced (CS-). In each of these sessions, there were four 10 s presentations of CS+ and four 10 s nonreinforced presentations of CS-, randomly intermixed. The identity of CS+ (panel light or house light) was counter-balanced within each lesion condition.
Behavioral observation procedures. All observation were made from videotapes and paced by auditory signals (1.25 s intervals) recorded on the tapes. Observations were made during the 5 s period immediately before light presentation and during the 10 s period of light presentation. Two broad categories of behavior were recorded using custom-written software with a keyboard button press. The OR to the light, rearing, was defined as standing on the hind legs with both front legs off the floor but not grooming. Food-cup behavior was defined as presence of the head in the food cup or short, rapid horizontal head movements in and out of the food cup. To assess the objectivity of behavioral scoring, many of the video tapes were scored by multiple observers, who agreed on 95% of over 5000 joint observations.
The number of observations of each behavior was divided by the total number of observations to form the measure “percentage behavior.” Because the number of observations in each CS interval was constant, this measure is an absolute frequency measure, which does not depend on overall levels of behavior. In previous studies (Holland, 1977, 1984), ORs and food-cup behaviors occurred primarily during the first 5 s and the last 5 s periods of CS presentations, respectively. Thus, in this study, ORs were reported only for the first 5 s period and food-cup behavior for the last 5 s period of light presentation. To reduce the contribution of within-group variation in baseline responding, we report the difference between CS responding and pre-CS responding (responding during the 5 s period before light presentation). Baseline responding did not differ among the groups in either experiment.
In experiment 2, the measure of food-cup responding used was the percentage of time during each recording period that the food-cup photocells reported head entry. In previous studies, this automatic measure was correlated highly with observer judgments of head entries.
Because of the small number of subjects and the nonnormal response distributions obtained, in experiment 1, we used distribution-free inferential statistics for analysis of the behavioral results. In experiment 2, preliminary analyses justified the use of ANOVA for subsequent behavioral analysis.
Histology: experiment 1. Rats were killed 90 min after the beginning of the test session to detect c-fos protein expression associated with the CS. Rats were anesthetized deeply with isoflurane gas and perfused with 0.9% saline followed by 4% paraformaldehyde in 0.1 m phosphate buffer (PB). Brains were removed, postfixed, and cryoprotected overnight in 4% paraformaldehyde in 0.1 m PB containing 12% sucrose, frozen with powdered dry ice, and stored at -80°C. Brains were sliced on a freezing microtome, and 30 μm coronal sections through CeA and SNc were collected in four series.
FG immunohistochemistry. The first series of sections was used for FG immunoreactivity to confirm retrograde labeling in CeA and the injection site in SNc. Endogenous peroxidase within the tissue was blocked by washing free-floating sections in 0.3% H2O2 in 0.1 m PB containing 0.9% saline (PBS) for 30 min. After several rinses in PBS, tissues were incubated for 2 h in PBS containing 0.3% Triton X-100 (PBST) and 3% normal goat serum (Vector Laboratories, Burlingame, CA). Sections were then incubated in rabbit FG antibody (1:3000 dilution; AB153; Chemicon, Temecula, CA) in PBST containing 3% normal goat serum for 72 h at 4°C. After the primary antibody incubation, sections were rinsed in PBS, incubated in the biotinylated goat anti-rabbit IgG (1:250 dilution; Vector Laboratories) for 90 min, rinsed in PBS, and then incubated in avidin-biotin peroxidase conjugate (PK-6100; Vector Laboratories) for 1 h. After several rinses in PBS, tissues were reacted using a Vector SG substrate kit for peroxidase (SK-4700; Vector Laboratories). Tissues then were mounted on slides, dehydrated in ascending concentrations of alcohol, defatted in xylene, and coverslipped with Permount.
Fos immunohistochemistry. The second set of sections was used for Fos immunoreactivity following a similar protocol as that used for FG immunohistochemistry with appropriate antibodies and serum. Briefly, tissues were incubated in goat Fos antibody (1:1000 dilution; sc-52-G; Santa Cruz Biotechnology, Santa Cruz, CA) after rinsing and blocking. Tissues were then incubated with biotinylated secondary antibody followed by avidin-biotin conjugate and reacted using Vector SG kit. The third set of sections was stained for Nissl to verify anatomical locations of adjacent sections immunoreacted for Fos.
FG, Fos, and Nissl triple-immunofluorescent labeling. The fourth set of sections was used to examine colocalization of FG and Fos in the CeA. Free-floating tissues were preincubated for 1 h in blocking solution (i.e., 3% normal donkey serum in PBST). Sections were then incubated in blocking solution containing both rabbit anti-FG (1:1500; Chemicon) and goat anti-Fos (1:500; Santa Cruz Biotechnology) for 72 h at 4°C. After several rinses in PBS, sections were incubated in blocking solution with the addition of donkey anti-rabbit IgG-cyanine 5 (1:150; Jackson ImmunoResearch, West Grove, PA), donkey anti-goat IgG-Alexa 488 (1:150; Molecular Probes, Eugene, OR), and NeuroTrace 530/615 Nissl stain (1:300; Molecular Probes) for 1 h in the dark. Sections were then mounted onto slides, coverslipped with Gel/Mount (Biomeda, Foster City, CA), sealed with clear nail polish, and stored in the dark at 4°C.
Analysis of Fos expression. All analyses were conducted blind with respect to training condition and FG injection site. Medial and lateral parts of CeA were defined according to Swanson's rat brain atlas (Swanson, 1992). For medial CeA, three sections from different rostrocaudal levels [levels 25, 26, and 27 from Swanson (1992)] were analyzed, and two sections from levels 27 and 28 were analyzed for lateral CeA.
Images of the Fos-stained sections and the adjacent thionin-stained sections were acquired using a MicroPublisher RTV camera (QImaging, Burnaby, British Columbia, Canada). Borders were then drawn on the images of the thionin-stained sections and transferred to the Fos section images using Adobe Photoshop (Adobe Systems, San Jose, CA). Using an image analysis system (NIH Image 1.63), a threshold for background density was set for each defined region on the Fos section, and Fos-positive cells with a density that was at least 2 SDs above the background threshold were counted.
Analysis of FG and Fos colocalization. Sections labeled by immunofluorescence for FG, Fos, and Nissl were analyzed by confocal microscopy (laser scanning system LSM 510; Zeiss, Oberkochen, Germany). Three sections from levels 25, 26, 27 were selected, and the CeA ipsilateral to the injection site was examined. Nissl fluorescence was used as a visual guide to locate medial CeA, and a single sample from each section was collected using a 40× oil-immersion objective. All images were captured through the Z-plane (z-stacks consisted of 0.45 μm slices). Using Zeiss LSM ImageBrowser software, cells positive for each FG, Fos, and Nissl were counted independently by systematic evaluation (i.e., presence of 80% cell bodies in all X-, Y-, and Z-planes). Furthermore, cells coexpressing FG and Fos were counted with a full evaluation through Z-planed sections. For all analyses, group comparisons were made using a one-way ANOVA with a Fisher's PLSD for post hoc comparisons.
Histology: experiment 2. After completion of behavioral testing, the rats were anesthetized and perfused, and their brains were fixed and stored, as in experiment 1. Sections (30 μm) were taken from each brain, and alternate sections were mounted on slides to evaluate the lesions. One series was Nissl stained, and the other was evaluated for tyrosine hydroxylase (TH) as a measure of dopaminergic activity in SNc and its DLS targets. Assessment of TH immunoreactivity followed a protocol similar protocol similar to that used for FG and Fos immunohistochemistry in experiment 1, with appropriate antibodies and serum. Briefly, tissues were incubated in horse TH antibody (ImmunoStar, Hudson, WI) after rinsing and blocking. Tissues were then incubated with biotinylated horse anti-mouse secondary antibody (Vector Laboratories), followed by avidin-biotin conjugate, and reacted using a Vector SG kit.
Results
Experiment 1
Behavior
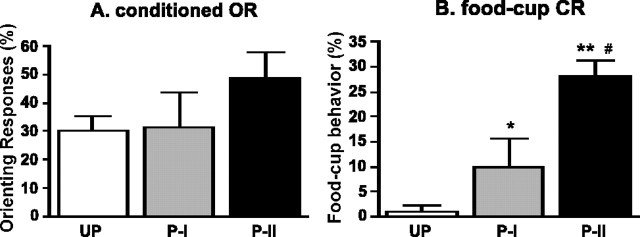
Figure 1 shows behavioral responses during the test session. Rats that received 56 light-food pairings (group paired II) showed more conditioning than the rats that received only 24 pairings (group paired I), and the rats in the unpaired group showed no evidence of conditioned responding. The rats in group paired II showed higher levels of both conditioned ORs (Fig. 1A) and food-cup conditioned responses (CRs) (Fig. 1B) compared with the rats in the unpaired group. The difference in conditioned ORs fell short of statistical significance (U = 4.5; p = 0.057), but food-cup CRs were significantly different (U = 0.0; p < 0.01). Furthermore, the rats in group paired II showed higher levels of food-cup CRs than the rats in group paired I (U = 2.5; p < 0.05). The rats in group paired I showed higher levels of food-cup CRs, but not conditioned ORs, than the rats in the unpaired group (U = 5.0; p < 0.05).
Figure 1.
Mean ± SE orienting responses (A) and conditioned food-cup responses (B) during the test session. The paired I (P-I) and paired II (P-II) groups showed greater food-cup CRs than the unpaired group (UP) (*p < 0.05 and **p < 0.01, respectively). In addition, P-II showed higher levels of CR than P-I (#p < 0.05).
Retrograde labeling
With one exception, all FG injections labeled neurons in the lateral part of SNc (Fig. 2); all data from the rat in which labeling did not occur were discarded. Some neurons along the injector tracks were stained with FG, possibly because of the leakage of FG. However, FG staining was limited to the lateral SNc and did not spread to the ventral tegmental area (VTA), which also receives projections from CeA (Oades and Halliday, 1987; McDannald et al., 2004). In the amygdala (Fig. 3), consistent labeling of neurons was apparent ipsilateral to the injection site through the rostrocaudal extent of the medial CeA. Although some neurons in the capsular CeA were very lightly stained with FG, neurons in the lateral CeA as well as the basolateral (BLA) neurons were negative for FG staining. Furthermore, no FG labeling was seen in the amygdala contralateral to the injection site. The heavy retrograde labeling in the medial CeA after FG injection into lateral SNc confirms the previous report of anterograde labeling in the SNc after Phaseolus vulgaris leucoagglutinin (PHAL) injection into dorsomedial CeA (Gonzales and Chesselet, 1990; Zahm et al., 1999).
Figure 2.
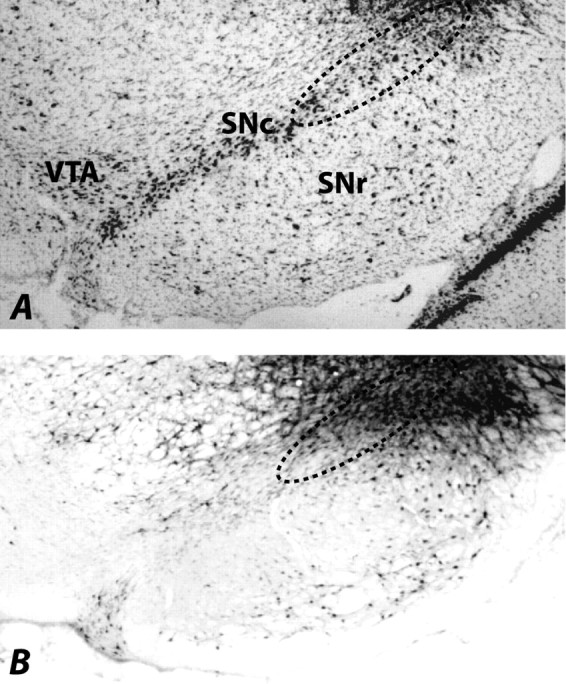
Photomicrographs illustrating the FG injection site in SNc (B) and the adjacent thionin-stained section (A). The injection was restricted to the lateral part of SNc (encircled in dotted line) and did not spread to the VTA. SNr, Substantia nigra pars reticulata.
Figure 3.
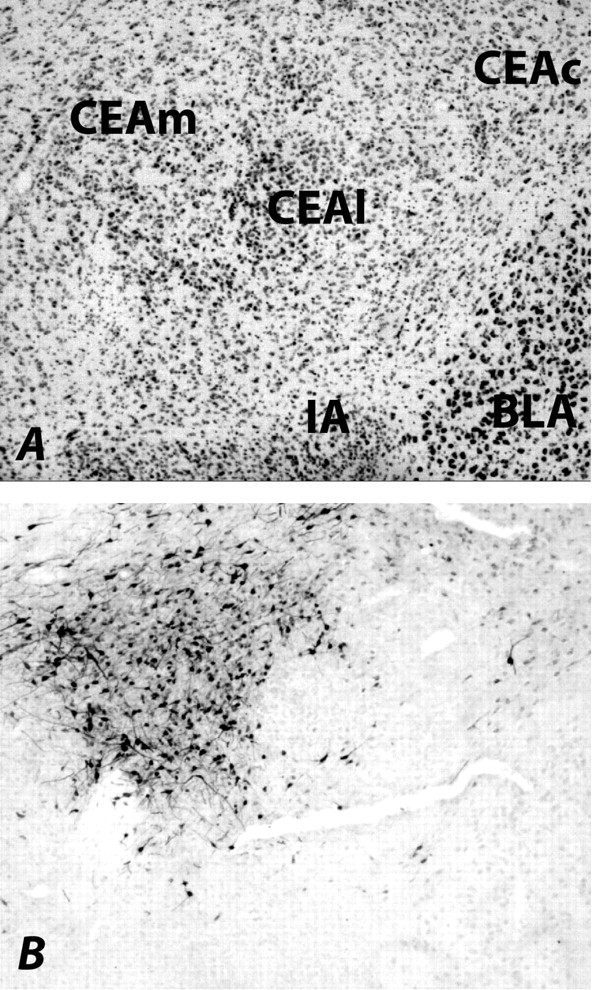
Photomicrographs illustrating FG-labeled amygdala central nucleus (CEA) neurons (B) and the adjacent thionin-stained section (A). There is a heavy FG staining in the medial CEA (CEAm) and a very light FG staining in the capsular part of CEA (CEAc). However, no labeling is seen in the lateral CEA (CEAl) as well as in the BLA. IA, Intercalated nucleus of the amygdala.
Fos expression in CeA
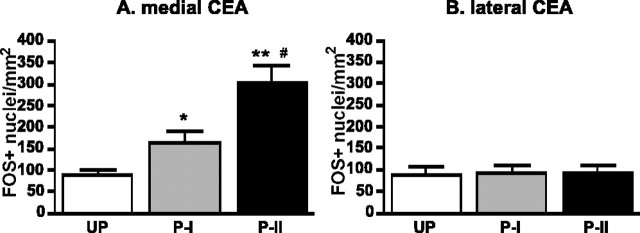
Figure 4 shows representative Fos-positive cells in the medial CeA (left) and the lateral CeA (right) of each group. There was a significant group effect in Fos expression in the medial CeA (F(2,12) = 18.66; p < 0.001) (Fig. 5A), in which groups paired I and II expressed higher numbers of Fos-positive neurons compared with the unpaired group (p < 0.05 and p < 0.0001, respectively). Furthermore, group paired II had higher Fos-positive cells in the medial CeA than group paired I (p < 0.01). In contrast, the numbers of Fos-positive cells in the lateral CeA did not differ among groups (F(2,12) = 0.023; p > 0.05) (Fig. 5B) and was similar to the number seen in the medial CeA of the unpaired group.
Figure 4.
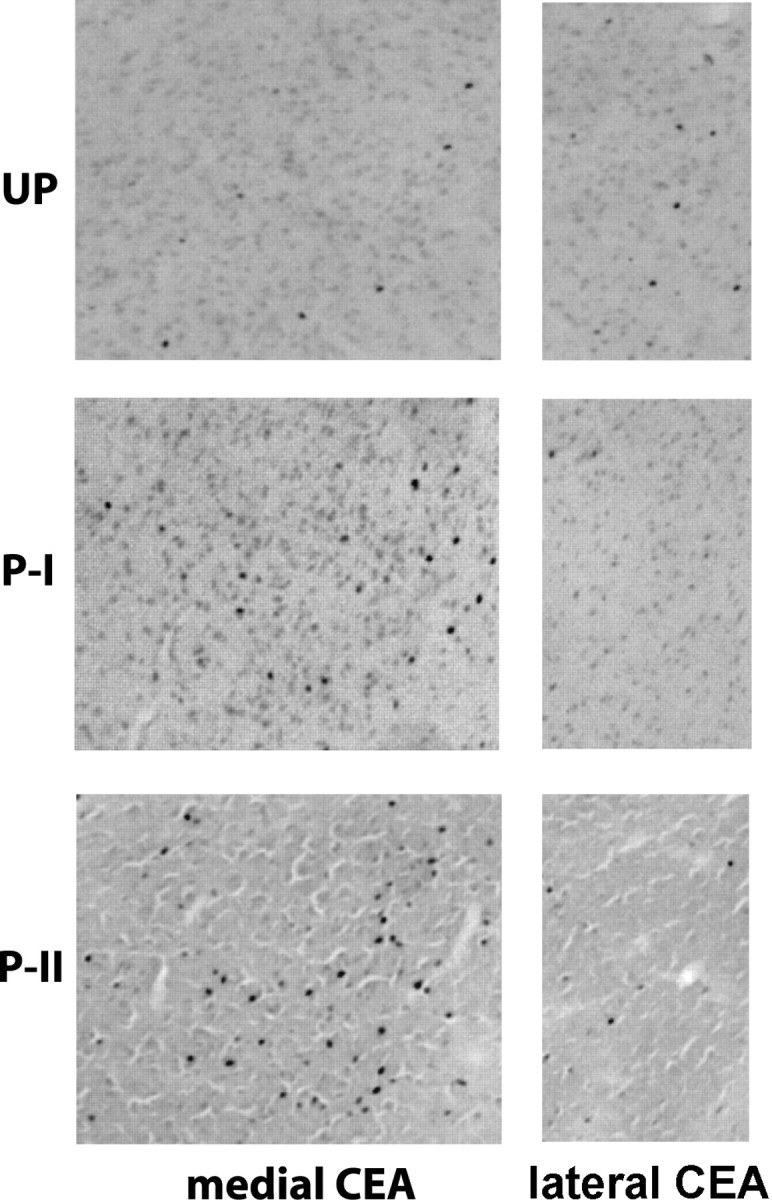
Representative photomicrographs of the medial amygdala central nucleus (CEA) (left) and lateral CEA (right) in the immunocytochemically processed tissues for Fos. Darkly stained dots indicate Fos-positive nuclei. UP, Unpaired; P-I, paired I; P-II, paired II.
Figure 5.
Mean ± SE numbers of Fos-positive cells in the medial amygdala central nucleus (CEA) (A) and lateral CEA (B). In the medial CEA, the paired I (P-I) and paired II (P-II) groups showed higher Fos-positive cells than the unpaired group (UP) (*p < 0.05 and **p < 0.001, respectively). In addition, the number of Fos-positive cells in P-II was higher than the numbers in P-I (#p < 0.01) in the medial CEA. The number of Fos-positive cells in the lateral CEA did not differ among three groups and was similar to the number of UP medial CEA.
Colocalization of FG and Fos in CeA
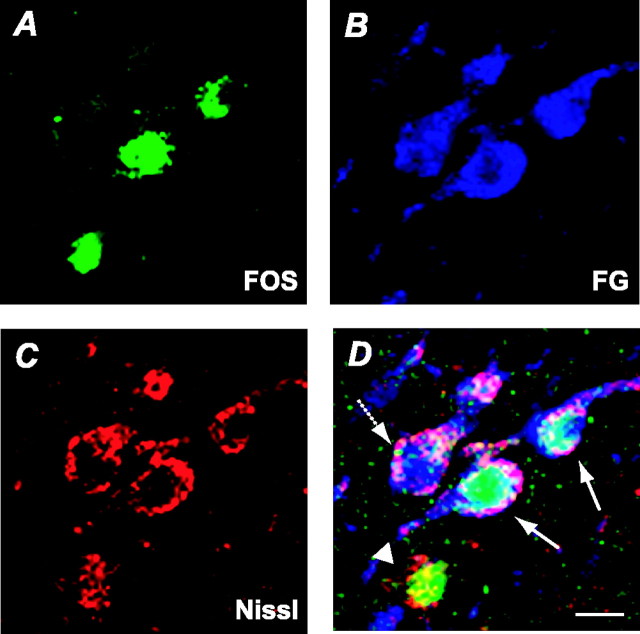
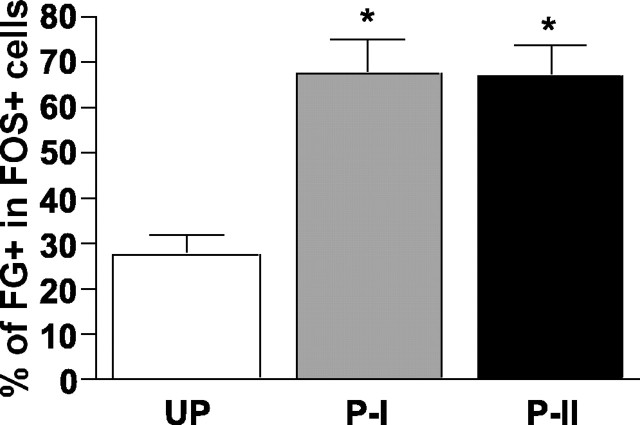
Figure 6 shows an example of medial CeA neurons that were immunoreactive for Fos, FG, and Nissl. In this illustration, two neurons (solid arrows) are double-labeled with Fos and FG, one neuron is labeled only with FG (dotted arrow), and one neuron is positive for Fos alone (arrowhead). In sampling done for confocal analyses, ∼50% of Nissl-stained cells (∼200 cells counted per animal) were positive for FG, and, as expected, that proportion did not differ across groups. The majority of the Fos-positive cells within this sample were also positive for FG in both paired groups but not in the unpaired group (Fig. 7). Thus, most of the CeA neurons that were activated by the CS were those that projected to SNc. ANOVA of the numbers of double-labeled cells showed a significant group effect (F(2,12) = 15.44; p < 0.001), and post hoc comparisons showed that groups paired I and II each had more double-labeled cells than the unpaired group (p values < 0.001).
Figure 6.
Photomicrographs of the medial amygdala central nucleus (CEA) neurons in the immunofluorescence-labeled tissue for Fos, FG, and Nissl. The same section was visualized separately by confocal microscopy for Fos-positive cells (A), FG-positive cells (B), and Nissl-stained cells (C). D is the composite picture of A-C. It shows two cells (solid arrows) coexpressing FG and Fos and cells expressing either FG (dotted arrow) or Fos (arrowhead). Scale bar, 10 μm.
Figure 7.
Mean ± SE percentage of FG-positive cells within Fos-positive cells in the medial CeA. The percentage of FG and Fos double labeling in the paired I (P-I) and paired II (P-II) groups was significantly higher compared with the percentage of double labeling in the unpaired group (UP) (*p < 0.001).
Experiment 2
Histology
Twenty-six rats were judged as having acceptable lesions of both CeA and SNc. CeA lesions were rejected (n = 8) if there was <40% damage to the medial portion of CeA, or if there was more than minimal damage to regions adjoining CeA. SNc lesions were rejected (n = 2) if there was <70% damage to SNc, if TH staining of DLS was not substantially lighter in the hemisphere with the SNc lesion, or if there was more than minimal damage to the VTA. The brains with acceptable histologies (16 contralateral and 10 ipsilateral) averaged 50% damage to medial CeA [levels 23-28 from Swanson (1992)] and 80% damage to SNc [levels 36-39 from Swanson (1992)]. Sparing of medial CeA neurons was mostly in the anterior regions [levels 23 and 24 from Swanson (1992)], and sparing of SNc adjoined VTA. Figure 8 shows histology from a typical rat that received a lesion of the CeA in the left hemisphere and a lesion of SNc in the right hemisphere.
Figure 8.
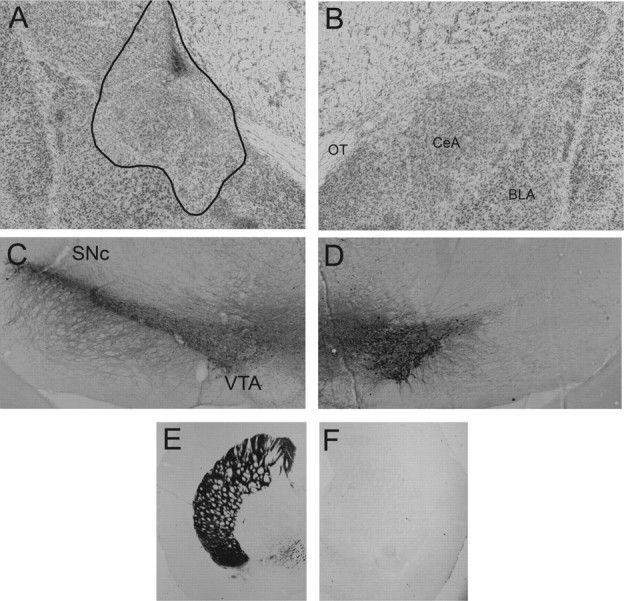
Photomicrographs illustrating the CeA and SNc lesions of a rat that received a lesion of the CeA in the left hemisphere and SNc in the right hemisphere in experiment 2. A and B show Nissl-stained sections of lesioned and intact CeAs, C and D show staining for tyrosine hydroxylase in sections of intact and lesioned SNcs, and E and F show tyrosine hydroxylase staining in the DLS targets of SNc. OT, Optic tract.
Behavior
The lesions had no differential effects on unconditioned ORs observed in the two pretest sessions. Across both CSs and sessions, mean ± SEM ORs (elevation scores) were 27.5 ± 3.3% in the contralaterally lesioned rats and 29.7 ± 4.9% in the ipsilaterally lesioned rats. ANOVA showed no significant effect of lesion (F(1,24) = 2.10; p > 0.10).
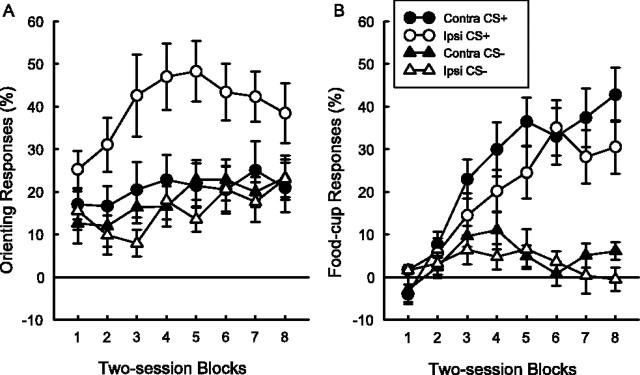
Figure 9 shows the primary data of experiment 2, the acquisition of conditioned ORs and food-cup responses during discrimination training. Rats with ipsilateral CeA-SNc lesions, which left communication between those two regions intact in one hemisphere, rapidly acquired conditioned ORs (Fig. 9A) to the reinforced visual CS+ but maintained pretest levels of ORs during the nonreinforced CS-. In contrast, rats with contralateral CeA-SNc lesions, which prevented communication between CeA and SNc, showed no evidence for acquisition of those conditioned ORs. At the same time, the contralateral lesions had no effect on acquisition of food-cup behavior to CS+ (Fig. 9B), which was rapid in both contralaterally and ipsilaterally lesioned rats. Thus, the learning deficit observed in the acquisition of conditioned ORs in the contralterally lesioned rats was confined to that response and did not reflect more general deficits in learning ability, motivation, or arousal.
Figure 9.
Mean ± SE ORs (A) and food-cup responses (B) in the conditioning phase of experiment 2. Contra refers to rats that received lesions of CeA in one hemisphere and of SNc in the other hemisphere, which prevented communication between those brain regions. Ipsi refers to rats that received lesions of CeA and SNc in the same hemisphere, which left CeA-SNc communication intact in the other hemisphere. CS+ refers to the reinforced visual conditioned stimulus, and CS- refers to the nonreinforced visual CS. The values shown are elevation scores, calculated by subtracting pre-CS baseline responding from responding during the CSs.
These descriptions of the data are supported statistically. A lesion (contralateral or ipsilateral) by CS contingency (reinforced or nonreinforced) by session block ANOVA of ORs showed significant main effects of CS contingency (F(1,24) = 11.18; p = 0.003) and session blocks (F(7,168) = 3.81; p < 0.001). Most important, both the lesion by CS contingency (F(1,24) = 7.59; p = 0.011) and the lesion by CS contingency by blocks (F(7,168) = 2.36; p = 0.026) interactions were significant, showing that the difference between responding to CS+ and CS- and the acquisition of that difference depended on the lesion condition. Finally, post hoc comparison of overall ORs to CS+ and CS- in the two lesion conditions, using Tukey's honest-significant-difference procedure, showed that ORs to the CS+ in the ipsilaterally lesion rats were significantly greater than ORs to the CS- in those rats and greater than responding to either CS+ or CS- in the contralaterally lesioned rats (p values < 0.05). No other contrasts in this comparison were significant (p values > 0.80).
A similar three-way ANOVA of food-cup responding showed significant main effects of CS contingency (F(1,24) = 72.83; p < 0.001) and session blocks (F(7,168) = 14.88; p < 0.001). However, unlike with ORs, neither the lesion by CS contingency interaction nor the lesion by CS contingency by blocks interaction was significant (F values < 1; p values > 0.30). Thus, unlike with ORs, the acquisition of conditioned food-cup responding was not affected by disruption of communication between CeA and SNc.
Comparable three-way ANOVAs of pre-CS responding showed no significant effects or interactions for either behavior (p values > 0.30). Pre-CS levels of each behavior ranged between 4.4 and 7.5%.
Discussion
These experiments demonstrated the involvement of amygdalonigral circuitry in appetitive pavlovian conditioning with a visual CS and food US. In experiment 1, after test presentations of the CS, Fos expression in the medial CeA was greater in rats that had received CS-US food pairings than rats that had received the CS and US unpaired. Furthermore, in the paired groups, but not the unpaired group, the majority of the Fos-positive neurons in CeA were neurons that projected to SNc. Those neurons showed double labeling for both Fos and FG, after injection of FG into the lateral SNc. Thus, as a result of associative learning, a visual CS activated CeA neurons that project directly to SNc. In experiment 2, asymmetrical lesions that disconnected CeA from SNc, but left function of each region intact in one hemisphere, prevented the acquisition of conditioned ORs but had no effect on either the acquisition of conditioned behavior directed to the food-cup or unconditioned ORs, relative to rats with ipsilateral lesions of CeA and SNc. Thus, experiment 2 demonstrated that communication between CeA and SNc is critical for the acquisition of conditioned ORs. These results support the suggestion of Han et al. (1997) that communication between CeA and DLS, also essential for conditioned ORs, is mediated by the projections of CeA to SNc.
In experiment 1, our observation of heavy retrograde FG labeling in medial CeA but practically no labeling in lateral CeA, after FG injection into the lateral SNc, confirms previous anatomical studies that used the anterograde tracer PHAL. In those studies, injections of PHAL into the medial area of CeA, but not the lateral area of CeA, labeled the lateral part of SNc (Gonzales and Chesselet, 1990; Petrovich and Swanson, 1997; Zahm et al., 1999). Thus, the medial CeA appears to be the major source of the direct amygdala input to the lateral SNc, because no amygdala nuclei other than CeA send projections to the SNc (Pitkänen, 2000).
The results of experiment 1 do not distinguish between the role of CeA-SNc projections in learning of conditioned ORs specifically, as opposed to other aspects of appetitive conditioning, such as anticipatory food-cup CRs. Nevertheless, such specificity is indicated by the results of experiment 2, which show that communication between CeA and SNc is critical for learning or expressing conditioned ORs but not food-cup CRs. Although the findings of experiment 2 do not distinguish between the roles of projections from CeA to SNc and reciprocal projections from SNc to CeA, the results of experiment 1 show that the ascending CeA-SNc projections are in fact engaged in these conditioning tasks. A role for the reciprocal connections could be identified by injecting retrograde tracer in CeA and examining neuronal activation in SNc, using methods comparable with experiment 1.
It is important to recognize that the methods used in experiment 1 provide information about the functional anatomy of this circuit, which goes beyond the results of lesion studies such as those of Gallagher et al. (1990), Han et al. (1997), and experiment 2 of the present study. First, in a general sense, although lesion studies demonstrate that particular brain structures are necessary for normal conditioned orienting, the roles of those structures in that function are only inferred from the absence of function consequent to the lesions. In contrast, experiment 1 provides direct information about CeA function that is engaged in the context of learning. CeA neurons with histologically verified projections to SNc showed conditioning-dependent Fos activation. Indeed, a large majority of the Fos-labeled neurons were those that project to SNc. Furthermore, these neurons (Fig. 5) were recruited early in the course of conditioning (group paired I), and even at this early stage of learning, the majority of the recruited neurons were those that project to SNc (Fig. 7). Indeed, the percentage of SNc projecting neurons within the CeA neurons activated by the CS was equally high earlier and later (group paired II) in conditioning. Thus, as observed in other systems (Berger et al., 1976), neuronal activation, dependent on CS-US pairings, was observed before the emergence of a behavioral CR.
Second, although experiment 2 showed that communication between CeA and SNc is critical for this conditioning function, it cannot distinguish between the role of direct projections from CeA and SNc, identified in experiment 1, and potential indirect CeA pathways that involve an additional structure that relays information between CeA and SNc. Finally, by combining neuronal activation and anatomical tracing techniques, experiment 1 provides considerably more anatomical specificity than is usually provided by lesion studies. For example, its results show that only neurons in the medial CeA, which project to SNc, and not those in the lateral CeA, which do not, exhibit conditioning-dependent Fos activation. Thus, in the case of appetitive conditioning, it is unlikely that the lateral CeA plays an important part in modulating the activity of medial CeA, a role that has been suggested for lateral CeA in fear conditioning (Petrovich and Swanson, 1997). Notably, in the case of fear conditioning, it has often been suggested that medial CeA activation is influenced by outputs of the lateral amygdala (LA), for example, via the amygdala basal nuclei, amygdala intercalated neurons, or lateral CeA (Paré et al., 2004). However, unlike in fear conditioning, in which lesions to BLA and LA result in pronounced deficits in fear responses (Davis, 2000), such lesions have no effects on conditioned ORs and CRs in appetitive conditioning (Hatfield et al., 1996). Thus, it is unlikely that LA or BLA plays an important part in modulating the activity of medial CeA in appetitive conditioning.
Previously (Holland and Gallagher, 1999), we have described the development of conditioned orienting, which depends on the CeA-SNc projections studied here, as a manifestation of altered attention to signals for biologically significant events. Other evidence shows that CeA also plays important roles in the modulation of several aspects of attention in learning tasks (Holland and Gallagher, 1999). For example, lesions of the CeA impair performance in a multiple-choice reaction time task when the demand for selective attention is increased (Holland et al., 2000). Likewise, whereas in intact rats the surprising omission of anticipated events increases attention to stimuli that accompany that surprise, enhancing subsequent learning about those stimuli, rats with CeA lesions fail to show such enhancement (Holland and Gallagher, 1993). Other studies from our laboratory show that these surprise-induced enhancements of attention are mediated by circuitry that includes the CeA, cholinergic neurons in the basal forebrain nucleus basalis/substantia innominata, and the posterior parietal cortex (Chiba et al., 1995; Bucci et al., 1998; Han et al., 1999). Thus, it appears that the CeA can regulate various aspects of attentional information processing through its influence on different brain circuitry.
The present study joins others in demonstrating an important role for ascending projections of the CeA in appetitive conditioning. It is notable that many of the CeA descending efferents implicated in conditioned cardiac responses and other CRs found in fear conditioning also have their origins in medial CeA (Gray et al., 1989; Rizvi et al., 1991; Wallace et al., 1992; Sun et al., 1994). It is of interest to determine whether the same neurons, or different subpopulations of neurons, in medial CeA are in involved in aspects of appetitive and aversive conditioning. The techniques described in experiment 1 could be adapted readily to such an investigation by analyzing colocalization (in medial CeA) of conditioning-dependent Fos expression and two distinguishable retrograde labels, one injected into SNc and the other into a particular target of descending CeA efferents.
Footnotes
This work was supported by National Institute of Mental Health Grant MH53667. The data described in experiments 1 and 2 were presented at the 2003 and 2004 meetings of the Society for Neuroscience [Lee et al. (2003) and McDannald et al. (2004), respectively]. We thank Heather El-Amamy, Mary Keough, and Robert Purgert for their assistance in video scoring in experiment 2.
Correspondence should be addressed to H. J. Lee, Department of Psychological and Brain Sciences, Johns Hopkins University, Baltimore, MD 21218. E-mail: hjlee@jhu.edu.
Copyright © 2005 Society for Neuroscience 0270-6474/05/253881-08$15.00/0
References
- Beckstead RM, Domesick VB, Nauta WJH (1979) Efferent connections of the substantia niagra and ventral tegmental area in the rat. Brain Res 175: 191-217. [DOI] [PubMed] [Google Scholar]
- Berger TW, Alger BE, Thompson RF (1976) Neuronal substrate of classical conditioning in the hippocampus. Science 192: 483-485. [DOI] [PubMed] [Google Scholar]
- Bucci DJ, Holland PC, Gallagher M (1998) Removal of cholinergic input to rat posterior parietal cortex disrupts incremental processing of conditioned stimuli. J Neurosci 18: 8038-8046. [DOI] [PMC free article] [PubMed] [Google Scholar]
- Campeau S, Davis M (1995) Involvement of the central nucleus and basolateral complex of the amygdala in fear conditioning measured with fear-potentiated startle in rats trained concurrently with auditory and visual conditioned stimuli. J Neurosci 15: 2301-2311. [DOI] [PMC free article] [PubMed] [Google Scholar]
- Carrive P, Lee J, Su A (2000) Lidocaine blockade of amygdala output in fear-conditioned rats reduces Fos expression in the ventrolateral periaqueductal gray. Neuroscience 95: 1071-1080. [DOI] [PubMed] [Google Scholar]
- Chiba AA, Bucci DJ, Holland PC, Gallagher M (1995) Basal forebrain cholinergic lesions disrupt increments but not decrements in conditioned stimulus processing. J Neurosci 15: 7315-7322. [DOI] [PMC free article] [PubMed] [Google Scholar]
- Davis M (2000) The role of the amygdala in conditioned and unconditioned fear and anxiety. In: The amygdala: a functional analysis, Ed 2 (Aggleton JP, ed), pp 213-287. New York, Oxford UP.
- Gallagher M, Graham PW, Holland PC (1990) The amygdala central nucleus and appetitive Pavlovian conditioning: lesions impair one class of conditioned behavior. J Neurosci 10: 1906-1911. [DOI] [PMC free article] [PubMed] [Google Scholar]
- Gonzales C, Chesselet M-F (1990) Amygdalonigral pathway: an anterograde study in the rat with Phaseolus vulgaris leucoagglutiniin (PHA-L). J Comp Neurol 297: 182-200. [DOI] [PubMed] [Google Scholar]
- Gray TS, Carney ME, Magnuson DJ (1989) Direct projections from the central amygdaloid nucleus to the hypothalamic paraventricular nucleus: possible role in stress-induced adrenocorticotropin release. Neuroendocrinology 50: 433-446. [DOI] [PubMed] [Google Scholar]
- Han J-S, McMahan RW, Holland PC, Gallagher M (1997) The role of an amygdalo-nigrostriatal pathway in associative learning. J Neurosci 17: 3913-3919. [DOI] [PMC free article] [PubMed] [Google Scholar]
- Han J-S, Holland PC, Gallagher M (1999) Disconnection of the amygdala central nucleus and substantia innominata/nucleus basalis disrupts increments in conditioned stimulus processing in rats. Behav Neurosci 113: 143-151. [DOI] [PubMed] [Google Scholar]
- Hatfield T, Han J-S, Conley M, Gallagher M, Holland PC (1996) Neurotoxic lesions of basolateral, but no central, amygdala interfere with Pavlovian second-order conditioning and reinforcer devaluation effects. J Neurosci 16: 5256-5265. [DOI] [PMC free article] [PubMed] [Google Scholar]
- Holland PC (1977) Conditioned stimulus as a determinant of the form of the Pavlovian conditioned responses. J Exp Psychol Anim Behav Process 3: 77-104. [DOI] [PubMed] [Google Scholar]
- Holland PC (1979) Differential effects of omission contingencies on various components of Pavlovian appetitive conditioned responding in rats. J Exp Psychol Anim Behav Process 5: 178-193. [DOI] [PubMed] [Google Scholar]
- Holland PC (1984) The origins of Pavlovian conditioned behavior. In: The psychology of learning and motivation, Vol 18 (Bower G, ed), pp 129-173. Englewood Cliffs, NJ: Prentice-Hall. [Google Scholar]
- Holland PC, Gallagher M (1993) Amygdala central nucleus lesions disrupt increments, but no decrements, in CS processing. Behav Neurosci 107: 246-253. [DOI] [PubMed] [Google Scholar]
- Holland PC, Gallagher M (1999) Amygdala circuitry in attentional and representational processes. Trends Cogn Sci 3: 65-73. [DOI] [PubMed] [Google Scholar]
- Holland PC, Han J-S, Gallagher M (2000) Lesions of the amygdala central nucleus alter performance on a selective attention task. J Neurosci 20: 6701-6706. [DOI] [PMC free article] [PubMed] [Google Scholar]
- Hunt PS, Campbell BA (1997) Autonomic and behavioral correlates of appetitive conditioning in rats. Behav Neurosci 111: 494-502. [DOI] [PubMed] [Google Scholar]
- Kapp BS, Frysinger RC, Gallagher M, Haselton JR (1979) Amygdala central nucleus lesions: effects on heart rate conditioning in the rabbit. Physiol Behav 23: 1109-1117. [DOI] [PubMed] [Google Scholar]
- Lee HJ, Cantalini JP, Gallagher M, Holland PC (2003) Amygdalo-nigral circuitry for expression of conditioned orienting. Soc Neurosci Abstr 29: 621.14. [Google Scholar]
- McDannald M, Groshek F, Holland PC (2004) The amygdala and dopaminergic modulation of conditioned orienting in rats. Soc Neurosci Abstr 30: 206.9. [Google Scholar]
- Nader K, Majidishad P, Amorapanth P, LeDoux JE (2001) Damage to the lateral and central, but not other, amygdaloid nuclei prevents the acquisition of auditory fear conditioning. Learn Mem 8: 156-163. [DOI] [PMC free article] [PubMed] [Google Scholar]
- Oades RD, Halliday GM (1987) Ventral tegmental (A10) system: neurobiology. 1. anatomy and connectivity. Brain Res 434: 117-165. [DOI] [PubMed] [Google Scholar]
- Paré D, Quirk GJ, LeDoux JE (2004) New vistas on amygdala networks in conditioned fear. J Neurophysiol 92: 1-9. [DOI] [PubMed] [Google Scholar]
- Paxinos G, Watson C (1986) The rat brain, Ed 2. San Diego: Academic
- Petrovich GD, Swanson LW (1997) Projections from the lateral part of the central amygdala nucleus to the postulated fear conditioning circuit. Brain Res 763: 247-254. [DOI] [PubMed] [Google Scholar]
- Pitkänen A (2000) Connectivity of the rat amygdaloid complex. In: The amygdala: a functional analysis, Ed 2 (Aggleton JP, ed), pp 31-115. New York: Oxford UP.
- Price JL, Amaral DG (1981) An autoradiographic study of the projections of the central nucleus of the monkey amygdala. J Neurosci 1: 1242-1259. [DOI] [PMC free article] [PubMed] [Google Scholar]
- Rizvi TA, Ennis M, Behbehani MM, Shipley MT (1991) Connections between the central nucleus of the amygdala and the midbrain periaqueductal gray: topography and reciprocity. J Comp Neurol 303: 121-131. [DOI] [PubMed] [Google Scholar]
- Sagar SM, Sharp FR, Curran T (1988) Expression of c-fos protein in the brain: metabolic mapping at the cellular level. Science 240: 1328-1331. [DOI] [PubMed] [Google Scholar]
- Sananes CB, Campbell BA (1989) Role of the central nucleus of the amygdala in olfactory heart rate conditioning. Behav Neurosci 103: 519-525. [PubMed] [Google Scholar]
- Sun N, Yi H, Cassell MD (1994) Evidence for a GABAergic interface between cortical afferents and brainstem projection neurons in the rat central extended amygdala. J Comp Neurol 340: 43-63. [DOI] [PubMed] [Google Scholar]
- Swanson LW (1992) Brain maps: structure of the rat brain. Amsterdam: Elsevier
- Wallace DM, Magnuson DJ, Gray TS (1992) Organization of amygdaloid projections to brainstem dopaminergic, noradrenergic, and adrenergic cell groups in the rat. Brain Res Bull 28: 447-454. [DOI] [PubMed] [Google Scholar]
- Zahm DS, Jensen SL, Williams ES, Martin III JR (1999) Direct comparison of projections from the central amygdaloid region and nucleus accumbens shell. Eur J Neurosci 11: 1119-1126. [DOI] [PubMed] [Google Scholar]


