

Abstract
Background
Whether there is an unusual degree of unevenness in the cognitive abilities of children with autism spectrum disorder (ASD) and whether different cognitive profiles among children with ASD might index etiologically significant subgroups are questions of continued debate in autism research.
Method
The Differential Ability Scales (DAS) and the Autism Diagnostic Observation Schedule (ADOS) were used to examine profiles of verbal and nonverbal abilities and their relationship to autistic symptomatology in 120 relatively high-functioning children with ADI-confirmed diagnoses of autism.
Results
Discrepancies between verbal and nonverbal ability scores occurred at a significantly higher rate than in the DAS normative sample (30%) in both a younger group of 73 children (56%) with a mean age of 5;5 and an older group of 47 children (62%) with a mean age of 8;11. Discrepancies were mainly in favor of nonverbal ability in the younger group, but occurred equally in favor of verbal and nonverbal abilities in the older group. Comparison of the two age groups suggested a growing dissociation between verbal and nonverbal (and particularly visual processing) skills with age. In the older group, children with discrepantly higher nonverbal abilities demonstrated significantly greater impairment in social functioning, as measured on the ADOS, independent of absolute level of verbal and overall ability.
Conclusions
These findings demonstrate a high rate of uneven cognitive development in children with ASD. Indications of a dissociation between verbal and visual-perceptual skills among the older children, and the specific association of discrepantly high nonverbal skills with increased social symptoms suggest that the nonverbal > verbal profile may index an etiologically significant subtype of autism.
Keywords: Autistic disorder, behavioral phenotypes, cognition, individual differences, intelligence, symptomatology
Abbreviations: ADI-R: Autism Diagnostic Interview - Revised, ADOS: Autism Diagnostic Observation Schedule, ASD: autism spectrum disorder, DAS: Differential Ability Scales, GCA: General Conceptual Ability, NV: Nonverbal, PDDNOS: Pervasive Developmental Disorder Not Otherwise Specified, V: Verbal
The relevance of IQ to the etiology and symptomatic expression of autism remains unclear. Although approximately three-quarters of individuals with autism have below-average IQ (< 70), autism can occur with equal severity in individuals of average and above-average IQ. While the finding that IQ can vary widely between identical twins with autism (Le Couteur et al., 1996) would also suggest that it is not a useful marker of genetic subgroup differences in autism, there is nonetheless evidence from large-scale behavioral genetic studies (Bolton et al., 1994; Fein et al., 1999; Szatmari et al., 2000) that IQ broadly defined (e.g., high versus low Verbal or Full Scale IQ) may index etiological heterogeneity and provide a basis for subtyping in autism.
In addition to ongoing attempts to elucidate the complex relationship of general intelligence, and particularly of mental retardation, to autism (Bailey, Phillips, & Rutter, 1996), there has also been longstanding interest in the uneven intellectual abilities of individuals with autism. One question has been whether routinely administered IQ tests reveal any consistent pattern of cognitive strengths and weaknesses in autism. A Wechsler (1991, 1997) IQ profile with Verbal IQ (VIQ) depressed relative to Performance IQ (PIQ) and peak subtest score on Block Design (Happé, 1994; Lincoln, Allen, & Kilman, 1995) has traditionally been associated with autism and has even been suggested as a possible diagnostic aid (Lincoln, Courshesne, Kilman, Elmasian, & Allen, 1988). Although a recent meta-analytic review of 23 published studies (Lincoln, Courchesne, Allen, Hanson, & Ene, 1998) confirmed that VIQ is generally lower than PIQ in autism, a VIQ < PIQ profile has not been found consistently across studies (see review by Siegel, Minshew, & Goldstein, 1996). Some authors (Rumsey, 1992; Siegel et al., 1996) have attempted to explain these inconsistent findings by proposing that the difference between Verbal and Performance IQ in autism depends on the severity of impairment and diminishes as intellectual ability approaches the normal range. Yet, a VIQ < PIQ profile has been reported in several studies of high-functioning individuals with autism (see reviews by Lincoln et al., 1998; Siegel et al., 1996). It has also been suggested that the difference between Verbal and Performance IQ lessens with age and associated improvements in language functioning, at least among higher-functioning individuals with autism (Lincoln et al., 1998). This hypothesis has been difficult to evaluate because most studies have included individuals spanning a wide range of ages, and very few studies have provided the opportunity to compare developmental differences between younger and older children.
VIQ–PIQ discrepancies have also played a prominent role in efforts to define Asperger syndrome as distinct from autism. Klin, Volkmar, Sparrow, Cicchetti, and Rourke (1995) demonstrated a VIQ > PIQ discrepancy among a sample of individuals diagnosed with Asperger syndrome, opposite to the pattern typically found in autism. However, subsequent studies (Manjiova & Prior, 2000; Ozonoff, South, & Miller, 2000) have failed to differentiate Asperger syndrome from autism on the basis of Wechsler IQ profiles. These inconsistent findings may reflect differences in the way Asperger syndrome was diagnosed. The Klin et al. study used the most stringent criteria, requiring a circumscribed interest and motor clumsiness for inclusion in their Asperger group. It is possible that these specific criteria selected for individuals with a VIQ > PIQ profile, as the development of circumscribed interests is likely to be mediated by verbal skills, and motor problems might be expected to be associated with deficits in PIQ. The problem of circularity in attempts to provide external validation for the distinction between autism and Asperger syndrome has been well recognized (e.g., Klin & Volkmar, 1997; Volkmar & Klin, 2001).
Questions of their broader nosological value aside, analyses of cognitive profiles within autism have suffered from two major limitations. First, emphasis on identifying a prototypical cognitive profile has been at the expense of considering the possibility of more than one cognitive profile in autism. At a conceptual level, recent advances in genetics and the understanding of autism as a complex disorder allow for the possibility of genetically meaningful variation in the cognitive phenotype of autism, which could potentially account for variation in the behavioral expression of autism. Yet, little attention has been paid to individual differences in cognitive profiles in autism. Particularly in the case of VIQ–PIQ differences, the report of group means for autistic samples could have the effect of ‘averaging out’ significant individual discrepancies that actually occur in both directions.
The second limitation concerns the usefulness of Wechsler subscale discrepancies for characterizing cognitive profiles in autism. Individuals with autism have frequently been reported to exhibit a characteristic pattern of unevenness in the subtest scores from which Wechsler Verbal and Performance IQs are derived (Happé, 1994; Siegel et al., 1996). For example, Block Design, a measure of visuospatial constructional ability, reliably yields the highest Wechsler subtest score in autism. In contrast, Picture Arrangement, another Performance subtest, but one which requires social-inductive reasoning, yields one of the lowest subtest scores on the Wechsler scales. Factor analysis has shown that Picture Arrangement and Block Design are weakly correlated and measure distinct abilities in individuals with autism (Lincoln et al., 1988). Characteristic patterns of scatter are also found on the Wechsler Verbal scale. For example, Digit Span is regularly reported to be a relative strength on the Wechsler scales. Findings such as these raise questions about the interpretability of VIQ and PIQ scores in autism, and of any discrepancy that is (or is not) found between these scores.
In the present study, we addressed two main issues. The first was whether children with autism exhibit characteristic patterns of unevenness in their cognitive abilities and, if so, whether such patterns or profiles differ as a function of age or overall ability. To answer these questions, we assessed the cognitive abilities of a large sample of children with autism using the Differential Ability Scales (DAS; Elliott, 1991), a revised version of the British Ability Scales (Elliott, Murray, & Pearson, 1979). The DAS is comprised of a Preschool and a School-Age battery. Each battery consists of only six core subtests, selected for their high loadings on psychometric g, but with sufficient specific variance to support separate cluster scores. The DAS factor structure and corresponding cluster scores are in accord with current models of human intelligence (Carroll, 1993; Mackintosh, 1998). They include Verbal and Nonverbal ability, the latter of which is further differentiated into Nonverbal Reasoning and Spatial ability in the School-Age battery. The DAS thus distinguishes between nonverbal subtests that primarily measure visual-spatial organization from nonverbal subtests that primarily measure inductive reasoning abilities.1 This is in contrast to the Wechsler system, which subsumes similarly divergent nonverbal subtests under its Performance subscale (Elliot, 1990).
The second issue was whether different cognitive profiles in autism are associated with differences in core symptomatology. To address this issue, we assessed children’s social and communicative functioning using the Autism Diagnostic Observation Schedule (ADOS; Lord, Rutter, DiLavore, & Risi, 1999). The ADOS is a semi-structured, interactive observation scale that provides quantitative ratings of communicative and social behaviors corresponding to DSM-IV (APA, 1994) and ICD-10 (WHO, 1993) criteria for autism. The summary ratings from the ADOS allowed us to relate children’s neurocognitive profiles to quantitative measures of symptom severity in both the communication and social domains. This approach provided a way of potentially accounting for empirically defined phenotypic variance in autism while avoiding the methodological pitfalls involved in using a priori definitions, such as in recent attempts to differentiate Asperger syndrome from autism.
Methods
Participants
The sample included 120 children (108 males, 12 females) with autism from 3;8 to 13;11 in age. Participants were drawn from among children evaluated through a developmental disorders clinic at the University of Chicago (n = 57) and children recruited for a community-based research program on language functioning in autism at the Eunice Kennedy Shriver Center (n = 63). All children met criteria for autism on the Autism Diagnostic Interview – Revised (ADI-R; Lord, Rutter, & LeCouteur, 1994), and were clinically confirmed to meet DSM-IV (APA, 1994) criteria for autism or PDDNOS by experienced clinicians who observed and interacted with them over several visits. Participant characteristics are described in Table 1.
Table 1.
Participant characteristics
| Preschool DAS (n = 73) M (SD) | School-Age DAS (n = 47) M (SD) | ||||
|---|---|---|---|---|---|
| Age | 5;5 (0;10) | 8;11 (2;0) | |||
| DAS scores | |||||
| GCA* | 76.7 (15.0) | 84.5 (20.7) | |||
| Verbal* | 74.3 (15.6) | 83.0 (22.7) | |||
| Nonverbala | 84.0 (18.5) | 87.4 (21.2) | |||
| ADI-R scores | |||||
| Communication* | 16.2 (3.8) | 18.0 (4.1) | |||
| Social* | 20.2 (5.4) | 22.1 (4.5) | |||
| Repetitive Behaviors | 6.2 (2.4) | 7.0 (2.7) | |||
Significant difference between group means; p < .05.
For the School-Age DAS, a standardized Nonverbal Composite score (in lieu of separate Nonverbal Reasoning and Spatial scores) was derived from the 4 nonverbal subtests.
Measures
Differential Ability Scales (DAS; Elliott, 1990)
The Preschool and School-Age levels of the DAS each consists of 6 core subtests, from which a General Conceptual Ability (GCA) summary score (formally equivalent to the Wechsler Full Scale IQ) and cluster (or subscale) scores are derived. Whereas GCA and cluster scores are calculated as standard scores (with a mean of 100 and standard deviation of 15), individual subtest scores are calculated as T-scores (with a mean of 50 and standard deviation of 10). The School-Age level is for ages 6;0 to 17;11. The Preschool level is usually for ages 3;6 to 6;0, but complete norms are available up to age 6;11, which allows for lower-ability 6-year-olds to be tested at a more appropriate developmental level. Although lower-ability children from age 7 to 13 can also be tested on the Preschool DAS, such ‘out of level’ administration only yields a GCA summary score and does not provide the standardized cluster and subtest scores that are necessary for profile analysis.
According to test development documentation (Elliott, 1990), factor analyses of the Preschool core sub-tests supported a distinction between a Verbal cluster, comprised of 2 subtests, and a Nonverbal cluster, comprised of 3 subtests. One additional Preschool core subtest (Early Number Concepts) contributed to both verbal and nonverbal factors and was therefore not included in either cluster, but was retained for the calculation of the GCA summary score because of its high g loading. For the School-Age core subtests, factor analyses supported distinctions between 3 clusters, identified as Verbal, Nonverbal Reasoning, and Spatial, and consisting of two subtests each. Table 2 provides a brief description of Preschool and School-Age DAS core subtests.
Table 2.
Preschool and School-Age DAS core subtests
| Preschool DAS | Task and ability measured |
|---|---|
| Verbal Cluster | |
| Verbal Comprehension | Follow oral instructions; receptive vocabulary and syntax |
| Naming Vocabulary | Name pictured objects; expressive vocabulary |
| Nonverbal Cluster | |
| Picture Similarities | Match pictures on the basis of perceptual, functional, and conceptual similarities; nonverbal reasoning |
| Pattern Construction | Use squares and/or cubes to copy pictured designs; visuospatial perception and construction |
| Copying | Copy letter-like shapes and geometric figures; visual-perceptual matching and fine motor control |
| Early Number Conceptsa | Count, classify by size and quantity, add and subtract; basic number concepts and computation |
| School-Age DAS | |
| Verbal Cluster | |
| Word Definitions | Define words; word knowledge and verbal formulation |
| Similarities | Identify the essential similarity of three words; word knowledge and verbal reasoning |
| Nonverbal Reasoning Cluster | |
| Matrices | Choose design that completes a matrix pattern; nonverbal inductive reasoning |
| Sequential & Quantitative Reasoning | Identify sequential patterns in figures and numbers; nonverbal inductive reasoning |
| Spatial Cluster | |
| Recall of Designs | Copy geometric designs from memory; visuospatial perception and short-term visual recall |
| Pattern Construction | (same as above) |
Contributes to GCA score, but not to cluster scores.
The DAS normative sample included 400 children between the ages of 5;0 and 6;11 who were tested on both the Preschool and School-Age batteries. The correlation between Preschool and School-Age GCA scores for this sample was .86, supporting the comparability of GCA scores across batteries (Elliott, 1990).
Language milestones
Parent-reported ages for first single words used meaningfully and phrase speech were taken from the ADI-R to aid in the interpretation of cognitive profiles from the DAS. According to ADI-R coding rules, phrase speech is defined as the spontaneous, flexible use of at least two words in combination, one of which must be a verb.
Autism Diagnostic Observation Schedule (ADOS; Lord et al., 1999; Lord et al., 2000)
The ADOS is a semi-structured, interactive observation schedule designed to assess social and communicative functioning in individuals who may have an autism spectrum disorder. The assessment involves a variety of social occasions and ‘presses’ designed to elicit behaviors relevant to a diagnosis of autism. The schedule consists of four developmentally sequenced modules, each approximately 30 minutes in duration. Only one of the modules is administered, depending on the examinee’s age and/or expressive language level (preverbal or single words, phrase speech, fluent speech/adolescent, fluent speech/adult). Each module includes a standardized diagnostic algorithm composed of a subset of the social and communicative behaviors rated, and consistent with DSM-IV (APA, 1994) and ICD-10 (WHO, 1993) criteria for autism. Although there are several ratings for repetitive behaviors, they are not included in the diagnostic algorithms because they cannot be observed reliably during a brief assessment. Behavioral ratings (e.g., facial expressions directed to others) are based on a hierarchy of mutually exclusive operational definitions corresponding to the following codes: 0 = not autistic; 1 = atypical, but not clearly autistic; 2 = autistic. Thus, higher scores on the ADOS reflect greater impairment. An ADOS classification of autism requires meeting or exceeding the algorithm threshold scores for (1) communication, (2) social, and (3) communication and social total. The ADOS also provides standardized threshold scores for a less severe diagnosis of Autism Spectrum Disorder (ASD). Whereas the Module 1 and Module 2 diagnostic algorithms include ratings for 5 communicative behaviors, making a possible communication score of 0–10, the Module 3 and Module 4 algorithms include ratings for 4 communicative behaviors, making a possible communication score of 0–8. All four modules include ratings for 7 social behaviors in the diagnostic algorithm, making a possible social score of 0–14. In the current study, the main ADOS variables of interest were the total scores for communication and for social algorithm items.
Procedures
The ADI-R, ADOS, and DAS were given to all participants at both sites as part of an initial diagnostic evaluation. The ADI-R and ADOS were administered and scored by specially trained personnel who demonstrated reliability with the authors of the instruments and on-site trainers. The DAS was administered either by a qualified psychologist or by a clinical intern or senior research assistant trained and supervised by a qualified psychologist. Following rules outlined in the DAS handbook, children between the ages of 6;0 and 6;11 were administered the School-Age rather than the Preschool version of the DAS only if they could be expected to obtain T-scores above 20 on at least 4 out of the 6 core subtests. All scored DAS test protocols were reviewed by an independent scorer who checked the tabulation of raw and standardized scores for accuracy.
Inclusion in the present study required (1) meeting criteria for autism on the ADI-R; (2) sufficient cognitive ability to complete within-age-level testing on the DAS, which was necessary to generate the standardized cluster scores that provide the basis for cognitive profile analysis; and (3) overall cognitive ability no lower than 3 standard deviations below the norm (GCA > 55) in order to minimize floor effects that would prevent detection of cognitive discrepancies. From an original sample of 127 children who met ADI-R criteria for autism and completed within-age-level testing on the DAS, seven children were excluded because their GCA fell below the cut off score of 55. Of these seven, all of whom were tested on the Preschool DAS, two obtained a floor score on the Verbal cluster, two obtained a floor score on the Nonverbal cluster, and one scored at floor on both clusters.
Although participants were required to meet ADI-R criteria for autism (which are based mainly on ratings for the age of 4–5 years) and DSM-IV criteria for a clinical diagnosis of autism or PDDNOS, they were not required to meet diagnostic thresholds for the ADOS. Given that the clinically confirmed ADI-R inclusion criterion functioned to assure a validly diagnosed sample, it was necessary to allow the widest range of scores possible in concurrent functioning in order for the ADOS to be used as a quantitative measure of phenotypic variance within the sample.
Defining cognitive profiles
Data from the Preschool and School-Age levels of the DAS were analyzed separately and thus provided a basis for comparing the cognitive profiles of younger and older children with autism. The main focus of the profile analyses was on discrepancies between Verbal and Nonverbal cluster scores. For the Preschool level, Verbal–Nonverbal (V–NV) discrepancies were identified on the basis of a minimum 14-point difference between Verbal and Nonverbal cluster scores required for significance at the .05 level of probability, as specified in the DAS handbook. For the School-Age level, V–NV discrepancies could only be identified in terms of the difference between the Verbal cluster and the overall GCA score, and required a minimum difference of 9 points for significance at the .05 level. The standard 9-point minimum difference required for a significant discrepancy was calculated taking into account the part–whole relationship between the Verbal cluster and GCA scores (Elliott, 1990).2 In addition to V–NV discrepancies, subtest score patterns were evaluated within each cluster.
Results
Of the 120 participants, 73 were tested on the Pre-school DAS, and 47 were tested on the School-Age DAS. Table 1 summarizes all DAS and ADI-R scores for each of these subsamples. The Chicago and Shriver sites contributed roughly equally to each sample. Independent samples t-tests comparing Chicago and Shriver participants on each of the DAS and ADI-R variables revealed no differences between sites. However, the Preschool and School-Age DAS groups differed on some of these variables. Although the groups did not differ on DAS Nonverbal Score, the Preschool group had a significantly lower Verbal Score than the School-Age group, t (118) = 2.50, p < .05. Owing to this difference, the Preschool group also had a lower GCA score than the School-Age group, t (118) = 2.38, p < .05. Within-group comparisons confirmed that Verbal score was significantly lower than Nonverbal score in the Preschool group, t (72) = 4.49, p < .001, but that Verbal and Nonverbal score were not significantly different in the School-Age group. Although mean ADI-R scores for both groups were well beyond the standard diagnostic threshold scores for communication (8), social (10), and repetitive behaviors (3), scores for the School-Age group were higher than those of the Preschool group in the communication domain, t (118) = 2.47, p < .05, and in the social domain, t (118) = 1.99, p < .05, indicating a somewhat higher degree of parent-reported impairment in the older group.
Preschool DAS
Frequency and distribution of V–NV discrepancies
Of the 73 participants who were administered the Preschool DAS, 35 exhibited a significant discrepancy in favor of nonverbal abilities (V < NV), 32 exhibited no discrepancy (V = NV), and 6 exhibited a discrepancy in favor of verbal abilities (V > NV). Thus, 56% of participants demonstrated a significant discrepancy, and the large majority of discrepancies were in the V < NV direction. The frequency of V–NV discrepancies was significantly higher than the approximately 30% reported for the DAS normative sample, χ2 (1, N = 73) = 23.80, p < .001.
The 73 children who were administered the Pre-school DAS included 19 children between the ages of 6;0 and 6;11 who could have been administered either the Preschool or the School-Age version. It was possible that these 19 children were specifically selected for lower verbal ability and thus could have biased the Preschool DAS toward a higher frequency of V < NV discrepancies. However, a review of their data revealed that they were proportionally distributed among the V < NV (n = 8), V = NV (n = 10), and V > NV (n = 1) groups.
Table 3 shows the distribution of V–NV profiles across three general ability groups whose GCA scores were within the normal range of ability; between one and two standard deviations below the norm; and between two and three standard deviations below the norm. These groups are referred to as the normal, borderline, and impaired GCA group, respectively. A V = NV profile occurred more frequently in the impaired GCA group, whereas a V < NV profile occurred more frequently in the two higher GCA groups. This distribution of V–NV profiles was significantly different from that expected by chance, χ2 (2, N = 67) = 9.31, p < .01. Consistent with these nonparametric findings, a mixed-model ANOVA demonstrated a significant interaction between GCA group and test type (Verbal or Nonverbal), F (2, 70) = 3.18, p < .001, with Nonverbal score significantly higher than Verbal score in the two higher GCA groups, but not in the impaired GCA group.
Table 3.
Frequency of V–NV profiles by GCA group
| Preschool GCA Group (n = 73) | |||
|---|---|---|---|
| V–NV group | Impaired (n = 26) | Borderline (n = 24) | Normal (n = 23) |
| V < NV (n = 35) | 7 | 16 | 12 |
| V = NV (n = 32) | 17 | 6 | 9 |
| V > NV (n = 6) | 2 | 2 | 2 |
| School-Age GCA Group (n = 47) | |||
| Impaired (n = 12) | Borderline (n = 16) | Normal (n = 19) | |
| V < NV (n = 16) | 3 | 6 | 7 |
| V = NV (n = 18) | 6 | 6 | 6 |
| V > NV (n = 13) | 3 | 4 | 6 |
One potential concern is that the clustering of V = NV profiles at the lowest level of GCA may have been due to floor effects on Verbal scores, which would have masked true V < NV discrepancies. Of the 17 children in the impaired GCA group with a V = NV profile, only one scored at floor on the Verbal cluster. Nevertheless, it is quite possible that DAS test items at this lower level of ability are less sensitive to real differences between verbal and non-verbal skills, and that floor effects may account for the lack of discrepancies in the impaired GCA group.
Age, GCA and cluster score patterns in the Pre-school DAS V–NV groups
As can be seen in Table 4, the V–NV groups did not differ significantly in age, F (2, 70) = 1.0, n.s. GCA was lower in the V = NV group than in the two discrepancy groups, F (2, 70) = 3.4, p < .05. Figure 1 displays the mean Verbal and Nonverbal cluster scores for each V–NV profile group. The V < NV group did not differ from the V = NV group on Verbal score, but rather by virtue of its higher Nonverbal score. This was confirmed statistically with a mixed-model ANOVA, which demonstrated a significant interaction between group (V = NV or V < NV) and test type (Verbal or Nonverbal), F (1, 65) = 136.67, p < .001. Although for the sample as a whole Verbal score was significantly lower than Nonverbal score, F (1, 71) = 20.19, p < .001, the correlation between these two measures was fairly strong, r (71) =.42, p < .001.
Table 4.
Age and GCA in the V-NV profile groups
| Preschool DAS | |||
|---|---|---|---|
| V < NV (n = 35) M (SD) | V = NV (n = 32) M (SD) | V > NV (n = 6) M (SD) | |
| Age | 5;4 (0;10) | 5;6 (0;10) | 5;0 (1;0) |
| GCA Score | 80.7 (13.3) | 71.7 (14.3) | 80.0 (22.1) |
| School-Age DAS | |||
| V < NV (n = 16) | V = NV (n = 18) | V > NV (n = 13) | |
| Age | 8;6 (2;0) | 8;9 (1;10) | 9;7 (1;10) |
| GCA Score | 90.9 (24.6) | 77.2 (16.9) | 86.6 (18.5) |
Figure 1.
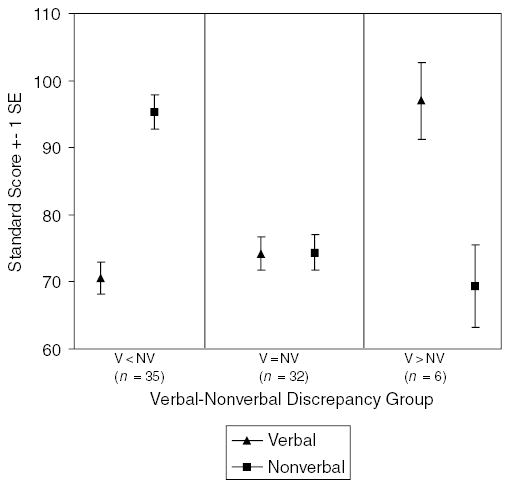
Preschool DAS cluster scores by V–NV discrepancy groups
Subtest scores
Mean subtest scores for the entire Preschool group are displayed in Figure 2. A repeated measures ANOVA demonstrated significant unevenness in performance across subtests, F (5, 360) = 30.04, p < .001. Pairwise comparisons revealed that Pattern Construction mean score was significantly higher than Picture Similarities mean score, which in turn was higher than all other sub-test scores. Mean score for Verbal Comprehension was significantly lower than for all other subtests.
Figure 2.
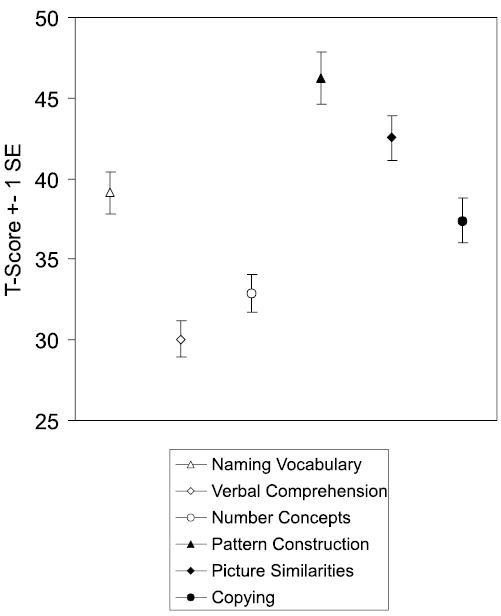
Preschool DAS subtest scores (n = 73)
The high degree of unevenness in cognitive abilities apparent in the discrepancies among mean sub-test scores for the group was also exhibited on an individual basis in the high number of children who had subtest scores that differed significantly from their own mean subtest score. Compared to the DAS normative sample, children were much more likely to have a discrepantly high score on Pattern Construction (n = 38), χ2 (1, N = 73) = 78.61, p < .001, and on Picture Similarities (n = 27), χ2 (1, N = 73) = 27.68, p < .001. They were also more likely than the normative sample to have a discrepantly low score on Verbal Comprehension (n = 30), χ2 (1, N = 73) = 78.43, p < .001, and on Early Number Concepts (n = 21), χ2 (1, N = 73) = 28.57, p < .001, a subtest with fairly high language-processing demands.
Figure 3 illustrates the pattern of subtest scores for each V–NV discrepancy group. The V < NV and V = NV groups showed the same pattern of scores within each cluster, and were differentiated mainly by the lower level of nonverbal scores in the non-discrepancy group. In both of these groups, the highest score was on Pattern Construction and the lowest score was on Verbal Comprehension. Figure 3 also shows that the verbal advantage in the V > NV group was derived mainly from children’s strong performance on Naming Vocabulary. Five of the 6 children had discrepantly high scores on Naming Vocabulary, but none of the children’s scores on Verbal Comprehension differed significantly from their mean subtest score. Nonetheless, as can be seen in Figure 3, mean scores on both verbal sub-tests in the V > NV group were significantly higher than in the other groups.
Figure 3.
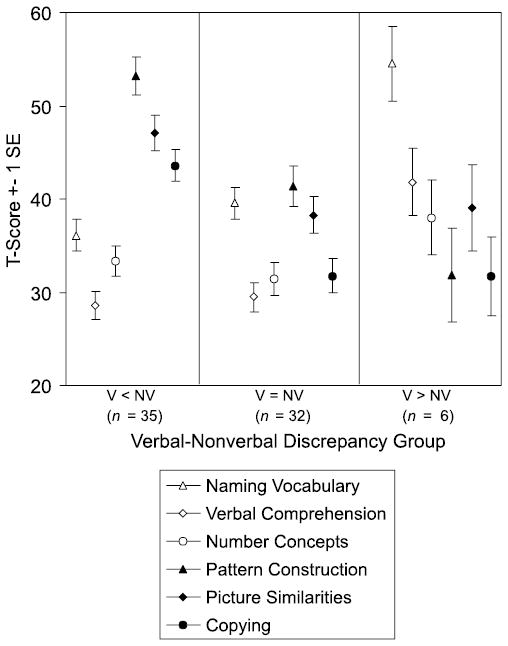
Preschool DAS subtest scores by V–NV discrepancy groups
Language milestones
Because the pattern of language milestones across the Preschool V–NV profile groups was the same for first words and onset of phrase speech, only the latter will be reported. The mean age for the attainment of phrase speech in the Preschool group was 3;1 (SD = 1;0). However, the age of phrase speech acquisition differed significantly between the three V–NV profile groups, F (2, 44) = 8.7, p < .001, with a mean age of onset of 3;6 (SD = 0;10) in the V < NV group, 2;11 (SD = 1;0) in the V = NV group, and 1;11 (SD = 0;6) in the V > NV group. Pairwise comparisons revealed that the differences were significant between all groups. Thus, whereas the V < NV group was relatively delayed in the acquisition of phrase speech, the V > NV was relatively advanced in attaining this language milestone.
School-Age DAS
Frequency and distribution of V–NV discrepancies
Of the 47 participants administered the School-Age DAS, 16 exhibited a V < NV profile, 18 exhibited a V = NV profile, and 13 exhibited a V > NV profile. As with the younger group, the frequency of V–NV discrepancies (62%) was significantly higher than the approximately 30% reported for the normative sample, χ2 (1, N = 73) = 22.50, p < .001. However, in contrast to the younger group, the discrepancies occurred in the V > NV direction nearly as often as in the reverse direction.
Table 3 shows the frequency of V–NV discrepancies across three GCA groups that were defined in the same way as for the younger sample. An χ2 analysis showed no relationship between the GCA groups and V–NV profiles, χ2 (4, N = 47) = 1.22, n.s. A mixed-model ANOVA with GCA group as the between-subjects factor and test type (Verbal, Nonverbal Reasoning, or Spatial) as the within-subjects factor showed a marginally significant effect of test type, F (2, 88) = 2.99, p < .06, with Verbal and Nonverbal Reasoning scores both marginally lower than Spatial score, but not significantly different from each other. There was no interaction with GCA group, indicating that this pattern of mean cluster scores held across general ability levels.
Age, GCA and cluster score patterns in the School-Age DAS V–NV groups
Mean age and GCA scores are displayed in Table 4. The V–NV groups did not differ significantly in age, F (2, 44) = 0.1, n.s. A one-way ANOVA comparing the groups on GCA was not significant, F (2, 44) = 2.0, but pairwise comparisons revealed a marginally significant difference (p < .06) between the V < NV group, which had the highest mean GCA score, and the V = NV group, which had the lowest. Mean cluster scores for each of the V–NV groups are displayed in Figure 4. The two discrepancy groups exhibited specific strengths relative to their own cluster scores and the cluster scores of the other groups. This indicates that the V–NV discrepancies reflected a genuine strength in one domain or the other, rather than differing levels of verbal ability across groups that were otherwise cognitively similar. The dissociation of abilities in the discrepancy groups, which was most marked in the comparison of Verbal and Spatial scores, was also reflected in the weak correlation between Verbal and Spatial scores for the entire sample, r (45) =.28, n.s., compared to r (2398) =.50 in the DAS normative sample. This was in contrast to the strong correlations found between Verbal and Nonverbal Reasoning scores, r (45) =.61, p < .001, and Spatial and Nonverbal Reasoning scores, r (45) =.68, p < .001.
Figure 4.
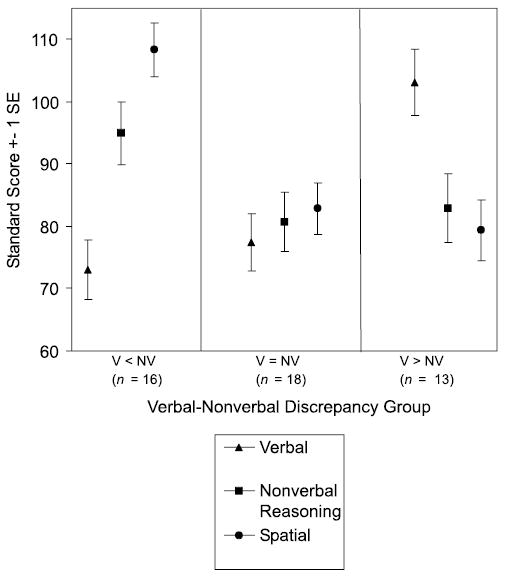
School-Age DAS cluster scores by V–NV discrepancy groups
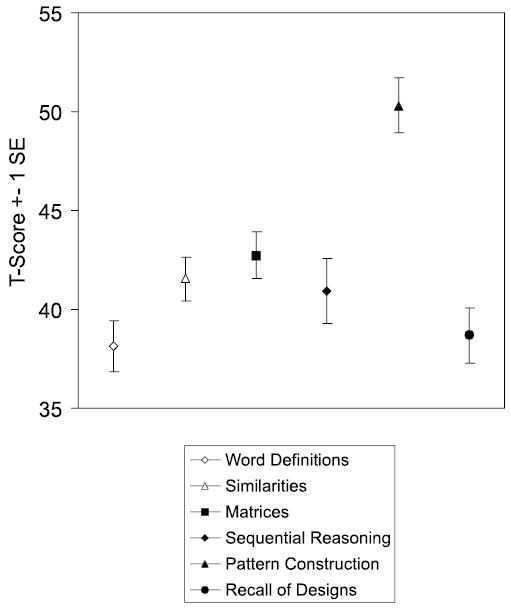
Subtest scores
Mean subtest scores for the entire School-Age group are displayed in Figure 5. Although a repeated measures ANOVA indicated significant variance across subtests, F (5, 230) = 9.37, p < .001, pairwise comparisons revealed that this effect was due mainly to the Pattern Construction score, which was significantly higher than all other scores. The lowest mean score was for Word Definitions, which was significantly lower than the mean score for Similarities, Matrices, and Pattern Construction. As compared to the DAS normative sample, individuals in this sample were significantly more likely to have a discrepantly high score on Pattern Construction (n = 23), χ2 (1, N = 47) = 14.36, p < .001. They were also more likely to have a discrepantly low score on Word Definitions (n = 15), χ2 (1, N = 47) = 10.55, p < .001, and on Recall of Designs (n = 13), χ2 (1, N = 47) = 5.9, p < .02.
Figure 5.
School-Age DAS subtest scores (n = 47)
Figure 6 illustrates the pattern of subtest scores for each V–NV profile group. As can be seen, Pattern Construction was a distinctive strength for the V = NV group as well as the V < NV group. Within the Spatial cluster, the mean score for Recall of Designs was lower than the mean score for Pattern Construction in all three V–NV profile groups. However, children’s scores on these two subtests were strongly correlated, r (45) =.65, p < .001.
Figure 6.
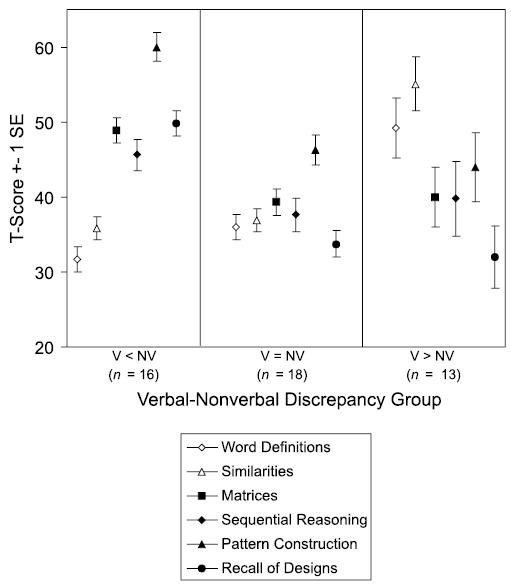
School-Age DAS subtest scores by V–NV discrepancy groups
Language milestones
The mean age for phrase speech acquisition in the School-Age group was 3;2 (SD = 1;2), which was virtually the same as in the Preschool group. However, unlike the Preschool V–NV profile groups, the School-Age V–NV groups did not differ in acquisition of language milestones, F (2, 44) = 1.05, n.s. The mean age of onset of phrase speech was 3;3 (SD = 1;3) for the V < NV group, 3;5 (SD = 1;2) for the V = NV group, and 2;9 (SD = 1;1) for the V > NV group.
Relationships between DAS and ADOS Scores
The purpose of these analyses was to determine if different patterns of cognitive strengths and weaknesses were associated with differences in autistic symptomatology. Because of age-related differences in the cognitive profiles identified, these analyses were conducted for the Preschool DAS and School-Age DAS samples separately.
Of the 73 children tested on the Preschool DAS, 10 were administered Module 1, 33 were administered Module 2, and 30 were administered Module 3 of the ADOS. Of these 73 children, 56 met threshold scores for autism, 8 met for ASD, and 9 did not meet for either diagnosis. Of the 9 children who did not meet ADOS criteria for autism or ASD, 5 were clinically diagnosed with autism and 4 with PDDNOS. Further, of these 9 children, 2 met ADOS criteria for autism or ASD in the communication domain only, and 4 met ADOS criteria for autism or ASD in the social domain only. Four out of the 5 children who did not meet ADOS diagnostic criteria in the social domain were one point below the threshold score for ASD.
Of the 47 children tested on the School-Age DAS, all were administered Module 3 of the ADOS, except for 5 children who were administered Module 2. Of these 47 children, 41 met threshold scores for autism, 5 for ASD, and 1 for neither diagnosis. The one child who did not meet ADOS criteria for autism or ASD was clinically diagnosed with PDDNOS and met ADOS criteria for ASD in the social domain only. Table 5 displays ADOS communication and social scores (calculated across modules) for each DAS group, with higher mean scores reflecting greater impairment.
Table 5.
ADOS scores for Preschool and School-Age DAS Groups
| Preschool DAS Group (n = 73a) | School-Age DAS Group (n = 47b) | |
|---|---|---|
| Communication | ||
| Mean (SD) | 6.0 (2.4) | 5.1 (1.9) |
| Rangec | 0–10 | 1–9 |
| Social | ||
| Mean (SD) | 9.1 (3.1) | 9.3 (2.5) |
| Ranged | 0–14 | 5–14 |
10 children were administered ADOS Module 1, 33 were administered Module 2, and 30 were administered Module 3.
5 children were administered Module 2, and 42 were administered Module 3.
The range of possible scores for ADOS Communication was 0–10 for Modules 1 and 2, and 0–8 for Module 3.
Possible scores for ADOS Social were 0–10 for all modules.
Table 6 shows partial correlations between DAS and ADOS scores controlling for the ADOS module administered. In both the Preschool and School-Age DAS groups, ADOS communication score was inversely related to DAS Verbal score, but was not significantly related to nonverbal scores. Thus, better communicative functioning (reflected in lower ADOS scores) was specifically associated with higher levels of verbal ability in both age groups. The pattern of correlations between DAS and ADOS social scores, however, differed across age groups. In the younger group, ADOS social score was inversely related to Nonverbal as well as Verbal score, indicating that better functioning in the social domain was associated with overall cognitive ability. In contrast, in the older group, ADOS social score was not related to either of the DAS nonverbal scores (Nonverbal Reasoning or Spatial), but was inversely related to Verbal score and, to an even greater degree, to the Verbal–Nonverbal difference score. Thus, the higher a child’s Nonverbal score was relative to his or her Verbal score, the more impaired he or she was in social functioning, and vice versa. This relationship remained significant when absolute level of verbal ability was partialled from the correlation, r (44) =.35, p < .02.
Table 6.
Partial correlations between DAS and ADOS scores controlling for ADOS module
| ADOS Communication | ADOS Social | |
|---|---|---|
| Preschool DAS (n = 73) | ||
| GCA score | −.26* | −.41*** |
| Verbal score | −.27* | −.34** |
| Nonverbal score | −.17 | −.31** |
| Verbal–Nonverbal difference scorea | −.02 | .08 |
| School-Age DAS (n = 47) | ||
| GCA score | −.33* | −.04 |
| Verbal score | −.45** | −.32* |
| Nonverbal Reasoning score | −.26 | .08 |
| Spatial score | −.12 | .17 |
| Verbal–Nonverbal difference scoreb | −.23 | −.45** |
p < .05.
p < .01.
p < .01.
Calculated by subtracting Nonverbal standard score from Verbal standard score.
On the School-Age DAS, the Nonverbal score was a standardized composite score for the 4 nonverbal subtests.
Additional analyses were conducted to examine differences in ADOS scores among the categorically defined V–NV groups. ADOS module and Verbal score were included as covariates in order to control for module-specific variance in ADOS scores and absolute level of verbal ability. In the younger group, a one-way MANCOVA showed no effect of the covariates ADOS module or Verbal score, or of V–NV group on either ADOS communication or social score. In the older group, there was an effect of the covariate Verbal score on communication score, F (1, 37) = 8.74, p < .01, but not on social score. In the main analysis, there was an effect of V–NV group on social score, F (2, 37) = 4.99, p < .02, but not on communication score. Pairwise comparisons showed that ADOS social score was significantly higher in the V < NV group than in the V = NV and V > NV groups, which did not differ from each other on social score. Table 7 displays ADOS communication and social scores for each of the Preschool and School-Age V–NV groups.
Table 7.
ADOS Communication and Social scores for V–NV profile groups
| Preschool DAS
|
|||
|---|---|---|---|
| V < NV (n = 35) | V = NV (n = 32) | V > NV (n = 6) | |
| Communication | |||
| Mean | 5.9 | 6.4 | 4.7 |
| SD | 2.5 | 2.2 | 1.8 |
| Social | |||
| Mean | 8.9 | 9.3 | 8.2 |
| SD | 3.3 | 3.0 | 3.2 |
| School-Age DAS
|
|||
| V < NV (n = 16) | V = NV (n = 18) | V > NV (n = 13) | |
| Communication | |||
| Mean | 5.9 | 4.7 | 4.6 |
| SD | 1.6 | 2.1 | 1.6 |
| Sociala | |||
| Mean | 11.0 | 8.6 | 8.2 |
| SD | 2.1 | 2.4 | 2.0 |
Significant difference between group means, F (2, 37) = 4.99, p < .02, covarying for ADOS module and Verbal score.
Nearly half of the older group had a discrepantly high score on Pattern Construction, a subtest similar to Wechsler Block Design. In order to assess whether pattern of performance on this particular subtest accounted for significant variance in ADOS social score, an ANCOVA with the covariates ADOS module and mean subtest score was conducted comparing children with and without discrepantly high scores on Pattern Construction. Neither the covariates nor the main factor of Pattern Construction discrepancy group had a significant effect on ADOS social score.
Discussion
In this study we addressed two main questions. First, is there an unusual degree of unevenness in the cognitive abilities of children with autism and, if so, do characteristic patterns of cognitive strengths and weaknesses vary as a function of age or overall ability in autism? Second, are different cognitive profiles, and the cognitive strengths and weaknesses they index, associated with differences in autistic symptomatology? These issues are addressed below.
Cognitive profiles in autism
Using the Differential Abilities Scale, we examined patterns of cognitive ability across a fairly circumscribed range of ages that spanned from preschool to early adolescence. With regard to group means, we found that our younger and older groups were similar in level of nonverbal ability, but not in verbal ability, which was significantly lower in the younger group. Thus, in the most general terms, our findings are consistent with the notion that verbal–nonverbal discrepancies lessen with age, at least among children with autism who have functional language and whose overall cognitive abilities are in the mildly impaired range or above.
Of course, these findings are limited by their cross-sectional nature. However, we did confirm that the choice of administering either the Preschool or School-Age version of the DAS to 6-year-olds did not bias the younger Preschool DAS sample in favor of V < NV discrepancies. Further, although the older sample exhibited somewhat more severe symptoms, increased symptom severity would if anything be expected to be associated with decreased verbal ability (Bailey et al., 1996), and therefore does not provide a likely explanation for the diminution of the mean verbal–nonverbal discrepancy in the older group. This leads us to suggest that the relative weakness in verbal ability exhibited on standardized cognitive measures by younger and more able children with autism is to some extent age-dependent, and may reflect the effects of developmental delays in speech and language that lessen over time in some children. This interpretation is supported by our finding that the large subgroup of younger children with V < NV discrepancies, despite having higher overall ability, was significantly more delayed in language acquisition than the other V–NV subgroups. In comparison, the V–NV subgroups in the older sample did not differ significantly on language milestones.
In contrast to the trends identified at the group level of analysis, there was a high degree of individual variation in cognitive profiles, with no evidence of a modal profile in either group. An unusual degree of unevenness in the cognitive abilities of children with autism was reflected in the high frequency of significant verbal–nonverbal discrepancies among individuals in both the younger group (56%) and the older group (62%) relative to the DAS normative sample (30%). In fact, the statistical significance of the frequency of these individual discrepancies was conservatively estimated given that many of the children with autism exhibited verbal–nonverbal discrepancy scores of a magnitude that far exceeded the minimum difference required for a .05 level of probability. Discrepancies of this magnitude occurred at a much lower frequency (than 30%) in the normative sample.
Although a high degree of individual variation was observed in both the younger and older groups, the frequency and pattern of cognitive profiles differed between them. In the younger group, the large majority of discrepancies (85%) were in the V < NV direction. Further, the younger children with V < NV profiles tended to have higher levels of general ability than those with V = NV profiles. This finding contradicted the notion, based on studies of older children and adults, that V < NV discrepancies are more likely to occur in the context of lower ability (Rumsey, 1992; Siegel et al., 1996). As has already been suggested, this contradictory finding may be explained by the stronger effects of developmental language delay on the verbal scores of younger children with autism, especially as the children with V < NV discrepancies showed the most pronounced delays in language milestones. Accordingly, for some of the children in this group, the gap between verbal and nonverbal scores might be expected to lessen over time. It is possible that the association found between lower ability and a lack of V–NV discrepancy was due to floor effects and a restricted range of scores at the lowest levels of the DAS. Consequently, true verbal weaknesses may not have been detected in younger, lower-ability children, who might eventually demonstrate the V < NV pattern. Similar verbal weaknesses also may have characterized the cognitive profiles of children who were functioning at too low a level to obtain standardized scores on the DAS, and who were therefore not included in the present sample.
V > NV discrepancies occurred relatively infrequently (8%) in the younger group. Whether these discrepancies reflected a true verbal advantage is questionable given that they arose mainly as a result of individuals’ discrepantly strong performance on Naming Vocabulary, a measure of one-word expressive vocabulary that is also the least demanding pragmatically (simply naming pictured objects) of the DAS subtests. Although none of the children in the V > NV group exhibited a specific strength on Verbal Comprehension, the group’s mean score on this subtest was in the average range and significantly higher than in the other V–NV groups (see Figure 3). In contrast, mean score on Pattern Construction was significantly lower than in the other two groups. Further, the V > NV group was the most advanced in language milestones, having attained phrase speech before the age of two years on average. Thus, this pattern of findings does suggest the emergence of a profile of impaired nonverbal ability in the context of intact verbal skills among some of the children in the younger group.
Cognitive profiles in the older group differed from those in the younger group in several important ways. First, individuals exhibited V > NV discrepancies (28%) nearly as often as V < NV discrepancies (34%). Second, the occurrence of V–NV profiles did not vary as a function of overall ability. These findings are consistent with the notion that the frequency of V < NV discrepancies decreases with age (34% in the older sample versus 48% in the younger sample), but they do not support the contention that V < NV discrepancies lessen with increased ability. Mean GCA for the V < NV group was within the average range, and was higher than in the other two V–NV profile groups.
The third, and perhaps most interesting difference in the older children, was the striking pattern of asymmetry in the verbal and nonverbal cluster scores of the two discrepancy groups. Each discrepancy group manifested a clear strength in either the verbal or nonverbal domain both in comparison to the other discrepancy group and to the uniformly lower cluster scores of the nondiscrepancy group. The asymmetry of abilities between the verbal–non-verbal discrepancy groups was most pronounced in the difference between Verbal and Spatial cluster scores. Further, unlike in the DAS normative sample, Verbal and Spatial ability scores were not significantly correlated in the older group. In contrast, despite the relatively depressed verbal skills of the younger group, verbal and nonverbal abilities were highly correlated. Thus, whereas verbal and non-verbal skills appeared to be developing on similar trajectories in the younger group, the findings from the older group indicated an increasing dissociation of abilities over time. The possibility of selective specialization and general reorganization of the relationships between skill domains over time was also suggested by the finding that the V–NV profile groups among the older children were no longer differentiated by age of acquisition of phrase speech.
Our finding of a high frequency of uneven cognitive development in children with autism suggests that the DAS, and similarly designed cognitive assessment measures, may be particularly useful in delineating differential patterns of cognitive strengths and weakness in autism as well as in other developmental disorders (e.g., Mervis, Morris, Bertrand, & Robinson, 1999). One of the main advantages of the DAS, and particularly of the School-Age version, is that it groups subtests in conceptually homogenous clusters that allow a clearer comparison of differential abilities than is possible with measures such as the Wechsler scales. Further, the extended range of possible standard scores on the DAS, and the relatively brief amount of time required for its administration, contribute to its usefulness in identifying reliable and valid distinctions in the cognitive abilities of children with developmental disorders.
Cognitive profiles and autistic symptomatology
Our second main goal was to determine how children’s cognitive abilities, and the different patterns of strength and weakness among them, might be associated with differences in core autistic symptoms in communication and reciprocal social interaction. In both age groups, communicative competence was specifically related to verbal ability, indicating that severity of language impairment is an important mediating factor in the expression of communication symptoms in autism. This relationship was particularly strong in the older group, probably reflecting the diagnostic emphasis on conversational and narrative abilities in the later modules of the ADOS, as compared to the focus on preverbal communication skills in the earlier modules.
The finding of a relationship between verbal ability and communication symptoms in the present study was interesting because, in the ADOS normative sample, level of language functioning, as measured by composite verbal age-equivalents yielded by a number of different tests, was not significantly correlated with ADOS domain scores (Lord et al., 1999). This difference might be attributable to the effect of relative language delay (age-conditioned standardized scores) as compared to absolute3 level of language (age-equivalent scores), the more homogeneous sample in the present study (all participants were able to obtain both verbal and nonverbal standard scores on the DAS), or to the uniform use of the DAS and the particular aspects of language tested by the DAS as compared to other tests.
Whereas the level of symptoms in the social domain was associated with overall cognitive ability in the younger group, severity of social symptoms in the older group varied mainly as a function of the pattern and degree of divergence between cognitive abilities. The finding of greater social impairment in children with discrepantly strong nonverbal abilities was particularly compelling in that it occurred independently of absolute level of verbal ability, and was associated with an actual strength in cognitive functioning, as reflected in the group’s average-range performance on nonverbal subtests.
The association of increased social impairment with the V < NV profile, and the uneven development and dissociation of cognitive abilities this profile appeared to reflect, suggests a possible neuro-behavioral marker for an etiologically significant subtype of autism. Of course, this finding begs the question of why a pattern of superior performance in one cognitive domain would be associated with more severe autistic symptoms. Superior nonverbal abilities have traditionally been conceived in terms of a relative sparing of visual-perceptual processing skills in autism, particularly those tapped by tests such as Wechsler Block Design and Object Assembly, which require minimal verbal or social inference (Lincoln et al., 1988). However, an alternative and increasingly prominent view is that unevenly developed skills in autism and other neurodevelopmental disorders are not necessarily achieved by virtue of a selective sparing of normal cognitive capacities and their neurobiological substrates. Rather, they are seen as the outcome of fundamental differences in neurocognitive organization and functioning (Happé, 1999; Karmiloff-Smith, 1997, 1998). For example, enhanced visual processing capacities in autism have been attributed to a part-oriented or ‘local’ processing bias resulting from a top-down failure of ‘central coherence’ (Frith & Happé, 1994; Happé, 1999) or, alternatively, from the abnormal development of lower-level perceptual process (Elgar & Campbell, 2001; Plaisted, 2000; Plaisted, O’Riordan, & Baron-Cohen, 1998; Mottron, Peretz, & Ménard, 2000). While conferring some special advantages in visual perception, a local processing bias may interfere directly with the processing of socially relevant information, or may otherwise involve an underdevelopment of the cognitive processes that normally subserve the development of social competencies or provide compensatory strategies for attaining them.
Given the unusual lack of association between verbal and spatial abilities in the school-age group, and the aberrations in neurocognitive organization this potentially signals, it was notable that the marked unevenness in the cognitive abilities of the V > NV group was not associated with an increase in autistic symptoms, as it was in the V < NV group. The most obvious explanation for this difference is that children’s verbal skills assisted them in compensating for their deficits in the social domain. Yet, children in the nondiscrepancy group, who had much lower verbal scores than children in the V > NV group, were no more impaired in social-communicative functioning than the group of children with relatively superior verbal skills. This raises the question of whether the imbalance in cognitive functioning represented by the V < NV profile in older school-age children involves a more severe disturbance of neurocognitive development and organization. Supporting this possibility is evidence of increased head circumference specifically among children with V < NV discrepancies (Deutsch & Joseph, in press). This finding is particularly interesting in light of related evidence of increased head size and brain volume in subgroups of children with autism (Courchesne et al., 2001; Davidovitch, Patterson, & Gartside, 1996; Fidler, Bailey, & Smalley, 2000; Fombonne, Rogé, Claverie, Courty, & Frémolle, 1999; Lainhart et al., 1997; Piven, Artndt, Bailey, & Andreasen, 1996; Woodhouse et al., 1996) and suggestions that isolated visual-perceptual skills in autism may be related to neuronal overgrowth and/or reduced cortical pruning and connectivity (Cohen, 1994; Happé, 1999).
In contrast to attempts to validate diagnostic subtypes of ASD on the basis of differences in cognitive profiles, we adopted the strategy of first identifying different cognitive profiles and examining whether they accounted for empirically defined differences in the pattern and severity of autistic symptoms. Taking this approach, we found that the V < NV profile, which historically has been strongly identified with autism, was the most distinctive cognitive profile in that it was specifically associated with a higher level of symptoms in the social domain. Thus, whereas much effort has been devoted to validating an Asperger subtype with an associated V > NV profile, the current findings, bolstered by additional evidence of increased head circumference in children with discrepantly strong nonverbal skills (Deutsch & Joseph, in press), suggest that it is the V < NV profile that is etiologically most significant in ASD. This may seem to contradict several recent family studies (Folstein et al., 1999; Fombonne, Bolton, Prior, Jordan, & Rutter, 1997; Piven & Palmer, 1997) that have reported a verbal over nonverbal advantage among non-autistic, first-degree relatives of children with autism. However, within the framework of understanding autism as a complex, multigenic disorder that occurs on a continuum of severity (Folstein, 1999), it is possible that genetic and neurological differences indexed by the V < NV profile confer an increased susceptibility to clinically diagnosable autism, as compared to the lesser variants of the autism phenotype that are found in some family members. It will be useful for future family studies to examine individual differences in cognitive profiles to determine if they are differentially associated with autism-related behaviors in non-autistic relatives.
Additional research is also needed to test the replicability of the current findings and to address the following limitations of the present study. First, our developmental interpretations of the differences between the younger and older groups are limited by the cross-sectional nature of the data. Future research will benefit from the use of longitudinal prospective designs in which patterns of cognitive strengths and weaknesses and their behavioral correlates can be charted in the same individuals over time. Further, it would be useful to confirm that the remarkably high frequency of cognitive discrepancies found in the present sample holds through the later adolescent years, given that other studies with older children (e.g., Siegel et al., 1996) have found no difference between autistic and normative rates of verbal–nonverbal discrepancies, although this may be an effect of the different measures used. Second, norm-based measures that can detect discrepancies among lower-functioning individuals and that can thus provide an accurate picture of cognitive profiles across the widest possible range of general ability will be most useful. The final limitation concerns the use of the ADOS as a measure of symptom severity. The ADOS was designed as a diagnostic instrument rather than as a continuous measure of autistic symptomatology. Validation studies finding that ADOS domain scores for children clinically diagnosed with either autistic disorder or PDDNOS were continuously distributed across the two groups (Lord et al., 2000) justifies the provisional use of the ADOS as a quantitative measure in the present study. However, development of alternatives to the current ADOS summary scores or design of similar diagnostic instruments that allow quantitative, dimensional measures of autistic symptomatology will be an important step in future efforts to define subtypes for genetic linkage in autism. These limitations notwithstanding, the current findings indicate that a focus on (1) differential cognitive abilities rather than unitary or summary measures of intelligence and (2) use of empirically quantifiable, dimensional measures of autistic symptoms rather than a priori diagnostic classifications provide a potentially informative approach to understanding autism’s complex phenotype and etiology.
Acknowledgments
This research was supported by grants from the National Institute on Child Health and Human Development (RO3 HD 37898; PO1 HD 35482), the National Institute on Deafness and Other Communication Disorders (PO1 DC 03610), and the National Institute of Neurological Disorders and Stroke (RO1 NS 32992), and was conducted as part of the NICHD/NIDCD Collaborative Programs of Excellence in Autism. We thank the following individuals for their assistance in collecting and preparing the data reported in this paper: Sare Akdag, Susan Bacalman, Pamela DiLavore, Susan Folstein, Anne Gavin, Steve Guter, Courtney Hale, Echo Meyer, Susan Risi, Shelly Steele, and Audrey Thurm. We are especially grateful to the children and families who participated in this study.
Footnotes
Unlike the Wechsler Picture Arrangement subtest, the DAS Nonverbal Reasoning subtests do not involve social content and thus do not confound general inductive reasoning abilities with the more specific ability to reason and make inferences about social events and scripts, in which children with autism have been found to be specifically impaired (Happé, 1994).
The School-Age DAS does not provide significance thresholds for differences between the Verbal score and the Nonverbal Composite score. However, the Verbal–GCA difference score and the Verbal–Nonverbal Composite difference score are conceptually identical, which was reflected in the r (45) = .99 correlation between them. Verbal–GCA difference scores were not used for the Preschool DAS because the Early Number Concepts subtest contributes to the GCA score, but not to the Verbal or Nonverbal cluster score.
Note that in all other instances in this paper the term ‘absolute’ is used to distinguish standardized cluster scores (as in ‘absolute level of verbal ability’) from verbal–nonverbal difference scores.
References
- American Psychiatric Association (1994). Diagnostic and Statistical Manual of Mental Disorders (DSM-IV). 4th Edition. Washington, DC: APA.
- Bailey A, Phillips W, Rutter M. Autism: Towards an integration of clinical, genetic, neuropsychological, and neurobiological perspectives. Journal of Child Psychology and Psychiatry. 1996;37:89–126. doi: 10.1111/j.1469-7610.1996.tb01381.x. [DOI] [PubMed] [Google Scholar]
- Bolton P, Macdonald H, Pickles A, Rios P, Goode S, Crowson M, Bailey A, Rutter M. A case-control family history study of autism. Journal of Child Psychology and Psychiatry. 1994;35:877–900. doi: 10.1111/j.1469-7610.1994.tb02300.x. [DOI] [PubMed] [Google Scholar]
- Carroll, J.B. (1993). Human cognitive abilities: A survey of factor-analytic studies. New York: Cambridge University Press.
- Cohen IL. An artificial neural network analogue of learning in autism. Biological Psychiatry. 1994;36:5–20. doi: 10.1016/0006-3223(94)90057-4. [DOI] [PubMed] [Google Scholar]
- Courchesne E, Karns CM, Davis HR, Ziccardi R, Carper RA, Tigue ZD, Chisum HJ, Moses P, Pierce K, Lord C, Lincoln AJ, Pizzo S, Schreibman L, Haas RH, Akshoomoff NA, Courchesne RY. Unusual brain growth patterns in early life in patients with autistic disorder: An MRI study. Neurology. 2001;57:245–254. doi: 10.1212/wnl.57.2.245. [DOI] [PubMed] [Google Scholar]
- Davidovitch M, Patterson B, Gartside P. Head circumference measurements in children with autism. Journal of Child Neurology. 1996;11:389–393. doi: 10.1177/088307389601100509. [DOI] [PubMed] [Google Scholar]
- Deutsch, C., & Joseph, R.M. (in press). Cognitive correlates of enlarged head circumference in children with autism. Journal of Autism and Developmental Disorders. [DOI] [PubMed]
- Elgar K, Campbell R. Annotation: The cognitive neuroscience of face recognition: Implications for developmental disorders. Journal of Child Psychology and Psychiatry. 2001;42:705–717. doi: 10.1111/1469-7610.00767. [DOI] [PubMed] [Google Scholar]
- Elliott, C.D. (1990). Differential ability scales: Introductory and technical handbook. New York: The Psychological Corporation.
- Elliott, C.D., Murray, D.J., & Pearson, L.S. (1979). British Ability Scales. Windsor, England: National Foundation for Educational Research.
- Fein D, Stevens M, Dunn M, Waterhouse L, Allen D, Rapin I, Feinstein C. Subtypes of pervasive developmental disorder: Clinical characteristics. Child Neuropsychology. 1999;5:1–23. [Google Scholar]
- Fidler D, Bailey J, Smalley S. Macrocephaly in autism and other pervasive developmental disorders. Developmental Medicine and Child Neurology. 2000;42:737–740. doi: 10.1017/s0012162200001365. [DOI] [PubMed] [Google Scholar]
- Folstein SE. Autism. International Review of Psychiatry. 1999;11:269–277. [Google Scholar]
- Folstein SE, Santangelo SL, Gilman SE, Piven J, Landa R, Lainhart J, Hein J, Wzorek M. Predictors of cognitive test patterns in autism families. Journal of Child Psychology and Psychiatry. 1999;40:1117–1128. [PubMed] [Google Scholar]
- Fombonne E, Bolton P, Prior J, Jordan H, Rutter M. A family study of autism. Cognitive patterns and levels in parents and siblings. Journal of Child Psychology and Psychiatry. 1997;38:667–683. doi: 10.1111/j.1469-7610.1997.tb01694.x. [DOI] [PubMed] [Google Scholar]
- Fombonne E, Rogé B, Claverie J, Courty S, Frémolle J. Microcephaly and macrocephaly in autism. Journal of Autism and Developmental Disorders. 1999;29:113–119. doi: 10.1023/a:1023036509476. [DOI] [PubMed] [Google Scholar]
- Frith U, Happé F. Autism: Beyond ‘theory of mind’. Cognition. 1994;50:115–132. doi: 10.1016/0010-0277(94)90024-8. [DOI] [PubMed] [Google Scholar]
- Happé FGE. Wechsler IQ profile and theory of mind in autism: A research note. Journal of Child Psychology and Psychiatry. 1994;35:1461–1471. doi: 10.1111/j.1469-7610.1994.tb01287.x. [DOI] [PubMed] [Google Scholar]
- Happé F. Autism: Cognitive deficit or cognitive style? Trends in Cognitive Sciences. 1999;3:216–222. doi: 10.1016/s1364-6613(99)01318-2. [DOI] [PubMed] [Google Scholar]
- Karmiloff-Smith A. Crucial differences between developmental cognitive neuroscience and adult neuropsychology. Developmental Neuropsychology. 1997;13:513–524. [Google Scholar]
- Karmiloff-Smith A. Development itself is the key to understanding developmental disorders. Trends in Cognitive Sciences. 1998;2:389–398. doi: 10.1016/s1364-6613(98)01230-3. [DOI] [PubMed] [Google Scholar]
- Klin, A., & Volkmar, F.R. (1997). Asperger’s syndrome. In D.J. Cohen & F.R. Volkmar (Eds.), Handbook of autism and pervasive developmental disorders (pp. 94–122). New York: Wiley.
- Klin A, Volkmar FR, Sparrow SS, Cicchetti DV, Rourke BP. Validity and neuropsychological characterization of Asperger syndrome: Convergence with nonverbal learning disabilities syndrome. Journal of Child Psychology and Psychiatry. 1995;36:1127–1140. doi: 10.1111/j.1469-7610.1995.tb01361.x. [DOI] [PubMed] [Google Scholar]
- Lainhart JE, Piven J, Wzorek M, Landa R, Santangelo SL, Coon H, Folstein SE. Macrocephaly in children and adults with autism. Journal of the American Academy of Child and Adolescent Psychiatry. 1997;36:282–290. doi: 10.1097/00004583-199702000-00019. [DOI] [PubMed] [Google Scholar]
- LeCouteur A, Bailey A, Goode S, Pickles A, Robertson S, Gottesman I, Rutter M. A broader phenotype of autism: The clinical spectrum in twins. Journal of Child Psychology and Psychiatry. 1996;37:785– 801. doi: 10.1111/j.1469-7610.1996.tb01475.x. [DOI] [PubMed] [Google Scholar]
- Lincoln, A.J., Allen, M., & Kilman, A. (1995). The assessment and interpretation of intellectual abilities in people with autism. In E. Schopler & G. Mesibov (Eds.), Learning and cognition in autism (pp. 89–117). New York: Plenum.
- Lincoln, A., Courchesne, E., Allen, M., Hanson, E., & Ene, M. (1998). Neurobiology of Asperger syndrome: Seven case studies and quantitative magnetic resonance imaging findings. In E. Schopler, G. Mesibov, & L.J. Kunce (Eds.), Asperger syndrome or high-functioning autism? (pp. 145–166). New York: Plenum.
- Lincoln AJ, Courchesne E, Kilman BA, Elmasian R, Allen M. A study of intellectual abilities in high-functioning people with autism. Journal of Autism and Developmental Disorders. 1988;18:505–523. doi: 10.1007/BF02211870. [DOI] [PubMed] [Google Scholar]
- Lord, C., Rutter, M., DiLavore, P.C., & Risi, S. (1999). Autism Diagnostic Observation Schedule – WPS (ADOS-WPS). Los Angeles, CA: Western Psychological Services.
- Lord C, Rutter M, LeCouteur A. Autism Diagnostic Interview–Revised: A revised version of a diagnostic interview for caregivers of individuals with possible pervasive developmental disorders. Journal of Autism and Developmental Disorders. 1994;24:659– 668. doi: 10.1007/BF02172145. [DOI] [PubMed] [Google Scholar]
- Lord C, Risi S, Lambrecht L, Cook EH, Lenventhal BL, DiLavore PS, Pickles A, Rutter M. The Autism Diagnostic Obervation Schedule- Generic: A standard measure of social and communication deficits associated with the spectrum of autism. Journal of Autism and Developmental Disorders. 2000;30:205–223. [PubMed] [Google Scholar]
- Mackintosh, N.J. (1998). IQ and human intelligence. New York: Oxford University Press.
- Manjiviona J, Prior M. Neuropsychological profiles of children with Asperger syndrome and autism. Autism. 1999;3:327–356. [Google Scholar]
- Mervis, C., Morris, C.A., Bertrand, J., & Robinson, B.F. (1999). Williams syndrome: Findings from an integrated program of research. In H. Tager-Flusberg (Ed.), Neurodevelopmental disorders (pp. 65–110). Cambridge, MA: MIT Press.
- Mottron L, Peretz I, Ménard L. Local and global processing of music in high-functioning persons with autism: Beyond central coherence. Journal of Child Psychology and Psychiatry. 2000;41:1057–1065. [PubMed] [Google Scholar]
- Ozonoff S, South M, Miller J. DSM-IVdefined Asperger disorder: Cognitive, behavioral, and early history differentiation from high-functioning autism. Autism. 2000;4:29–46. [Google Scholar]
- Piven J, Arndt S, Bailey J, Andreasen N. Regional brain enlargement in autism: A magnetic resonance imaging study. Journal of the American Academy of Child and Adolescent Psychiatry. 1996;35:530–536. doi: 10.1097/00004583-199604000-00020. [DOI] [PubMed] [Google Scholar]
- Piven J, Palmer P. Cognitive deficits in parents from multiple-incidence autism families. Journal ofChild PsychologyandPsychiatry. 1997;38:1011–1021. doi: 10.1111/j.1469-7610.1997.tb01618.x. [DOI] [PubMed] [Google Scholar]
- Plaisted, K.C. (2000). Aspects of autism that theory of mind cannot explain. In S. Baron-Cohen, H. Tager- Flusberg, & D. Cohen (Eds.), Understanding other minds: Perspectives from autism and developmental cognitive neuroscience (2nd edn, pp. 222–250). Oxford: Oxford University Press.
- Plaisted K, O’Riordan M, Baron-Cohen S. Enhanced discrimination of novel, highly similar stimuli by adults with autism during a perceptual learning task. Journal of Child Psychology and Psychiatry. 1998;39:765–775. [PubMed] [Google Scholar]
- Rumsey, J.M. (1992). Neuropsychological studies of high-level autism. In E. Schopler & G.B. Mesibov (Eds.), High-functioning individuals with autism (pp. 41–64). New York: Plenum Press.
- Siegel DJ, Minshew NJ, Goldstein G. Wechsler IQ profiles in diagnosis of high-functioning autism. Journal of Autism and Developmental Disorders. 1996;26:389–406. doi: 10.1007/BF02172825. [DOI] [PubMed] [Google Scholar]
- Szatmari P, MacLean JE, Jones MB, Bryson SE, Zwaigenbaum L, Bartolucci G, Mahoney WJ, Tuff L. The familial aggregation of the lesser variant in biological and nonbiological relative of PDD probands: A family history study. Journal of Child Psychology and Psychiatry. 2000;41:579–586. doi: 10.1111/1469-7610.00644. [DOI] [PubMed] [Google Scholar]
- Volkmar, F.R., & Klin, A. (2001). Diagnostic issues in Asperger syndrome. In A. Klin, F.R. Volkmar, S.S. Sparrow (Eds.), Asperger Syndrome (pp. 25–71). New York: The Guilford Press.
- Wechsler, D. (1997). Wechsler Adult Intelligence Scale – Third Edition. San Antonio, TX: The Psychological Corporation.
- Wechsler, D. (1991). Wechsler Intelligence Scale for Children – Third Edition. San Antonio, TX: Psychological Corporation.
- Woodhouse W, Bailey A, Rutter M, Bolton P, Baird G, Le Couteur A. Head circumference in autism and other pervasive developmental disorders. Journal of Child Psychology and Psychiatry. 1996;37:665– 671. doi: 10.1111/j.1469-7610.1996.tb01458.x. [DOI] [PubMed] [Google Scholar]
- World Health Organization (1993). The international classification of diseases (10th edn). Geneva: World Health Organization.