

Abstract
We present an integrated thermokinetic model describing control of cardiac mitochondrial bioenergetics. The model describes the tricarboxylic acid (TCA) cycle, oxidative phosphorylation, and mitochondrial Ca2+ handling. The kinetic component of the model includes effectors of the TCA cycle enzymes regulating production of NADH and FADH2, which in turn are used by the electron transport chain to establish a proton motive force (ΔμH), driving the F1F0-ATPase. In addition, mitochondrial matrix Ca2+, determined by Ca2+ uniporter and Na+/Ca2+ exchanger activities, regulates activity of the TCA cycle enzymes isocitrate dehydrogenase and α-ketoglutarate dehydrogenase. The model is described by twelve ordinary differential equations for the time rate of change of mitochondrial membrane potential (ΔΨm), and matrix concentrations of Ca2+, NADH, ADP, and TCA cycle intermediates. The model is used to predict the response of mitochondria to changes in substrate delivery, metabolic inhibition, the rate of adenine nucleotide exchange, and Ca2+. The model is able to reproduce, qualitatively and semiquantitatively, experimental data concerning mitochondrial bioenergetics, Ca2+ dynamics, and respiratory control. Significant increases in oxygen consumption (VO2), proton efflux, NADH, and ATP synthesis, in response to an increase in cytoplasmic Ca2+, are obtained when the Ca2+-sensitive dehydrogenases are the main rate-controlling steps of respiratory flux. These responses diminished when control is shifted downstream (e.g., the respiratory chain or adenine nucleotide translocator). The time-dependent behavior of the model, under conditions simulating an increase in workload, closely reproduces experimentally observed mitochondrial NADH dynamics in heart trabeculae subjected to changes in pacing frequency. The steady-state and time-dependent behavior of the model support the hypothesis that mitochondrial matrix Ca2+ plays an important role in matching energy supply with demand in cardiac myocytes.
INTRODUCTION
The high metabolic demand of the heart necessitates close matching of energy production to workload. Approximately 2% of cellular ATP is consumed on each heartbeat and almost all of this energy is replenished by mitochondrial oxidative phosphorylation under normoxic conditions (Harris and Das, 1991). Remarkably, the vital process of control and regulation of mitochondrial metabolism is not well understood.
After the development of the chemiosmotic theory of energy transduction by Mitchell (1961), several hypotheses for control of metabolism have been proposed. The first, referred to as respiratory control (Chance and Williams, 1956; Harris and Das, 1991), asserts that ADP availability to the ATP synthase is the limiting factor for mitochondrial ATP production. Increases in workload lead to a rise in cellular ADP and stimulation of oxidative phosphorylation, with the downstream “pull” on electron transport eventually causing acceleration of NADH production by the TCA cycle. The lack of a substantial increase in whole-heart ADP concentration in response to increased pacing frequency, and the observed decrease in ΔμH produced by Ca2+ entry into mitochondria (Heineman and Balaban, 1990; Territo et al., 2000), have been used to argue against activation of ATP synthase based solely on its substrates (Harris and Das, 1991).
A second control hypothesis emerged from the discovery that Ca2+ activates mitochondrial matrix dehydrogenases (McCormack and Denton, 1984; McCormack et al., 1990). According to this hypothesis an increase in the workload of the heart is accompanied by a rise in cytosolic Ca2+, and the subsequent effect of matrix Ca2+ on the TCA cycle increases the supply of reducing equivalents (NADH, FADH2) and an increased “push” of electrons through the respiratory chain, thereby increasing ATP production by generating more proton motive force. However, it has been argued that dehydrogenase activation by Ca2+ might not account quantitatively for observed changes in ATP synthesis rates (Harris and Das, 1991). Therefore, additional regulatory mechanism(s), including direct activation of the ATP synthase by Ca2+ (Territo et al., 2000), have been hypothesized to explain the acceleration of ATP production (Heineman and Balaban, 1990, Harris and Das, 1991). The present work addresses the hypothesis that Ca2+ is involved in coupling energy demand and supply in heart mitochondria. This hypothesis is tested through development and application of an integrative mathematical model that takes into account mitochondrial matrix- and membrane-based processes such as the TCA cycle, oxidative phosphorylation, and Ca2+ dynamics. To date, an integrated kinetic and thermodynamic model of cardiac energy metabolism incorporating mitochondrial Ca2+ dynamics has not been available. The present work builds a unified model of mitochondrial energy metabolism and examines its behavior with respect to changes in substrate supply, metabolic inhibition, and Ca2+. The results provide insight into the essential control properties of the system.
METHODS
General description
The model incorporates the main mitochondrial electrophysiological and metabolic processes and their interactions (Fig. 1). Model differential equations are given in Table 1, whereas rate equations and their behavior are presented in the Appendix. The major components of the model—mitochondrial matrix-associated processes, oxidative phosphorylation, and Ca2+ dynamics—are described in the following sections.
FIGURE 1.

Schematic representation of the mitochondrial electrophysiological and metabolic processes and their interactions, as described by the model. The model takes into account oxidative phosphorylation and matrix-based processes in mitochondria. The tricarboxylic (TCA) cycle of the mitochondrial matrix is fed by acetyl CoA (AcCoA), which is the point of convergence for the oxidation of fatty acids and glucose, the two main substrates of the heart. The TCA (or Krebs) cycle completes the oxidation of AcCoA to CO2 and produces NADH and FADH2, which provide the driving force for oxidative phosphorylation. NADH and FADH2 are oxidized by the respiratory chain and the concomitant pumping of protons across the mitochondrial inner membrane establishes an electrochemical gradient, or proton motive force (ΔμH), composed of an electrical gradient (ΔΨm) and a proton gradient (ΔpH). This proton motive force drives the phosphorylation of matrix ADP to ATP by the F1F0-ATPase (ATP synthase). The large ΔΨm of the inner membrane (−150 to −200 mV; matrix negative with respect to the cytoplasm) also governs the electrogenic transport of ions, including the cotransport of ATP and ADP by the adenine nucleotide translocator, Ca2+ influx via the Ca2+ uniporter and Ca2+ efflux via the Na+/Ca2+ antiporter (Magnus and Keizer, 1997). The model also accounts for the explicit dependence of the TCA cycle enzymes isocitrate dehydrogenase and α-ketoglutarate dehydrogenase on Ca2+. In this way, the rate of Ca2+ uptake by mitochondria is involved in membrane energization through the TCA cycle and oxidative phosphorylation, which are described in detail in the Appendix. Key to symbols: The concentric circles with an arrow across located at the inner mitochondrial membrane represent the ΔΨm. Dotted arrows indicate regulatory interactions either positive (arrowhead) or negative (−).
TABLE 1.
Model differential equations
| State variable | Differential equation | ||
|---|---|---|---|
| [ADP]m |
|
||
| ΔΨm |
|
||
| [NADH] |
|
||
| [ISOC] |
|
||
| [αKG] |
|
||
| [SCoA] |
|
||
| [Suc] |
|
||
| [FUM] |
|
||
| [MAL] |
|
||
| [OAA] |
|
||
| [ASP] |
|
||
| [Ca2+]m |
|

Mitochondrial matrix-associated processes
The tricarboxylic acid (TCA) cycle
The first phase of the model, the TCA cycle, represents the end stage for carbon substrates in the cell. The catabolic pathways for substrate oxidation (e.g., fatty acids, amino acids, and sugars) converge to produce AcCoA, the main input of the TCA cycle.
The dashed lines in Fig. 1 show the regulatory feedback loops incorporated into the model. The rates of the highly-regulated dehydrogenases of the TCA cycle, namely, citrate synthase (CS), isocitrate dehydrogenase (IDH), α-ketoglutarate dehydrogenase (KGDH) and malate dehydrogenase (MDH) and their regulatory interactions have been studied in detail and their behavior is presented in the Appendix. A fundamental feature of the present model is the explicit dependence of the dehydrogenases IDH and KGDH on mitochondrial calcium (Rutter and Denton, 1988; McCormack and Denton, 1984; Nichols et al., 1994; McCormack et al., 1990; Hansford and Zorov, 1998; also see Appendix).
Oxidative phosphorylation (OxPhos)
The OxPhos model is based on that of Magnus and Keizer (1997). The model describes NADH-driven electron transport and proton efflux, and F1F0-ATPase activity and its associated proton influx (Fig. 1; see also Appendix). The adenine nucleotide translocator and the proton leak are also taken into account. In general, this model follows a thermokinetic formulation. The driving forces are redox (Ares) and phosphorylation (AF1) potentials (see Eqs. 26–34) and the proton motive force (ΔμH). Coefficients in the equations correspond to rate constants of explicit conversion steps postulated in the Altman-King-Hill formulation of the model (Pietrobon and Caplan, 1985; Magnus and Keizer, 1997).
The F1F0-ATPase
The original expression for the rate of the F1F0-ATPase (Magnus and Keizer, 1997) was modified to account for reversibility of the enzyme when ΔμH collapses (see Appendix). For example, in uncoupled mitochondria, hydrolysis rather than synthesis of ATP can occur and drive proton pumping.
Mitochondrial calcium dynamics
Mitochondrial Ca2+, [Ca2+]m, is determined mainly by Ca2+ influx through the Ca2+ uniporter and the Na+-dependent Ca2+ efflux driven by the Na+/Ca2+ antiporter. The latter is assumed to be electrogenic based on the reported results of Baysal et al. (1994) (see Appendix).
Model building and numerical methods
The model was built using a modular approach. Briefly, each model component was examined separately, iteratively fine-tuning the kinetic parameters for the best fit to experimental data (Eqs. 13–39). Maple (Maple V, release 4, Waterloo, Canada) was used to study each analytical expression as a function of underlying parameters (see electronic Appendix: http://www.jhmi.edu/bor/model.htm).
Before the final model assembly, the TCA cycle and OxPhos modules were analyzed separately. The adequacy of the expressions for each of the processes involved was tested by simulating the model behavior at steady state. The system was considered to be in steady state when the magnitude of each time derivative was ≤10−13. Model parameters such as the level of AcCoA, ion leak, and levels of electron carriers, were then varied to determine their influence on important mitochondrial functions. If the results were counterintuitive, or inconsistent with basic bioenergetic principles, the model was revised at the level of the analytical expressions stated in Maple and retested. The iteration process was performed until complete and satisfactory expressions were obtained, which converged to results consistent with available experimental evidence.
Numerical integration of model equations (Eqs. 1–12, Table 1) was performed using an Adams routine (SCoP, version 3.51w, Simulation Resources) until steady-state solutions (according to the criterion described above) were obtained. Steady-state values of each state variable were then used as input to software for performing bifurcation and continuation analysis (AUTO 1997, E. Doedel, Concordia University). This software was used to determine the dependence of steady-state solution properties (type and stability) on model parameters.
Dynamic simulations
To test whether or not the global kinetic response of the model accurately reproduces the dynamic response of mitochondrial energetics to changes in workload, we simulated the time-dependent behavior of mitochondrial NADH and Ca2+ during changes in the myocardial pacing frequency. Forcing pulse functions (SCoP version 3.51w, Simulation Resources) for the parameters [Ca2+]i and [ADP]i were incorporated into the model, and the simulations were compared with experimental data obtained in cardiac trabeculae (Brandes and Bers, 2002). Ca2+ transients were simulated with periodic square pulses of [Ca2+]i to 1 μM (from a basal level of 100 nM) for 400 ms duration, applied at frequencies of 0.25 Hz or 2 Hz. To simulate the increased energy consumption when pacing frequency was increased, a single [ADP]i pulse from 50 to 150 μM was applied for the whole interval of high frequency stimulation.
RESULTS
Simulations of the response of mitochondrial energetics to changes in substrate input, levels of electron carriers, and cytoplasmic Ca2+ were performed to test whether the model qualitatively and semiquantitatively reproduced available experimental evidence. The overriding objective was to gain insight into the important sites and mechanisms of control of bioenergetics.
Control properties of the integrated model
Metabolic control analysis of oxidative phosphorylation has previously been used to demonstrate that control is distributed among the respiratory chain/substrate transport, the phosphorylation system, and the proton leak (Hafner et al., 1990; Murphy, 2001). This control can redistribute during electron chain inhibition, mitochondrial uncoupling, or with postischemic mitochondrial damage (Borutaite et al., 1995). Therefore, the simulations presented below examine the effects of metabolic perturbation on mitochondrial energetics to better understand control of the integrated system (Brand and Kesseler, 1995).
Influence of AcCoA on mitochondrial energetics
The contribution of substrate availability to the global response of bioenergetics was tested by varying either the earliest (AcCoA) or last (ADP) substrate (next section) of the integrated model. When the concentration of AcCoA was increased to a maximum of 10 μM, an approximate twofold increase in VO2 was obtained; beyond this, VO2 plateaued (Fig. 2 A). This increase in respiration rate is driven by the generation of NADH in the range of 0.001–1.5 mM (Fig. 2 A). The VO2 registered at very low AcCoA is mainly driven by glutamate (see Appendix Eq. 24).
FIGURE 2.

Effects of increasing substrate delivery on mitochondrial energetics. AcCoA concentration is varied and the steady-state behavior of the model analyzed according to a continuation analysis (see text). The correlative changes in the steady-state behavior of VO2 and NADH versus (A) AcCoA and (B) ΔΨm are depicted when AcCoA is systematically changed. The simulation was run with the following set of parameters: VmaxANT = 5.0 mM s−1; ΔpH = −0.6; ρres = 0.048 mM; ADPi = 0.05 mM;  mM s−1; ρF1 = 0.06 mM; [Ca2+]i = 0.5 μM; gH = 0.01 mM s−1 V−1. The rest of the parameters are as indicated in Table 3. (C) Simulation results match experimental data obtained with pig heart mitochondria, redrawn from Territo et al. (2000).
Over the full range of the VO2 increase, stimulation of electron transport is associated with a modest increase in ΔΨm (∼14 mV; Fig. 2 B). The linear flow-force relationship between VO2 and ΔΨm represented in Fig. 2 B is in agreement with experimental results reported for cardiac mitochondria by Territo et al. (2000) (redrawn in Fig. 2 C).
Influence of phosphorylation potential on mitochondrial energetics
The respiratory rate (VO2) increases as a function of the maximal rate of the adenine nucleotide translocator, ANT (Fig. 3 A) by ∼six-to-sevenfold before saturation. In keeping with the classical theory of respiratory control, VO2 varies with matrix ADP concentrations in the mM range (Fig. 3 A, inset). At low ADP, representing state 4 respiration, the basal rate of oxygen consumption is nonzero, supported in the model by a small proton leak across the mitochondrial inner membrane. A steep response of VO2 to small changes in ADP, as would occur during increased metabolic demand, is evident as the transition is made from state 4 to state 3.
FIGURE 3.
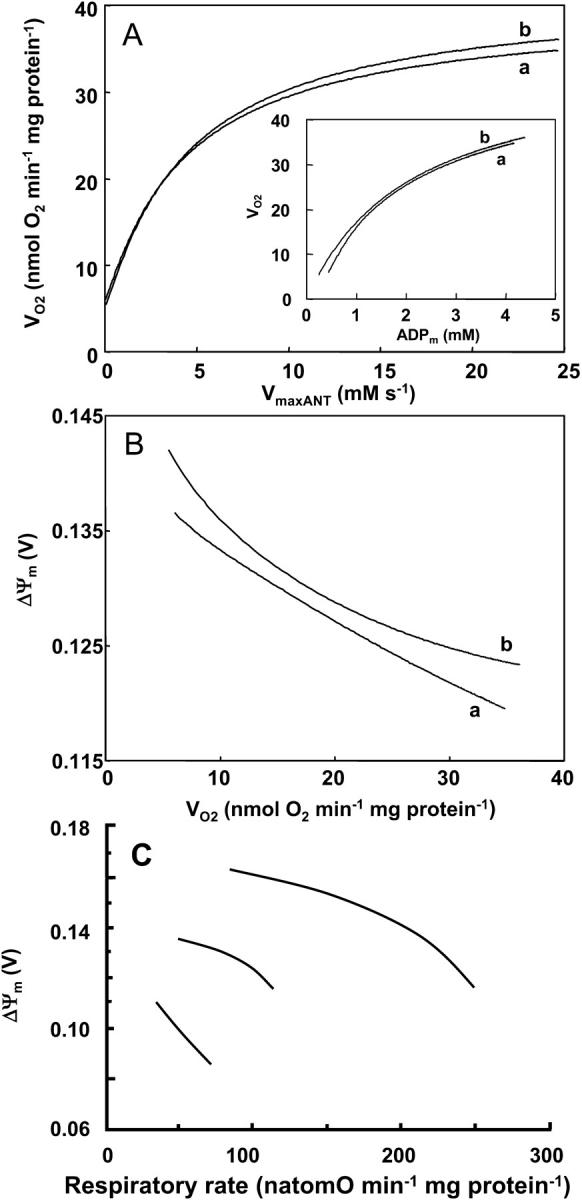
Relationship between membrane potential and respiratory flux upon changes in adenine nucleotide translocator activity. The changes in respiration rate, VO2, and membrane potential, ΔΨm, are determined by the behavior of the whole model according to a steady-state analysis performed at different adenine nucleotide translocator maximal activities (VmaxANT) which result in different ADPm concentrations (A, inset). The left portion of curves a and b in panels A and B, corresponds to mitochondria in state 4 (i.e., low ADP) and the increases in VO2 result from the respiratory control exerted by increasing ADP concentrations. The simulations were run with the following parameter values: (a) ΔpH = −0.6; ρres = 0.00072 mM; ADPi = 0.05 mM;  mM s−1; ρF1 = 1.216 mM; [Ca2+]i = 0.1 μM; gH = 0.01 mM s−1 V−1; AcCoA = 1.0 mM. VmaxANT is varied in the range 0.01–25 mM s−1; (b) all parameters are the same as in a, except for ρres = 0.0051 mM and ρF1 = 0.61 mM. The remainder of the parameters are reported in Table 3. (C) Changes in the relationship between ΔΨm and the respiratory rate obtained at various ratios of creatine/creatine phosphate in a preparation of heart mitochondria with normal or reduced respiratory activity (left-shifted curves). Redrawn from Borutaite et al. (1995).
At this point it is worthwhile introducing the definition of “push” or “pull” conditions as those in which the control exerted on the respiratory flux correspond to processes upstream (e.g., TCA cycle) or downstream (e.g., ANT, respiration, ATPase) of NADH, respectively (see also Metabolic Control Analysis of Mitochondrial Energetics). Push is obtained when simulations are performed with a large concentration of respiratory electron carriers, ρRES, and low kcat for both IDH and KGDH activities, whereas the opposite is true for pull conditions (see Fig. 5 legend). A decline in ΔΨm accompanies ADP stimulation of VO2 under pull conditions (Fig. 3 B). Thus, respiration is stimulated as phosphorylation potential drops along with an increased F1F0ATPase activity.
FIGURE 5.

Mitochondrial Ca2+ level after changes in cytoplasmic Ca2+. (A) The behavior of the whole model is studied with the AUTO 97 software as a function of cytoplasmic Ca2+ concentration, [Ca2+]i. The simulations were performed with the following set of parameters: (pull): ρRES = 0.00072 mM, ρF1 = 1.216 mM,  s−1,
s−1,  s−1, and
  mM s−1, and (push): ρRES = 0.0036 mM, ρF1 = 0.0522 mM,
  s−1,
s−1,  s−1, and
  mM s−1. Curve a is obtained with the same parametric set as “pull” except for
  mM s−1. Otherwise the concentration of AcCoA is 1.0 mM, and the catalytic constants of CS and MDH are
  s−1 and
  s−1, respectively. (B) Experimental results redrawn from McCormack et al. (1990) showing the accumulation of mitochondrial Ca2+ in the absence (curve I) or in the presence of Na+ (curve II).
Conditions which diminish the ability of the respiratory chain to oxidize NADH decrease VO2 for any given ADP concentration (Fig. 3, A and B, trace a). This is simulated by decreasing the maximum velocity of the ANT, and reducing the concentration of respiratory electron carriers (ρres) by sevenfold.
The results in Fig. 3 B are in qualitative agreement with the experimental results obtained with isolated heart mitochondria (reproduced in Fig. 3 C; Borutaite et al., 1995). Under conditions of a decrease in the respiratory activity of heart mitochondria due to ischemia, the curve describing the relation between ΔΨm and succinate-driven respiratory rate is shifted down and to the left with respect to the behavior of normal mitochondria (Fig. 3 C).
Influence of proton leak and respiratory inhibition on mitochondrial energetics
Inhibition of respiration is simulated by decreasing the concentration of electron carriers in the mitochondrial membrane (ρres) (Fig. 4 A). The steepness of the VO2 curve over the low range of ρres, and the electron carrier concentration at which VO2 reaches saturation, are influenced by the magnitude of proton influx across the inner membrane, as depicted in Fig. 4 A, curves a and b. Proton influx can be varied by changing the concentration of F1F0-ATPase, which dissipates ΔμH. Increasing the concentration of F1F0-ATPase increases VO2 over the low ρres range (Fig. 4 A; curvea). As expected, with minimal ATP synthase activity, the membrane can support a higher ΔΨm at any VO2 (Fig. 4 B; curve b). These modeling results resemble experimental data obtained with normal mitochondria in either state 3 or 4 upon titration with the metabolic inhibitor malonate at various creatine/creatine phosphate ratios (Fig. 4 C; Borutaite et al., 1995).
FIGURE 4.
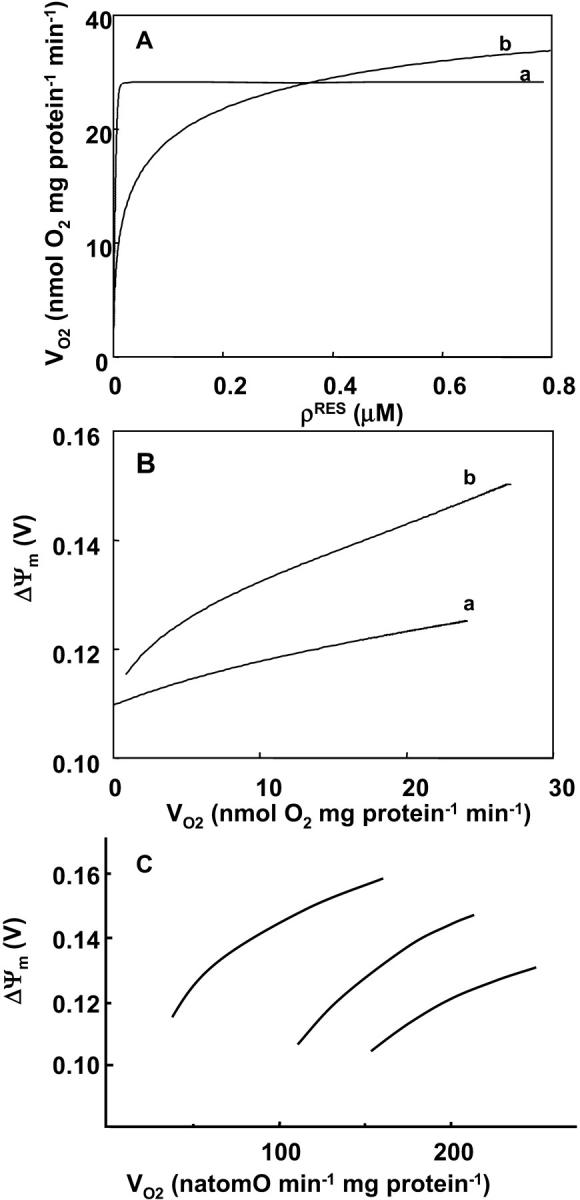
Relationship between mitochondrial inner membrane potential and the respiratory flux. The rate of the electron transport chain and the ΔΨm are modulated through the concentration of electron carriers (ρres) (A, B). A steady-state analysis of the whole model behavior is performed. The parameters utilized in the simulations are those reported in Table 3 and as follows: Pi = 20.0 mM; ΔpH = −0.6;  mM s−1; ADPi = 0.05 mM;
  mM s−1; gH = 0.01 mM s−1 V−1, [Ca2+]i = 0.1 μM and AcCoA = 1.0 mM. The values of F1F0-ATPase concentration, ρF1, differ between curves, being 1.216 mM for curve a and 0.06 mM for curve b. (C) Changes in the relationship between ΔΨm and the respiratory rate obtained upon malonate titration at different phosphorylation potentials (different ratios of creatine to creatine phosphate) in a preparation of heart mitochondria. Redrawn from Borutaite et al. (1995).
Response of mitochondrial energetics to changes in cytoplasmic and mitochondrial Ca2+
There are two effects of Ca2+ on mitochondrial bioenergetics that are diametrically opposed: on the one hand, Ca2+ influx dissipates ΔΨm and decreases the proton motive force; on the other, Ca2+ stimulates the production of NADH by the TCA cycle, increasing the proton motive force and ATP production. One of the main objectives of this study is to determine the balance between these effects under different conditions. Therefore, simulations are presented using two different parameter sets that illustrate different model behaviors. A key question is whether or not the intrinsic biophysical properties of the system allow control of mitochondrial metabolism by matrix Ca2+.
Steady-state behavior of mitochondrial calcium
The first step toward understanding the effects of Ca2+ on the global behavior of the model is to simulate the steady-state response of mitochondrial matrix free Ca2+ ([Ca2+]m) to changes in free cytosolic Ca2+ concentration ([Ca2+]i). Inasmuch as there is little quantitative information about the relative contributions of the two major Ca2+ transport pathways in determining steady-state [Ca2+]m, the parameter space is explored with respect to the maximal Na+/Ca2+ antiporter rate. Results of these studies show that following [Ca2+]i changes in the physiological range (0.01 to 1.2 μM), [Ca2+]m increases nonlinearly after crossing a certain threshold [Ca2+]i, and continues to increase to more than 20 μM without saturation (Fig. 5 A). This threshold depends on the ratio of Ca2+ uniporter and Na+/Ca2+ antiporter rates. In fact, the rightward shift of the [Ca2+]m curve (Fig. 5, trace a) is due to a large increase in the rate of the Na+/Ca2+ antiporter, which counteracts influx through the Ca2+ uniporter. The general profile of [Ca2+]m accumulation upon increasing [Ca2+]i are in agreement with experimental results obtained by several authors (Fig. 5 B) (Miyata et al., 1991; Collins et al., 2001; reviewed by McCormack et al., 1990). The right shift in the experimental curve shown in Fig. 5 B was elicited by the addition of Na+ (McCormack et al., 1990) supporting the involvement of the Na+/Ca2+ antiporter in this response.
As the rates of the Ca2+ uniporter and Na+/Ca2+ antiporter are coupled indirectly through ΔΨm, the steady-state [Ca2+]m uptake curve (Fig. 5 A) is relatively unaltered by changing other parameters that determine push or pull conditions. The effect of [Ca2+]i on VO2, however, is sensitive to such parameters, as described in the following section.
Response of mitochondrial energetics to changes in Ca2+
Effects on VO2
Activation of VO2 by Ca2+ is evident for both push and pull parameter sets (Fig. 6 A). Higher basal VO2 values at a given [Ca2+]i are evident for conditions in which the ANT and the electron transport flux are the main rate-controlling steps of respiration (pull) (Table 2). However, the degree of activation by Ca2+ is reduced compared to the push condition (∼9.1% versus 23%, Fig. 6 A) due to the Ca2+ insensitivity of the main rate-controlling steps of respiration. Paralleling the increase in VO2, the steady-state fluxes through the Ca2+-sensitive enzymes, KGDH and IDH, also increases as a function of Ca2+ (Fig. 6 B, inset).
FIGURE 6.

Respiratory flux and NADH levels upon changes in [Ca2+]I. The model is analyzed as described in Fig. 5 with the same set of parameters indicated in its legend for push and pull conditions. The steady-state respiratory flux (A) and NADH concentration (B) corresponding to the same simulations presented in Fig. 5 are depicted as a function of [Ca2+]i.
TABLE 2.
Control of the respiratory flux by TCA cycle enzymes and the rates of membrane-associated processes
| Parametric set, flux control coefficient
|
||
|---|---|---|
| Push | Pull | |
| TCA cycle | ||
| CS | 0.33 | 0.35 |
| IDH | 22.8 | 5.3 |
| KGDH | 70.0 | 0.3 |
| MDH | 3.6 | 13.9 |
| Membrane-associated processes | ||
| ANT | 3.8 | 38 |
| Respiration | 2.1 | 6.7 |
| F1F0-ATPase | −0.2 | 2.7 |
| Proton leak | 0.1 | 0.3 |
The control exerted by the rate of each process on mitochondrial respiration is quantified around the steady state corresponding to the set of parameters indicated in the legend of Fig. 5. The flux control coefficient (in %) indicates to which extent a flux (i.e., the respiratory flux) changes upon a change on the activity of an enzyme in the pathway. The flux control coefficient was calculated from the slope of the double logarithmic plot of VO2 as a function of the process rate under study. Under push and pull conditions, the flux control coefficients were determined at a [Ca2+]i concentration of 0.1 or 0.5 μM. Inasmuch as the differences between flux control coefficients quantified at 0.1 or 0.5 μM are 1% or less, we present the data obtained with 0.1 μM.
In the cases of CS, IDH, KGDH, and MDH the kcat is varied around the steady-state level (<5% change) to compute the control coefficient. ρres and ρF1 are varied (<10% change) to compute the control exerted by respiration itself and the F1F0-ATP synthase, respectively. The control exerted by the adenine nucleotide translocator and the proton leak is performed with parameters VmaxANT and gH, respectively.
Effects on NADH and ΔΨm
A positive correlation between NADH and Ca2+ was obtained for the pull condition and the intermediate Ca2+ range for push (Fig. 6 B). Similar to the behavior of VO2, higher levels of NADH are obtained when the control shifts toward the respiratory chain (pull) (Fig. 6 B). However, this condition gives a relatively smaller stimulation of NADH by Ca2+ (1.8-fold against 3.7-fold over the same range of [Ca2+]i) (Fig. 6 B). For the push condition, ΔΨm is slightly increased with an increase in Ca2+ (Fig. 7 B)—this is possible only if the stimulatory effect of Ca2+ on TCA cycle, and the concomitant increase in proton pumping, exceed the depolarization of ΔΨm due to energy dissipation by Ca2+ entry. The decrease in NADH observed at high [Ca2+]i in the push condition is due to saturation of the stimulatory effect on dehydrogenase activity whereas respiratory flux continues to increase (Fig. 6, A and B, inset).
FIGURE 7.

F1F0 ATP synthase activity and membrane potential as a function of [Ca2+]i. The different curves represent the rate of the mitochondrial ATP synthase, VATPase (A) and ΔΨm (B) at steady state after an increase in [Ca2+]i, as shown in Fig. 5 with the same set of parameters described in its legend (push and pull).
Effects on VATPase
The fundamental question of whether the sum total of the effects of Ca2+ on bioenergetics is able to increase the production of ATP is addressed in Fig. 7. The increase in the rate of ATP synthesis (VATPase) with increasing Ca2+ is higher under push (+18.1%) rather than pull (+5.2%) conditions, although the VATPase is larger over the whole range of Ca2+ in the pull condition. In the region of high Ca2+, the negative correlation between ΔΨm and Ca2+ in the push condition (Fig. 7 B) results in a negative correlation between VATPase and Ca2+ (Fig. 7 A).
The net difference between the stimulatory effect of Ca2+ on TCA cycle dehydrogenases and the dissipative effect of Ca2+ on ΔΨm (Fig. 7 B) in turn determines the extent of stimulation or inhibition of ATP synthesis. Maximal stimulation occurs in the ΔΨm range of maximal responsiveness, i.e., near the midpoint of the VATPase versus ΔΨm curve (see Appendix Fig. A6, B). If ΔΨm is too high or too low, the increase in ATP synthesis rate is negligible, even if respiration is stimulated strongly. The same reasoning explains why, in a condition of pull VATPase is stimulated marginally (+5.2% from 24 nM to 1.07 μM [Ca2+]i).
Metabolic control analysis of mitochondrial energetics
A control analysis of respiration has also been undertaken to further understand the control of mitochondrial respiration prevailing under the conditions analyzed above (Figs. 5–7). Control analysis is performed around the steady states given by [Ca2+]i 0.1 and 0.5 μM (Fig. 5). The respiratory flux control coefficients shown in Table 2 are calculated by varying the Vmax values of the different processes (see Methods).
Under push conditions, the main rate-controlling steps of respiration are the Ca2+-sensitive dehydrogenases (KGDH and IDH) of the TCA cycle (Table 2). KGDH and IDH controlled 70% and 23%, respectively, of the respiratory flux when [Ca2+]i stimulates the rates of respiration (Fig. 6 A), the F1F0-ATP synthase (Fig. 7 A) and the TCA cycle.
A large control by the respiratory chain and the ANT on the respiratory flux is obtained under pull conditions (Table 2). The latter situation corresponds closely to that described by Borutaite et al. (1995) regarding the control of respiration in heart mitochondria. Under these conditions, the processes downstream of NADH are flux-controlling (Table 2), but the ATP synthase is less stimulated by [Ca2+]i (5.2%) when compared to the 18% increase registered under push conditions (Table 2). Thus, we conclude that [Ca2+]i is better able to stimulate the rate of mitochondrial ATP synthesis when the TCA cycle exerts a significant control on respiration.
After a closer inspection of the initial reaction rate response of IDH and KGDH with respect to their substrates, only KGDH activity exhibits substantial elasticity to Ca2+ concentration within the stimulation range, in agreement with reported data (see Appendix Figs. A2 and A3; also see McCormack et al., 1990). This result explains why KGDH must exert a significant control on metabolism for respiratory flux to be stimulated by [Ca2+]m (Figs. 5, and 6 A).
Time-dependent behavior of mitochondrial energetics during workload changes
The ability of the model to simulate time-dependent behavior was assessed by attempting to reproduce experimental data concerning mitochondrial NADH and Ca2+ dynamics obtained in heart trabeculae when challenged by changes in pacing frequency (Brandes and Bers, 1997, 2002). In these experiments, mitochondrial and cytoplasmic Ca2+ and NADH signals from rat heart trabeculae are simultaneously recorded during changes in the frequency of the electrical stimulation (Brandes and Bers, 2002). Increasing the pacing frequency from 0.25 Hz to 2 Hz results in the NADH concentration exhibiting an undershoot followed by a recovery phase to a new steady level (Fig. 8 A), whereas a decrease in the pacing frequency leads to an overshoot in NADH and slow relaxation of the signal back to the original baseline level.
FIGURE 8.

Time-dependent behavior of Ca2+ and NADH after changes in workload. (A, B) Experimental data showing the responses of NADH (A) and mitochondrial Ca2+ (B) to an increase in stimulation frequency from 0.25 to 2 Hz in a rat cardiac trabeculae (Reproduced from Brandes and Bers (2002) by copyright permission of the Biophysical Society). (C) Model response of mitochondrial Ca2+ to the pacing protocol described in Model Building and Numerical Methods, applied at low frequency (0.25 Hz) for 100 s, and then a high frequency (2 Hz) for 200 s, followed by a return to the low frequency. (D) Time course of NADH levels during changes in pacing frequency, simulated by increasing the Ca2+ pulse frequency combined with an increase in ADPi. The “pull” parametric condition is similar to that defined in the legend of Fig. 5 except for ρRES = 0.0006, ρF1 = 1.787 mM, and  mM s−1; “pull II” is similar to “pull” except ρRES = 0.00072 mM and
  mM s−1. (E) The effects of a change in Ca2+ pulse frequency or ADPi applied separately.
An identical increase in pacing frequency in the mitochondrial model reveals a time course of [Ca2+]m accumulation similar to the experimental results (Fig. 8 C), with [Ca2+]m rising monotonically as the mitochondria function as an integrator of the pulsatile cytoplasmic Ca2+ transients, consistent with the previous results of Miyata et al. (1991).
Varying only the [Ca2+]i transient driving function without changing ADP in the simulations results in a monotonic rise in NADH during an increase in pacing frequency (0.25 Hz–2 Hz) and a monotonic decline upon decreasing frequency (Fig. 8 E).
A pulse of ADP (50–150 μM) in the absence of an increase in [Ca2+]i pacing frequency results in a rapid decrease in NADH due to stimulation of the respiratory chain (pull condition) and recovery upon returning to the basal level (Fig. 8 E).
When the change in Ca2+ transient frequency and the increase in ADP are combined, model NADH concentration transients closely resemble the experimental data (Fig. 8 D). The rate of recovery of NADH can be accelerated by a small (20%) increase in respiration and a fourfold increase in  (Fig. 8 D; pull II). Fitting the curve of NADH recovery with a single exponential function renders t1/2 values of 112 and 20 s for the conditions of pull and pull II, respectively. Mitochondrial Ca2+ relaxes with similar kinetics as NADH after the onset of high pacing frequency (t1/2 = 127 and 33 s for pull and pull II, respectively), resembling more closely the relaxations observed by Brandes and Bers (2002).
DISCUSSION
General
The main contribution of this modeling study is to link the TCA cycle, OxPhos, and mitochondrial Ca2+ dynamics through a mathematical model able to describe mitochondrial energetics based on well-known bioenergetic principles, i.e., the dependence of respiration on the redox potential and ΔμH, and the F1F0-ATPase on the phosphorylation potential and ΔΨm. The model is used to explore the interaction between mitochondrial energy metabolism and important extramitochondrial signals such as Ca2+ and substrate delivery. Several features distinguish this model from those presented previously: 1), the model integrates the kinetics of the TCA cycle with oxidative phosphorylation and Ca2+ handling (Fig. 1), 2), both thermodynamics and kinetics of the reactions are taken into account, permitting dynamic studies of enzyme kinetics and key metabolic intermediates as well as redox potential and ΔΨm as the steady state is approached, and 3), the model incorporates the explicit dependence of the TCA cycle dehydrogenases on Ca2+, allowing examination of the influence of Ca2+ on mitochondrial metabolism as a whole.
Metabolic control of oxidative phosphorylation
The integrative framework provided by the model makes it possible to analyze points of control of mitochondrial respiration by investigating how mitochondrial ATP production is matched to an increase in cardiac workload through increases of cytoplasmic Ca2+.
Stimulation of respiration by ADP after changes in cellular ATP utilization has been proposed as one of the mechanisms by which mitochondrial ATP production meets the cellular ATP demand (respiratory control; see also Chance and Williams, 1956; Harris and Das, 1991). A shift from state 4 (respiration is low, ΔμH is high, no ATP synthesis) to state 3 (respiration is high, ΔμH is lowered by maximal ATP synthesis) is known to be accompanied by control redistribution in isolated mitochondria (Groen et al., 1982; Brown et al., 1990; Murphy, 2001). In cells, mitochondria are most often intermediate between states 3 and 4 (Ainscow and Brand, 1999; Murphy, 2001). The model reproduces the expected relationships between ΔΨm, VO2, and F1F0ATPase rate after shifts between states 3 and 4 when experiments simulating inhibition of the respiratory chain or the adenine nucleotide translocator are performed (Figs. 3, 4).
Control redistribution also occurs during impairment of mitochondrial function after ischemic injury. Mitochondria isolated from ischemic hearts show a decrease in respiratory capacity and a decrease in phosphorylation potential when respiring in the presence of succinate. These effects are more pronounced the longer the ischemic period, e.g., from 30 to 45 min (Borutaite et al., 1995). Such an inhibition of the respiratory chain, simulated here by reducing the concentration of electron carriers, results in a decreased respiration rate and a concomitant decrease in membrane potential (Fig. 4), consistent with experimental results (Fig. 4 C; see also Borutaite et al., 1995).
The model also reveals a steep dropoff of oxygen consumption as the concentration of electron carriers (ρres) reached a critical low level (Fig. 4 A). This type of threshold for disruption of mitochondrial function with respect to respiratory complex inhibition has been described previously (Murphy, 2001) and studied in vitro by titrating complex activity with irreversible inhibitors (Davey and Clark, 1996; Taylor et al., 1994; Rossignol et al., 1999). Maintenance of oxidative phosphorylation despite inhibition of a substantial fraction of the respiratory complexes may be explained by their high elasticities with respect to their substrates (Rossignol et al., 1999; Murphy, 2001). For example, partial inhibition of complex III will increase the ubiquinol/ubiquinone ratio, which would then increase the activity of uninhibited complexes. Thus, oxidative phosphorylation may be buffered against loss of respiratory chain components depending on the extent of inhibition of an individual complex required to decrease overall flux (Taylor et al., 1994). In our simulations, the threshold for collapse of respiration also depends on the inward flux of protons across the mitochondrial inner membrane (Fig. 4 A): when proton uptake is faster, the threshold ρres is shifted to a lower concentration range so that a greater fraction of carriers needs to be inhibited to affect respiration. It is important to note that ATP production would decrease before the decline in VO2, as a result of the drop in ΔΨm at high proton uptake rates (Fig. 4 B).
Control by availability of substrate to the TCA cycle, AcCoA, may be relevant in the case of reperfusion of the heart after ischemia, inasmuch as TCA cycle flux is maintained or enhanced after brief ischemia (Weiss et al., 1993). The overall simulated flux through the TCA cycle in the range 0.05–0.1 mM s−1 (10–20 μmol g dry wt−1 min−1), closely reproduces the global flux in whole hearts as reported in Jeffrey et al. (1999) and Williamson et al. (1976). Our results show that AcCoA levels exert control on respiratory flux, in parallel with NADH production, until saturation is reached (Fig. 2 A). As reported by Territo et al. (2001), substrate addition to isolated Ca2+-depleted mitochondria increases the respiration rate by ∼3.5-fold, ΔΨm by ∼30 mV (Fig. 2 C), and NADH by 7.7-fold. Similar trends are exhibited by VO2, NADH, and ΔΨm in the simulations shown in Fig. 2.
Effects of Ca2+ on mitochondrial energetics
The inotropic mechanisms activated in response to an increase in cardiac workload (e.g., an increase in heart rate and/or Ca2+ release) also increase the time-averaged Ca2+ in the cytoplasm: this has been proposed as a control factor for increasing mitochondrial ATP production (Harris and Das, 1991; Territo et al., 2000, 2001).
An increase in [Ca2+]i has two opposite effects on mitochondria: a stimulatory effect on the activity of the TCA cycle dehydrogenases as a consequence of higher [Ca2+]m (Figs. 5 and 6), and a dissipative effect on the inner mitochondrial membrane potential due to the influx of the divalent cation. The balance between these two effects is reflected by ΔΨm. In isolated mitochondria, Ca2+ stimulation can increase NADH (McCormack et al., 1990; Hansford and Zorov, 1998; Territo et al., 2000), but the magnitude of this increase will also depend on any downstream effects on NADH oxidation. Flux through the electron transport chain will be accelerated by dissipation of ΔμH, which could be caused by an increase in F1F0-ATPase velocity (due to increased ADP availability or direct stimulation of the ATPase (Territo et al., 2001)), or by non-ATPase-mediated energy dissipating pathways such as Ca2+ influx (relevant to the present model simulations) or enhanced proton leak. Non-ATPase energy dissipation will increase VO2 without necessarily increasing ATP production; however, our model simulates both an increase in VATPase and an increase in VO2 as a function of [Ca2+]i (Figs. 6 A and 7 A), demonstrating that TCA cycle stimulation is adequate to bolster NADH levels and ΔΨm (Figs. 6 B and 7 B). The increase in the rate of ATP production by the mitochondria after an increase in [Ca2+]i from 20 to 660 nM is ∼18%, a moderate change relative to the increase in VO2 (usually more than 20% increase; Figs. 6 A and 7 A).
In the framework of the present model, the control of the respiratory flux at the mitochondrial level may be exerted by processes upstream and downstream of NADH (Table 2). Mitochondrial energetics is in a condition of push when respiration is controlled mainly by processes upstream of NADH, i.e., the TCA cycle. In this regard, a significant stimulation of ATP synthesis by Ca2+ can be achieved when respiration is controlled at the level of the Ca2+-sensitive dehydrogenases (Table 2: push). A drawback of the push condition is that the NADH levels produced by the model are lower than those determined experimentally (e.g., Brandes and Bers, 1997). Under pull conditions, downstream processes such as ANT or respiration itself, are the main rate-controlling steps of respiration (Table 2: pull).
Experimental data obtained for isolated rat liver cells show that control of respiration and oxidative phosphorylation is primarily downstream of NADH (Brown et al., 1990). Accordingly, rat liver mitochondria would be predominantly in the pull condition, inasmuch as 49% of the control is exerted by the processes of ATP synthesis, transport and consumption, 22% by proton cycling not coupled to ATP synthesis, and only 29% by respiration and upstream processes. Brown et al. (1990) estimated that 15–30% of the control over respiration would be exerted by processes involved in NADH generation. In our simulations, under pull conditions, the stimulation of oxidative phosphorylation by increasing cytosolic Ca2+ concentration is diminished (Figs. 6 and 7). Thus, the further incorporation of Ca2+-activated cytosolic ATPases, such as those involved in Ca2+ handling and muscle contraction, may be required in the future, to better couple the acceleration of VO2 with the VATPase and increase the contribution of downstream pull on the system. In this regard, Territo et al. (2000) have reported that addition of Ca2+ to isolated mitochondria stimulated O2 consumption as well as NADH levels. Determining ATP contents in mitochondrial preparations subjected to increasing Ca2+ concentrations, they inferred a stimulation of the ATP synthase activity. To account for these findings, they concluded that the F1F0-ATPase must be directly activated by Ca2+ (Territo et al., 2000, 2001). Nevertheless, it is notable that we can simulate an increase in ATPase activity upon increasing [Ca2+]i without invoking other mechanisms of activation apart from the known biochemical and biophysical principles ruling mitochondrial bioenergetics. Stimulation depends only on the driving forces involved: the phosphorylation potential and the proton motive force. Obviously, inasmuch as the model simulations can reproduce different control properties of the system, they cannot provide an unequivocal quantitative answer to the relative contributions of upstream and downstream control mechanisms in living tissues. Therefore, we do not presume to strongly favor one control point over another for all cases; however, the model provides important feasibility arguments to be tested in future experimental studies.
An additional limitation of model interpretation lies in the absence of spatial organization of the mitochondria and cellular structures. For example, intracellular compartmentation of the adenine nucleotide pool has been proposed as an alternative explanation to Ca2+ activation in the context of matching of energy production and demand. It has been argued that cardiac contractile failure during ischemia or hypoxia still happens despite high ATP contents (70–80% of normal ATP content), leading to the hypothesis that a localized metabolic compartment may be present in which larger changes in phosphorylation potential occur. There is evidence for metabolic compartmentation (reviewed in Saks et al., 1998) and such metabolite channeling may be due to the close proximity of energy-consuming and energy-producing sites or to the actions of the creatine phosphate shuttle (Saks et al., 2001).
Similarly, the close apposition of sarcoplasmic reticular Ca2+ release sites and mitochondria may create a local Ca2+ microdomain, in which Ca2+ concentrations might be much higher than the bulk phase. Experimental evidence for fast uptake of mitochondrial Ca2+ has been reported (Rizzuto et al., 1998; Duchen et al., 1998). Our simulation results of the dynamics of Ca2+ uptake in response to pulses of [Ca2+]i indicate that mitochondrial Ca2+ must essentially act as an integrator of cytosolic Ca2+ to reproduce intact muscle behavior (Fig. 8). This is another area in which spatial considerations and alternative Ca2+ uptake pathways may be incorporated in the future.
Time-dependent behavior of mitochondrial energetics
The ability of the model to simulate time-dependent behavior is indeed the most rigorous test of its validity, and emphasizes the utility of a model based on realistic kinetic properties of its components. We have been able to closely reproduce the NADH evolution in rat heart trabeculae when challenged by increases in workload through the pacing frequency of electrical stimulation (Brandes and Bers, 2002). The temporal profile of NADH evolution found experimentally can be simulated (compare Fig. 8, A and D). To reproduce the observed NADH transients, we have to incorporate an increase in ADP to represent increased cellular ATPase activity together with the increase in the pacing frequency of [Ca2+]i. Thus, the model results suggest a co-participation of Ca2+ and ADP to explain mitochondrial NADH dynamics during an increase in workload. Additionally, we conclude that the under- and over-shoots of mitochondrial NADH during changes in pacing frequency are due to the rapid effects of ADP on respiration followed by the slower adaptation of the Ca2+-sensitive dehydrogenase activities. These results point out the involvement of respiratory control and activation of dehydrogenases by Ca2+ in the coupling between energy supply and demand in cardiac myocytes challenged by changes in workload.
Previous models of energetics
Previously, the most comprehensive metabolic models of cardiac metabolism were reported by Kohn and co-workers, to describe the energetics of the rat heart consuming different carbon substrates (Kohn and Garfinkel, 1979; 1983). Glycolysis, fatty acid oxidation, the TCA cycle, a lumped system representing mitochondrial respiration and oxidative phosphorylation, and chelation equilibria for nucleotides and organic acids were included in this model. However, these models were essentially based on mass action laws, with the assumption that most of the metabolic steps were reversible.
Other TCA cycle models were specifically developed for interpreting the data from NMR studies of whole hearts (Weiss et al., 1992, 1993; Yu et al., 1997; Tran-Dinh et al., 1996; Jeffrey et al., 1999). In such cases, the model equations were designed to fit the evolution of the 13C enrichment profiles of various TCA cycle intermediates, following the approach of Chance et al. (1983). The tracer equations used in these models do not address any explicit kinetic mechanism of each enzyme participating in the TCA cycle.
Other models of the TCA cycle have been developed for the amoeba Dictyostelium discoideum based on data about the temporal evolution of tracers (Wright et al., 1992; Shiraishi and Savageau, 1992). Wright and collaborators (1992) based their model on Michaelis-Menten kinetics taking into account the kinetic constants for substrates, products and some effectors obtained from the in vitro characterization of enzyme kinetics. Shiraishi and Savageau (1992), in turn, developed a model based on the power law formalism. Both models appropriately describe the behavior of the system for a certain range of parametric conditions. However, none of those models account for the effect of Ca2+, which is of central importance to cardiac mitochondrial energetics.
A model of pancreatic β-cell mitochondrial metabolism by Magnus and Keizer (1997), which incorporates Ca2+ handling by mitochondria, involves three ordinary differential equations describing ΔΨm, Ca2+, and ADP concentrations as a function of time. This model takes into account the most important transport processes of the inner mitochondrial membrane, i.e., redox-driven proton pumps, the F1F0-ATPase, proton leak, the adenine nucleotide transporter, the Ca2+ uniporter, and the mitochondrial Na+/Ca2+ exchanger. Important limitations of this model are that it does not include stimulation of TCA cycle dehydrogenases by Ca2+ and that NADH is a fixed parameter (Magnus, 1995; Magnus and Keizer, 1997) instead of a variable (as in the present model). Nevertheless, in agreement with experimental data, the model behavior was able to reproduce the dependence of the rate of Ca2+ uptake by the uniporter on cytosolic Ca2+ concentration and predicts a sharp threshold for uptake at cytosolic Ca2+ concentrations of ∼0.4–0.5 μM (Magnus and Keizer, 1997).
An oxidative phosphorylation mathematical model has been developed by Korzeniewski (1996, 1998) and applied to the analysis of how the rate of ATP production by respiration is adjusted to meet energy demand during muscle contraction (Korzeniewski, 1998). As in previous cases, this model does not account for the coupling of OxPhos to the TCA cycle and thus no explicit dependence on Ca2+ by TCA cycle dehydrogenases was taken into account.
CONCLUSION
In summary, the integrated thermokinetic model constructed here reproduces the expected relationships among ΔΨm, VO2, NADH, and mitochondrial matrix Ca2+ accumulation under various conditions including simulated inhibition of respiratory chain complexes and/or adenine nucleotide translocase.
Based solely on simple bioenergetic principles, it is demonstrated that Ca2+ activation of the TCA cycle, NADH production, mitochondrial respiration, and ATP synthesis is possible when respiratory flux is mainly controlled by the Ca2+-sensitive KGDH. During changes in workload, under pull conditions, both respiratory control and stimulation by Ca2+ appear to be required to reproduce the temporal evolution of NADH in heart trabeculae. Under other parametric conditions, supplemental control mechanisms for oxidative phosphorylation may be necessary to account for experimental data. Increased ATP production by Ca2+ can only be achieved when the extent of stimulation of NADH production exceeds the energy-dissipating effect of Ca2+ influx on ΔΨm.
This comprehensive model of cardiac mitochondrial metabolism will permit testing of bioenergetic control hypotheses, provide a basis for further refinement of individual steps of oxidative phosphorylation and mitochondrial Ca2+ handling, and allow for future incorporation of other biochemical pathways.
GLOSSARY
- [ADP]m
Concentration of ADP in mitochondrial matrix
- [Ca2+]i
Ca2+ concentration in cytosolic compartment
- [Ca2+]m
Ca2+ concentration in mitochondrial matrix
- [NADH]
Concentration of NADH in mitochondrial matrix
- AF1
Phosphorylation potential
- Ares
Redox potential
- αKG
α-ketoglutarate
- ASP
Aspartate
- CIT
Citric acid
- F1F0-ATPase
Mitochondrial F1F0 ATP synthase activity
- FUM
Fumarate
- IDH
Isocitrate dehydrogenase
- ISOC
Isocitrate
- KGDH
α-ketoglutarate dehydrogenase
- MAL
Malate
- OAA
Oxalacetate
- SCoA
Succinyl CoA
- Suc
Succinate
- TCA
Cycle tricarboxylic acid cycle
- VAAT
Rate of aspartate amino transferase
- VACO
Rate of aconitase
- VANT
Rate of the adenine nucleotide translocator (ANT)
- VATPase
Rate of the F1F0 ATP synthase
- VC_ASP
Rate of Aspartate consumption
- VCS
Rate of citrate synthase
- VFH
Rate of fumarate hydratase
- VHe
Rate of H transport across the membrane driven by NADH oxidation
- VHe(F)
Rate of H transport across the membrane driven by FADH2 oxidation
- VHleak
H leak across the inner mitochondrial membrane
- VHu
Rate of H uptake by mitochondrial via F1FoATPase
- VIDH
Rate of isocitrate dehydrogenase
- VKGDH
Rate of alpha ketoglutarate dehydrogenase
- VMDH
Rate of malate dehydrogenase
- VNaCa
Rate of the mitochondrial Na+/Ca2+ antiporter
- VO2
Rate of oxygen consumption
- VSDH
Rate of succinate dehydrogenase
- VSL
Rate of succinate lyase
- Vuni
Rate of the Ca2+ uniporter in the mitochondrial membrane
- ΔΨm
Electrical potential across the mitochondrial inner membrane
- ΔμH
Proton motive force
SUPPLEMENTAL INFORMATION
An online Appendix of the Model of mitochondrial bioenergetics in cardiac myocytes can be found by visiting BJ online at http://www.biophysj.org.
Supplementary Material
Acknowledgments
The authors thank the collaboration of Minh N. Vo for assistance with the computational code.
Supported by National Institutes of Health grants R01HL54598 to Brian O'Rourke, R37H 36957 to Eduardo Marbán, and RO1 HL60133-01, P50 HL52307, The Whitaker Foundation, and the Falk Medical Trust to Raimond Winslow. Eduardo Marbán holds the Michael Mirowski, M.D. Professorship of Cardiology of the Johns Hopkins University.
APPENDIX
The model has three main components: mitochondrial matrix processes, oxidative phosphorylation, and Ca2+ dynamics.
The tricarboxylic acid (TCA) cycle
In the mitochondrial matrix, we have considered the dynamics of the TCA cycle that represents the end stage for carbon-chain metabolic substrates in the cell.
The TCA cycle in our model may be split into two pathways: the tricarboxylate (from oxalacetate, OAA, to α-ketoglutarate, αKG, via citrate, CIT) and the dicarboxylate (from αKG to OAA via succinate, Suc; see also Fig. 1) (Jafri et al., 2001). In the tricarboxylate pathway AcCoA and OAA react to produce αKG, NADH, and CO2. In turn, αKG serves as a substrate of the dicarboxylate pathway producing OAA that will resupply the first pathway. Alternatively, a shunt may directly lead from OAA into αKG through the aspartate amino transferase (AAT)-catalyzed reaction (Fig. 1).
The model includes detailed kinetics of the key regulatory enzymes of the TCA cycle with respect to their effectors such as Ca2+, Mg2+, ADP, NADH, and NAD+, as well as their carbon substrates (Dudycha, 2000; Jafri et al., 2001).
Unlike succinate dehydrogenase (SDH), aconitase, succinyl CoA lyase, and fumarate hydratase are considered to operate under near equilibrium conditions.
Citrate synthase (CS)
The first enzyme of the cycle is CS that catalyzes the condensation of OAA and AcCoA to give CIT. The kinetic rate law (Eq. 13) we used was modified from that derived by Dudycha (2000) based on data by Shepherd and Garland (1969):
 |
(13) |
Since the TCA cycle and the AAT shunt are closed from the point of view of carbon intermediates, a conservation equation relating all TCA metabolites is included in the model. Thus, the level of CIT is the result of the balance of all other intermediates in the cycle as follows:
 |
(14) |
with CKint as the total concentration of TCA cycle intermediates.
CS is studied as a function of the concentrations of its substrates, OAA and AcCoA, and displays saturating activity with respect to both (Fig. A1, A and B). Saturation is achieved at low concentrations of OAA. Low levels of this intermediate have been estimated from in vivo measurements and theory (Jeffrey et al., 1999). This result supports the operation of CS at high rate at low concentrations of its substrate OAA.
FIGURE A1.
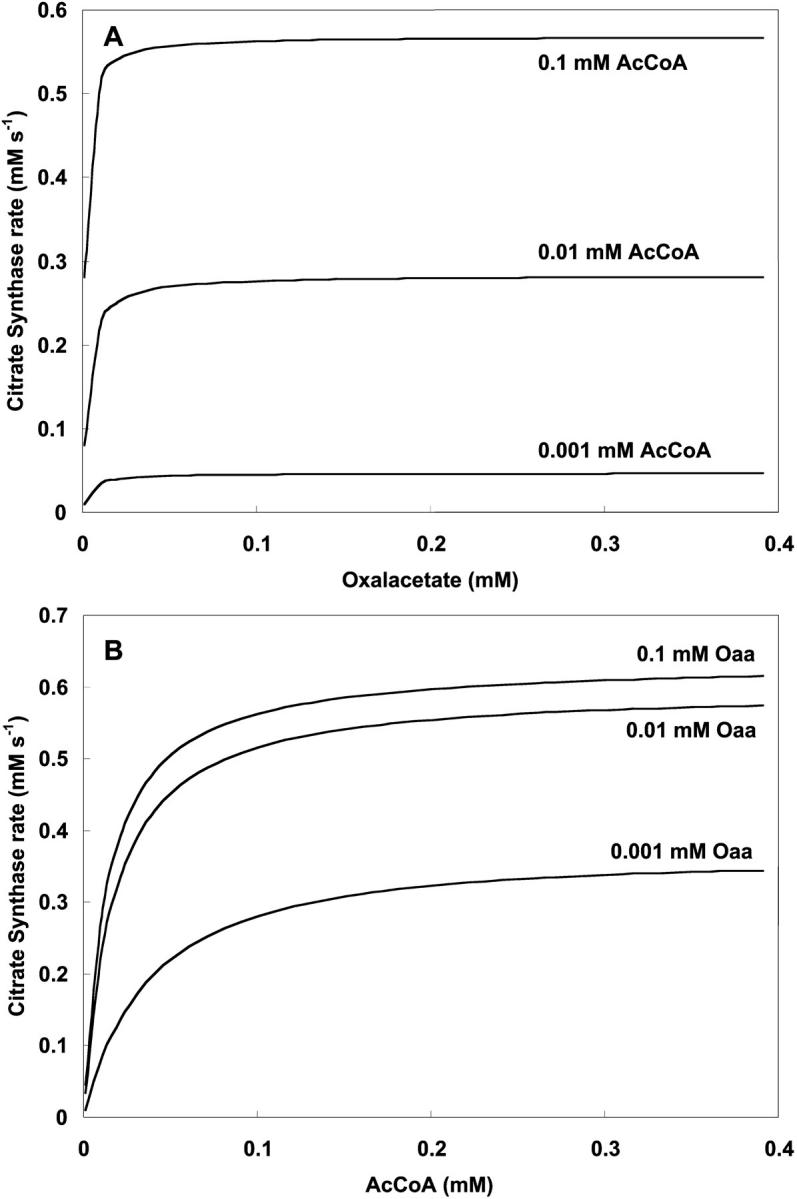
Dependence of citrate synthase activity on oxalacetate and AcCoA. (A) The rate of CS is plotted against oxaloacetate concentration with  s−1 at the specified AcCoA concentrations and parameter values according to Table 3 (see Eq. 13). (B) The same parameter set is used to study CS activity as a function of AcCoA at different oxalacetate concentrations.
Aconitase (ACO)
ACO is considered to be operating near equilibrium as reported data in the literature suggest (Jeffrey et al., 1999) (Eq. 15).
 |
(15) |
The kinetic expression of Eq. 15 is based on the law of mass action and assumes that the enzyme operates reversibly near equilibrium, characterized by an equilibrium constant, 
Isocitrate dehydrogenase (IDH)
IDH is one of the matrix dehydrogenases regulated by calcium. Additionally, IDH is activated by ADP and inhibited by its product, NADH (Fig. 1). Moreover, it shows a sigmoidal dependence on isocitrate, ISOC (Rutter and Denton, 1988).
 |
(16) |
IDH activity exhibits a modest response to Ca2+ in the concentration range described in vivo (Fig. A2, A). The rate of IDH is more sensitive to Ca2+ concentrations near saturation of the activity with respect to the substrate ISOC (Fig. A2, A). The quasi-exponential dependence of IDH with respect to NAD+ is due primarily to the strong inhibitory effect exerted by NADH on the enzymatic activity. Inasmuch as NAD+ and NADH are constrained by a conservation relationship, an increase in NAD+ implies a decrease in NADH and strong activation of enzyme activity as postulated (Fig. A2, B).
FIGURE A2.

Isocitrate dehydrogenase activity as a function of substrate and Ca2+ concentrations. (A) The rate of IDH is studied as a function of isocitrate and Ca2+ concentrations in the physiological range (see Eq. 16). The analysis was performed with the following parameter values: [NAD+] = 9.5 mM; [ADP]m = 2.0 mM;  mM;
mM;  s−1 and those described in Table 3. (B) The IDH dependence on NAD+ concentration is analyzed at different ADP concentrations with [ISOC] = 0.5 mM, and [Ca2+] = 0.5 μM. Otherwise the parameters used are as in A.
Alpha-ketoglutarate dehydrogenase (KGDH)
KGDH is another Ca2+-sensitive dehydrogenase participating in the TCA cycle. The rate expression for this enzyme was derived from Dudycha (2000) fitting data from Panov and Scarpa (1996). We have modified several of the parameters used by Dudycha (2000) to reproduce the experimental data from Rutter and Denton (1988).
 |
(17) |
Unlike IDH, KGDH shows a marked dependence on Ca2+ concentration in the physiological range (Fig. A3, A). This highlights one of the main conditions for the model to exhibit a maximal response to Ca2+ concentrations, KGDH needs to be the main rate-controlling step of respiratory flux. Also unlike IDH, the kinetics of KGDH are saturable with respect to NAD+, with the maximal activation by NAD+ depending on αKG levels (Fig. A3, B).
FIGURE A3.
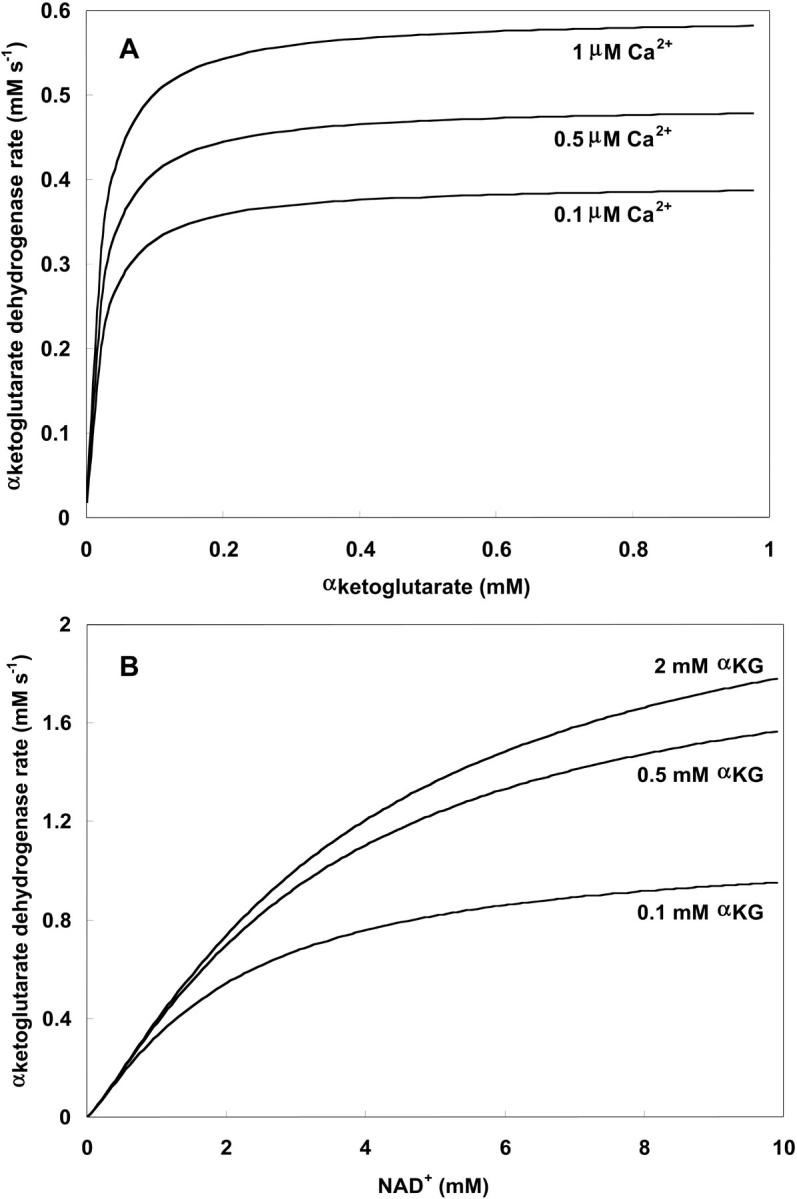
Alpha-ketoglutarate dehydrogenase dependence on α-ketoglutarate, NAD+, and Ca2+. (A) The set of parameters used in the analysis of the rate of KGDH (VKGDH) as a function of its substrate is as indicated in Table 3 (see also Eq. 17) with the following modifications:  mM;
mM;  s−1; [NAD+] = 1.0 mM; and [Mg2+] = 0.4 mM. (B) The analysis of the dependence of VKGDH on NAD+ concentration is performed with the following parameter values: [Mg2+] = 0.4 mM, and [Ca2+] = 0.1 μM. Otherwise the parameters used are as in A.
Succinyl CoA lyase (SL)
SL catalyzes the conversion of SCoA into Suc, involving the direct phosphorylation of GDP (Kadrmas et al., 1991). In our model we have assumed rapid equilibration of the GTP and ATP pools via a matrix nucleoside diphosphate kinase (Colomb et al., 1972). Thus, the rate equation for SL is ruled by the following expression, including mitochondrial ADP and ATP levels:
 |
(18) |
Succinate dehydrogenase (SDH)
SDH catalyzes the reduction of ubiquinone by succinate, coupled with the formation of fumarate and ubiquinol. It is the only enzyme of the TCA cycle which is bound to the inner membrane of mitochondria, directly linking the TCA cycle to the electron transport chain at complex II. The kinetic properties of SDH have been extensively studied (reviewed by Singer et al., 1973, and Hatefi and Stiggall, 1976). Its reaction rate is subject to inhibition by its product, FUM, and by OAA (Fig. 1; see also Singer et al., 1973; Hatefi and Stiggall, 1976). The rate expression is described by the following equation:
 |
(19) |
Fumarate hydratase (FH)
FH is considered to operate near equilibrium and the kinetic parameters are taken from Dudycha (2000) based on data from Teipel and Hill (1971). Its rate expression is as follows:
 |
(20) |
Malate dehydrogenase (MDH)
MDH is another highly regulated TCA cycle enzymatic activity. MDH is inhibited by its product, OAA, and modulated by pH (Dudycha, 2000). The parameters of the equation have been adjusted based on the data reported by Elduque and co-workers (1983).
 |
(21) |
with
 |
(22) |
and
 |
(23) |
Fig. A4 shows the MDH activity as a function of its substrate, malate (MAL), at different NAD+ concentrations. MDH displays typical Michaelis-Menten kinetics that saturate at high substrate concentrations, which are at least two orders of magnitude higher than the actual MAL levels determined in myocytes (Albe et al., 1990).
FIGURE A4.

Malate dehydrogenase activity as a function of substrate concentration. The dependence of MDH rate on its substrate malate is studied with the following parameter values:  mM,
mM,  s−1, and those shown in Table 3 (see also Eq. 21).
Aspartate amino transferase (AAT)
AAT activity constitutes a shunt linking directly OAA to αKG. This activity is considered to be working close to equilibrium in the presence of a large excess of glutamate, GLU (Eq. 24).
 |
(24) |
The aspartate (ASP) resulting from AAT activity is assumed to be consumed in a reaction that follows a mass action law with respect to its substrate ASP, as follows:
 |
(25) |
Differential Eqs. 3–11 are assembled from this group of processes in the model. The parameters of Eqs. 13–25 for this section of the model description are described in the module: TCA cycle in Table 3.
TABLE 3.
Model parameters: TCA cycle
| Symbol | Value | Units | Description | Eq. | Ref.* |
|---|---|---|---|---|---|
 |
3.2 | s−1 | Catalytic constant of CS | 13 | a |
 |
0.4 | mM | Concentration of CS | 13 | b |
 |
1.26 10−2 | mM | Michaelis constant for AcCoA | 13 | a |
 |
6.4 10−4 | mM | Michaelis constant for OAA | 13 | a |
| CKint | 1.0 | mM | Sum of TCA cycle intermediates' concentration | 14 | c |
 |
12.5 | s−1 | Forward rate constant of ACO | 15 | a |
 |
2.22 | Equilibrium constant of ACO | 15 | a | |
 |
1.94–16.3 | s−1 | Rate constant of IDH | 16 | a |
 |
0.109 | mM | Concentration of IDH | 16 | b |
 |
0.19 | mM | Inhibition constant by NADH | 16 | a |
 |
6.2 10−2 | mM | Activation constant by ADP | 16 | a |
| [H+] | 2.5 10−5 | mM | Matrix proton concentration | 16 | k |
| kh,1 | 8.1 10−5 | mM | Ionization constant of IDH | 16 | a |
| kh,2 | 5.98 10−5 | mM | Ionization constant of IDH | 16 | a |
 |
1.52 | mM | Michaelis constant for isocitrate | 16 | a |
 |
0.923 | mM | Michaelis constant for NAD+ | 16 | a |
 |
0.00141 | mM | Activation constant for Ca2+ | 16 | a |
 |
0.15–5.0 | s−1 | Rate constant of KGDH | 17 | a |
 |
0.5 | mM | Concentration of KGDH | 17 | f |
 |
1.94 | mM | Michaelis constant for αKG | 17 | a |
 |
38.7 | mM | Michaelis constant for NAD | 17 | a |
 |
0.0308 | mM | Activation constant for Mg2+ | 17 | a |
 |
1.27 10−3 | mM | Activation constant for Ca2+ | 17 | a |
| nαKG | 1.2 | Hill coefficient of KGDH for αKG | 17 | f | |
| Mg2+ | 0.4 | mM | Mg2+ concentration in mitochondria | 17 | d |
 |
0.127 | mM−1 s−1 | Forward rate constant of SL | 18 | f |
 |
3.115 | Equilibrium constant of the SL reaction | 18 | a | |
| [CoA] | 0.02 | mM | Coenzyme A concentration | 18 | b |
 |
1.0 | s−1 | Rate constant of SDH | 19 | f |
 |
0.5 | mM | SDH enzyme concentration | 19 | f |
 |
3.0 10−2 | mM | Michaelis constant for succinate | 19 | e |
 |
1.3 | mM | Inhibition constant by fumarate | 19 | e |
 |
0.15 | mM | Inhibition constant by oxalacetate | 19 | e |
 |
0.83 | s−1 | Forward rate constant for FH | 20 | a |
 |
1.0 | Equilibrium constant of FH | 20 | a | |
| kh1 | 1.1310−5 | mM | Ionization constant of MDH | 22 | j |
| kh2 | 26.7 | mM | Ionization constant of MDH | 22 | a |
| kh3 | 6.68 10−9 | mM | Ionization constant of MDH | 23 | j |
| kh4 | 5.62 10−6 | mM | Ionization constant of MDH | 23 | j |
| koffset | 3.99 10−2 | pH-independent term in the pH activation factor of MDH | 22 | a | |
 |
2.775 101 | s−1 | Rate constant of MDH | 21 | f |
 |
0.154 | mM | Total MDH enzyme concentration | 21 | b |
 |
1.493 | mM | Michaelis constant for malate | 21 | a |
 |
3.1 10−3 | mM | Inhibition constant for oxalacetate | 21 | a |
 |
0.2244 | mM | Michaelis constant for NAD+ | 21 | a |
 |
0.644 | s−1 | Forward rate constant of AAT | 24 | a |
 |
6.6 | Equilibrium constant of AAT | 24 | a | |
| KC_ASP | 0.01 | s−1 | First order rate constant of aspartate consumption | 25 | f |
| Model parameters: oxidative phosphorylation | |||||
| ra | 6.394 10−10 | s−1 | Sum of products of rate constants | 26,27 | g,h |
| rb | 1.762 10−13 | s−1 | Sum of products of rate constants | 27 | g,h |
| rc1 | 2.656 10−19 | s−1 | Sum of products of rate constants | 26 | g,h |
| rc2 | 8.632 10−27 | s−1 | Sum of products of rate constants | 26 | g,h |
| r1 | 2.077 10−18 | Sum of products of rate constants | 26,27 | g,h | |
| r2 | 1.728 10−9 | Sum of products of rate constants | 26,27 | g,h | |
| r3 | 1.059 10−26 | Sum of products of rate constants | 26,27 | g,h | |
| ρres | 0.0006–0.05 | mM | Concentration of electron carriers (respiratory complexes I-III-IV) | 26,27 | g,h |
| Kres | 1.35 1018 | Equilibrium constant of respiration | 28 | g,h | |
| ρres(F) | 0.0045 | mM | Concentration of electron carriers (respiratory complexes II-III-IV) | ||
| ΔΨB | 0.05 | V | Phase boundary potential | 26,27,31 | g,h |
| g | 0.85 | Correction factor for voltage | 26,27 | g,h | |
| Kres(F) | 5.765 1013 | Equilibrium constant of FADH2 oxidation | 29 | ||
| [FADH2] | 1.24 | mM | Concentration of FADH2 (reduced) | 29 | |
| [FAD] | 0.01 | mM | Concentration of FAD (oxidized) | 29 | |
| pa | 1.656 10−5 | s−1 | Sum of products of rate constants | 31,32 | g,h |
| pb | 3.373 10−7 | s−1 | Sum of products of rate constants | 32 | g,h |
| pc1 | 9.651 10−14 | s−1 | Sum of products of rate constants | 31 | g,h |
| pc2 | 4.585 10−14 | s−1 | Sum of products of rate constants | 31 | g,h |
| p1 | 1.346 10−8 | Sum of products of rate constants | 31,32 | g,h | |
| p2 | 7.739 10−7 | Sum of products of rate constants | 31,32 | g,h | |
| p3 | 6.65 10−15 | Sum of products of rate constants | 31,32 | g,h | |
| ρF1 | 0.06–1.8 | mM | Concentration of F1F0-ATPase | 31,32 | g,h |
| KF1 | 1.71 106 | Equilibrium constant of ATP hydrolysis | 33 | g,h | |
| R | 8.315 | V C mol−1 °K−1 | Gas constant | ||
| T | 310.16 | °K | Mammalian body temperature | ||
| F | 96480 | C mol−1 | Faraday constant | ||
| Pi | 20.0 | mM | Inorganic phosphate concentration | 33 | i |
| Cm | 15.0 | mM | Total sum of mito adenine nucleotides | 34 | d |
| VmaxANT | 0.05–24.0 | mM s−1 | Maximal rate of the ANT | 35 | g,h |
| h | 0.5 | Fraction of ΔΨm | 35 | g,h | |
| [ADP]i | 0.05–0.2 | mM | Cytoplasmic ADPi concentration | 35 | |
| [ATP]i | 6.5 | mM | Cytoplasmic ATPi concentration | 35 | d |
| gH | 0.01 | mM s−1 V−1 | Ionic conductance of the inner membrane | 36 | g,h |
| ΔpH | −0.6 | pH units | pH gradient across the inner membrane | 37 | k |
| CPN | 10.0 | mM | Total sum of mito pyridine nucleotides | 30 | b |
| Cmito | 1.812 | mM V−1 | Inner membrane capacitance | 2 | l,m |
| Model parameters: calcium dynamics | |||||
 |
0.625–1.25 | μM s−1 | Vmax uniport Ca2+ transport | 38 | g,h |
| [Ca2+]i | 2.0 10−2–1.2 | μM | Cytosolic Ca2+ concentration | 38 | i |
| ΔΨ° | 0.091 | Volts | Offset membrane potential | 38 | g,h |
| Kact | 3.8 10−4 | mM | Activation constant | 38 | g,h |
| Ktrans | 0.019 | mM | Kd for translocated Ca2+ | 38 | g,h |
| L | 110.0 | Keq for conformational transitions in uniporter | 38 | g,h | |
| na | 2.8 | Uniporter activation cooperativity | 38 | g,h | |
 |
0.005–0.2 | mM s−1 | Vmax of Na+/Ca2+ antiporter | 39 | g,h |
| b | 0.5 | ΔΨm dependence of Na+/Ca2+ antiporter | 39 | g,h | |
| KNa | 9.4 | mM | Antiporter Na+ constant | 39 | g,h |
| [Na+]i | 10.0 | mM | Cytosolic Na+ concentration | 39 | g,h |
| KCa | 3.75 10−4 | mM | Antiporter Ca2+ constant | 39 | g,h |
| n | 3 | Na+/Ca2+ antiporter cooperativity | 39 | g,h | |
| f | 0.0003 | Fraction of free [Ca2+]m | 12 | g,h |
References: a, Dudycha et al., 2000; b, Albe et al., 1990; c, calculated from Jeffrey et al., 1999; d, Corkey et al., 1986; e, Singer, 1966; f, adjusted; g, Magnus and Keizer, 1997; h, Magnus, 1995; i, Crompton, 1999; j, calculated from data of Emyanitoff and Kelly, 1982; k, Jung et al., 1989; l, Gunter and Pfeiffer, 1990; m, Wojtczak et al., 1986.
Oxidative phosphorylation
The respiration-driven proton pump
The main reaction steps described are the O2 consumption flux, VO2, and its linked proton efflux, VHe. The rate of these two processes depends on ΔμH and the redox potential as driving forces. Eqs. 26–28 describe the flow of electrons from NADH to O2 and its associated proton flux from the matrix to the intermembrane space in mitochondria (Magnus and Keizer, 1997). In adapting the Altman-King-Hill-based model of the respiration-driven proton pump for heart mitochondria, we have considered the electron flow from NADH oxidation to be incompletely coupled to the outward flow of protons, VHe as in Magnus (1995) and Magnus and Keizer (1997).
 |
(26) |
 |
(27) |
with
 |
(28) |
Another very important modification of the previous model is that we have replaced the dependence of the respiratory flux on ΔμH instead of just the electrical potential, ΔΨm. This is done so as not to ignore the transmembrane proton concentration gradient (ΔpH) component of the proton motive force (Eqs. 26, 27). Thus, we assume that most transitions between the six states in the proton pump model (Magnus, 1995; Magnus and Keizer, 1997) depend on both ΔΨm and ΔpH through ΔμH.
In a modification of the original formulation, we also consider the complex II electrons input by succinate (Suc) through FADH2 to the respiratory chain:
 |
 |
Keq in Eq. 29 reads as Kres(F):
 |
(29) |
The flux of protons driven by FADH2 oxidation (VHe(F)) has the same form as Eq. 27 except for adjustment of the redox potential (Eq. 29) and the H+ stoichiometry (four instead of six). A careful analysis reveals that the sensitivity of the overall O2 consumption with complex II is very low, which leads us to consider FADH2 as a parameter in our model.
Mitochondrial NAD+ is assumed to be conserved according to the following relation:
 |
(30) |
with CPN as the total concentration of pyrimidine nucleotides.
Oxygen consumption rate (VO2) is studied as a function of NADH and ΔΨm (Fig. A5). NADH exerts its influence on VO2 through the redox potential Ares (Eqs. 26, 28), with the shape of the curve depending on ΔΨm (Fig. A5, A); i.e., at high ΔΨm, the dependence of VO2 on NADH becomes shallower, as it becomes more difficult to pump protons against a high ΔμH. The decrease in VO2 at high ΔΨm is evident in Fig. A5, B. The midpoint of this flux-force relation is shifted to the left by an increase in the ΔpH component of ΔμH (Fig. A5, B). Around the midpoint, the relationship between VO2 and ΔΨm is almost linear, but outside this range the rate of respiration becomes independent of ΔΨm (Fig. A5, B).
FIGURE A5.

Dependence of the respiration rate, VO2, on redox potential, ΔΨm and ΔpH. The respiration rate is studied as a function of: (A) NADH concentration in the mitochondrial matrix with ΔpH = −0.4; ρres = 1.2 10−2 mM; and ΔΨm as indicated next to each curve (see Eq. 26); (B) ΔΨm at various ΔpH values as indicated and fixed NADH concentration (=0.1 mM). The other parameter values in Eq. 26 are as indicated in Table 3.
The F1F0-ATPase
The rate of the F1F0-ATPase from Magnus and Keizer (1997) was modified to account for reversibility (Eq. 31). A factor of 102 was introduced in the first term of Eq. 31 and the value of the sum of products of rate constants pc2 was increased with respect to the original value (Magnus and Keizer, 1997; see also Table 3, this article). These modifications together with the substitution of ΔΨm by ΔμH in Eqs. 31 and 32 allow reversibility of the H+ pump when ΔμH falls below a certain value or at very high phosphorylation potentials.
According to the concept of respiratory control (Chance and Williams, 1956), in state 3, mitochondrial function is governed by the availability of ADP and Pi. The chemiosmotic hypothesis dictates that ΔΨm is lowered by a H+ influx, which drives the production of ATP by the F1F0-ATPase. Escape from respiratory control results in higher O2 consumption, electron transfer, and substrate oxidation that is not coupled to phosphorylation of ADP, and a decrease in the P:O ratio (Mitchell, 1969).
 |
(31) |
 |
(32) |
with
 |
(33) |
Mitochondrial ATP, [ATP]m, is assumed to be conserved according to the following relation:
 |
(34) |
with Cm as the total sum of adenine nucleotides and [ADP]m as the mitochondrial ADP concentration.
The dependence of F1F0-ATPase rate on its substrate, ADP, is illustrated in Fig. A6, A. At low concentrations of ADPm (state 4 respiration), the thermodynamics of the pump favors ATP hydrolysis (shown by convention as a negative velocity) depending on ΔΨm (Eq. 2). An accumulation of ADPm tends to shift mitochondrial energetics toward state 3, and net ATP synthesis (positive velocity). Thus, the relationship between F1F0-ATPase activity and [ADP]m depends on ΔΨm; at higher ΔΨm, less [ADP]m is required for the F1F0-ATPase to achieve its maximal rate and the forward (synthetic) mode is favored (Fig. A6, A). Inasmuch as ΔμH is the actual driving force for ATP synthesis, the forward mode is enhanced at any given ΔΨm as ΔpH increases (Fig. A6, B).
FIGURE A6.

Dependence of F1F0-ATP synthase activity on ADPm, ΔΨm and ΔpH. The ATP synthetic (positive) or hydrolytic (negative) activity is plotted as a function of (A) ADPm concentration with ΔpH = −0.4, and ρF1 = 0.525 mM, at different ΔΨm as indicated (see Eq. 31); (B) ΔΨm at the indicated ΔpH values and a constant [ADP]m (=1.0 mM).
Adenine nucleotide translocator (ANT) and proton leak
To complete the description of the major membrane-OxPhos-associated processes, the exchange of adenine nucleotides across the mitochondrial membrane as well as a proton leak, are considered (Fig. 1).
The ANT is modeled according to a sequential mechanism of the carrier (Magnus and Keizer, 1997; Bohnensack, 1982). Oppositely oriented sites bind either ATP4− or ADP3−, and both sites must be filled before the protein isomerization causes a ligand exchange across the inner membrane. VANT, the flux of ANT-mediated exchange between cytosolic ADP (ADPi) and matrix ATP (ATPm) (Eq. 35) is considered to be electrogenic and dependent on the gradients of both ATP and ADP across the inner mitochondrial membrane as follows:
 |
(35) |
The numbers (i.e., 0.45, 0.05, and 0.8) preceding [ATP]i,m and [ADP]i,m account for the nucleotides concentration in the correct ionization form that bind to their site in the ANT. An explicit expression of this equation, in terms of the ionic species participating in the translocation, is available in Magnus and Keizer (1997; see their Eq. 16 and Table 4).
The parameter h accounts for the fraction of ΔΨm responsible for the large increase in the Michaelis-Menten constant for ATP uptake by energized mitochondria (Magnus and Keizer, 1997). The maximum rate for ADPi:ADPm exchange in the absence of ATP is given by VmaxANT.
The H+ leakage is considered to be a linear function of the ΔμH through a proportionality constant given by the H+ conductance, gH. Although the actual relationship is roughly exponential (Brown and Brand, 1986) there is an extensive linear region, especially at high ΔΨm values, which justifies simplification of the rate equation, described as follows:
 |
(36) |
with
 |
(37) |
The parameters of Eqs. 26–37 for this section of the model are described in the module: Oxidative phosphorylation in Table 3. Ordinary differential Eqs. 1–3 are the ones that can be assembled from this section (Table 1).
Mitochondrial calcium dynamics
The Ca2+ uniporter
The mitochondrial Ca2+ uniporter was modeled in Magnus and Keizer (1997) and depends on the electrochemical driving force for Ca2+. Thus, ΔΨm and cytoplasmic Ca2+ concentration ([Ca2+]i) are the primary determinants of the uniporter velocity as follows:
 |
(38) |
This equation produces current-voltage curves that fit most available electrophysiological data (Wingrove et al., 1984; Gunter and Pfeiffer, 1990; Gunter and Gunter, 1994; see also electronic Appendix: http://www.jhmi.edu/bor/model.htm).
The Na+/Ca2+ exchanger
The expression for the Na+/Ca2+ antiporter was modified from Magnus and Keizer (1997). Available experimental evidence indicates that the antiporter is able to sense both [Ca2+]m and [Ca2+]i based on the reversal of its activity under pathological conditions (Griffiths et al., 1998). Under ischemic conditions the Na+/Ca2+ antiporter may import Ca2 while extruding Na+. Extrusion of Ca2+ from the matrix is favored under normal conditions. Thus, our rate expression accounts for Na+/Ca2+ antiporter dependence on the Ca2+ gradient across the inner mitochondrial membrane (Eq. 39).
 |
(39) |
The rate of the Na+/Ca2+ antiporter, VNaCa, displays an exponential behavior as a function of [Ca2+]m. As a result of the assumption of electrogenicity, VNaCa exhibits a steeper dependence on [Ca2+]m at high than at low ΔΨm (Fig. A7, A).
FIGURE A7.

Rate of the mitochondrial Na+/Ca2+ antiporter and Ca2+ uniporter. In A the rate of the Na+/Ca2+ antiporter, VNaCa, is analyzed for its dependence on [Ca2+]m at different ΔΨm with the following parameter values: [Ca2+]i = 0.2 μM,  = 0.051 mM s−1 (see Eq. 39). B shows the dependence of Ca2+ uniporter as a function of the [Ca2+]i at various ΔΨm with
  mM s−1. The remainder of the parameters involved in Eqs. 38 and 39 are described in Table 3.
The flux through the Ca2+ uniporter, Vuni, increases exponentially with ΔΨm and the concentration of cytoplasmic Ca2+, in the physiological range (Fig. A7, B). Clearly, the ability of the mitochondria for Ca2+ uptake increases with the energization of the inner membrane as reflected by ΔΨm.
Unit conversions
We have expressed all concentrations in millimolar (mM) units. For heart cells, the mitochondrial protein density is ∼125 mg protein/ml (Randle and Tubbs, 1979). Because heart cells are compartmentalized into 58.5% and 36% cytosolic and mitochondrial volumes, respectively (Page, 1978; Katz, 1992) a factor of 0.125 converts measured nanomoles per milligram mitochondrial protein (nmol mg−1 protein) to mitochondrial mM terms.
Several of the parameters shown in Table 3 were taken from Magnus and Keizer (1997). We have converted their parameter values, usually expressed in nmol mg−1 protein, to mM by the conversion factor referred above.
References
- Ainscow, E. K., and M. D. Brand. 1999. Top-down control analysis of ATP turnover, glycolysis and oxidative phosphorylation in rat hepatocytes. Eur. J. Biochem. 263:671–685. [DOI] [PubMed] [Google Scholar]
- Albe, K. R., M. H. Butler, and B. E. Wright. 1990. Cellular concentrations of enzymes and their substrates. J. Theor. Biol. 143:163–195. [DOI] [PubMed] [Google Scholar]
- Baysal, K., D. W. Jung, K. K. Gunter, T. E. Gunter, and G. P. Brierley. 1994. Na+-dependent Ca2+efflux mechanism of heart mitochondria is not a passive Ca2+/2Na+ exchanger. Am. J. Physiol. 266:C800–C808. [DOI] [PubMed] [Google Scholar]
- Bohnensack, R. 1982. The role of the adenine nucleotide translocator in oxidative phosphorylation. A theoretical investigation on the basis of a comprehensive rate law of the translocator. J. Bioenerg. Biomem. 14:45–61. [DOI] [PubMed] [Google Scholar]
- Borutaite, V., V. Mildaziene, G. C. Brown, and M. D. Brand. 1995. Control and kinetic analysis of ischemia-damaged heart mitochondria: which parts of the oxidative phosphorylation system are affected by ischemia. Biochim. Biophys. Acta. 1272:154–158. [DOI] [PubMed] [Google Scholar]
- Brand, M. A., and A. Kesseler. 1995. Control analysis of energy metabolism in mitochondria. Biochem. Soc. Trans. 23:371–376. [DOI] [PubMed] [Google Scholar]
- Brandes, R., and D. M. Bers. 1997. Intracellular Ca2+ increases the mitochondrial NADH concentration during elevated work in intact cardiac muscle. Circ. Res. 80:82–87. [DOI] [PubMed] [Google Scholar]
- Brandes, R., and D. M. Bers. 2002. Simultaneous measurements of mitochondrial NADH and Ca2+ during increased work in intact rat heart trabeculae. Biophys. J. 83:587–604. [DOI] [PMC free article] [PubMed] [Google Scholar]
- Brown, G. C., and M. D. Brand. 1986. Changes in permeability to protons and other cations at high proton motive force in rat liver mitochondria. Biochem. J. 234:75–81. [DOI] [PMC free article] [PubMed] [Google Scholar]
- Brown, G. C., P. L. Lakin-Thomas, and M. D. Brand. 1990. Control of respiration and oxidative phosphorylation in isolated rat liver cells. Eur. J. Biochem. 192:355–362. [DOI] [PubMed] [Google Scholar]
- Chance, B., and G. R. Williams. 1956. The respiratory chain and oxidative phosphorylation. Adv. Enzymol. 17:65–134. [DOI] [PubMed] [Google Scholar]
- Chance, E. M., S. H. Seeholzer, K. Kobayashi, and J. R. Williamson. 1983. Mathematical analysis of isotope labeling in the citric acid cycle with applications to 13C NMR studies in perfused rat hearts. J. Biol. Chem. 258:13785–13794. [PubMed] [Google Scholar]
- Collins, T. J., P. Lipp, M. J. Berridge, and M. D. Bootman. 2001. Mitochondrial Ca2+ uptake depends on the spatial and temporal profile of cytosolic Ca2+ signals. J. Biol. Chem. 276:26411–26420. [DOI] [PubMed] [Google Scholar]
- Colomb, M. G., A. Chéruy, and P. V. Vignais. 1972. Nucleoside diphosphokinase from beef heart cytosol. I. Physical and kinetic properties. Biochemistry. 11:3370–3378. [DOI] [PubMed] [Google Scholar]
- Corkey, B. E., J. Duszynski, T. L. Rich, B. Matschinsky, and J. R. Williamson. 1986. Regulation of free and bound magnesium in rat hepatocytes and isolated mitochondria. J. Biol. Chem. 261:2567–2574. [PubMed] [Google Scholar]
- Crompton, M. 1999. The mitochondrial permeability transition pore and its role in cell death. Biochem. J. 341:233–249. [PMC free article] [PubMed] [Google Scholar]
- Davey, G. P., and J. B. Clark. 1996. Threshold effects and control of oxidative phosphorylation in non-synaptic rat brain mitochondria. J. Neurochem. 66:1617–1624. [DOI] [PubMed] [Google Scholar]
- Duchen, M. R., A. Leyssens, and M. Crompton. 1998. Transient mitochondrial depolarizations reflect focal sarcoplasmic reticular calcium release in single rat cardiomyocytes. J. Cell Biol. 142:975–988. [DOI] [PMC free article] [PubMed] [Google Scholar]
- Dudycha, S. 2000. A detailed model of the tricarboxylic acid cycle in heart cells. Johns Hopkins University. (Masters Dissertation.)
- Elduque, A., A. Cortes, and J. Bozal. 1983. Kinetic mechanism of the molecular forms of chicken liver mitochondrial malate dehydrogenase. Int. J. Biochem. 15:539–545. [DOI] [PubMed] [Google Scholar]
- Emyanitoff, R. G., and P. J. Kelly. 1982. Kinetic characterization of mitochondrial malate dehydrogenase from Dictyostelium discoideum. J. Gen. Microbiol. 128:1767–1771. [DOI] [PubMed] [Google Scholar]
- Griffiths, E. J., C. J. Ocampo, J. S. Savage, G. A. Rutter, R. G. Hansford, M. D. Stern, and H. S. Silverman. 1998. Mitochondrial calcium transporting pathways during hypoxia and reoxygenation in single rat cardiomyocytes. Cardiovasc. Res. 39:423–433. [DOI] [PubMed] [Google Scholar]
- Groen, A. K., R. J. Wanders, H. V. Westerhoff, R. van der Meer, and J. M. Tager. 1982. Quantification of the contribution of various steps to the control of mitochondrial respiration. J. Biol. Chem. 257:2754–2757. [PubMed] [Google Scholar]
- Gunter, T. E., and D. R. Pfeiffer. 1990. Mechanisms by which mitochondria transport calcium. Am. J. Physiol. 258:C755–C786. [DOI] [PubMed] [Google Scholar]
- Gunter, K. K., and T. E. Gunter. 1994. Transport of calcium by mitochondria. J. Bioenerg. Biomemb. 26:471–485. [DOI] [PubMed] [Google Scholar]
- Hafner, R. P., G. C. Brown, and M. D. Brand. 1990. Analysis of the control of respiration rate, phosphorylation rate, proton leak rate and proton motive force in isolated mitochondria using the 'top-down' approach of metabolic control theory. Eur. J. Biochem. 188:313–319. [DOI] [PubMed] [Google Scholar]
- Hansford, R. G., and D. Zorov. 1998. Role of mitochondrial calcium transport in the control of substrate oxidation. Mol. Cell. Biochem. 184:359–369. [PubMed] [Google Scholar]
- Harris, D. A., and A. M. Das. 1991. Control of mitochondrial ATP synthesis in the heart. Biochem. J. 280:561–573. [DOI] [PMC free article] [PubMed] [Google Scholar]
- Hatefi, Y., and D. L. Stiggall. 1976. Metal-containing flavoprotein dehydrogenases. Meth. Enzymol. XIII:222–255. [Google Scholar]
- Heineman, F. W., and R. S. Balaban. 1990. Control of mitochondrial respiration in the heart in vivo. Annu. Rev. Physiol. 52:523–542. [DOI] [PubMed] [Google Scholar]
- Jafri, M. S., S. J. Dudycha, and B. O'Rourke. 2001. Cardiac energy metabolism: models of cellular respiration. Annu. Rev. Biomed. Eng. 3:57–81. [DOI] [PubMed] [Google Scholar]
- Jeffrey, F. M., A. Reshetov, C. J. Storey, R. A. Carvalho, A. D. Sherry, and C. R. Malloy. 1999. Use of a single 13C NMR resonance of glutamate for measuring oxygen consumption in tissue. Am. J. Physiol. 277:E1111–E1121. [DOI] [PubMed] [Google Scholar]
- Jung, D. W., M. H. Davis, and G. P. Brierley. 1989. Estimation of matrix pH in isolated heart mitochondria using a fluorescent probe. Anal. Biochem. 178:348–354. [DOI] [PubMed] [Google Scholar]
- Kadrmas, E. F., P. D. Ray, and D. O. Lambeth. 1991. Apparent ATP-linked succinate thiokinase activity and its relationship to nucleoside diphosphate kinase in mitochondrial matrix preparations from rabbit. Biochim. Biophys. Acta. 1074:339–346. [DOI] [PubMed] [Google Scholar]
- Katz, A. M. 1992. Structure of the heart and cardiac muscle. In Physiology of the Heart, 2nd Ed. Raven Press, Raven, New York.
- Kohn, M. C., and D. Garfinkel. 1979. Computer simulation of metabolism in pyruvate-perfused rat heart. I. Model construction. Am. J. Physiol. 237:R153–R158. [DOI] [PubMed] [Google Scholar]
- Kohn, M. C., and D. Garfinkel. 1983. Computer simulation of metabolism in palmitate-perfused rat heart. I. Palmitate oxidation. Ann. Biomed. Engin. 11:361–384. [DOI] [PubMed] [Google Scholar]
- Korzeniewski, B. 1996. Simulation of oxidative phosphorylation in hepatocytes. Biophys. Chem. 58:215–224. [DOI] [PubMed] [Google Scholar]
- Korzeniewski, B. 1998. Regulation of ATP supply during muscle contraction: theoretical studies. Biochem. J. 330:1189–1195. [DOI] [PMC free article] [PubMed] [Google Scholar]
- Magnus, G. 1995. A mitochondria-based model for bursting and its D-glucose dependence in the pancreatic beta cell. University of California, Davis. (PhD Dissertation.)
- Magnus, G., and J. Keizer. 1997. Minimal model of β-cell mitochondrial Ca2+ handling. Am. J. Physiol. 273. Cell Physiol. 42:C717–C733. [DOI] [PubMed] [Google Scholar]
- McCormack, J. G., and R. M. Denton. 1984. Role of Ca2+ ions in the regulation of intramitochondrial metabolism in rat heart. Evidence from studies with isolated mitochondria that adrenaline activates the pyruvate dehydrogenase and 2-oxoglutarate dehydrogenase complexes by increasing the intramitochondrial concentration of Ca2+. Biochem. J. 218:235–247. [DOI] [PMC free article] [PubMed] [Google Scholar]
- McCormack, J. G., A. P. Halestrap, and R. M. Denton. 1990. Role of calcium ions in regulation of mammalian intramitochondrial metabolism. Physiol. Rev. 70:391–425. [DOI] [PubMed] [Google Scholar]
- Mitchell, P. 1961. Coupling of phosphorylation to electron and hydrogen transfer by a chemiosmotic type of mechanism. Nature. 191:144–148. [DOI] [PubMed] [Google Scholar]
- Mitchell, P. 1969. Chemiosmotic coupling and energy transduction. In Theoretical and Experimental Biophysics—A Series of Advances. A. Cole, editor. Dekker, New York. 159–216.
- Miyata, H., H. S. Silverman, S. J. Sollott, E. G. Lakatta, M. D. Stern, and R. G. Hansford. 1991. Measurement of mitochondrial free Ca2+ concentration in living single rat cardiac myocytes. Am. J. Physiol. 261:H1123–H1134. [DOI] [PubMed] [Google Scholar]
- Murphy, M. P. 2001. How understanding the control of energy metabolism can help investigation of mitochondrial dysfunction, regulation and pharmacology. Biochim. Biophys. Acta. 1504:1–11. [DOI] [PubMed] [Google Scholar]
- Nichols, B. J., M. Rigoulet, and R. M. Denton. 1994. Comparison of the effects of Ca2+, adenine nucleotides and pH on the kinetic properties of mitochondrial NAD(+)-isocitrate dehydrogenase from the yeast Saccharomyces cerevisiae and rat heart. Biochem. J. 303:461–465. [DOI] [PMC free article] [PubMed] [Google Scholar]
- Page, E. 1978. Quantitative ultrastructural analysis in cardiac membrane physiology. Am. J. Physiol. 63:C147–C158. [DOI] [PubMed] [Google Scholar]
- Panov, A., and A. Scarpa. 1996. Independent modulation of the activity of alpha-ketoglutarate dehydrogenase complex by Ca2+ and Mg2+. Biochemistry. 35:427–432. [DOI] [PubMed] [Google Scholar]
- Pietrobon, D., and S. R. Caplan. 1985. Flow-force relationships for a six-state proton pump model: intrinsic uncoupling, kinetic equivalence of input and output forces, and domain of approximate linearity. Biochemistry. 24:5764–5776. [DOI] [PubMed] [Google Scholar]
- Randle, P. J., and P. K. Tubbs. 1979. Carbohydrate and fatty acid metabolism. In Handbook of Physiology. R. M. Berne, N. Sperelakis, and R. Geiger, editors. American Physiological Society, Bethesda, Maryland. pp. 805–844.
- Rizzuto, R., P. Pinton, W. Carrington, F. S. Fay, K. E. Fogarty, L. M. Lifshitz, R. A. Tuft, and T. Pozzan. 1998. Close contacts with the endoplasmic reticulum as determinants of mitochondrial Ca2+ responses. Science. 280:1763–1766. [DOI] [PubMed] [Google Scholar]
- Rossignol, R., M. Malgat, J. P. Mazat, and T. Letellier. 1999. Threshold effect and tissue specificity. Implication for mitochondrial cytopathies. J. Biol. Chem. 274:33426–33432. [DOI] [PubMed] [Google Scholar]
- Rutter, G. A., and R. M. Denton. 1988. Regulation of NAD+-linked isocitrate dehydrogenase and 2-oxoglutarate dehydrogenase by Ca2+ ions within toluene-permeabilised rat heart mitochondria. Interactions with regulation by adenine nucleotides and NADH/NAD+ ratios. Biochem. J. 252:181–189. [DOI] [PMC free article] [PubMed] [Google Scholar]
- Saks, V., P. Dos Santos, F. N. Gellerich, and P. Diolez. 1998. Quantitative studies of enzyme-substrate compartmentation, functional coupling and metabolic channelling in muscle cells. Mol. Cell. Biochem. 184:291–307. [PubMed] [Google Scholar]
- Saks, V. A., T. Kaambre, P. Sikk, M. Eimre, E. Orlova, K. Paju, A. Piirsoo, F. Appaix, L. Kay, V. Regitz-Zagrosek, E. Fleck, and E. Seppet. 2001. Intracellular energetic units in red muscle cells. Biochem. J. 356:643–657. [DOI] [PMC free article] [PubMed] [Google Scholar]
- Shepherd, D., and P. B. Garland. 1969. The kinetic properties of citrate synthase from rat liver mitochondria. Biochem. J. 114:597–610. [DOI] [PMC free article] [PubMed] [Google Scholar]
- Shiraishi, F., and M. A. Savageau. 1992. The tricarboxylic acid cycle in Dictyostelium discoideum. IV. Resolution of discrepancies between alternative methods of analysis. J. Biol. Chem. 267:22934–22943. [PubMed] [Google Scholar]
- Singer, T. P., E. B. Kearney, and W. C. Kenney. 1973. Succinate dehydrogenase. Adv. Enzymol. Rel. Ar. Mol. Biol. 37:189–272. [DOI] [PubMed] [Google Scholar]
- Taylor, R. W., K. Birch-Machin, S. A. Bartlett, D. M. Lowerson, and D. M. Turnbull. 1994. The control of mitochondrial oxidations by complex III in rat muscle and liver mitochondria. J. Biol. Chem. 269:3523–3528. [PubMed] [Google Scholar]
- Teipel, J. W., and R. L. Hill. 1971. The subunit interactions of fumarase. J. Biol. Chem. 246:4859–4865. [PubMed] [Google Scholar]
- Territo, P. R., V. K. Mootha, S. A. French, and R. S. Balaban. 2000. Ca2+ activation of heart mitochondrial oxidative phosphorylation: role of the F0/F1-ATPase. Am. J. Physiol. Cell Physiol. 278:C423–C435. [DOI] [PubMed] [Google Scholar]
- Territo, P. R., S. A. French, and R. S. Balaban. 2001. Simulation of cardiac work transitions, in vitro: effects of simultaneous Ca2+ and ATPase additions on isolated porcine heart mitochondria. Cell Calcium. 30:19–27. [DOI] [PubMed] [Google Scholar]
- Tran-Dinh, S., F. Beganton, T. T. Nguyen, F. Bouet, and M. Herve. 1996. Mathematical model for evaluating the Krebs cycle flux with non-constant glutamate-pool size by 13C-NMR spectroscopy. Evidence for the existence of two types of Krebs cycles in cells. Eur. J. Biochem. 242:220–227. [DOI] [PubMed] [Google Scholar]
- Weiss, R. G., S. T. Gloth, R. Kalil-Filho, V. P. Chacko, M. D. Stern, and G. Gerstenblith. 1992. Indexing tricarboxylic acid cycle flux in intact hearts by carbon-13 nuclear magnetic resonance. Circ. Res. 70:392–408. [DOI] [PubMed] [Google Scholar]
- Weiss, R. G., R. Kalil-Filho, A. Herskowitz, V. P. Chacko, M. Litt, M. D. Stern, and G. Gerstenblith. 1993. Tricarboxylic acid cycle activity in postischemic rat hearts. Circulation. 87:270–282. [DOI] [PubMed] [Google Scholar]
- Williamson, J. R., C. Ford, J. Illingworth, and B. Safer. 1976. Coordination of citric acid cycle activity with electron transport flux. Circ. Res. 38:I-39–I-51. [PubMed] [Google Scholar]
- Wingrove, D., J. Amatruda, and T. Gunter. 1984. Glucagon effects on the membrane potential and calcium uptake rate of rat liver mitochondria. J. Biol. Chem. 259:9390–9394. [PubMed] [Google Scholar]
- Wojtczak, L., A. Żołkiweska, and J. Duszýnski. 1986. Energy-storage capacity of the mitochondrial proton-motive force. Biochim. Biophys. Acta. 851:313–321. [DOI] [PubMed] [Google Scholar]
- Wright, B. E., M. H. Butler, and K. R. Albe. 1992. Systems analysis of the tricarboxylic acid cycle in Dictyostelium discoideum. I. The basis for model construction. J. Biol. Chem. 267:3101–3105. [PubMed] [Google Scholar]
- Yu, X., N. M. Alpert, and E. D. Lewandowski. 1997. Modeling enrichment kinetics from dynamic 13C-NMR spectra: theoretical analysis and practical considerations. Am. J. Physiol. 272:C2037–C2048. [DOI] [PubMed] [Google Scholar]
Associated Data
This section collects any data citations, data availability statements, or supplementary materials included in this article.