

Abstract
In Lepidoptera (butterflies and moths), the genomic region around the gene cortex is a “hotspot” locus, repeatedly implicated in generating intraspecific melanic wing color polymorphisms across 100 million years of evolution. However, the identity of the effector gene regulating melanic wing color within this locus remains unknown. We show that none of the four candidate protein-coding genes within this locus, including cortex, serve as major effectors. Instead, a microRNA (miRNA), mir-193, serves as the major effector across three deeply diverged lineages of butterflies, and its role is conserved in Drosophila. In Lepidoptera, mir-193 is derived from a gigantic primary long noncoding RNA, ivory, and it functions by directly repressing multiple pigmentation genes. We show that a miRNA can drive repeated instances of adaptive evolution in animals.
Hotspot loci are genomic regions that are repeatedly implicated in producing similar phenotypic variation in unrelated lineages (1). In Lepidoptera (butterflies and moths), a handful of hotspot loci have been found to control intraspecific polymorphisms in wing color patterns (2–14). One of the most intensively studied loci is a genomic region containing the protein-coding gene cortex, associated with melanic (black and white; dark and bright) wing color pattern variations. This locus has been repeatedly involved in generating adaptive wing pattern polymorphisms across a 100-million-year evolutionary history, including the textbook example of industrial melanism of the peppered moth Biston betularia, the iconic mimetic radiation of Heliconius butterflies, and the leaf wing polymorphism of oakleaf butterflies Kallima inachus, among others (2, 3, 5, 7, 14, 15).
In previous studies, the protein-coding gene cortex was considered to be the major effector of this locus. However, in most cases, the spatial expression of cortex did not prepattern black or dark colors on developing wings (2, 16, 17). Functional studies using CRISPR-Cas9 suggested that cortex might promote wing melanization. These studies, however, suffered from low success rates (2, 14, 16, 18), hinting that hidden genomic features next to cortex, rather than cortex itself, could be causative. Although previous investigations exclusively focused on protein-coding genes, noncoding RNAs were ignored despite the presence of two micro-RNAs (miRNAs) at this locus (19). MiRNAs are small (20 to 22 nucleotides) noncoding RNAs that are processed from long transcripts, mostly from intronic regions (20). MiRNAs are well-known post transcriptional gene regulators but are largely understudied in the genetics of morphological diversification (Fig. 1A) (21). We aimed to test whether miRNAs present in the cortex locus are the actual effectors.
Fig. 1. mir-193 is the major melanic color regulator in the cortex locus.

(A) Biogenesis and silencing machinery of miRNAs. (B) Disrupting Drosha or Dicer processing sites using CRISPR-Cas9 inhibits the biogenesis of mature miRNAs. (C) The core cortex locus in B. anynana showing two highly conserved miRNAs and four candidate protein-coding genes. (D) Homozygous mutant lines of mir-193 and mir-2788 in B. anynana and their corresponding genotypes. A dotted line denotes the cutting site. (E) Expression levels of the guide strand of mir-193, miR-193-3p, and the two mature strands of mir-2788, across the corresponding mutant lines and wild type. n = 3 to 4 replicates; ns, not significant; *P < 0.05; **P < 0.01; ***P < 0.001. Expression levels with the same letter are not significantly different from each other. Error bar, SEM. (F) Phylogenetic placement of the three model butterfly species in the tree of lepidopterans previously mapped to the cortex locus. Phylogeny is from (40). Mosaic knockouts (mKOs) of mir-193 in (G) Pieris canidia and (H) Papilio polytes. Images were horizontally flipped when necessary.
A noncoding RNA mir-193, but not cortex, is the effector of the cortex locus
We began by screening the entire cortex locus (2-Mb genomic region flanking cortex) for the presence of any miRNAs in Bicyclus anynana, a model species that exhibits a comprehensive annotation of miRNAs expressed throughout wing development (22). Two miRNAs, mir-193 and mir-2788, were found ~5.2 kb apart in the intergenic region between protein-coding genes cortex and poly(A)-specific ribonuclease (parn) (Fig. 1C). Phylogenetic analyses showed that mir-193 is deeply conserved across the animal kingdom whereas mir-2788 is conserved in Arthropoda (23–25) (fig. S1).
To elucidate the functions of both miRNAs, we performed embryonic CRISPR-Cas9–mediated knockout experiments in B. anynana. Single guide RNAs (sgRNAs) were designed to disrupt the essential Drosha or Dicer processing sites in the miRNA biogenesis pathway to effectively block the biogenesis of mature miRNAs (Fig. 1, A and B, fig. S2, and table S1) (26). F0 mosaic knock out (mKO) mutants exhibited similar phenotypes for the two miRNAs but at different frequencies. For mir-193, 74 to 83% of the mKO mutants showed reduced melanin levels across all body parts covered with scale cells such as wings, antenna, legs, and abdomen (fig. S3 and table S2). Variations in wing color were observed across individuals and sexes (fig. S3). Many of the mKO mutants could not fly. For mir-2788, similar color phenotypes were observed but only 0 to 8% of the adults showed wing color changes, and no flight defects were observed (fig. S4 and table S2). Genotyping of mKO mutants through next generation sequencing suggested that various mir-193 mKO phenotypes are likely the result of different, short, on-target mutant alleles, whereas the rare phenotypes observed in the mir-2788 mKO mutants are likely the result of long, off-target adjacent disruptions, probably in mir-193 (see supplementary text, figs. S5 and S6, and table S3).
To draw a direct genotype-phenotype association, we crossed the F0 mKO mutants and generated homozygous mutant lines with short deletions for both miRNAs (see Materials and Methods, Fig. 1D, and fig. S7). For mir-193 we generated four mutant lines with a 4-bp (base pair) (m5), 6-bp (m4), 19-bp (m2), and 24-bp (m1) deletions around the mir-193 5′ Drosha processing site (Fig. 1D). A phenotypic series was observed in which m1, m2, and m4, with 6-to 24-bp deletions, showed almost equivalent light brown wing color, with “black disk” eyespot wing color patterns turning white (Fig. 1D and fig. S7). Homozygotes of these lines could not fly. Homozygotes of m5, with a shorter 4-bp deletion, showed milder phenotypes. They had slightly darker wing colors, black “black disks”, and were able to fly (Fig. 1D and fig. S7). Heterozygotes of all four mutant lines were visibly similar to the wild type in both color and behavior, indicating the recessive nature of these alleles. Quantification of the level of the guide strand of mir-193, miR-193-3p, using quantitative polymerase chain reaction (qPCR) across mutants and wild-type (WT) pupal wings indicated that increasing levels of miR-193-3p correlated with darker wing colors across three phenotype groups, m1/2/4, m5, and the wild type, suggesting a potential dose-dependent effect of mir-193 in wing melanization (Fig. 1E and table S4). For mir-2788, one mutant line was generated with a 14-bp deletion around the 5′ Drosha processing site (Fig. 1D). No visible phenotypic changes were observed in both mutant heterozygotes and homozygotes, although both mature miRNA strands in the mutant line were depleted (Fig. 1, D to E, fig. S7, and table S4). This indicates that mir-193, but not mir-2788, promotes melanic wing color in B. anynana.
Four protein coding genes within the hotspot cortex locus—cortex, parn, lemur tyrosine kinase (LMTK), and washout (wash)—were previously proposed to be potential color regulators in Heliconius butterflies (16, 27, 28). We asked whether these genes might also act as effectors within the locus. We generated mKO mutants of these genes using CRSPR-Cas9 in B. anynana, but none of the confirmed near-complete F0 mutants showed substantial changes in wing color, see supplementary text (Fig. 1C, figs. S2, S8 to S10, and tables S1, S2, and S5). This suggests that mir-193 is most likely the major effector within the locus, at least in B. anynana, a nymphalid butterfly.
To assess the role of mir-193 beyond nymphalids, we generated mKO mutants of mir-193 in a pierid (Pieris canidia) and a papilionid (Papilio polytes), representatives of families where melanic polymorphisms were also previously mapped to the cortex locus (Fig. 1F, fig. S2, and table S1). Reduced melanin pigmentation was observed in both species with high frequencies (55 to 58%) (Fig. 1, G and H, figs. S11 and S12, and table S2). In P. canidia, all of the black/gray wing color patterns became white whereas the yellow color remained unchanged (Fig. 1G and fig. S11). In P. polytes, the black wing color disappeared and a variety of white/yellow/red colors became expressed across the wing (Fig. 1H and fig. S12). This suggests that mir-193 has a conserved role in repressing melanization across three major butterfly families that diverged around 90 million years ago (29) (Fig. 1F).
CRISPR-mediated mutagenesis disrupts the biogenesis of both mature miRNA strands (Fig. 1B). To assess the role of mir-193 in a strand-specific manner, we performed in vivo electroporation to introduce miRNA inhibitors (complementary RNAs) of either miR-193–5p (passenger strand), or miR-193-3p (guide strand, fig. S1), into P. polytes early pupal wings. As a result, miR-193-3p inhibitor–treated wings phenocopied the mir-193 CRISPR mKO mutants (n = 5/5), whereas miR-193–5p inhibitor–treated wings showed no phenotypic changes (n = 2/2) (fig. S13). This suggests that the role of mir-193 in color regulation is carried out by its guide strand, miR-193-3p.
Mir-193 is derived from, and is the functional unit of, the lncRNA ivory
Identifying primary miRNAs (pri-miRNAs), the initial gene transcript in which miRNAs are processed, is essential to elucidate the transcription control and tissue- and cell-specific expression patterns of miRNAs (Fig. 1A). Because of the high turnover rate of Drosha processing, pri-miRNAs are usually expressed at low levels and are not easily captured in RNA sequencing (RNA-seq) data (20) (Fig. 1A). In fact, none of the annotated lepidopteran genomes showed any annotated transcripts overlapping the two miRNAs in the cortex locus. Blocking Drosha processing, however, can trigger the accumulation of these primary transcripts (20). Taking advantage of the miRNA mutant lines that disrupted the Drosha processing sites, we performed RNA-seq to profile whole transcriptomes from sib-paired WT and mutant mir-193 and mir-2788 homozygotes. For mir-193, wing tissues from sib-paired female WT and m4 homozygotes were sequenced from 60% wanderer stage (late 5th instar larval stage), day 1 pupal stage, and day 6 pupal stage. For mir-2788, wing tissues from sib-paired female WT and mutant homozygotes were sequenced from day 1 pupal stage alone. By manually inspecting genome alignments of the RNA-seq data, we discovered a ~740-bp transcript potentially spliced from a gigantic primary transcript spanning a 370-kb chromosomal region in two mir-193 day 1 and one mir-193 day 6 mutant pupal wing libraries, but not in the mir-193 mutant larval wings, WT wings, or mir-2788 mutant wing libraries (Fig. 2A). No open-reading frame was found in this newly discovered transcript, rendering it a long noncoding RNA (lncRNA). There was no clear sequence homology for the lncRNA across Lepidoptera, except for the ~100-bp core promoter region surrounding its transcription start site (TSS) recovered by 5′ rapid amplification of cDNA ends (5′RACE) (fig. S14 and table S6). This corresponds to the core promotor region of “ivory,” a lncRNA discovered in two recent studies (30, 31). Thus, this newly annotated lncRNA is termed ivory thereafter.
Fig. 2. The lncRNA ivory functions as primary mir-193.
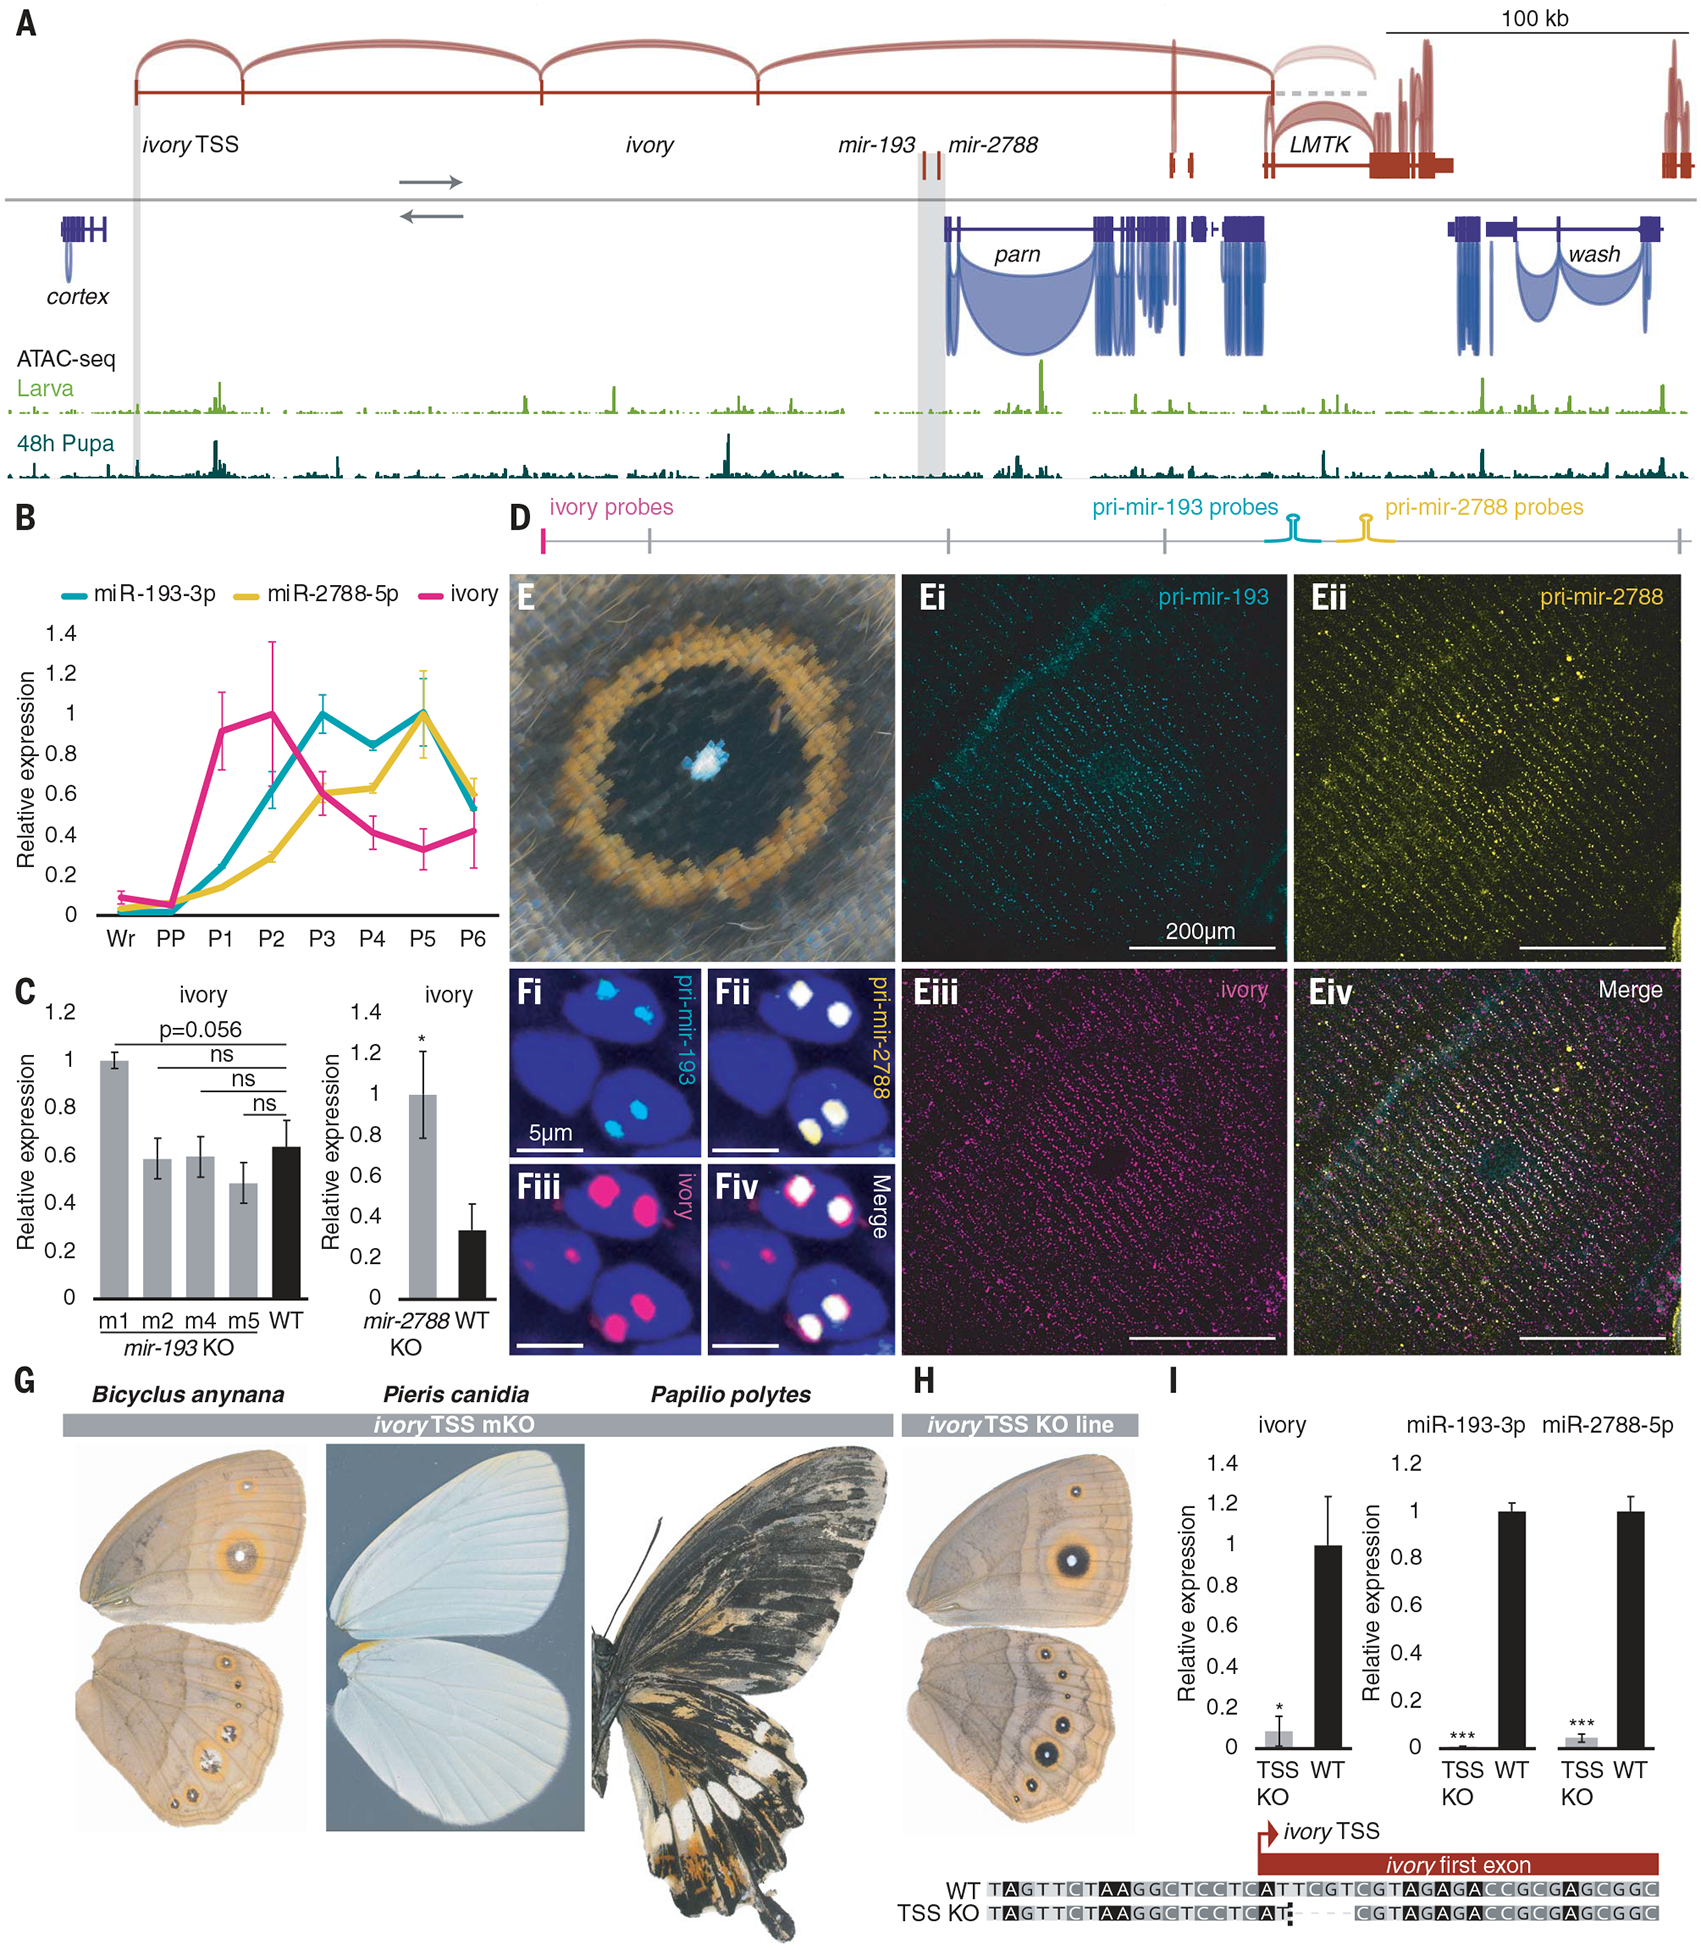
(A) A gigantic lncRNA, ivory, was found in the RNA-seq data of three mir-193 mutants, with a deeply conserved TSS whose chromatin accessibility increased during the larval-pupal transition (shaded), and an undefined 3′ terminus. No open chromatin was found around the miRNA region (shaded). (B) Time series expression of miRNA mature strands, miR-193-3p, miR-2788-5p, and ivory. (C) Expression levels of ivory across the miRNA mutants and wild type. (D) HCR probes were designed in the first exonic region for ivory, and in a 1-kb intronic region flanking each miRNA precursor for pri-miRNAs. (E) Spatial expression (HCR) of pri-mir-193 (i), pri-mir-2788 (ii), ivory (iii), and merged panels (iv) in the B. anynana “eyespot” wing color pattern and (F) their expression signals within individual nuclei. DAPI staining is in blue. (G) ivory TSS mKO phenotypes in B. anynana, P. canidia, and P. polytes. (H) A homozygous ivory TSS mutant line in B. anynana and its corresponding genotype. A dotted line denotes the cutting site. (I) Expression levels of ivory and the guide strands of mir-193 and mir-2788 across ivory TSS mutants and WT. Images were horizontally flipped when necessary. For qPCR, n = 3 to 4 replicates; ns, not significant; *P < 0.05; **P < 0.01; ***P < 0.001. Error bar, SEM.
In B. anynana, one intron of ivory overlaps the two miRNAs and ivory is the sole transcript overlapping the two miRNAs with the same transcription orientation (Fig. 2A). Thus we hypothesized that the primary transcripts of ivory are pri-mir-193 and pri-mir-2788. To test this hypothesis, we first generated a time series expression profile for the guide strands of the two miRNAs as well as for ivory (table S4). As expected, the three noncoding RNAs exhibited very similar expression profiles—negligible expression in larval wings and high expression in pupal wings (Fig. 2B). Noticeably, ivory exhibited an expression peak earlier in development than the two mature miRNAs, which aligns with the general pattern of miRNA processing in Drosophila: A fast turnover rate of the primary transcript produces long-lasting mature miRNA products (32). Furthermore, we performed assay for transposase-accessible chromatin with sequencing (ATAC-seq) during the larval-pupal transition to capture open chromatin status around the ivory promoter. An increasing expression of ivory correlated with an increasing chromatin accessibility around the ivory promotor during the transition, suggesting a causal relationship (Fig. 2A and fig. S14). To test whether the disruption of Drosha processing of the two miRNAs triggered the accumulation of ivory, we quantified the level of ivory across all mir-193 and mir-2788 mutant lines (table S4). Across the four mir-193 mutant lines, the lncRNA is marginally (P = 0.056) overexpressed in m1 mutants, compared with the wild type but not in the other mutants with shorter deletions (Fig. 2C). In the mir-2788 mutants, the lncRNA is significantly overex-pressed compared with the wild type (Fig. 2C). This provided moderate evidence that the two miRNAs were derived from ivory.
Next, we used hybridization chain reaction (HCR) to examine the spatial expression of pri-miRNAs, probing a 1-kb intronic region flanking each miRNA precursor as well as the spliced ivory, probing its first exon (Fig. 2D and data S1). Expression signals of pri-mir-193, pri-mir-2788, and ivory mapped to the black/brown color of B. anynana wing patterns (Fig. 2, E to Eiv, and fig. S15). The overlapping expression signals for the two pri-miRNAs and ivory appeared as two nuclear dots, corresponding to the two chromosomal transcription sites (33) (Fig. 2, Fi to Fiv). Transcription of intronic miRNAs can sometimes involve alternative TSSs independent of their host genes (34). However, there was insufficient evidence to support an alternative mir-193 TSS independent of ivory, suggesting that ivory TSS is most likely the sole TSS for mir-193 (see supplementary text, fig. S16, and table S6).
To further validate whether ivory possesses the same role as mir-193, ivory TSS was disrupted in B. anynana, P. canidia, and P. polytes (fig. S2 and table S1). The mKO mutants exhibited reduced melaninization at high frequencies (54 to 98%), and the ivory TSS mKO mutants completely phenocopied the mir-193 mKO mutants in each species (Fig. 2G, figs. S17 to S19, and table S2). To further test whether the ivory TSS mutant phenotypes are attributed to the simultaneous depletion of its derived mir-193, we generated a B. anynana ivory TSS mutant line with a 4-bp deletion in the ivory TSS (Fig. 2H). The ivory TSS mutant line exhibited bright wing color with black “black disk” eyespots and was able to fly, phenocopying a partial mir-193 KO mutant (Fig. 2H and fig. S20). In this line, the expression of ivory, mir-193, and mir-2788, was simultaneously depleted compared with WT animals (Fig. 2I and table S4). Overall, all lines of evidence presented above strongly suggest that ivory serves as pri-mir-193/2788 and that mir-193 is the functional product of ivory.
Mir-193 directly targets multiple pigmentation genes
MiRNAs elicit their regulatory effects by repressing target mRNAs. To discover both direct and indirect targets of mir-193, we examined the transcriptomes generated from the B. anynana m4 mutants and sib-paired wild type. A total number of 4 (larva), 11 (pupa day 1), and 218 (pupa day 6) differentially expressed genes (DEGs) (padj <0.01) across mutant and WT wings were found, suggesting that mir-193 triggers large transcriptomic changes mostly during late pupal development, when it is highly expressed (Fig. 3A and data S2). Except for an uncharacterized protein [National Center for Biotechnology Information (NCBI) gene ID: LOC112054702] ~680 kb away from cortex, none of the genes within the cortex locus (2-Mb genomic region flanking cortex) appeared as DEGs, suggesting a trans- rather than cis-acting nature of the miRNA. Multiple genes previously associated with ommochrome and melanin pigmentation pathways in butterfly wings appeared as DEGs in day 6 pupal wings (35).
Fig. 3. mir-193 directly targets multiple pigmentation genes.

(A) Differentially expressed genes (padj<0.01) across sib-paired female mir-193 m4 mutant and WT wing tissues across wing development. Genes highlighted were previously associated with butterfly pigmentation or potential color regulators. Candidates for in vitro validation are in bold (B) Four putative binding sites of miR-193-3p, the guide strand of mir-193, were found in CDS and/or 3′ UTR regions of three candidate genes, ebony (e), Esp1, and yellow-e3 (yel-e3) that are up-regulated in day 6 mutant wings. Full sequence complementarity (allowing G:U wobble base pairing) between the seed region (nucleotides 2 to 8 from the 5′ terminus of the miRNA guide strand) and the miRNA targets are highlighted. (C) Dual luciferase reporter assay was used to validate the direct miRNA target silencing across the four predicted binding sites in vitro, with a concentration gradient of miR-193-3p mimic. n = 6 replicates; *P < 0.05; **P < 0.01; ***P < 0.001. Error bar, SEM.
Since direct targets of mir-193 are expected to be overexpressed in the miRNA mutants, all genes up-regulated in the mutants were pooled and searched for complementary binding sites to miR-193-3p, the guide strand of mir-193. In total, 49 out of 118 genes highly expressed in the mutant were predicted to be direct targets of miR-193-3p (data S3). Three candidate targets, ebony (e), Esp1, and yellow-e3 (yel-e3), with previous implications in color regulation, were chosen for further investigation. e is a well-known insect melanin pathway gene that catalyzes the conversion of dopamine to N-β-alanyl dopamine (NBAD), a light-yellow pigment. Esp1 is associated with ommochrome color patterns in V. cardui butterflies and yel-e3 is a melanin pathway gene, but both have unknown functions (35). Four putative miR-193-3p binding sites were found in either the protein coding sequence (CDS), or the 3′ untranslated region (3′ UTR) of these genes (Fig. 3B).
Using a dual luciferase reporter assay, we validated the direct silencing effect of miR-193-3p across the four predicted target sites within the three candidate genes in vitro (see supplementary text, Fig. 3C, and table S7). Notably, miR-193-3p exhibited a dose-dependent silencing effect on the two e target sites, at least in vitro (Fig. 3C). Based on the known function of e, we propose that when mir-193 was disrupted in the black/brown wing regions in the m4 mutant, e was derepressed in those regions and started converting dopamine to NBAD, producing a lighter color, and shunting dopamine away from melanin pigment production (35, 36).
Mir-193 is an ancestral melanic color regulator
Finally, to test whether regulation of melanic coloration by mir-193 is ancestral to Lepidoptera, we tested its role in Drosophila melanogaster, an outgroup species. In these flies, mir-193 is in a different genomic region, lacks ivory, and is located between two protein-coding genes with the same transcription orientation (Fig. 4A). To determine the role of mir-193 in D. melanogaster, we used the pannier Gal 4 driver (pnr-Gal4) to express either a mir-193 sponge (a tandem sequence of seed-complementary binding sites of miR-193-3p to repress mir-193) function, or extra mir-193 precursors to enhance mir-193 function. As a result, in the mir-193 sponge line female A6 segments became brighter whereas in the mir-193 overexpression line female A6 segments became darker compared with the control line having a similar genetic background (Fig. 4B). This suggest that mir-193 has an ancestral role in promoting melanization in flies and lepidopterans regardless of genomic context (Fig. 4C).
Fig. 4. mir-193 is an ancestral melanic color regulator.

(A) Genomic context of D. melanogaster mir-193. (B) Phenotypes of pnr-Gal4 transgenic lines expressing either a mir-193 sponge with a sequence of seed-complementary binding sites for the guide strand miR-193-3p (reduced mir-193), or extra mir-193 precursors (increased mir-193), or a mir-193 sponge with scrambled miR-193-3p binding sites (control). (C) Functional conservation of mir-193 across a broader animal phylogeny where mir-193 is deeply conserved. Phylogeny is from (40).
Genotype-phenotype association studies are commonly used to assign variation in a genomic region to variation in a phenotypic trait. In the cortex locus, the causative genomic variants are frequently found in intergenic regions flanking cortex and it was previously believed that these regions harbor cis-regulatory elements (CREs) that regulate the spatiotemporal expression of cortex to create intraspecific melanic wing color polymorphisms in lepidopterans. However, our current study and two recent studies all conclude that the effector gene is most likely a poorly annotated lncRNA, ivory—not cortex or any other tested protein-coding genes near that locus (30, 31). Our study further suggests that a miRNA that derives from the primary transcript of ivory is the final effector gene. As a result, genetic variations discovered in this genomic region most likely regulate the spatiotemporal expression of ivory primary transcript and its derived mir-193 on the wing to create melanic color pattern variations in lepidopterans (31). This indicates that noncoding RNAs should never be overlooked in genotype-phenotype association studies. When the effector gene is a poorly annotated noncoding RNA, a direct link between local genetic variation and flanking protein-coding genes can lead to misleading conclusions.
Our work also illustrates the potential risk of misinterpreting CRISPR-Cas9 experiments with low penetration in F0 mutants, as they are likely caused by rare long deletions that disrupt adjacent genomic features. This is likely the case for the previously described rare cortex knockout (KO) phenotypes, in which the adjacent ivory TSS might have been disrupted (2, 14, 16, 18), or the rare mir-2788 KO phenotypes in this study, in which the adjacent mir-193 gene might have been disrupted.
Overall, our study identified a miRNA, processed from the primary transcript of a lncRNA, as the likely effector of a hotspot locus that underlies adaptive evolution in animals. This adds to a recent discovery of small noncoding RNAs being key regulators of adaptive flower color evolution and speciation (37). The burst of miRNA innovation at the base of Lepidoptera (23, 24) may have served as evolutionary raw materials to create a gamut of morphological diversity within this order, one of the most species-rich on earth. This and future investigations of noncoding RNAs will shed light on the long-standing hypothesis that it is the complexity of swiftly evolving noncoding components of the genome (cis-acting regulatory DNA elements and trans-acting noncoding RNAs), rather than the relatively static evolution of protein sequences, that drives organismal complexity (38, 39).
Supplementary Material
ACKNOWLEDGMENTS
We thank N. Vankuren for his suggestions on rearing and performing CRISPR experiments on P. polytes. We thank members of the Facebook group “The Hungry Caterpillar Singapore” for donating lime plants for rearing P. polytes. We thank N. Puniamoorthy for providing additional lab space to host the B. anynana miRNA mutant lines. We thank Y. Mawatari for her invaluable assistance in supporting the experiments. We thank Y. Tay for the helpful comments on this work.
Funding:
This work was funded by the following: National Research Foundation (NRF) Singapore grants NRF-CRP20-2017-0001, NRF-CRP25-2020-0001, and NRF-NRFI05-2019-0006 (to A.M.); Ministry of Education, Culture, Sports, Science, and Technology of Japan grant 22K15158 (to Y.A)., grant 21H02465 (to K.U.T.), grant 23K19381 (to S.K.), and grant 20H00474 (to H.F.); National Institutes of Health grants 1R35GM118073 and 1R01GM089736 (to P.J.W.); National Institute of Health training grant: “Michigan Predoctoral Training in Genetics” grant T32GM00754 (to A.M.L.)
Footnotes
Competing interests: Authors declare that they have no competing interests.
Data and materials availability:
All data required for reproducing and extending the study are available in the main text or the supplementary materials. Raw RNA-seq and ATAC-seq data are available under NCBI BioProject PRJNA1135107.
REFERENCES AND NOTES
- 1.Martin A, Orgogozo V, Evolution 67, 1235–1250 (2013). [DOI] [PubMed] [Google Scholar]
- 2.Wang S et al. , Cell 185, 3138–3152.e20 (2022). [DOI] [PubMed] [Google Scholar]
- 3.Joron M et al. , Nature 477, 203–206 (2011). [DOI] [PMC free article] [PubMed] [Google Scholar]
- 4.Ito K et al. , Heredity 116, 52–59 (2016). [DOI] [PMC free article] [PubMed] [Google Scholar]
- 5.Nadeau NJ et al. , Nature 534, 106–110 (2016). [DOI] [PMC free article] [PubMed] [Google Scholar]
- 6.VanKuren NW, Massardo D, Nallu S, Kronforst MR, Mol. Biol. Evol 36, 2842–2853 (2019). [DOI] [PMC free article] [PubMed] [Google Scholar]
- 7.Van’t Hof AE et al. , Nature 534, 102–105 (2016). [DOI] [PubMed] [Google Scholar]
- 8.Reed RD et al. , Science 333, 1137–1141 (2011). [DOI] [PubMed] [Google Scholar]
- 9.Gallant JR et al. , Nat. Commun 5, 4817 (2014). [DOI] [PMC free article] [PubMed] [Google Scholar]
- 10.Kunte K et al. , Nature 507, 229–232 (2014). [DOI] [PubMed] [Google Scholar]
- 11.Iijima T et al. , Sci. Adv 4, eaao5416 (2018). [DOI] [PMC free article] [PubMed] [Google Scholar]
- 12.Martin A et al. , Proc. Natl. Acad. Sci. U.S.A 109, 12632–12637 (2012). [DOI] [PMC free article] [PubMed] [Google Scholar]
- 13.Tunström K, Keehnen NL, Woronik A, Gotthard K, Wheat C, The genetic basis of a regionally isolated sexual dimorphism involves cortex. EcoEvoRxiv 6610 [Preprint] (2024); doi: 10.32942/X21C8R. [DOI] [Google Scholar]
- 14.van der Burg KRL et al. , Science 370, 721–725 (2020). [DOI] [PubMed] [Google Scholar]
- 15.Edelman NB et al. , Science 366, 594–599 (2019). [DOI] [PMC free article] [PubMed] [Google Scholar]
- 16.Livraghi L et al. , eLife 10, e68549 (2021).34280087 [Google Scholar]
- 17.Saenko SV et al. , Evodevo 10, 16 (2019). [DOI] [PMC free article] [PubMed] [Google Scholar]
- 18.Hanly JJ et al. , G3 12, jkac021 (2022).35099556 [Google Scholar]
- 19.Surridge AK et al. , BMC Genomics 12, 62 (2011). [DOI] [PMC free article] [PubMed] [Google Scholar]
- 20.Chang T-C, Pertea M, Lee S, Salzberg SL, Mendell JT, Genome Res 25, 1401–1409 (2015). [DOI] [PMC free article] [PubMed] [Google Scholar]
- 21.Ha M, Kim VN, Nat. Rev. Mol. Cell Biol 15, 509–524 (2014). [DOI] [PubMed] [Google Scholar]
- 22.Tian S, Monteiro A, Mol. Biol. Evol 39, msac126 (2022). [DOI] [PMC free article] [PubMed] [Google Scholar]
- 23.Ma X et al. , Genome Biol. Evol 13, evab083 (2021).33905491 [Google Scholar]
- 24.Quah S, Hui JH, Holland PW, Mol. Biol. Evol 32, 1161–1174 (2015). [DOI] [PMC free article] [PubMed] [Google Scholar]
- 25.Griffiths-Jones S, Grocock RJ, van Dongen S, Bateman A, Enright AJ, Nucleic Acids Res 34, D140–D144 (2006). [DOI] [PMC free article] [PubMed] [Google Scholar]
- 26.Chang H et al. , Sci. Rep 6, 22312 (2016). [DOI] [PMC free article] [PubMed] [Google Scholar]
- 27.Van Belleghem SM et al. , Nat. Ecol. Evol 1, 0052 (2017).28523290 [Google Scholar]
- 28.Jay P et al. , Philos. Trans. R. Soc. B 377, 20210193 (2022). [DOI] [PMC free article] [PubMed] [Google Scholar]
- 29.Kawahara AY et al. , Nat. Ecol. Evol 7, 903–913 (2023). [DOI] [PMC free article] [PubMed] [Google Scholar]
- 30.Livraghi L et al. , Proc. Natl. Acad. Sci. U.S.A 121, e2403326121 (2024). [DOI] [PMC free article] [PubMed] [Google Scholar]
- 31.Fandino RA et al. , Proc. Natl. Acad. Sci. U.S.A 121, e2403426121 (2024). [DOI] [PMC free article] [PubMed] [Google Scholar]
- 32.Zhou L et al. , eLife 7, e38389 (2018).30024380 [Google Scholar]
- 33.Aboobaker AA, Tomancak P, Patel N, Rubin GM, Lai EC, Proc. Natl. Acad. Sci. U.S.A 102, 18017–18022 (2005). [DOI] [PMC free article] [PubMed] [Google Scholar]
- 34.Monteys AM et al. , RNA 16, 495–505 (2010). [DOI] [PMC free article] [PubMed] [Google Scholar]
- 35.Zhang L et al. , Genetics 205, 1537–1550 (2017). [DOI] [PMC free article] [PubMed] [Google Scholar]
- 36.Matsuoka Y, Monteiro A, Cell Rep 24, 56–65 (2018). [DOI] [PubMed] [Google Scholar]
- 37.Liang M et al. , Science 379, 576–582 (2023). [DOI] [PMC free article] [PubMed] [Google Scholar]
- 38.Mattick JS, EMBO Rep 2, 986–991 (2001). [DOI] [PMC free article] [PubMed] [Google Scholar]
- 39.Taft RJ, Pheasant M, Mattick JS, BioEssays 29, 288–299 (2007). [DOI] [PubMed] [Google Scholar]
- 40.Kumar S, Stecher G, Suleski M, Hedges SB, Mol. Biol. Evol 34, 1812–1819 (2017). [DOI] [PubMed] [Google Scholar]
Associated Data
This section collects any data citations, data availability statements, or supplementary materials included in this article.
Supplementary Materials
Data Availability Statement
All data required for reproducing and extending the study are available in the main text or the supplementary materials. Raw RNA-seq and ATAC-seq data are available under NCBI BioProject PRJNA1135107.