

ABSTRACT
The shoulder joint is one of the functionally and anatomically most sophisticated articular systems in the human body. Both complex movement patterns and the stabilization of the highly mobile joint rely on intricate three‐dimensional interactions among various components. Continuum‐based finite element models can capture such complexity and are thus particularly relevant in shoulder biomechanics. Considering their role as active joint stabilizers and force generators, skeletal muscles require special attention regarding their constitutive description. In this contribution, we propose a constitutive description to model active skeletal muscle within complex musculoskeletal systems, focusing on a novel continuum shoulder model. Based on a thorough review of existing material models, we select an active stress, an active strain, and a generalized active strain approach and combine the most promising and relevant features in a novel material model. We discuss the four models considering physiological, mathematical, and computational aspects, including the applied activation concepts, biophysical principles of force generation, and arising numerical challenges. To establish a basis for numerical comparison, we identify the material parameters based on experimental stress–strain data obtained under multiple active and passive loading conditions. Using the example of a fusiform muscle, we investigate force generation, deformation, and kinematics during active isometric and free contractions. Eventually, we demonstrate the applicability of the proposed material model in a novel continuum mechanical model of the human shoulder, exploring the role of rotator cuff contraction in joint stabilization.
Keywords: active skeletal muscle, continuum mechanical shoulder model, finite element method, muscle material model, musculoskeletal modeling, parameter identification
We propose a constitutive model for active skeletal muscle designed for complex musculoskeletal systems based on a thorough review and comparison of existing approaches. We demonstrate its applicability in various numerical examples, including a large‐scale simulation of a novel continuum shoulder model.

1. Introduction
As one of the functionally and anatomically most complex articular systems in the human body, the shoulder joint combines mobility and stability in a unique musculoskeletal system. The anatomical structure of the involved glenohumeral joint allows for an extensive range of motion [1], while passive and active soft tissues ensure the joint's integrity through static and dynamic mechanisms [2]. Muscles, especially the rotator cuff and the deltoid, perform multiple essential functions. First, muscles actively stabilize the glenohumeral joint's bony structures through concavity compression [2, 3] and scapulohumeral balance [4, 5]. Second, muscles act as torque generators and enable complex movement patterns through their sophisticated interplay [6, 7]. Maintaining this delicate balance between mobility and stability is essential for proper shoulder function, yet it is easily disrupted by injury or pathological conditions [8, 9]. Despite the high incidence of shoulder disorders in clinical practice [10, 11], understanding of the underlying biomechanics remains limited. Developing objective, reliable diagnostic procedures and effective, monitorable treatments thus presents a major challenge for medical professionals and biomedical engineers.
Computational musculoskeletal models offer great potential to study the shoulder's biomechanics and physiology, investigate pathological conditions and (patient‐specific) treatments, and accelerate developments of medical devices such as surgical tools, implants, or rehabilitation equipment for physical therapy. While numerous reduced‐dimensional multi‐body models exist [12], research on comprehensive three‐dimensional continuum mechanical models remains limited. Especially in a joint as complex as the shoulder, three‐dimensional interactions between the geometrically complex components, sophisticated muscle fiber architectures [13], and directional material properties [14] are central to the shoulder's physiology. Here, continuum mechanical models can offer critical insights beyond those offered by reduced‐dimensional approaches and help to further improve these highly efficient and desirable reduced‐dimensional models.
Considering their role as active joint stabilizers and force generators, skeletal muscles deserve special attention regarding their constitutive description. Current shoulder models either apply purely passive material models neglecting the muscle's active properties or use active stress material models [15, 16] that generate internal forces and contractile deformations in response to a prescribed external stimulation.
Research on the constitutive modeling of active skeletal muscle is though fairly advanced. There exist various active constitutive models differing in the applied mathematical concept, rheological properties, modeled scales, and considered active force generation mechanisms.
Whether the active stress muscle material models [15, 16] used in existing shoulder models are the most suitable approach has not yet been investigated. The question of which material model best characterizes the shoulder's skeletal muscles at an appropriate level of detail while being computationally efficient and robust for such a large‐scale application remains open.
In this article, we aim to identify a suitable material model for modeling the active skeletal muscle components in a full three‐dimensional continuum mechanical model of the human shoulder. To achieve this, we comprehensively review existing approaches, conduct a detailed study of three selected material models, and ultimately integrate the most promising and relevant properties into a modified material model suitable for our application scenario.
In Section 2, we provide an overview of current musculoskeletal models for the human shoulder and conduct a thorough review of existing constitutive descriptions for active skeletal muscle. We place particular focus on constitutive descriptions applicable to continuum mechanical musculoskeletal simulations, although our research extends beyond this scope. From the reviewed material models, we select three hyperelastic material models for further investigation in Section 3: the active stress approach by Blemker et al. [15], which has already been applied to models of the human shoulder and knee; the microstructurally inspired generalized active strain approach by Weickenmeier et al. [17]; and the mathematically well‐posed active strain approach by Giantesio et al. [18]. Aiming to combine these models' most promising and relevant properties, we suggest a modified constitutive model tailored for application in complex musculoskeletal systems. We compare the four introduced skeletal muscle models considering physiological, mathematical, and computational aspects. We discuss the concepts of modeling active material behavior from a mathematical and physiological perspective, address analytical and numerical problems arising from the mathematical formulations, and analyze the included biophysical principles of force generation in terms of physiological correctness and relevance considering the modeling of the human shoulder. To establish a basis for a numerical comparison, we fit the material parameters to a common set of experimentally obtained stress–strain data from the literature in Section 4. Contrary to the original publications, we consider multiple active and passive loading conditions, as a single load case is generally insufficient to uniquely determine the material response. In Section 5.1, we investigate force generation, deformation, and kinematics during active isometric and free contractions using a fusiform muscle geometry as a simple example. Eventually, we demonstrate the applicability of the suggested material model in simulations of two complex problems. By the example of a two‐component muscle–bone model, we introduce an approach for incorporating complex activation patterns within the material model in Section 5.2. In Section 5.3, we present a full continuum mechanical model of the human shoulder, utilizing the proposed material model for the muscular components. We employ the model to simulate the concavity compression effect, a crucial stabilizing mechanism in the shoulder, where the active rotator cuff muscles pull the humeral head toward the glenoid fossa. Section 6 summarizes our key findings and discusses future perspectives.
2. Literature Review
2.1. Musculoskeletal Models of the Human Shoulder
Computational models of the human shoulder can be primarily categorized into multi‐body and continuum mechanical finite element models.
Reduced‐dimensional multi‐body models are based on rigid body dynamics and assume the body segments, that is, the bones, as non‐deforming rigid bodies. Muscles connect those rigid segments and are modeled as one‐dimensional line actuators. For muscles with a broad attachment area, multiple actuators can be defined. Often, these approaches apply wrapping methods to geometrically constrain the muscle force path and prevent penetration between muscle and bone [19, 20].
Because muscles are assumed to be simplified one‐dimensional objects that deform independently of each other, multi‐body models fail to capture a wide range of phenomena, such as contact or sliding interactions between the joint components, three‐dimensional (non‐uniform) deformations and stress distributions, or complex fiber arrangements and tendon morphologies. Despite these disadvantages, multi‐body models have been successfully applied in research and technology. Areas of application include investigations of movement actuation [21], muscle force and moment arm estimations [22, 23], and the simulation of neuromuscular control of prostheses [24] and surgical procedures [25]. A comprehensive overview of multi‐body models of the shoulder and upper extremity can be found in [12, 26, 27, 28].
In contrast, continuum mechanical models discretize muscles and other deformable structures in a full three‐dimensional fashion. These models can thus resolve internal stress and strain distributions and can account for contact and three‐dimensional interactions between geometrically complex parts. Further, implementations involving sophisticated muscle fiber arrangements [29, 30, 31] and tendon morphologies [16, 32], complex (nonhomogeneous) constitutive behavior [15, 16, 33], and spatially varying muscle activation can be realized [34, 35]. Of course, such models come with additional challenges that, for example, include an increased computational cost and a higher complexity regarding the geometric design, discretization, methods of contact modeling, and solution techniques.
While reduced‐dimensional multi‐body human shoulder models are common in the literature, only a few continuum‐based models of the entire human shoulder exist. We conducted a thorough review of existing continuum mechanical shoulder models and in the following briefly summarize our findings.
To provide an overview, Table 1 lists the reviewed models along with their distinctive features. The number of incorporated anatomical components varies, ranging from basic models incorporating only the most fundamental joint muscles to comprehensive models encompassing the entire upper limb musculature. Bones are commonly considered rigid bodies or, in some cases, integrated into the finite element (FE) discretization and assigned a comparably high material stiffness. Muscles are typically discretized using three‐dimensional tetrahedral or hexahedral elements, except for the surface‐based two‐dimensional modeling approach in [36].
TABLE 1.
Continuum mechanical models of the human shoulder in literature. Only models featuring at least one muscle actuating the glenohumeral (GH) joint are considered in this summary.
| Model description and objective | Model components | Discretization | Muscle material | Contact | |
|---|---|---|---|---|---|
| Büchler et al. [37] | FE model to quantify the impact of the humeral head shape on the stress distribution in the scapula | Humerus, scapula, subscapularis, supraspinatus, infraspinatus, cartilage in GH joint |
Bones: linear hexes, rigid surface elements Muscles, cartilage: linear hexes |
Passive exponential hyperelastic | Bone–muscle, GH joint |
| Terrier et al. [38] | FE model to investigate the biomechanical influence of a supraspinatus deficiency | Humerus, scapula, rotator cuff, deltoid, cartilage in GH joint |
Bones: rigid Muscles: linear hexes with truss elements for fibers, cables Cartilage: linear hexes |
Passive fiber reinforced hyperelastic Neo‐Hooke | Bone–muscle, GH joint |
| Metan et al. [39] | FE model to investigate stresses during adduction and abduction shoulder exercises | Humerus, scapula, clavicula, infraspinatus, subscapularis, deltoid, triceps, ligaments |
Bones: rigid, tets Muscles, ligaments: hexes, pents |
Passive linear elastic | GH joint |
| Duprey et al. [40] | FE model to predict injuries in impact scenarios based on the HUMOS full‐body model | Humerus, scapula, clavicula, several muscles, ligaments, skin |
Bones: shells, hexes Muscles: springs, shells, hexes |
Passive elastoplastic | Not defined |
| Inoue et al. [41] | FE model to investigate stress distribution in the rotator cuff tendons | Humerus, scapula, subscapularis, supraspinatus, infraspinatus, acrom. del‐toid, cartilage in GH joint | Hexes | Passive nonlinear elastic | GH joint, subacromial space |
| Zheng et al. [42] | FE model to investigate glenohumeral motion and contact mechanics of the GH joint | Humerus, scapula, clavicula, rotator cuff muscles, cartilage in GH joint, four GH joint ligaments | Tets | Passive linear elastic | GH joint |
| Teran et al. [43] | Finite volume model to simulate dynamic deformation, inversely compute muscular activation | Bones and 30 muscles of the upper limb |
Bones: rigid Muscles: tets |
Active stress material [15] | Muscle–muscle |
| Webb et al. [23] | FE model to examine muscle fiber paths and moment arms | Humerus, scapula, clavicula, rotator cuff muscles (incl. tendons), deltoid |
Bones: rigid surface elements Muscles, tendons: linear hexes |
Active stress material [15] | Muscle–muscle, muscle–tendon, bone–muscle |
| Pean et al. [22] | Comprehensive three‐dimensional FE model to investigate shoulder biomechanics | Humerus, scapula, clavicula, rotator cuff, deltoid, eight additional shoulder muscles |
Bones: rigid surface elements Muscles: linear hexes |
Active stress material [15] | Bone–muscle |
| Pean et al. [36] | FE model with surface‐based muscles to investigate shoulder biomechanics | Humerus, scapula, clavicula, rotator cuff, deltoid, eight additional shoulder muscles |
Bones: rigid surface elements Muscles: membrane elements |
Active stress material [15] | Bone–muscle |
| Assila et al. [16] | FE model to investigate pathomechanisms of the rotator cuff associated to wheelchair propulsion | Humerus, scapula, clavicula, rotator cuff and deltoid muscles (including tendons and epimysia) |
Bones: rigid shells Muscles, tendons: tets Epimysia: shells |
Presumably an active stress material combining [45, 46, 47] | Between all model components |
The majority of reviewed models neglect the active contractile behavior of muscle tissue [37, 38, 39, 40, 41]. Instead, they solely account for the passive response and prescribe external forces or displacements to generate movement. Typically, those models employ hyperelastic, transversely isotropic, nonlinear material models to account for the passive muscle characteristics. The work in [42] employs a linear elastic passive material model and defines one‐dimensional tensile stress states in the initial condition to simulate muscle contraction. More recent publications assign active constitutive laws to the muscular components such that the prescribed activation controls the motion. The most common approach is the active stress material model from [15], which has been applied in [22, 23, 43, 44]. Although it is not explicitly detailed in the text how active and passive contributions are combined, we presume that the model in [16] employs an active stress approach by adding an active stress contribution from [45] to a passive material model based on [46] and [47]. To the best of our knowledge, these two are so far the only active muscle material models applied in the context of continuum mechanical modeling of the human shoulder.
2.2. Constitutive Modeling of Active Skeletal Muscle
Research regarding the three‐dimensional constitutive modeling of skeletal muscle tissue is fairly advanced, and there exists a variety of elaborate material models for both the passive characteristics and the active contractile behavior. Typically, skeletal muscle is modeled with nonlinear, hyperelastic constitutive laws, for example, [15, 18, 48, 49]. Some authors, such as [50, 51, 52, 53, 54], choose viscoelastic approaches to incorporate rate‐dependent properties. Hypervisco‐poroelastic constitutive approaches are presented, for example, in [55, 56]. Due to the high water content, the tissue is mostly assumed to behave as a (nearly) incompressible material. Depending on the information incorporated, the constitutive models can be classified as purely phenomenological or multi‐scale. A common approach is to first consider the passive material behavior and then include the active characteristics.
2.2.1. Passive Constitutive Models
2.2.1.1. Fiber and Matrix Contributions
From a histological point of view, the muscle's passive behavior is governed by the extracellular matrix (ECM) and the passive contribution of the embedded muscle fibers. As the fibers are arranged in parallel bundles, most material laws assume a transversely isotropic fiber orientation in an isotropic tissue matrix.
Purely phenomenological models fit the constitutive behavior through mathematical formulations reflecting the experimentally observed behavior. Typically, the modeling of hyperelastic behavior starts with the definition of a strain‐energy function . In accordance with the histological composition of muscle tissue, a common approach is to additively split the strain‐energy function (where the index points to the passive contribution) into the two respective parts, and .
The most popular choice for is an isotropic Mooney–Rivlin constitutive law, as in [34, 43, 56, 57, 58, 59, 60, 61, 62, 63, 64, 65]. Other approaches apply Ogden‐type material models [16, 66], exponential Humphrey‐type constitutive laws [67, 68, 69, 70, 71, 72], quadratic polynomial functions [73, 74, 75], or simpler Neo‐Hooke [49, 76, 77, 78] and Saint‐Venant–Kirchhoff relations [79]. In [80, 81], the extracellular matrix material is modeled by a rubber‐like nonlinear stress–strain relation based on measurable physical muscle parameters. The work of Blemker et al. [15, 32, 82, 83] proposes a transversely isotropic model, accounting explicitly for the extracellular matrix resistance to a long‐fiber shear and cross‐fiber shear by two strain‐energy components. Building on prior work [78], a sophisticated model for the extracellular matrix featuring two preferred fiber directions for the included collagen fibers is presented in [84].
The passive muscle fiber stress contribution usually depends non‐linearly on the current fiber stretch. Common choices include exponential functions, for example, in [16, 49, 64, 76, 78, 85, 86] or polynomial functions, for example, in [33, 87]. Another popular option is a piecewise‐defined, experimentally‐based function [88] as seen in [15, 57]. The authors in [65] assume fibers are oriented in an ellipsoidal distribution, which allows for a direction‐dependent modulation of fiber stiffness.
Ehret et al. [48], and others in succession [17, 18, 89], circumvent an additive split into the matrix and fiber contributions by introducing a coupled exponential‐type model. A similar concept is applied in [90].
In contrast to what is called here purely phenomenological models, multi‐scale models exploit the hierarchical structure of skeletal muscle and incorporate micromechanical features. A common approach is to create representative volume elements for, for example, the fiber muscle cells and the extracellular matrix. Through homogenization techniques, the microstructural information is projected to the macro scale and incorporated into a constitutive law on the continuum level. Such approaches are found, for example, in [91, 92, 93, 94, 95].
A special concept is presented in [96], where skeletal muscle is modeled as an elastically linked system of two independently meshed domains for the fiber and matrix constituents.
2.2.2. Active Constitutive Models
2.2.2.1. Active Stress, Active Strain, Generalized Active Strain, and Mixed Approaches
To include the fibers' active contractile properties, two concepts—the active stress and the active strain approach—are commonly applied. Next to that, there exist so‐called generalized active strain approaches and mixed approaches combining the two concepts. For a detailed explanation, see [97, 98, 99, 100].
The active stress approach adds an active stress term to the passive stress component such that the stress tensor (here given as the second Piola–Kirchhoff stress tensor) reads . Often, the active fiber stress depends on an activation parameter that scales the maximal isometric active muscle force. In a rheological model, the active stress approach is represented by a parallel arrangement of a passive, elastic spring and an active element, see Figure 1a. Examples of such hyperelastic, viscoelastic and poro‐visco‐hyperelastic material models are [15, 34, 35, 61, 62, 76, 80, 86, 87, 101, 102], [53, 54, 77, 103, 104] and [55, 56], respectively. The main advantage of this concept is due to experimental practice and a straightforward interpretation of the active stress contribution [17, 48, 105]. In classical experiments on muscle tissue, both the muscle's force response in the passive resting state and the activated contractile state is tested. The characteristics of the resting state can then be attributed to the passive stress component, while the difference between the passive and the total activated stress–strain curve governs the active stress term [105]. Generally, the active stress tensor is considered a non‐conservative contribution as it is not derived from the potential energy [99]. The active stress approach may thus violate the principle of energy conservation, possibly leading to numerical instabilities or non‐physical predictions.
FIGURE 1.

Rheological models illustrating the different concepts of muscular activation as in [97].
Opposed to that, the concept of active strain relies on a multiplicative decomposition of the deformation gradient into . While the active contribution maps the reference configuration onto a stress‐free intermediate configuration, the elastic contribution maps from the intermediate configuration onto the current configuration. Since elastic energy is stored solely through , the strain‐energy function is expressed in terms of rather than . Active contractile characteristics are commonly incorporated through an activation parameter in the formulation of . A representative rheological model consists of a passive, elastic spring in series with an active element, as shown in Figure 1b. Hyperelastic and viscoelastic constitutive laws following the active strain approach can be found in [18, 77, 105] and [50, 51], respectively. Due to the mathematical construction of the active strain approach, the strain‐energy function inherits its mathematical properties from the underlying passive strain‐energy function [99]. This includes properties such as frame invariance and rank‐one ellipticity, which ensure that there is a guaranteed solution to the associated equilibrium equations [99]. These considerations do not apply for the active stress approach. In contrast to the active stress approach, the active contribution is not an experimentally observable quantity but rather more complex in its interpretation.
A generalized active strain concept was originally presented in [48] and later adapted in [17] and [89]. Active properties are included by increasing the invariant accounting for the passive longitudinal fiber characteristics by an active contribution , such that the combined invariant is . According to [97], this is equal to applying the multiplicative decomposition of the deformation gradient to a part of the strain‐energy function. A rheological representation is shown in Figure 1c. Advantage lies in the more physiological representation of the muscle tissue. On the cellular level, a sarcomere includes both an active component (actin–myosin complex) and a passive component (titin filaments) arranged in series [106]. Modeling muscle as a parallel arrangement of the serially arranged sarcomere components and an elastic component representing the passive connective tissue provides a more accurate representation of tissue characteristics than a pure active stress or active strain approach [48, 97].
Mixed approaches combine the principles of active stress and active strain approaches. These models include three components: a passive stress component , represented by the parallel spring in Figure 1d, an active stress component , represented by the parallel active element, and an active‐strain‐based component that depends exclusively on the partial deformation gradient and is represented by the serial arrangement of the spring and active element. As for the active strain approach, is derived from the multiplicative decomposition of the deformation gradient . Examples of such mixed approaches are [107, 108]. Mixed approaches are motivated by the commonly accepted physiological hypothesis that skeletal muscle tissue employs redundant pathways for stress transmission. The active stress approach assumes there is no elastic coupling between muscle fibers and the extracellular matrix, and the active stresses are directly transmitted by the muscle fibers. In contrast, the active strain approach assumes that stresses are transmitted through the extracellular matrix. By combining both approaches, mixed models thus aim to more accurately reflect the dual mechanisms of active stress transmission in skeletal muscle.
The approaches in [67, 68, 85] and similarly in [69, 70, 71, 72] are expansions of the classic so‐called Hill‐type model to three dimensions. In this case, the total muscle force is—equivalently to the generalized active strain approach—estimated by adding the forces from a passive spring and the serial arrangement of a passive spring and a contractile active element.
2.2.3. Activation Characteristics
2.2.3.1. Influences on Muscular Activation and Force Generation
A muscle's potential for force production is governed by various factors, such as its geometry, histological composition, neural activity, its current state of motion and deformation, and its contraction history. While geometric factors, such as size and fiber architecture, are considered in the geometric representation of the finite element model, histology‐, activity‐, and motion‐related factors are commonly included in the material description. In any of the concepts presented above, the active contribution, be it , or , involves the computation of an activation quantity accounting for a varying number of those effects.
Experimentally observable force‐stretch, force‐velocity, and force‐stimulation‐frequency dependencies are commonly included in a phenomenological fashion.
Thereof, the force‐stretch dependency is considered in most publications. Popular choices for its mathematical description include (piecewise‐defined) exponential [16, 33, 73], linear [61, 87], or parabolic [15, 34, 57, 75, 79] formulations. Besides that, sigmoid functions [77, 86, 101] and a normalized Weibull distribution [48, 70] were proposed in the literature. A detailed review and assessment of existing mathematical models describing the force‐stretch dependency is provided in [109].
Less common is the additional inclusion of a force‐velocity dependency. Often, a hyperbolic relation based on the work in [110] and [111] is chosen [48, 61, 64, 80, 101, 112]. Other authors present exponential and arcus‐tangent functions; see [63, 70, 72, 73] and [85].
The simplest approach to account for the neural activity (or, in other words, the stimulation frequency) is to linearly scale the active contribution with an activation factor; see, for example, [15, 62, 74, 75, 79]. To simulate temporal variations of muscular activation, for example, the successive build‐up of a fused tetanic contraction state, some authors include a time‐dependent activation function [64, 68, 69, 70, 71, 72, 73, 85]. More sophisticated formulations such as [61, 77, 80, 101, 112] resolve the time‐dependent activation level on the scale of milliseconds by a superposition of single muscle twitches. An additional composition into different fiber types, as proposed by Ehret et al. [48], featuring different twitch force amplitudes and frequencies, is accounted for by a weighted sum of the contributions. The work of [16] employs a model that describes active muscle tension in terms of relative calcium ion concentration. Since calcium concentration and neural excitation intensity are correlated, the authors prescribe normalized activation directly as model input.
Despite experimental evidence (see [89] for a summary), history‐dependent effects such as force depression and force enhancement are less commonly included in the constitutive description. To include these effects, the authors in [89] propose an extension of the constitutive law in [48] by a so‐called dynamic function. This function accounts for a dynamic force–velocity dependency and the effects of force depression and force enhancement by evaluating a differential equation. Opposed to this phenomenological approach, the work in [87] accounts for force enhancement effects on the micro‐scale. At the sarcomere level, force enhancement is primarily governed by actin–titin interactions. To incorporate these interactions, they combine their multi‐scale chemo‐electro‐mechanical model with a “sticky‐spring” mechanism for actin–titin interactions [113].
Other multi‐scale approaches link the macroscopic constitutive model to detailed mathematical descriptions of electrical, biophysical, and chemical processes at the microscopic level (see [114] for a comprehensive review).
Monodomain or bidomain equations are frequently used to model the action potential propagation along a muscle fiber, as seen in, for example, [34, 35, 66, 115, 116] and [117, 118], respectively. An approach integrating the mechanism of electromechanical delay, that is, the time difference between the muscle's stimulation and a measurable produced force, is further proposed in [66]. The authors of [119] incorporate an electric field that triggers mechanical activation once the electric potential exceeds a certain threshold. A phenomenological model of motor‐unit recruitment driven by neural activity is coupled to the continuum level in [58, 118].
Chemical processes such as calcium‐concentration‐driven muscle activation and calcium activation dynamics, that is, the release of calcium from the sarcoplasmic reticulum, are added, for example, in [34, 35, 76, 115] and [34, 35, 76]. To describe the de‐ and attachment of cross‐bridges during muscle contraction on a molecular level, partial differential equations based on the Huxley sliding filament theory are applied in [76, 120]. One of the most detailed descriptions of the electrophysiological behavior of a half‐sarcomere on the cellular level is presented in [121], and is coupled to continuum mechanical constitutive laws in [34, 35, 58, 118]. It models the entire pathway from electrical excitation to muscle cell contraction through differential equations, thereby including electrochemical models of the membrane electrophysiology, calcium (activation) dynamics, cross‐bridge dynamics, and fatigue.
Besides the basic modeling of physiologically realistic behavior of healthy skeletal muscle, the study of specific (pathological) biological processes is an ongoing research topic. Examples include models for damage [122], fatigue [34, 35], and age‐related loss of activation [123].
3. Material Models for Active Skeletal Muscle
The choice of an appropriate material model is essential to obtain physiologically realistic kinematics and stress results. Based on the literature review in the previous section, we select three material models for a detailed investigation. In addition, we propose a fourth modified material model that combines the most promising features of the three models from the literature into a skeletal muscle material model specifically tailored for application to human shoulder modeling.
Following a very brief introduction to the basic continuum mechanical quantities in Section 3.1, Section 3.2 summarizes the four investigated models and highlights the modifications made in our work. In Section 3.3, we compare the approaches and critically analyze the respective advantages and disadvantages before providing an interim discussion in Section 3.4.
3.1. Continuum Mechanical Basics
In nonlinear continuum mechanics, the deformation gradient , with the Jacobi determinant , serves as the primary measure of deformation. and denote the coordinates of a material point in current and reference configuration, respectively. The right Cauchy–Green tensor is an important quantity to calculate the strains with regard to the reference configuration and is defined as
| (1) |
Following a multiplicative decomposition of the deformation gradient into isochoric and volumetric parts, the modified right Cauchy–Green tensor , which describes the isochoric contribution, is introduced. All modified, that is, isochoric, quantities are indicated by in this work.
Hyperelastic material laws postulate the existence of a strain‐energy function . To account for the fiber direction in a transversely isotropic material model, a structural tensor can be incorporated into the strain‐energy function, such that . Assuming the fiber direction in reference configuration as the unit vector , the structural tensor is computed to . The stretch in fiber direction is
| (2) |
The second Piola–Kirchhoff stress tensor is derived from the strain‐energy function as
| (3) |
while the first Piola–Kirchhoff stress tensor results from the push‐forward operation
| (4) |
Solving a continuum mechanical problem with the finite element method, usually requires the linearization of the constitutive equation. Therefore, the forth‐order elasticity tensor is computed to
| (5) |
3.2. Selected Material Models
We evaluate three hyperelastic and nearly incompressible material models from the literature based on either the active strain, active stress, or the generalized active strain approach. In accordance with the anatomical predominant unidirectional fiber alignment on the local scale, all of the selected material models assume a transversely isotropic fiber distribution with respect to this preferred fiber direction. Blemker et al.'s active stress model [15], here named ASE, is chosen due to its successful application to several single muscles [32, 82, 124, 125] and muscle tissue parts [83] but also comprehensive models of the human shoulder [22, 23] and the human knee [126]. Weickenmeier et al.'s model [17], termed GASA, is selected because it incorporates muscle activation through a novel generalized active strain approach and allows for seamless integration of micromechanical data. Giantesio et al.'s model [18], abbreviated ASA, is a variant of the aforementioned GASA‐model but uses an active strain approach to include activation in a mathematically well‐posed manner.
In addition to these three models, we introduce a fourth material model, the GASAM‐model, which combines the optimal features of the previously mentioned models for our application to complex musculoskeletal systems.
Figure 2 provides a schematic overview of the constitutive laws. Table 2 summarizes material parameters and abbreviations used in the following.
FIGURE 2.

Schematic overview of the investigated constitutive laws for active skeletal muscle tissue.
TABLE 2.
Overview of the material parameters for the ASE‐, ASA‐, and GASA‐models in Blemker et al. [15] (used in this work in a variant, i.e., in combination with the Neo‐Hooke material model [127]), Giantesio et al. [18] and Weickenmeier et al. [17], respectively. Additionally, the table includes the material parameters for the herein‐proposed GASAM‐model.
| Passive material parameters | |||||
|---|---|---|---|---|---|
| ASE | ASA, GASA, and GASAM | ||||
|
|
Along fiber shear modulus |
|
Parameter related to along fiber properties | ||
|
|
Transverse fiber shear modulus |
|
Parameter related to transverse fiber properties | ||
|
|
Magnitude of passive along fiber tension |
|
Stiffness parameter | ||
|
|
Exponential growth rate of passive along fiber tension |
|
Weighting factor for isotropic tissue constituent | ||
|
|
Bulk modulus |
|
Incompressibility parameter | ||
|
|
Neo‐Hookean shear modulus | ||||
| Active material parameters | ||||||||
|---|---|---|---|---|---|---|---|---|
| ASE | ASA and GASA | GASAM | ||||||
|
|
Optimal fiber stretch |
|
Optimal fiber stretch |
|
Optimal fiber stretch | |||
|
|
Minimum linear fiber stretch |
|
Minimum fiber stretch |
|
Minimum fiber stretch | |||
|
|
Maximum isometric stress |
|
Number of activated MUs per reference cross‐section area |
|
Maximum active nominal stress | |||
|
|
Amplitude of time‐dependent activation |
|
Twitch force of MU
|
|||||
|
|
Frequency of time‐dependent activation |
|
Twitch contraction time of MU
|
|
Frequency of time‐dependent activation | |||
|
|
Interstimulus interval of MU
|
|||||||
|
|
Fraction of MU
|
|||||||
Note: For brevity, motor units are abbreviated as MU. A MU of type is denoted MU .
.
3.2.1. Active Stress Approach (ASE)
Blemker et al. [15] present a purely phenomenological material model with a fiber‐stretch‐dependent activation, named ASE in this work. Following the concept of active stress, activation is modeled by adding an active stress contribution to the passive stress. Near‐incompressibility is achieved through a decoupled strain‐energy function involving a purely isochoric part and a purely volumetric part .
The isochoric part is formulated with respect to the modified invariants
| (6) |
and the strain invariants
| (7) |
Considering the bulk modulus , the along fiber shear modulus , and the transverse fiber shear modulus , the proposed strain‐energy function reads
| (8) |
It involves the contributions and accounting distinctively for shear along and transverse to the fiber direction. The term can be attributed to active and passive tension and compression along the fiber direction ( and , respectively). With the total Cauchy fiber stress , is implicitly given by the equation
| (9) |
Accounting for the active stress, comprises an active part and a passive part . Considering the maximal isometric fiber stress , we compute to
| (10) |
The amplitude scales the active contribution. In contrast to the original formulation in [15], we introduce an additional time‐dependent function . By this integration, we can establish a time‐dependent activation profile comparable to one in the GASA‐model introduced in the upcoming Section 3.2.2. To mimic the successive build‐up of twitch forces up to a fused tetanized level, we choose the tanh‐function
| (11) |
with the frequency and activation start time . Setting results in the original material model in [15]. The functions and in Equation (10) account for the experimentally observed active and passive force‐stretch‐dependencies, respectively. Assuming the maximal isometric fiber stress occurs at the optimal fiber stretch , the active stretch‐dependency is given as in the original publication as
| (12) |
Different from the original formulation, we assume that passive fibers solely produce a stress response in all tensile states, that is, when and not as originally when . Considering the minimum linear fiber stretch and the parameters and , the passive stretch‐dependency reads
| (13) |
with
| (14) |
Since is now only involved in the computation of , the active and passive behavior is decoupled and the material parameters can be fitted to the two scenarios independently.
We provide the derivation of the second Piola–Kirchhoff stress tensor in Section A.1.1 of Appendix A for the reader's convenience, as these equations have not been published so far. The presented equations reflect the additive composition of a passive and an active stress component, as it is characteristic of the active stress concept. Details about the elasticity tensor derivation are given in Section S1.1 of the supporting information.
Remark 1
For passive compression along the fiber direction (that is, ), and in succession become zero. If shear contributions vanish as well, the entire stress response is zero (see also the remark in [90]). From a modeling perspective, this can be attributed to the fact that the material neglects the compressive stiffness of the fiber surrounding tissue. Instead, it solely incorporates components directly associated with the muscle fibers. To account for the influence of the fiber surrounding tissue and circumvent numerical difficulties arising from the lack of stiffness in plain compressive states, this work pairs the material model with the isometric Neo‐Hookean material model in [127] with the strain‐energy function .
Remark 2
The stress computation exhibits singularities in case the argument of in the invariant in Equation (7) becomes . To calculate the stress, the derivative of with respect to is formed and accounted for in the auxiliary variable (see Equation (A4)). The zero in the denominator thus leads to a singularity for the case that . In an analytical setting, we can compute the limit, such that . In a numerical evaluation, the singularity can be circumvented by adding a very small contribution to such that . This behavior can be attributed to the chosen invariants, initially published by Criscione et al. [128]. As previously noted by Bleiler et al. [93], the derivative of the invariant becomes singular in case of vanishing shears.
3.2.2. Generalized Active Strain Approach (GASA)
The generalized active strain approach by Weickenmeier et al. [17], here named GASA, is based on the fully incompressible model for passive and active muscle presented by Ehret et al. in [48, 80]. On this basis, Weickenmeier et al. [17] propose two compressible constitutive descriptions that model the muscle tissue as nearly incompressible. The so‐called coupled approach circumvents the commonly applied additive volumetric‐isochoric split of the strain‐energy function. Since it has been proven to be advantageous in maintaining incompressible behavior, we employ this coupled approach in our forthcoming studies. In contrast to the active stress and active strain concept, activation is achieved through the modification of an invariant.
The proposed strain‐energy function incorporates the material parameters , , and , and the incompressibility parameter . The weighting parameters and , related by , describe the percentage contribution of the extracellular matrix and the muscle fibers, respectively. While the structural tensor accounts for the muscle fiber alignment, the isotropic matrix contribution is included in the structural tensor . Considering the activation parameter , the two general invariants (with its passive and active parts and , respectively) and are introduced as
 |
(15) |
Based on those quantities, the strain‐energy function is defined as
| (16) |
For the computation of the activation parameter , two assumptions are made: first, the model nominal stress response to a uniaxial deformation along the fiber direction matches the experimentally measured total nominal stress, and second, this measured total nominal stress can be additively decomposed into passive and active contributions. Based on these considerations, can be explicitly expressed in terms of the active nominal stress . Assuming is the principal branch of the Lambert function, given as the solution of the inverse function , the activation parameter is obtained as
| (17) |
(and its derivative with respect to , ), denotes the passive part of the first generalized invariant for uniaxial tension and are given in Equation (A5).
The active nominal stress accounts for the force‐stretch‐dependency through and for the force‐velocity‐dependency through . It further incorporates the term in which is the peak level of the active nominal stress, and is a dimensionless, normalized, time‐dependent function, such that
| (18) |
The total active force created by muscle motor units of type is calculated as the sum of the force responses at time weighted by the corresponding fraction in the muscle . then results from multiplication with the number of activated muscle units per unit reference cross‐section area according to
| (19) |
results from superposition of single twitches characterized by the experimentally observed microstructural quantities , , and . The twitch contraction time defines the time until the peak twitch force in the ascending phase of a single twitch response is reached [129, 130]. denotes the interstimulus interval. For a detailed explanation of the computation of , we refer to the original publication [48].
The stretch‐dependency is chosen as a function representing experimentally observed behavior. It depends on , the minimal fiber stretch at which myofilaments still overlap and , the fiber stretch associated to the maximal twitch force. Its mathematical description reads
| (20) |
For comparative reasons, the velocity‐dependency is neglected in this work and set to .
The derivation of the second Piola–Kirchhoff stress tensor has been published in [17]. For the reader's convenience, we provide the equation using our notation in Section A.1.2 of Appendix A. Similarly, the equations for the elasticity tensor are presented in Section S1.2 of the supporting information.
3.2.3. Active Strain Approach (ASA)
Based on the same incompressible model [48] as the compressible GASA‐approach [17] introduced in the previous section, Giantesio et al. [18] propose an active strain approach, here termed ASA. A common approach to enforce the incompressibility condition, that is, , is to add an additional contribution to the strain energy function that penalizes deviations from . To this end, we incorporate a volumetric penalty term similar to the coupled formulation in [17].
The active strain approach relies on a multiplicative decomposition of the deformation gradient into an elastic part , associated with the elastic deformation and an active part , resulting from an internal active deformation, such that . Considering the activation parameter , the active deformation gradient is defined as
| (21) |
The strain‐energy function is expressed in terms of the elastic Cauchy‐Green strain tensor instead of . With the elastic general invariants
| (22) |
the strain energy function thus reads
| (23) |
The computation of the activation parameter relies on the same two assumptions as mentioned for the GASA‐model. Consequently, is implicitly given as the solution of the equation
| (24) |
The generalized elastic invariants for uniaxial tension, and , are provided in Equation (A7), while their passive counterparts, and , are given in Equation (A5). The stretch‐ and time‐dependencies included in the above equation are formulated in the same fashion as for the GASA‐model, and are given in Equation (20) and (19), respectively. We apply a standard Newton–Raphson algorithm to determine from Equation (24).
Again, as a service to the reader, we present the derivation of the second Piola–Kirchhoff stress tensor in Section A.1.3 of Appendix A. Further, the derivation of the elasticity tensor is provided in Section S1.3 of the supporting information.
Since in the passive case , and thus and , the GASA‐ and ASA‐model coincide in absence of any activation. In the active case, the nominal stress in the fiber direction due to uniaxial loading along the fibers is identical. We recall, that both models determine the activation parameter such that the equation is fulfilled. Since and coincide, must also be equivalent.
3.2.4. A Modified Constitutive Description of Active Muscle Designed for Complex Musculoskeletal Models (GASAM)
Aiming to combine the optimal properties of the three material models proposed in the literature for our application, we introduce a fourth material model, referred to as the GASAM‐model. While the advantages of our modified model will be discussed in much detail in Section 3.3, we here present the constitutive equations. The GASA‐model from [17] serves as a basis. We perform two modifications:
We add the additional term , which takes into account the derivative , to in Equation (A6). A positive side effect of this modification is that can now be given by an explicit and computationally less expensive equation. For a detailed explanation, we refer to [18].
Instead of the elaborate calculation of via the superposition of the twitch forces, we use the smooth function . is now prescribed as a material parameter and specifies the amplitude of the tanh‐function.
The term is computed from the strain‐energy function in Equation (16) to
| (25) |
With the explicit formulation of the activation level in [18],
| (26) |
the derivative reads
| (27) |
The additional contribution to the elasticity tensor is provided in Section S1.4 of the supporting information. For a visual comparison between our modified model and the three models selected from the literature, we refer to Figure 2.
3.3. Comparison of the Selected Approaches
In the following, we analyze the presented material models and compare them considering the models' ability to represent physiological reality, their mathematical properties, resulting numerical challenges, and aspects of computational efficiency. Our goal is to assess the strengths and weaknesses of each model and, based on these theoretical aspects, provide a rationale for our preference for the modified material model.
3.3.1. Activation Concept
3.3.1.1. Physiological Representation and Mathematical Properties
In Section 2.2, we discussed the different activation concepts and assessed how well the models reflect physiological reality (consider the rheological representations in Figure 1). Comparing the four models against this background, the generalized active strain models (GASA and GASAM) stand out as the physiologically most plausible. They comprehensively represent the tissue structure and its mechanical properties, incorporating both serial elastic properties of the sarcomeres (titin filaments [106]) and the parallel elastic properties of the connective tissue [48, 97, 131]. The active stress model (ASE) accounts for the connective tissue's elasticity but neglects the sarcomeres' serial elasticity, while the active strain approach (ASA) captures the sarcomeres' active and passive elastic characteristics but disregards the connective tissues parallel contribution.
We have further outlined the mathematical properties associated with the different activation concepts in Section 2.2. As typical for the active strain approach, the ASA‐model's active strain‐energy function, preserves the elliptic properties of the underlying passive strain‐energy function, thereby ensuring well‐posedness of the associated balance equations (see [18] for a full discussion). For the ASE‐model, the active stress is not derived from a potential, as it becomes evident through the implicit definition of . Although we did not examine the model's elliptic properties in detail, we emphasize that the well‐posedness of the equilibrium problem is not given by construction, but depends on the specific active stress tensor.
3.3.1.2. Passive Material Model
Examining the passive material models, we find differences in the construction of the model equations and the parametric control of model properties. The ASE‐model separates the contributions for different loading modes, with the parameters , , and distinctively addressing along fiber shear, transverse fiber shear and along fiber tension. In our variant, the Neo‐Hookean contribution accounts for the isotropic ECM stiffness through the parameter . Conversely, the GASA‐, ASA‐, and GASAM‐model exhibit a more convoluted structure, where the parameters , , and describe the combined properties of anisotropic fibers and isotropic ECM. For the GASA‐, ASA‐, and GASAM‐model, the degree of anisotropy can be easily controlled through . The ASE‐model links the anisotropic invariant with several parameters, making it more challenging to control the level of anisotropy.
It could be argued that splitting the stress response into components associated with distinct loading modes (ASE‐model) simplifies fitting the model stress to experimental measurements. However, as further discussed in Section 4, fitting the combined stress response (GASA‐, ASA‐, and GASAM‐model) has also proven to be straightforward. Against this background, we do not prefer one material model over the other.
3.3.2. Activation Level
3.3.2.1. Implicit or Explicit Computation
In the ASA‐model, computing the activation parameter involves solving an implicit equation, introducing additional numerical challenges associated with the iterative solver, including the selection of step size and initial guess, as well as possible convergence problems. While we have not conducted specific tests to precisely determine its impact on the computation effort, we expect and experienced this to perform worse than an explicit computation. As is implicitly defined, its derivatives are approximated using central differences. Selecting an appropriate step size for the central differences scheme thus presents a manageable yet additional challenge.
For the GASA‐model, the activation parameter is explicitly given. However, its computation involves the principal branch of the Lambert W function, , which is defined implicitly. Here, the same considerations as above apply.
The GASAM‐model includes the additional stress contribution , which leads to a fully explicit expression for . This explicit computation of the activation level avoids potential difficulties associated with the application of iterative solvers and is computationally more efficient. Similarly, the ASE‐model formulae contain no additional implicit equations, and the same advantages are applicable.
3.3.2.2. Force‐Stretch‐Dependencies
A closer look at the active force‐stretch‐dependencies and in Figure 3 reveals some numerically problematic and physiologically unrealistic features. Due to the non‐smooth definition of the GASA‐, ASA‐, and GASAM‐model's stretch‐dependency in Equation (20), and, in conclusion, also the stress response is not continuously differentiable at . While this could potentially lead to numerical difficulties, such as convergence problems of the implicit solver when transitioning the critical point , we did not experience such issues. In contrast, the ASE‐model's stretch‐dependency in Equation (12) is continuously differentiable in the entire stretch regime. For values and , the stretch‐dependency , however, shows an unphysiological rise. The convergence to zero values for large fiber stretches and the absence of an active contribution for values below a certain minimal stretch is thus better captured by the GASA‐, ASA‐, and GASAM‐model's . We further note that is symmetric with respect to , whereas can represent non‐symmetric force‐stretch relations.
FIGURE 3.

Active force‐stretch dependencies in Equation (20) and in Equation (12).
For both and , the parameter represents the fiber stretch related to the maximal isometric active stress. In , the parameter describes the minimal fiber stretch at which muscle activity is observed—an experimentally measurable and interpretable quantity. In contrast, with , this value is preset to , which limits the options for adjusting the minimal actively contracting fiber length.
Apart from the active stretch‐dependency , the ASE‐model considers the passive stretch‐dependency (see Equation (13)) depicted in Figure 4. Similarly, this function is not continuously differentiable at . We further note that the parameter is a pure phenomenological quantity with no physiological meaning.
FIGURE 4.

Adapted passive force‐stretch‐dependency in Equation (13). The original in [32] is zero for .
3.3.2.3. Time‐Dependent Activation Functions
Figure 5 compares the time‐dependent activation functions and . While the superposition of individual twitch forces in the computation of for the ASA‐ and GASA‐model is crucial for observing the time‐dependent evolution of active forces at a millisecond scale, it can be disregarded for our application. Still, we acknowledge the use of physical, experimentally measurable, and well‐interpretable microstructural parameters in . Due to its lower computational expense, we opt for the time‐dependency proposed for the ASE‐model and adopted in the GASAM‐model for this application.
FIGURE 5.

Time‐dependent activation functions in Equation (19) and in Equation (11).
3.3.2.4. Consistency of Stress Tensor Derivation
Comparing the stress terms of the ASA‐ and GASA‐model in Equations (A9) and (A6), we notice that the ASA‐model's stress response considers the dependence of the activation parameter on the stretch in the stress derivation through the term . As already pointed out in [18, 108], the GASA‐model neglects this dependency. Our GASAM‐model explicitly accounts for this dependency through the term defined in Equation (25). Whether these terms should be included will be discussed below, considering mathematical and physiological aspects.
All four models are based on the assumption that muscle tissue behaves as a hyperelastic material. Within the mathematical framework of hyperelasticity, stresses are derived from an underlying strain energy potential (expressed through the strain energy density function). Given this fundamental assumption, it is mathematically consistent to include the additional stress term and . Neglecting these terms compromises the hyperelastic model's internal consistency and its inherent mathematical properties.
From a physiological perspective, the interpretation of and is less clear. and account for the dependence of the activation parameter on the stretch , or more generally speaking, the dependence of the active muscle force on the deformation. Active muscle force is generated by cross‐bridge formation between actin and myosin filaments. Modeling muscle as purely hyperelastic implies that these cross‐bridges store elastic energy. As long as the cross‐bridges remain intact, this assumption can be considered valid (see [132] for details on the elastic properties of the myosin head). Once actin and myosin filaments detach and slide past each other, elastic energy storage is no longer possible. Maintaining the cross‐bridge linkage requires metabolic energy (ATP), which a purely mechanical hyperelastic model cannot account for.
Neglecting the terms and means that in the strain energy density function, the activation parameter is regarded as constant and, as such, deformation‐independent. As a result, the active muscle contribution is treated as not storing elastic energy. Physiologically, this would imply that the intact cross‐bridges are considered inelastic. Even though the cross‐bridge elasticity and the metabolic energy required to sustain the linkage could balance each other out, we do not have enough certainty to conclude that.
Consequently, we opt to incorporate the terms and (as done for the GASAM‐model) such that the model remains mathematically consistent within the assumption of hyperelasticity. Still, neglecting the metabolic energy contributions remains a limitation that a purely hyperelastic model cannot overcome.
3.3.2.5. Numerical Treatment of Singularities
Circumventing the singularities in the computation of the ASE‐model invariant's derivative, mentioned in Section 3.2.1, involves adding a small numerical contribution. While this is considered to not affect the solution to a considerable extent, it is not particularly elegant.
3.4. Discussion
In the following, we provide an interim summary outlining our rationale for favoring the GASAM‐model based on the theoretical aspects discussed and address the remaining limitations.
We believe the GASAM‐model strikes a balanced trade‐off between physiological plausibility, mathematical consistency, and computational efficiency. We consider the employed generalized active strain approach physiologically more plausible than the active stress and active strain approaches used by the ASE‐ and ASA‐models. Unlike the GASA‐model, the GASAM‐model explicitly includes the term , ensuring the deviation is consistent with the underlying assumption of hyperelasticity. Further, the GASAM‐model offers an explicit expression for the activation parameter, which is computationally less costly and avoids the challenges associated with the implicit computations seen in the GASA‐ and ASA‐models. Compared with the GASA‐model, the GASAM‐model uses the computationally cheaper yet sufficiently accurate time‐dependency . Additionally, the force‐stretch dependency correctly captures the decay of active force at large stretches and its absence below a minimal stretch (unlike the function used by the ASE‐model). Finally, minor numerical issues, such as the singularities observed in the ASE‐model, are not a concern.
Despite the advantages of the proposed GASAM‐model, some limitations remain. As we focused on purely hyperelastic approaches, we neglected viscous phenomena and history‐dependent activation properties, such as force enhancement and depression. Depending on the particular problem, these effects can be of significant influence and may need to be incorporated into the model (see, e.g., [89]). Additionally, metabolic processes associated with muscular activation are not captured by a purely hyperelastic modeling approach. Mixed active‐stress active‐strain approaches were not investigated, though they may offer a more physiological description of the dual mechanisms of active stress transmission in skeletal muscle.
4. Material Parameter Identification
The material parameters provided in the original publications were determined based on experimental data that differed across the publications. To establish a basis for comparison between the four materials, we fit their parameters to a common set of experimental stress–strain data. One load case is generally not enough to uniquely determine the material response. Unlike the original publications, we thus consider multiple active and passive load conditions to determine a unique set of parameters representing the experimentally observed data. To this end, we compute the analytical stress as a function of a given deformation and use this function to fit the material parameters to the experimental stress–strain curves. The material models are implemented into the solid finite element framework of the comprehensive and well‐tested open‐source research simulation code 4C (implemented in C++) [133]. For verification purposes, we compare the numerically calculated stress responses with the analytical solutions.
4.1. Experimental Data and Associated Load Cases
The experimental data serving as a basis for the subsequent fitting of the material parameters was selected according to the following criteria. If available, we preferably chose human specimen data. Since we are interested in the continuum mechanical characteristics rather than the behavior of isolated fibers, we only consider muscle tissue sample data for the fitting. To ensure the comparability of experimental results across different load cases, we use data obtained at comparable quasi‐static strain rates ().
In total, data corresponding to six different load cases is incorporated into the fitting. Table 3 gives an overview of the load cases and their abbreviations, the respective literature reference, and whether the data was obtained in the active or passive muscle state. While the passive muscle material behavior is fitted to data representing all six load cases, the active response is fitted solely to data obtained from uniaxial tension along the fiber direction. To the best of our knowledge, unfortunately, there is no published data testing the active muscle response in load cases different from uniaxial tension.
TABLE 3.
Experimental data used in the parameter fitting: Load case, muscle state, abbreviation, and reference.
| Abbreviation | Load case | State | Reference |
|---|---|---|---|
| UTCAF | Uniaxial tension and compression along fiber direction | Active | [134] |
| Passive | [135], mean of supraspinatus and deltoid measurements | ||
| UTCTF | Uniaxial tension and compression transversal to fiber direction | Passive | [14] |
| SAF | Simple shear along fiber direction | ||
| PSAF | Pure shear along fiber direction | Passive | [136], mean of measurements of differently sized samples |
| PSTF | Pure shear transversal to fiber direction | ||
| PSTIF | Pure shear transversal to isometrically constrained fibers |
With the muscle fibers aligned in the e 3‐direction, the deformation gradients corresponding to the aforementioned load cases are listed in Table 4.
TABLE 4.
Load cases and associated deformation gradients for which the stress response is computed analytically and numerically during the material parameter fitting.
| UTCAF | UTCTF | SAF | PSAF | PSTF | PSTIF | ||||||||
|---|---|---|---|---|---|---|---|---|---|---|---|---|---|

|

|

|

|

|

|

|
|||||||
|
|
|
|
|
|
|
|
Note: The cubes' dimensions are with , and the geometry is discretized using one linear hexahedral element. Muscle fibers are aligned in e 3‐direction and indicated in red. The deformation is expressed in terms of the stretch and the shear (only for SAF). The Dirichlet boundary conditions enforcing the respective deformation in the simulation are detailed in Table A1 in Appendix A.
The experimental data used in this study originates from different publications with variations in, for example, the experimental test setup, the tested species, or the specimen size and constitution (intact muscle [134] vs. tissue samples [14, 135, 136]). Although we have made efforts to select comparable data, the experimental data may exhibit inconsistencies compared with a dataset where all load scenarios were investigated under a unified experimental setup. While such a dataset would offer greater consistency, to the best of our knowledge, it is unfortunately unavailable. Given these variations, we are cautious about drawing overly strong conclusions considering the alignment of the model responses with the experimental data and focus on comparing the model responses to one another.
4.2. Analytical Stress–Strain Responses
As noted in [17] and [15], the compressible and incompressible formulation of the material models described in Section 3 coincide for the case that the incompressibility parameters and , respectively, approach infinity. In contrast to the nearly incompressible formulations presented in Section 3, for an analytical interpretation, we consider the fully incompressible formulations as also given in [18] for the ASA‐model and in [48] for the GASA‐model. The fully incompressible formulation of the ASE‐model is obtained as the isochoric contribution with the unmodified strain measures and invariants. In the simulation, we then apply appropriate incompressibility parameters and to recover the close‐to incompressible state.
With the deformation gradients for the six load cases in Table 4, we derive the first Piola–Kirchhoff stress in the respective load direction. The analytical expressions are provided in Table A2 in Appendix A. Analyzing the equations highlights the importance of using multiple load modes for the fitting of the passive material parameters. As an example, fitting the ASE‐model to experimental data solely obtained from UTCAF would result in arbitrary values of the parameters and , as those do not appear in the corresponding equation in Table A2.
4.3. Parameter Identification Through a Least‐Squares Fit
We fit the material parameters of these analytical stress–strain responses to the experimental data in Table 3 by solving a least‐squares minimization problem. For this purpose, we employ the Trust Region Reflective algorithm [137] implemented in the scipy.optimize.least_squares method from the Python SciPy library (version 1.7.2) [138]. For the interested reader, bounds and initial guesses for the optimization parameters are provided in Section S2 of the supporting information.
Since the experimental data for the active load case UTCAFact was obtained under isometric conditions at a tetanic activation level [134], the time‐dependent activation functions and are set to . This also means that the parameters involved in the computation of and cannot be determined from the experimentally determined stress–strain curves. Still, the active parameters , , , and in are physically measurable micromechanical quantities whose values we adopt from [48]. To create a comparable time‐dependent activation function , its parameter , governing the time‐dependent rise of the activation, is set to match the slope of . Figure 5 shows the two normalized functions.
4.4. Results
Table 5 lists the parameter values obtained from the fitting and the literature. The experimental data and the analytical and computational results are shown in Figures 6 and 7 for the passive and active load cases, respectively. Table A3 in Appendix A lists the computed error measures.
TABLE 5.
Material model parameters fitted to the experimental data listed in Table 3.
| ASE | GASA and ASA | GASAM | |||||||||
|---|---|---|---|---|---|---|---|---|---|---|---|
|
|
0.1000 | kPa |
|
2.3796 | — |
|
2.3796 | — | |||
|
|
0.0500 | kPa |
|
0.5161 | — |
|
0.5161 | — | |||
|
|
3.6055 | — |
|
27.1072 | kPa |
|
27.1072 | kPa | |||
|
|
4.4883 | — |
|
0.6388 | — |
|
0.6388 | — | |||
|
|
10,000 | kPa |
|
1000 | — |
|
1000 | — | |||
|
|
1.2264 | — |
|
1.1806 | — |
|
1.1806 | — | |||
|
|
1.4000 | — |
|
0.5680 | — |
|
0.5680 | — | |||
|
|
1.1450 | kPa |
|
0.4619 | mm−2 |
|
64.6809 | kPa | |||
|
|
69.5471 | — |
|
2.5, 4.4, 76.8 | 0.001 N |
|
34.4017 | — | |||
|
|
34.4017 | — |
|
0.02, 0.011, 0.011 | s | ||||||
|
|
10 | kPa |
|
0.004, 0.004, 0.004 | s | ||||||
|
|
0.05, 0.29, 0.66 | — | |||||||||
Note: , , , and are considered fixed and adopted from [48]. is set to match the slope of .
FIGURE 6.

Passive stress‐stretch responses with fitted parameters for six different load cases alongside the experimental data listed in Table 3. Results of the analytical equations are plotted alongside the numerical results. The obtained curves overlap because the results are nearly identical.
FIGURE 7.

Active stress‐stretch responses with fitted parameters for six different load cases. For the sake of a better visibility, the plotting resolution is chosen such that only the twitch maxima are depicted for the ASA‐ and GASA‐model. Since in the active case only experimental data from uniaxial tension in the fiber direction was used for the parameter identification, the remaining load cases show solely the numerically obtained stress–strain response.
As expected, the nearly incompressible formulations used in the simulation coincide with the analytical incompressible responses for the chosen incompressibility parameters. Further, as designed, the passive responses for the GASA‐, ASA‐, and GASAM‐model coincide.
4.4.1. Goodness of Fit
As mentioned, we keep the evaluation of the goodness of fit concise and refer to Section A2.2 of Appendix A for a full quantitative analysis of the models' alignment with experimental data.
Qualitatively, all material models approximate the experimental data reasonably well. An exception is the UTCTF load case in tension. Contrary to the experimental data, which suggests a stiffness increase for rising stretches, the fitted stress responses flatten. Quantitatively, the accuracy of different models in representing the experimental data varies depending on the specific load scenario and stress–strain range.
4.4.2. Differences Between the Model Stress Responses
Where no experimental data was available, the stress responses of the different material models are—to no surprise—different. Although qualitatively, the model responses are comparable, quantitatively there are major differences.
First, we evaluate the results for passive muscle. For compressive states of UTCTF and tensile states of PSTIF, the ASE‐model behaves slightly stiffer than the other models. The opposite is true for compressive states of UTCAF. Differences between the material models for tensile states of PSAF and PSTF are minor.
Considering the active muscle behavior, we observe significant differences between the computational material model responses for PSTIF, SAF, and compressive states of UTCTF. In all three cases, the ASE‐model behaves the least stiff, followed by the ASA‐model. Contrarily, deviations between the material model responses are comparably small for UTCTF in tension, PSAF, and PSTF.
4.5. Discussion
Recalling that the experimental data originate from multiple publications with potential variations in the experimental conditions, we consider all models to provide reasonable quantitative approximations. While all models fail to capture the increase in stiffness with rising stretches for the passive UTCTF load case in tension reported by [14], it is worth noting that other experimental sources report a decrease in stiffness with increasing stretches [139, 140], which would align more closely with the model predictions.
Differences between the ASE‐model response and the other three are partly explained by the non‐matching passive material model responses. Deviations between the GASAM‐ and GASA‐model are caused by the additional stress term . Since all active material parameters can be uniquely fitted through the UTCAF load case, we rule out the possibility that the differences are due to random, undetermined parameters. Instead, the remaining differences are attributed to the use of different activation concepts. Specifically for the active SAF load case, the results presented in [98] support our hypothesis. The authors report that active stress and active strain concepts yield different results in shear, even when both fit uniaxial tension data. Consistent with our findings, they observe that the active stress model predicts lower stresses than the active strain model.
Considering the ability to represent the experimental data, we rate no single material model universally superior to the others. Further experimental evidence is necessary to determine which model more accurately represents reality. The verification of the passive material response could be extended by experimental data from additional load cases, such as planar biaxial loading [141]. While multiple load cases for the passive muscle were considered, only uniaxial compression/tension tests were used for the active muscle. Experimental measurements of transverse and shear stress‐stretch responses for active muscle tissue would provide further insights into which material model yields the physiologically most accurate predictions.
5. Numerical Examples
To demonstrate the applicability of the material models to biomechanically relevant scenarios—in particular human shoulder biomechanics—and investigate the material behavior using the fitted parameters, we consider three numerical examples: A simple fusiform muscle, a two‐component model consisting of one bone and one muscle, and a full human shoulder model. Simulations are again conducted using 4C [133].
5.1. Fusiform Muscle Contraction
5.1.1. Geometry and Mesh
In the first step, we consider the geometry of a fusiform muscle with length in the e 3‐direction and a circular cross‐section with varying radius as depicted in Figure 8a. The outer contour along the e 3‐axis is described by spline curves through the points , , and such that the muscle's radius increases from at the ends to at its center. We choose , , and . With reported mean cross‐section areas of [142], [143], and [144], and lengths of [145], those measures approximately represent an average‐sized teres minor muscle.
FIGURE 8.

Fusiform muscle geometry, mesh, and fibers.
We use Cubit 13.2 [146] to create linear hexahedral element meshes with three different refinement levels as specified in Table 6 and shown in Figure 8c. To prevent the occurrence of locking phenomena, we apply the F‐bar element technology [147].
TABLE 6.
Mesh quantities of the fusiform muscle geometry for different refinement levels.
| Refinement level | Number of elements | Number of nodes | ||
|---|---|---|---|---|
| Circumferential | Longitudinal | Total | Total | |
| 1 | 24 | 20 | 1920 | 2289 |
| 2 | 48 | 40 | 15,360 | 16,769 |
| 4 | 96 | 80 | 122,880 | 128,385 |
Note: The number of elements in the circumferential direction is counted along the intersection .
Similar to [148], we compute the normalized elementwise fiber direction as the solution of the Laplacian problem on the muscle domain with Dirichlet boundary conditions prescribed on the outer muscle boundary surface (excluding the origin and insertion surfaces and ). is determined using a rule‐based approach, according to which the fiber vectors describe a continuous path from to and are tangential to . Figure 8b shows the resulting fiber directions .
5.1.2. Simulation Scenarios
We simulate two physiologically relevant scenarios: an isometric contraction and a free concentric contraction. In an isometric contraction, activation leads to a change in tension while the muscle length remains constant. Isometric contractions are responsible for holding tasks and support in the musculoskeletal system and therefore play a crucial role in stabilizing the shoulder joint. In a free concentric contraction, the produced active forces cause a muscle shortening since no external forces act against the contraction direction. Concentric contractions thus generate motion.
In the isometric contraction scenario, we apply Dirichlet boundary conditions to fix both lateral ends to zero displacement in all three coordinate directions. For the free contraction, we fix the origin surface to zero displacement in all three directions. To mimic the attachment of muscle‐tendon complexes to bone (here, we only model the muscle), we ensure no relative displacement occurs between the insertion surface nodes. Hence, on the insertion surface, we prescribe zero Dirichlet conditions in the e 1‐ and e 2‐directions and multipoint constraints in the e 3‐direction. The zero Dirichlet conditions ensure that the insertion surface nodes remain fixed in‐plane, while the multipoint constraints ensure that the insertion surface nodes displace uniformly in contraction direction.
For both contraction scenarios, activation is prescribed by the introduced time‐dependent activation functions and , as illustrated in Figure 5 and defined in Equations (19) and (11).
We restrict the analysis to the quasi‐static case and neglect inertia effects. The simulations are repeated for the three mesh refinement levels in Table 6 and the four material models introduced in Section 3 with the parameters in Table 5.
To determine an appropriate incompressibility parameter value for the simulation of the larger scale problems presented in the subsequent sections, we repeat the simulations for different parameter values. Further explanations and the results of our study are presented in Section A.3.3 of Appendix A.
5.1.3. Simulation Results
As discussed in more detail in Section A.3.2 of Appendix A, the results for the three mesh refinements exhibit no significant qualitative differences and only slight variations in quantity. We thus focus our evaluation on the results obtained with mesh refinement .
First, we compare quantities on the global level. For the isometric contraction, the muscle force is computed as the surface integral of the Cauchy stress over the central cross‐section area at in the current configuration. For the free contraction, the stretch ratio serves as a measure of the percentage change in length and is evaluated as . Results are displayed in Figure 9 over time .
FIGURE 9.

Simulated muscle force and stretch ratio for an isometric and a free contraction of the fusiform muscle ().
Second, we analyze local deformations and stress distributions. We evaluate the fiber stretch , the Cauchy stress in fiber direction , and, as a measure for the combined stress, the von Mises stress . For the isometric contraction, results are visualized in the final deformed configuration ( in Figure 10, in Figure 11, and in Figure S1 of the supporting information). Results of the free contraction are shown at three selected points in time ( in Figure 12, in Figure 13 and in Figure S2 of the supporting information). Since the conclusion drawn from the investigation of and align, we focus on a thorough examination of .
FIGURE 10.
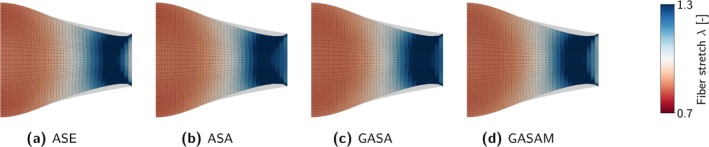
Fiber stretch in the axial cross‐section of the fusiform muscle () for an isometric contraction in the tetanized state at . The initial configuration is displayed in gray. Only half the symmetric muscle is visualized.
FIGURE 11.

Cauchy stress in fiber direction in the central cross‐section (top) and in the axial cross‐section (bottom) of the fusiform muscle () for an isometric contraction in the tetanized state at . The initial configuration is displayed in gray. Only half the symmetric muscle is visualized.
FIGURE 12.

Fiber stretch for a free contraction of the fusiform muscle () at selected times. Results are visualized on the surface (top) and in the axial cross‐section (bottom) in comparison to the initial configuration (gray).
FIGURE 13.

Cauchy stress in fiber direction for a free contraction of the fusiform muscle () at selected times. Results are visualized on the surface (top) and in the axial cross‐section (bottom) in comparison to the initial configuration (gray).
5.1.3.1. Isometric Contraction
The isometric muscle force increases over time up to the tetanic force maximum (see Figure 9). Between the investigated material models, the computed force maxima are close to equal (, , , and ). The highest force maximum varies by from the lowest force maximum . For the ASA‐ and GASA‐model, the separate force peaks caused by the superposition of the individual twitches in are clearly visible. Due to the use of the smooth function , the force increases continuously for the ASE‐ and GASAM‐models. A detailed look at the stress distribution in the radial direction (in the center cross‐section), reveals that is more evenly distributed for the ASE‐ and ASA‐models, while the GASA‐ and GASAM‐models reveal a larger radial gradient (see Figure 11). A closer inspection of over the entire continuum in Figure A1 in Appendix A confirms those small deviations.
In the following, we provide a brief explanation as to why the muscle forces coincide while the distributions of the stress vary. Due to the e 1‐e 2‐symmetry, the central cross‐section at does not deform in e 3‐direction and fibers remain aligned in e 3‐direction. Consequently, equals , and equals the force acting in fiber direction (i.e., the total muscle force). According to the force‐stretch dependency, depends on the fiber stretch . , in turn, is not solely determined by the material model's active and passive stiffness in fiber direction but is rather a result of the complex three‐dimensional deformation state. Because the material models exhibit different stiffnesses to shear and deformations transverse to the fiber direction, the distribution of differs, even though stiffnesses in compression and tension along the fiber direction coincide (see Figure 7a in the relevant stretch ratio range ). Since the incompressibility assumption limits the transverse expansion, and the isometric constraint restricts the overall deformation in the e 3‐direction, in this case, differences in the deformation and stress distribution are not very pronounced. Integrated over the cross‐section, the remaining differences in balance out such that the calculated forces are close to equal. For other load cases, where shear or deformation transverse to the fiber direction is more pronounced, the muscle force may vary considerably more among the models.
The local distribution of fiber stretches and stresses in the axial direction does not differ noticeably between the four models (see Figures 10 and 11, respectively). In all cases, the muscle center is compressed (), while the origin and insertion regions, where the deformation is constrained by Dirichlet conditions, are stretched (). The observed stress is positive in the entire continuum, with values increasing toward the lateral ends. It may seem counterintuitive that although we observe compressive and tensile deformation states, is always positive. Yet this is easily explained: In contrast to a purely passive material, compression and tension are not specifically related to stresses smaller and larger than zero. Instead, the active contribution shifts the root of the stress–strain curve toward stretches (see Figure 7a). Accordingly, positive stress may occur even for compressive stretches.
5.1.3.2. Free Contraction
During the free contraction, as expected, the deviation from the reference stretch ratio increases with increasing activation, that is, the muscle shortens (see Figure 9). For the ASA‐, GASA‐, and GASAM‐models, the total shortening is close to equal (considering the minimal stretch ratios , , and ). In comparison, we observe a higher shortening for the ASE‐model with a minimal stretch ratio .
To explain this observation, we consider two factors: different minimal active fiber stretches and different passive resistances in compression. First, the models use different force‐stretch dependencies associated with different minimal fiber stretches . For , the generated active contribution is zero. While for the GASA‐, ASA‐, and GASAM‐model , this value is for the ASE‐model. Hence, the ASE‐model generates active stresses even for lower fiber stretches such that a larger muscle contraction is to be expected. Second, the ASE‐model exhibits a lower passive resistance against compression in fiber direction (see Figure 6a). Both these effects accumulate in the active stress response (see Figure 7a). Consider the free contraction of a simple unit cube. In the absence of body forces and external loads, the system is in static equilibrium when it is in its stress‐free state. Considering the stress‐stretch response for UTCAF in Figure 7a, the ASE‐model reaches a stress‐free configuration when while this is the case for for the GASA‐, ASA‐, and GASAM‐models. Of course, stress states are more complex for the three‐dimensional fusiform muscle geometry, but this simple analogy explains the observed differences in total shortening well.
In three dimensions we observe the expected compression along the fiber direction ( in the entire continuum) and the related transverse expansion. Qualitatively, the distribution of and is similar for all material models (see Figures 12 and 13). As for the isometric contraction, we observe slight variations that can be attributed to different stiffnesses in shear and compression transverse to the fiber direction. Quantitatively, and are lower for the ASE‐model, for the reasons already explained.
5.1.4. Discussion
In principle, all material models, including the proposed GASAM‐model, are suitable for simulating physiologically plausible muscle contractions.
However, we observe variations in the local deformations and stress distributions across the models. Depending on the specific application, these variations may be negligible, for instance, if solely the movement of an adjacent bone is of interest, which is determined by the global muscle contraction. In more complex scenarios, such as a biomechanical analysis of the shoulder joint, this is likely not the case. Here, the local material characteristics certainly affect the interactions between the involved components, and complex geometries may amplify the variations.
Without additional experimental data, particularly regarding the active stiffness (e.g., transverse to the fiber direction or due to shear load), it is impossible to identify the material model that provides the most accurate predictions. Revisiting the theoretical and modeling arguments presented in Section 3.4, we conclude that, at this stage, the GASAM‐model remains the most favorable option for our application.
5.2. Spatiotemporally Varying Activation and Contact Interactions in a Muscle–Bone Model
As an intermediate step toward applying the modified and improved GASAM‐material model in a full continuum‐mechanical model of the human shoulder, we first consider a simplified model involving two components: the humerus bone and the deltoid muscle. The deltoid serves as the prime mover during arm abduction, thereby lifting the humerus away from the body. Inspired by this scenario, we simulate the deltoid's contraction while accounting for the contact interaction between the two components.
5.2.1. Geometry and Mesh
Our model is based on the humerus and deltoid geometries (data version 4.3) provided by the BodyParts3D database [149]. Further smoothing operations and geometry adaptations are performed using Materialise 3‐matic [150]. Both parts are meshed separately using Gmsh (version 2.12.0) [151]. We convert the obtained linear tetrahedral elements to quadratic tetrahedrons with a custom Python script, resulting in a total of 195,189 nodes and 127,019 elements. To compute the muscle fiber directions , we follow the same approach as described for the fusiform muscle example.
5.2.2. Simulation Scenario
To simulate the ball‐and‐socket‐type glenohumeral joint, we fix the center node of the humeral head in space. We fix the deltoid's origin surface nodes and apply tied constraints to connect the deltoid's insertion surface nodes to the humerus. Considering potential contact between the deltoid's and humerus' outer surfaces, we apply a penalty regularization strategy for constraint enforcement.
The humerus bone is modeled using a linear St. Venant‐Kirchhoff relation with Young's modulus , consistent with values reported in the literature (see [152, 153]). For the deltoid muscle, we use the GASAM‐model and the parameters specified in Table 5 (except ).
During a physiological muscle contraction, activation is generally not uniform throughout the muscle, but varies in different locations (spatially) and over time (temporally) [154, 155, 156]. To model such complex activation patterns, we replace the time‐dependent activation by a discrete function that defines an activation scaling factor for each element and discrete time . Prescribing these activation scaling factors for each element and simulated time step allows us to model spatiotemporally varying activation.
As a proof of concept, we generated an artificial spatiotemporally varying activation pattern. Figure 14a shows the scaling factors applied in this scenario at four distinct points in time. While activation increases over time, the region of maximal activation progresses from the spinal deltoid toward the acromial deltoid.
FIGURE 14.

Simulation results at selected points in time for a spatiotemporally varying activation in a two‐component model of the humerus bone and deltoid muscle. (a) The activation scaling factor is prescribed element‐wise. Starting from the spinal part of the deltoid (right), the activation increases over time and moves toward the acromial part (center). (b) The simulated contraction of the deltoid causes an abduction of the humerus in the spinal direction (c) As the humerus is abducted in the spinal direction, the clavicular part of the deltoid is drawn toward the humeral head, leading to contact between the muscle and bone.
As with the fusiform muscle example, we perform a quasi‐static simulation and neglect inertia effects.
5.2.3. Simulation Results
As a measure for the combined strain, we evaluate the von Mises strains . The results are shown in Figure 14b in the deformed configurations corresponding to the activation patterns presented in Figure 14a. Over time, increasing activation in the spinal part of the deltoid causes the muscle to contract, resulting in the humerus being lifted in the spinal direction. A closer inspection reveals that rising activation in the deltoid's acromial region also induces a slight rotation of the humerus toward the acromial part. As expected, areas with higher activation experience greater strains.
Through the abduction of the humerus in the spinal direction, the clavicular part of the deltoid is pulled toward the humeral head. At , the muscle and the bone first make contact. Figure 14c illustrates the resulting normal contact stresses at when the contact area is at its maximum.
5.2.4. Discussion
This example demonstrates a first application of the modified material model in a simple musculoskeletal system, which also accounts for contact interactions between the components. In contrast to the spatially uniform activation up to a fused tetanus described in the original publications, we present an approach to incorporate complex activation patterns—as observed in reality—into the material model. While the activation prescribed in this study is yet an artificial pattern, future work can integrate real‐life EMG activation measurements to enable physiologically representative simulations.
5.3. Dynamic Stabilization of the Shoulder Through Rotator Cuff Contraction
As initially outlined, our primary goal is to identify a constitutive law suitable for modeling muscle tissue in a continuum mechanical shoulder model. To demonstrate the applicability of the adapted GASAM‐model in such a scenario, we present a third numerical example. For this purpose, we use a self‐created FE model comprising the skeletal structure and the essential muscles surrounding the glenohumeral joint.
As motivation for our simulation, we consider the concavity compression mechanism of the glenohumeral joint. Concavity compression is a dynamic stabilizing mechanism in which the active rotator cuff muscles tightly compress the humeral head against the glenoid fossa, thereby increasing resistance against translating forces [157, 158, 159, 160]. In the following, we simulate such a contraction of the rotator cuff and the resulting contact between the glenoid fossa and the humeral head.
5.3.1. Geometry and Mesh
The Visible Human Project [161] provides an image data set of cross‐sectional cryosections of a human male and female cadaver. We select the male data set for the manual segmentation with Materialise Mimics/3‐matic [150] as individual components appear more clearly distinguishable.
Our segmented model includes the shoulder joint's bones (humerus, clavicula, and scapula), the cartilaginous glenoid labrum, the three‐part deltoid muscle (deltoideus spinalis, acromialis, and clavicularis), and the rotator cuff muscles, that is, the teres minor, infraspinatus, supraspinatus, and subscapularis. In this example, we omit the clavicula and treat the three‐part deltoid as one continuum, by connecting the individual parts via shared nodes.
All anatomical parts are meshed separately with Gmsh (version 2.12.0) [151]. Scapula and labrum are meshed as one entity and thus coupled via shared nodes. We convert the created linear tetrahedral elements to quadratic tetrahedrons using a custom Python script. In total our model comprises 659,901 nodes and 448,858 elements. As for the fusiform muscle example, we compute the normalized muscle fiber directions as the solution of the Laplacian problem. Figure 15 depicts the model and the computed fiber directions.
FIGURE 15.

Shoulder model with fiber directions indicated by white arrows. The geometry is meshed with quadratic tetrahedral elements and comprises 659,901 nodes and 448,858 elements in total. The clavicula is not simulated in this example and is hence displayed unmeshed.
5.3.2. Constitutive Descriptions
Muscles are modeled with the GASAM‐material and the parameters identified in Section 4. By scaling the time‐dependent activation function by , we prescribe the rotator cuff's activation to of the tetanic level. The activation is spatially uniform across the muscle. The deltoid remains passive. For the stiff bones, we use a Young's modulus within the ranges reported in the literature [152, 153]. To model the much softer labrum, we apply a lower Young's modulus (see [162]). The mass densities are chosen to align with literature values (see [163] for muscle, and [164] for the labrum). The bone mass density is computed based on literature data available for the humerus as described in detail in Section A.4.1 of Appendix A. Table 7 provides a summary of the defined constitutive descriptions and parameters.
TABLE 7.
Material models and parameters defined for the concavity compression simulation.
5.3.3. Boundary, Contact, and Meshtying Conditions
To fix the structure in space, zero Dirichlet boundary conditions are prescribed to the inner nodes of the scapula volume and the muscle's origin surfaces (where they connect to scapula and clavicula).
The FE meshes of the individual muscles are tied to the FE meshes of the humerus at the respective insertion surfaces via tied constraints. In contrast to coupling via shared nodes, this approach allows connecting dissimilar meshes, such that the mesh size of each anatomical part can be chosen individually and is not constricted to the mesh size of adjoining parts.
To prevent penetration and account for three‐dimensional interactions between individual components, we prescribe frictionless contact (Karush–Kuhn–Tucker conditions) for muscle–bone, muscle–muscle, and bone–bone surface pairs. For simplification reasons, contact between the individual rotator cuff muscles is neglected. Contact and tied constraints are enforced using a penalty regularization approach.
A comprehensive description of the surfaces defined for the application of the boundary conditions is provided in Figure A4 and Table A4 in Appendix A. Surfaces fixed by Dirichlet conditions are summarized in Table A5, and meshtying and contact surface pairs in Tables A6 and A7, respectively.
5.3.4. Solution Strategy
We apply the Generalized‐alpha time integration method in combination with a standard Newton–Raphson scheme to solve the nonlinear structural dynamics problem. The resulting linear system of equations is solved iteratively using the Generalized Minimal RESidual method (GMRES) in combination with an algebraic multigrid preconditioner, implemented in the software packages Trilinos Belos [165] and Trilinos MueLu [166, 167], respectively.
We simulate 160 time steps with a step size of on 64 Intel Xeon E5‐2630 v3 processors (12 cores, 2.5 GHz, 64 GB RAM) of our Linux cluster.
5.3.5. Simulation Results
The total computation time amounts to . The evaluation of the implemented material routines takes . Approximately of the total time is spent on the contact search. Given that the code is still under development and has not yet been optimized, there is significant potential to improve performance and drastically reduce computation time.
Figure 16 shows the simulated displacements at selected points in time. As expected, the rotator cuff's activation causes the muscles to contract. As a result, the humeral head is pulled toward the glenoid fossa, and the joint space closes.
FIGURE 16.

Displacement magnitude at selected points in time for the simulation of rotator cuff activation in a model of the human shoulder. For visualization purposes, the deltoid muscle is displayed transparently. The rotator cuff muscle contraction pulls the humeral head medially toward the glenoid fossa such that the joint space closes.
As a measure for the three‐dimensional stress distribution, we evaluate the von Mises stress in Figure 17. Over time, stresses in the activated rotator cuff increase. Since the rotator cuff deforms only slightly, we conclude that the resulting stresses are primarily caused by muscular activation. Contrarily, stresses in the passive deltoid muscle exclusively develop due to its deformation and thus are close to zero.
FIGURE 17.

Von Mises stresses at selected points in time for the simulation of rotator cuff activation in a model of the human shoulder. For visualization purposes, the deltoid muscle is displayed transparently. (a, b) Increasing rotator cuff activation causes increasing stress in the muscle continuum. (c) Once the glenohumeral joint space closes, contact stresses develop between the glenoid fossa and the humeral head.
Initial contact between the humeral head and the glenoid fossa is made at . With ongoing time and a steadily growing pulling force of the rotator cuff, the contact area and the normal contact stresses increase, as depicted in Figure 18. Consequently, the normal contact force , evaluated as the integral of over , rises as well, see Figure 19. Interestingly, Figure 18 further shows that the contact area is not central in the glenoid fossa as one might expect but instead shifted to the posterior part.
FIGURE 18.

Normal contact stresses visualized on the glenoid fossa surface. After initial contact with the humeral head at , the contact area and normal contact stress increase due to the continuous contraction and associated pulling force of the rotator cuff.
FIGURE 19.

Evolution of the normal contact force and the associated contact area between glenoid fossa and humeral head over time.
5.3.6. Discussion
Due to a lack of suitable validation data, we here refrain from conducting an in‐depth quantitative analysis. Our presented results are qualitatively plausible and showcase the applicability of the modified GASAM‐material model within a large‐scale continuum‐mechanical shoulder model. However, a few points merit further discussion.
As mentioned, the contact area is shifted to the posterior part of the glenoid fossa. One possible explanation is that the activation of the posterior rotator cuff muscles (teres minor and infraspinatus)—and thus the generated active force—may have been overestimated, while the activation of the anterior rotator cuff muscle (subscapularis) may have been underestimated. In our model, we uniformly activate the rotator cuff muscles with the same activation level, which may not fully reflect the actual physiological conditions. Incorporating spatiotemporally varying activation patterns (as already demonstrated for the muscle–bone model in Section 5.2) based on real‐life (EMG) measurements would enhance the accuracy of the predictions. Another possible explanation is that passive structures, such as ligaments or the joint capsule, are not included in the current shoulder model. These structures help maintain the proper positioning of the humeral head within the glenoid fossa and could prevent the observed posterior shift. Including these passive components in the model is an essential next step to enhance the reliability of our predictions.
We applied the proposed active muscle material model in a simulation of the shoulder model with relatively modest (contractile) deformation and movement. Further investigations are imperative to ascertain if the material model (with the identified parameters) is suited to simulate broader ranges of motion in a physiologically plausible manner. A comparison of the resulting three‐dimensional deformations and stresses against dynamically acquired image data (e.g., dynamic MRI, shear wave elastography measurements) can help uncover potential drawbacks.
The presented continuum shoulder model already incorporates various physiologically relevant anatomical components, contact interactions, and material properties. However, there is potential for even further improvement in achieving a more accurate and realistic representation of the shoulder complex. Possible enhancements include the incorporation of tendons and ligaments, image data‐based fiber architectures, and more sophisticated boundary conditions (e.g., to account for scapulothoracic gliding). Further improvements involve accounting for the involved muscles' inherent pre‐stress or pre‐stretch states and incorporating frictional contact properties between the components.
6. Conclusions
The objective of this work was to identify a constitutive model that accurately represents both active and passive muscle characteristics within continuum‐mechanical models for complex musculoskeletal systems, particularly for the human shoulder. Therefore, we conducted a comprehensive review of active skeletal muscle constitutive laws and identified the commonly used activation concepts: active stress, active strain, generalized active strain, and mixed active‐stress active‐strain.
Corresponding to the first three concepts, we selected three material models (ASE, GASA, and ASA) from the reviewed literature and proposed a fourth material model (GASAM), combining their most promising features. In a thorough comparison, we identified differences considering both the active and the passive material characteristics, including the applied force‐stretch‐ and time‐activation dependencies, the computational efficiency of the activation level computation, the mathematical properties of the underlying activation concepts, and the assumed coupling of passive and active mechanics. Based on this analysis, we found the GASAM‐model to offer the best balance between physiological plausibility, mathematical consistency, and computational efficiency, making it a strong candidate for musculoskeletal simulations. The employed generalized active strain approach provides a physiologically plausible representation of muscle tissue, the stress deviation is consistent with the hyperelastic assumption, the explicit computation of the activation level enhances computational efficiency, and the applied force‐stretch dependency aligns with empirical data throughout the entire stretch regime.
As a basis for a numerical comparison, we fitted the stress responses to experimental data obtained under one active and six passive load conditions. Depending on the load case, one or the other material model approximated the experimental data better, but overall, the approximations were equally satisfying. Our analysis underscored the importance of considering multiple load cases to uniquely determine the material parameters and the need for further experimental data on active muscle tissue.
We applied the material models to simulate fusiform muscle activation in an isometric and a free concentric contraction case. Our results show that the different activation concepts affect shearing and deformation transversal to the fiber direction, even though the material characteristics along the fiber direction may coincide. We presented an approach to include complex spatiotemporally varying activation patterns in the proposed GASAM‐model and simulate the abduction of the humerus bone by the deltoid muscle within a simplified two‐component muscle–bone model. Providing first insights into the concavity compression mechanism of the glenohumeral joint, we finally demonstrated the application of the GASAM‐model in an example simulation of rotator cuff activation within a continuum mechanical model of the human shoulder.
Incorporating spatiotemporally varying activation patterns based on real‐life EMG measurements into the proposed active material muscle model and extending the presented shoulder model by additional passive structures represent key future directions for achieving physiologically reliable predictions.
Ethics Statement
The authors declare no conflicts of interest.
Conflicts of Interest
The authors declare no conflicts of interest.
Supporting information
Data S1. Supporting Information.
Acknowledgments
We thank our colleagues Dr.‐Ing. Maximilian Grill and Amadeus Gebauer for technical discussions and support, as well as Lisa Engstler and Moritz Brüch for their contributions during their student projects.
Appendix A.
A.1Stress Tensor Deviations and Supplementary Equations
A.1.1Active Stress Approach (ASE)
The second Piola–Kirchhoff stress tensor is assembled similarly to the strain‐energy function in Equation (8) into an isochoric and a volumetric contribution as
| (A1) |
Using the fictitious second Piola–Kirchhoff stress and the projection tensor , the contributions are computed to
| (A2) |
Following the active stress approach, involves an active and a passive contribution according to
| (A3) |
with the pre‐factors
and the helper quantities
| (A4) |
A.1.2Generalized Active Strain Approach (GASA)
The passive first generalized invariant for uniaxial tension and its derivative w.r.t. the fiber stretch read
| (A5) |
The second Piola–Kirchhoff stress is derived from Equation (16) as
| (A6) |
A.1.3Active Strain Approach (ASA)
The generalized elastic invariants for uniaxial tension are
| (A7) |
with their passive counterparts and .
The elastic second Piola–Kirchhoff stress results from the elastic deformation and is thus computed based on Equation (23) as
| (A8) |
The second Piola–Kirchhoff stress comprises the derivatives of the elastic and the volumetric part of the strain‐energy function with respect to . Since the included activation level depends on the fiber stretch and is a function of , the term complements the conventional contribution . With the volumetric stress the stress tensor reads
| (A9) |
The respective contributions therein are derived as
| (A10) |
| (A11) |
| (A12) |
Equation (A11) comprises the derivatives
| (A13) |
Considering the implicit definition of in Equation (24), in Equation (A13) can be approximated by a central finite differences scheme.
A.2Parameter Identification
A.2.1Boundary Conditions and Analytical Stress Responses for Investigated Load Scenarios
TABLE A1.
Load cases and associated Dirichlet boundary conditions applied in the simulation of the unit cubes during the material parameter fitting.
| UTCAF | UTCTF | SAF | |
|---|---|---|---|

|

|

|

|
| PSAF | PSTF | PSTIF | |

|

|

|

|
Note: The constraints are applied as indicated by the sketched support joints. Blue arrows indicate the direction of the prescribed displacement and (only for SAF) enforcing the deformation in Table 4. Red arrows illustrate the muscle fiber direction.
TABLE A2.
Analytical expressions of the first Piola–Kirchhoff stress for the load cases defined in Table 3.
| Active muscle state | |
| UTCAF: Load in fiber direction in e 3‐direction | |
|
| |
|
with , , and | |
|
with , and | |
|
| |
| Passive muscle state | |
| UTCTF: Load transversal to the fiber direction in e 1‐direction | |
|
| |
|
with , and | |
| SAF: Load in fiber direction in e 3‐direction, fixed e 2‐direction | |
|
| |
|
with , and | |
| PSAF: Load in fiber direction in e 3‐direction, fixed e 2‐direction | |
|
| |
|
with , and | |
| PSTF: Load transversal to the fiber direction in e 1‐direction, fixed e 2‐direction | |
|
| |
|
with , and | |
| PSTIF: Load transversal to the fiber direction in e 1‐direction, fixed e 3‐direction | |
|
| |
| with and as for the PSTF case |
Note: The ASE‐terms include the Neo‐Hookean contribution. The passive muscle response is obtained by setting the respective activation parameters to zero. In that case, the stress responses of the ASA‐, GASA‐, and GASAM‐model coincide, and the elastic invariants and (ASA) are equal to the passive invariants and (GASA, GASAM).
A.2.2Quantitative Analysis of Goodness of Fit Between Model Predictions and Experimental Data
Error Measures
To quantify the deviation of the fitted analytical stress–strain response from the experimental data, we compute three error measures. Based on the norm, we first define the relative error to assess the maximum absolute deviation between the model prediction and the observed experimental data as
| (A14) |
With the norm providing a metric for the total absolute deviation between and , we second evaluate the relative error as
| (A15) |
Since we minimized the sum of squared distances between experimental observation and model prediction, we third compute the norm‐based relative error according to
| (A16) |
To assess how well the material models capture the experimental data for moderate fiber stretches, we additionally compute the error measures restricted to the stretch range .
Goodness of Fit
The goodness of fit differs both between the material models and among the load cases.
The experimental observations for the passive load cases UTCAF, PSAF, and PSTF are well approximated with all material models, with . For UTCAF, the fit is exceptionally good, with in the passive case and in the active case. For those three load cases, we observed no considerable differences when comparing the material models considering the error measures. A minor exception is the error: Compared with the GASA‐, ASA‐, and GASAM‐models, the ASE‐model exhibits a larger error for PSAF and a smaller error for PSTF.
For UTCTF, SAF, and PSTIF, the deviations between the experimental data and the fitted responses are more pronounced. For UTCTF, the errors obtained for the ASE‐model (e.g., ) suggest a slightly better fit compared with the other material models (). While the GASA/ASA/GASAM‐model better approximates stresses due to small stretches, the ASE‐model matches stresses in the high stretch regime more closely. This becomes more evident when comparing the errors computed for the restricted stretch range . Compared with the errors computed using all data, the GASA/ASA/GASAM‐model errors decrease, while the ASE‐model errors increase. The fitted responses for SAF deviate the strongest from the experimental observations. Although the ASE‐model provides a better overall approximation than the other three models, errors are still moderately high (e.g., ). For PSTIF, the GASA/ASA/GASAM‐model delivers a good fit with errors below . In contrast, errors of the ASE‐model response are considerably higher (e.g., ).
As mentioned before, for the load cases PSAF, PSTF, and PSTIF, we averaged the experimental measurements from differently sized samples and used these averages in the fitting procedure. We note that compared with the original data in [136] and the associated standard deviations, our fitted material response remains within the experimentally determined range.
Analyzing the total relative errors reveals that the ASE‐model offers a superior fit in terms of and , while the GASA‐, ASA‐, and GASAM‐models perform better in terms of . With providing a measure of the average deviations and penalizing extreme deviations more heavily, we find that the GASA‐, ASA‐, and GASAM‐models better capture the overall trend but exhibit larger outliers. When considering only the restricted stretch range, is also lower for the GASA‐, ASA‐, and GASAM‐models than for the ASE‐model. remains high due to the deviations in UTCTF. We thus conclude that the GASA‐, ASA‐, and GASAM‐models offer a better overall approximation in moderate stress–strain ranges.
TABLE A3.
Relative errors (, , and ) between the experimental data and the fitted analytical model stress responses for different load cases.
| Load case |
|
|
|
||||||
|---|---|---|---|---|---|---|---|---|---|
| ASE | GASA, ASA, GASAM | ASE | GASA, ASA, GASAM | ASE | GASA, ASA, GASAM | ||||
| UTCAFact | 0.14 | 0.15 (0.08) | 0.06 (0.07) | 0.05 (0.06) | 0.07 (0.08) | 0.06 | |||
| UTCAF | 0.10 (0.11) | 0.09 (0.11) | 0.11 (0.14) | 0.12 (0.15) | 0.11 (0.13) | 0.11 (0.14) | |||
| UTCTF | 0.17 (0.23) | 0.56 (0.48) | 0.26 (0.35) | 0.39 (0.31) | 0.24 (0.32) | 0.47 (0.39) | |||
| PSAF | 0.24 | 0.15 | 0.26 | 0.29 | 0.22 | 0.24 | |||
| PSTF | 0.16 | 0.28 | 0.13 | 0.15 | 0.13 | 0.17 | |||
| PSTIF | 0.33 | 0.19 | 0.77 | 0.26 | 0.58 | 0.21 | |||
| SAF | 0.27 | 0.47 | 0.50 | 0.72 | 0.41 | 0.62 | |||
| Total error | 1.42 (1.48) | 1.92 (1.77) | 2.10 (2.22) | 1.99 (1.94) | 1.78 (1.88) | 1.90 (1.83) | |||
Note: Errors computed excluding data corresponding to stretches and are additionally provided in parentheses if they differ from the errors computed using all data. The total errors are obtained by summing the errors across all load cases.
A.3Fusiform Muscle Contraction
A.3.1Stress Distribution Over the Muscle Continuum
FIGURE A1.

Distribution of Cauchy stresses in fiber direction over the entire domain of the fusiform muscle () for an isometric contraction in the tetanized state at . The plotted frequency represents the number of elements (bar height) with stress values within a defined range (bar width). While the average , the variances are similar. The skewness is most pronounced for the ASA‐ and least pronounced for the GASA‐material model.
A.3.2Influence of the Mesh Resolution
As mesh resolution can significantly impact the prediction, we repeated the fusiform muscle simulations for a series of mesh refinements . Figure A2 investigates the influence of on the isometric muscle force and the stretch ratio for the free contraction. The quantities are evaluated for the final configuration at .
slightly decreases with increasing . However, the influence remains below a maximal deviation of between the results for and using the ASE‐material model. Deviations of are close to zero. The ASA‐model exhibits the most significant though minor deviation ( between the results for and ).
FIGURE A2.

Influence of the mesh refinement : Simulated muscle force and stretch ratio at for an isometric and a free contraction of the fusiform muscle.
A.3.3Influence of the Incompressibility
Solving the linear system of equations arising from the FEM discretization requires an iterative scheme for large‐size problems. The convergence rate of such iterative solvers strongly depends on the conditioning of the coefficient matrix . A strictly enforced incompressibility (achieved through a high incompressibility parameter value) can worsen the system's conditioning and thus be difficult to prescribe. In contrast, an insufficiently high incompressibility parameter inadequately approximates the material's incompressible characteristics, leading to a change in volume.
To analyze the influence of the incompressibility parameter ( for the ASA‐, GASA‐, and GASAM‐model, and for the ASE‐model) and determine an appropriate value for the simulation of a larger scale problem, we repeat the simulations for the fusiform muscle. Since mesh refinement has no notable effect on the volume change, we restrict the investigation to simulations with mesh refinement . The incompressibility parameter is varied by the scaling factor such that with , and with .
We evaluate the percentage volume change in the final configuration at . As a measure for the conditioning of the linear system matrix , we approximate its condition number by the ratio of maximal to minimal eigenvalues . The closer is to , the better the conditioning and, consequently, the better the convergence rate of the iterative solver.
Figure A3 shows the computed quantities for the free and isometric contraction simulation. As expected, a lower incompressibility penalty leads to higher absolute volume changes, but lower condition numbers. Since we consider an absolute volume change of acceptable, we regard , , and as sufficient for large‐scale simulations.
FIGURE A3.

Influence of the incompressibility parameters and : Simulation results for an isometric and a free contraction of the fusiform muscle (). The reference values and were scaled by the factor . The volume change is evaluated in the final configuration at , and the condition number is plotted for the last Newton iteration of the second time step.
A.4Glenohumeral Joint Concavity Compression Simulation
A.4.1Computation of Humerus Mass Density
In our shoulder model, the approximate humerus length is . According to [168], humerus length is positively correlated to its weight. Considering a mean length of and a mean dry weight of for males [169], we assume the model humerus dry weight to be . With an approximate dry‐wet weight ratio of [170, 171], the model humerus wet weight (the bone weight including all organic and inorganic material) is . For a measured volume of , we thus compute a mass density of .
A.4.2Definition of Boundary Conditions
TABLE A4.
Definition of surface and volume nodesets ids for the assignment of boundary conditions.
| Humerus | Scapula with labrum | Deltoid | Rotator cuff (RC) | ||||
|---|---|---|---|---|---|---|---|
| Humeral head | 8 | Inner volume | 34 | Deltoid orig. (spinal, acromial) | 18 | Teres minor ins. | 23 |
| Deltoid ins. | 5 | Glenoid fossa | 14 | Deltoid orig. (clavicular) | 17 | Infraspinatus ins. | 26 |
| Teres minor ins. | 1 | Deltoid orig. (spinal, acromial) | 13 | Deltoid ins. | 19 | Supraspinatus ins. | 25 |
| Infraspinatus ins. | 4 | Teres minor orig. | 9 | Humerus contact | 20 | Subscapularis ins. | 24 |
| Supraspinatus ins. | 3 | Infraspinatus orig. | 12 | Scapula contact | 21 | Teres minor orig. | 27 |
| Subscapularis ins. | 2 | Supraspinatus orig. | 11 | RC contact | 22 | Infraspinatus orig. | 30 |
| Deltoid contact | 6 | Subscapularis orig. | 10 | Supraspinatus orig. | 29 | ||
| RC contact | 7 | Deltoid contact | 16 | Subscapularis orig. | 28 | ||
| RC contact | 15 | Humerus contact | 31 | ||||
| Scapula contact | 32 | ||||||
| Deltoid contact | 33 | ||||||
Note: Muscle insertions and origins are abbreviated as ins. and orig., respectively.
FIGURE A4.

Surfaces defined for the shoulder model. Colors represent the assigned type of boundary condition. The surfaces are labelled according to the ids in Table A4.
TABLE A5.
Definition of Dirichlet boundary conditions due to fixation of the scapula and the muscle origins.
| Surface nodesets (muscle origins) | 9, 10, 11, 12, 13, 17, 18, 27, 28, 29, 30 |
| Volume nodesets (inner nodes of scapula) | 34 |
TABLE A6.
Meshtying boundary conditions.
| Pair | Surfaces | ||
|---|---|---|---|
| Deltoid ins. | 1 | 5 | 19 |
| Teres minor ins. | 2 | 1 | 23 |
| Infraspinatus ins. | 3 | 4 | 26 |
| Supraspinatus ins. | 4 | 3 | 25 |
| Subscapularis ins. | 5 | 2 | 24 |
Note: Muscle insertions are abbreviated as ins.
TABLE A7.
Contact boundary conditions.
| Pair | Master | Slave | |
|---|---|---|---|
| Glenohumeral joint | 1 | 8 | 14 |
| Humerus‐deltoid | 2 | 6 | 20 |
| Humerus‐RC | 3 | 7 | 31 |
| Deltoid‐scapula | 4 | 21 | 16 |
| RC‐scapula | 5 | 32 | 15 |
| Deltoid‐RC | 6 | 22 | 33 |
Funding: The authors received no specific funding for this work.
Data Availability Statement
The material models investigated in this study were implemented in the open‐source, comprehensive multi‐physics simulation framework 4C [133], available at github.com/4C‐multiphysics/4C. All other data is available from the corresponding author upon reasonable request.
References
- 1. Gill T. K., Shanahan E. M., Tucker G. R., Buchbinder R., and Hill C. L., “Shoulder Range of Movement in the General Population: Age and Gender Stratified Normative Data Using a Community‐Based Cohort,” BMC Musculoskeletal Disorders 21, no. 1 (2020): 676, 10.1186/s12891-020-03665-9. [DOI] [PMC free article] [PubMed] [Google Scholar]
- 2. Bigliani L. U., Kelkar R., Flatow E. L., Pollock R. G., and Mow V. C., “Glenohumeral Stability. Biomechanical Properties of Passive and Active Stabilizers,” Clinical Orthopaedics and Related Research 330 (1996): 13–30. [PubMed] [Google Scholar]
- 3. Yanagawa T., Goodwin C. J., Shelburne K. B., Giphart J. E., Torry M. R., and Pandy M. G., “Contributions of the Individual Muscles of the Shoulder to Glenohumeral Joint Stability During Abduction,” Journal of Biomechanical Engineering 130, no. 2 (2008): 021024, 10.1115/1.2903422. [DOI] [PubMed] [Google Scholar]
- 4. Ludewig P. M. and Reynolds J. F., “The Association of Scapular Kinematics and Glenohumeral Joint Pathologies,” Journal of Orthopaedic & Sports Physical Therapy 39, no. 2 (2009): 90–104, 10.2519/jospt.2009.2808. [DOI] [PMC free article] [PubMed] [Google Scholar]
- 5. Ben Kibler W., “The Role of the Scapula in Athletic Shoulder Function,” American Journal of Sports Medicine 26, no. 2 (1998): 325–337, 10.1177/03635465980260022801. [DOI] [PubMed] [Google Scholar]
- 6. Hawkes D. H., Khaiyat O. A., Howard A. J., Kemp G. J., and Frostick S. P., “Patterns of Muscle Coordination During Dynamic Glenohumeral Joint Elevation: An EMG Study,” PLoS One 14, no. 2 (2019): e0211800, 10.1371/journal.pone.0211800. [DOI] [PMC free article] [PubMed] [Google Scholar]
- 7. Kronberg M., Németh G., and Broström L. A., “Muscle Activity and Coordination in the Normal Shoulder. An Electromyographic Study,” Clinical Orthopaedics and Related Research 257 (1990): 76–85. [PubMed] [Google Scholar]
- 8. Goetti P., Denard P. J., Collin P., Ibrahim M., Hoffmeyer P., and Lädermann A., “Shoulder Biomechanics in Normal and Selected Pathological Conditions,” EFORT Open Reviews 5, no. 8 (2020): 508–518, 10.1302/2058-5241.5.200006. [DOI] [PMC free article] [PubMed] [Google Scholar]
- 9. Levine W. N. and Flatow E. L., “The Pathophysiology of Shoulder Instability,” American Journal of Sports Medicine 28, no. 6 (2000): 910–917, 10.1177/03635465000280062501. [DOI] [PubMed] [Google Scholar]
- 10. Urwin M., Symmons D., Allison T., et al., “Estimating the Burden of Musculoskeletal Disorders in the Community: The Comparative Prevalence of Symptoms at Different Anatomical Sites, and the Relation to Social Deprivation,” Annals of the Rheumatic Diseases 57, no. 11 (1998): 649–655, 10.1136/ard.57.11.649. [DOI] [PMC free article] [PubMed] [Google Scholar]
- 11. Luime J. J., Koes B. W., Hendriksen I. J. M., et al., “Prevalence and Incidence of Shoulder Pain in the General Population; a Systematic Review,” Scandinavian Journal of Rheumatology 33, no. 2 (2004): 73–81, 10.1080/03009740310004667. [DOI] [PubMed] [Google Scholar]
- 12. Dao T. T., “Rigid Musculoskeletal Models of the Human Body Systems: A Review,” Journal of Musculoskeletal Research 19, no. 3 (2016): 1630001, 10.1142/S0218957716300015. [DOI] [Google Scholar]
- 13. Anapol F. and Gray J. P., “Fiber Architecture of the Intrinsic Muscles of the Shoulder and Arm in Semiterrestrial and Arboreal Guenons,” American Journal of Physical Anthropology 122, no. 1 (2003): 51–65, 10.1002/ajpa.10269. [DOI] [PubMed] [Google Scholar]
- 14. Morrow D. A., Haut Donahue T. L., Odegard G. M., and Kaufman K. R., “Transversely Isotropic Tensile Material Properties of Skeletal Muscle Tissue,” Journal of the Mechanical Behavior of Biomedical Materials 3, no. 1 (2010): 124–129, 10.1016/j.jmbbm.2009.03.004. [DOI] [PMC free article] [PubMed] [Google Scholar]
- 15. Blemker S. S., Pinsky P. M., and Delp S. L., “A 3D Model of Muscle Reveals the Causes of Nonuniform Strains in the Biceps Brachii,” Journal of Biomechanics 38, no. 4 (2005): 657–665, 10.1016/j.jbiomech.2004.04.009. [DOI] [PubMed] [Google Scholar]
- 16. Assila N., Begon M., and Duprey S., “Finite Element Model of the Shoulder With Active Rotator Cuff Muscles: Application to Wheelchair Propulsion,” Annals of Biomedical Engineering 52, no. 5 (2024): 1240–1254, 10.1007/s10439-024-03449-5. [DOI] [PubMed] [Google Scholar]
- 17. Weickenmeier J., Itskov M., Mazza E., and Jabareen M., “A Physically Motivated Constitutive Model for 3D Numerical Simulation of Skeletal Muscles,” International Journal for Numerical Methods in Biomedical Engineering 30, no. 5 (2014): 545–562, 10.1002/cnm.2618. [DOI] [PubMed] [Google Scholar]
- 18. Giantesio G. and Musesti A., “Strain‐Dependent Internal Parameters in Hyperelastic Biological Materials,” International Journal of Non‐Linear Mechanics 95 (2017): 162–167, 10.1016/j.ijnonlinmec.2017.06.012. [DOI] [Google Scholar]
- 19. Charlton I. W. and Johnson G. R., “Application of Spherical and Cylindrical Wrapping Algorithms in a Musculoskeletal Model of the Upper Limb,” Journal of Biomechanics 34, no. 9 (2001): 1209–1216, 10.1016/S0021-9290(01)00074-4. [DOI] [PubMed] [Google Scholar]
- 20. Garner B. A. and Pandy M. G., “The Obstacle‐Set Method for Representing Muscle Paths in Musculoskeletal Models,” Computer Methods in Biomechanics and Biomedical Engineering 3, no. 1 (2000): 1–30, 10.1080/10255840008915251. [DOI] [PubMed] [Google Scholar]
- 21. Viceconti M., Testi D., Taddei F., Martelli S., Clapworthy G. J., and Van Sint Jan S., “Biomechanics Modeling of the Musculoskeletal Apparatus: Status and Key Issues,” Proceedings of the IEEE 94, no. 4 (2006): 725–739, 10.1109/JPROC.2006.871769. [DOI] [Google Scholar]
- 22. Péan F., Tanner C., Gerber C., Fürnstahl P., and Goksel O., “A Comprehensive and Volumetric Musculoskeletal Model for the Dynamic Simulation of the Shoulder Function,” Computer Methods in Biomechanics and Biomedical Engineering 22, no. 7 (2019): 740–751, 10.1080/10255842.2019.1588963. [DOI] [PubMed] [Google Scholar]
- 23. Webb J. D., Blemker S. S., and Delp S. L., “3D Finite Element Models of Shoulder Muscles for Computing Lines of Actions and Moment Arms,” Computer Methods in Biomechanics and Biomedical Engineering 17, no. 8 (2014): 829–837, 10.1080/10255842.2012.719605. [DOI] [PMC free article] [PubMed] [Google Scholar]
- 24. Blache Y. and Begon M., “Influence of Shoulder Kinematic Estimate on Joint and Muscle Mechanics Predicted by Musculoskeletal Model,” IEEE Transactions on Biomedical Engineering 65, no. 4 (2018): 715–722, 10.1109/TBME.2017.2716186. [DOI] [PubMed] [Google Scholar]
- 25. Holzbaur K. R. S., Murray W. M., and Delp S. L., “A Model of the Upper Extremity for Simulating Musculoskeletal Surgery and Analyzing Neuromuscular Control,” Annals of Biomedical Engineering 33, no. 6 (2005): 829–840, 10.1007/s10439-005-3320-7. [DOI] [PubMed] [Google Scholar]
- 26. Bolsterlee B., Veeger D. H. E. J., and Chadwick E. K., “Clinical Applications of Musculoskeletal Modelling for the Shoulder and Upper Limb,” Medical & Biological Engineering & Computing 51, no. 9 (2013): 953–963, 10.1007/s11517-013-1099-5. [DOI] [PubMed] [Google Scholar]
- 27. Prinold J. A., Masjedi M., Johnson G. R., and Bull A. M., “Musculoskeletal Shoulder Models: A Technical Review and Proposals for Research Foci,” Proceedings of the Institution of Mechanical Engineers, Part H: Journal of Engineering in Medicine 227, no. 10 (2013): 1041–1057, 10.1177/0954411913492303. [DOI] [PubMed] [Google Scholar]
- 28. Roupa I., da Silva M. R., Marques F., Gonçalves S. B., Flores P., and da Silva M. T., “On the Modeling of Biomechanical Systems for Human Movement Analysis: A Narrative Review,” Archives of Computational Methods in Engineering 29, no. 7 (2022): 4915–4958, 10.1007/s11831-022-09757-0. [DOI] [Google Scholar]
- 29. Varvik J., Besier T. F., and Handsfield G. G., “Computational Fluid Dynamics Simulations for 3D Muscle Fiber Architecture in Finite Element Analysis: Comparisons Between Computational Fluid Dynamics and Diffusion Tensor Imaging,” International Journal for Numerical Methods in Biomedical Engineering 37, no. 12 (2021): e3521, 10.1002/cnm.3521. [DOI] [PubMed] [Google Scholar]
- 30. Bolsterlee B., “A New Framework for Analysis of Three‐Dimensional Shape and Architecture of Human Skeletal Muscles From In Vivo Imaging Data,” Journal of Applied Physiology 132, no. 3 (2022): 712–725, 10.1152/japplphysiol.00638.2021. [DOI] [PubMed] [Google Scholar]
- 31. Ramasamy E., Avci O., Dorow B., et al., “An Efficient Modelling‐Simulation‐Analysis Workflow to Investigate Stump‐Socket Interaction Using Patient‐Specific, Three‐Dimensional, Continuum‐Mechanical, Finite Element Residual Limb Models,” Frontiers in Bioengineering and Biotechnology 6 (2018): 1–17, 10.3389/fbioe.2018.00126. [DOI] [PMC free article] [PubMed] [Google Scholar]
- 32. Blemker S. S. and Delp S. L., “Three‐Dimensional Representation of Complex Muscle Architectures and Geometries,” Annals of Biomedical Engineering 33, no. 5 (2005): 661–673, 10.1007/s10439-005-1433-7. [DOI] [PubMed] [Google Scholar]
- 33. Röhrle O., Sprenger M., and Schmitt S., “A Two‐Muscle, Continuum‐Mechanical Forward Simulation of the Upper Limb,” Biomechanics and Modeling in Mechanobiology 16, no. 3 (2017): 743–762, 10.1007/s10237-016-0850-x. [DOI] [PubMed] [Google Scholar]
- 34. Heidlauf T., Röhrle O., and Soudah E., “Modeling the Chemoelectromechanical Behavior of Skeletal Muscle Using the Parallel Open‐Source Software Library OpenCMISS,” Computational and Mathematical Methods in Medicine 2013, no. 517287 (2013): 1–14, 10.1155/2013/517287. [DOI] [PMC free article] [PubMed] [Google Scholar]
- 35. Heidlauf T. and Röhrle O., “A Multiscale Chemo‐Electro‐Mechanical Skeletal Muscle Model to Analyze Muscle Contraction and Force Generation for Different Muscle Fiber Arrangements,” Frontiers in Physiology 5, no. 498 (2014): 1–14, 10.3389/fphys.2014.00498. [DOI] [PMC free article] [PubMed] [Google Scholar]
- 36. Péan F. and Goksel O., “Surface‐Based Modeling of Muscles: Functional Simulation of the Shoulder,” Medical Engineering and Physics 82 (2020): 1–12, 10.1016/j.medengphy.2020.04.010. [DOI] [PubMed] [Google Scholar]
- 37. Büchler P., Ramaniraka N., Rakotomanana L., Iannotti J., and Farron A., “A Finite Element Model of the Shoulder: Application to the Comparison of Normal and Osteoarthritic Joints,” Clinical Biomechanics 17, no. 9–10 (2002): 630–639, 10.1016/S0268-0033(02)00106-7. [DOI] [PubMed] [Google Scholar]
- 38. Terrier A., Reist A., Vogel A., and Farron A., “Effect of Supraspinatus Deficiency on Humerus Translation and Glenohumeral Contact Force During Abduction,” Clinical Biomechanics 22, no. 6 (2007): 645–651, 10.1016/j.clinbiomech.2007.01.015. [DOI] [PubMed] [Google Scholar]
- 39. Metan S. S., Krishna P., and Mohankumar G. C., “FEM Model an Effective Tool to Evaluate Von Mises Stresses in Shoulder Joint and Muscles for Adduction and Abduction,” in International Conference on Advances in Manufacturing and Materials Engineering, ICAMME 2014, vol. 5 (IEEE, 2014), 2090–2098, 10.1016/j.mspro.2014.07.544. [DOI] [Google Scholar]
- 40. Duprey S., Bruyère‐Garnier K., and Verriest J., “Numerical Simulation of Shoulder Response to a Lateral Impact With the HUMOS Model,” in IUTAM Symposium on Impact Biomechanics: From Fundamental Insights to Applications, vol. 124, ed. Gilchrist M. (Springer, 2005), 451–458, . [DOI] [Google Scholar]
- 41. Inoue A., Chosa E., Goto K., and Tajima N., “Nonlinear Stress Analysis of the Supraspinatus Tendon Using Three‐Dimensional Finite Element Analysis,” Knee Surgery, Sports Traumatology, Arthroscopy 21, no. 5 (2013): 1151–1157, 10.1007/s00167-012-2008-4. [DOI] [PubMed] [Google Scholar]
- 42. Zheng M., Qian Z., Zou Z., Peach C., Akrami M., and Ren L., “Subject‐Specific Finite Element Modelling of the Human Shoulder Complex Part 1: Model Construction and Quasi‐Static Abduction Simulation,” Journal of Bionic Engineering 17, no. 6 (2020): 1224–1238, 10.1007/s42235-020-0098-0. [DOI] [Google Scholar]
- 43. Teran J., Sifakis E., Blemker S. S., Ng‐Thow‐Hing V., Lau C., and Fedkiw R., “Creating and Simulating Skeletal Muscle From the Visible Human Data Set,” IEEE Transactions on Visualization and Computer Graphics 11, no. 3 (2005): 317–328, 10.1109/TVCG.2005.42. [DOI] [PubMed] [Google Scholar]
- 44. Péan F., Tanner C., Gerber C., Fürnstahl P., and Goksel O., “Computational Analysis of Subscapularis Tears and Pectoralis Major Transfers on Muscular Activity,” Clinical Biomechanics 92 (2022): 1–7, 10.1016/j.clinbiomech.2021.105541. [DOI] [PubMed] [Google Scholar]
- 45. Guccione J. M. and McCulloch A. D., “Mechanics of Active Contraction in Cardiac Muscle: Part I—Constitutive Relations for Fiber Stress That Describe Deactivation,” Journal of Biomechanical Engineering 115, no. 1 (1993): 72–81, 10.1115/1.2895473. [DOI] [PubMed] [Google Scholar]
- 46. Mo F., Li F., Behr M., Xiao Z., Zhang G., and Du X., “A Lower Limb‐Pelvis Finite Element Model With 3D Active Muscles,” Annals of Biomedical Engineering 46, no. 1 (2018): 86–96, 10.1007/s10439-017-1942-1. [DOI] [PubMed] [Google Scholar]
- 47. Holzapfel G. A. and Ogden R. W., “Constitutive Modelling of Passive Myocardium: A Structurally Based Framework for Material Characterization,” Philosophical Transactions of the Royal Society A: Mathematical, Physical and Engineering Sciences 367, no. 1902 (2009): 3445–3475, 10.1098/rsta.2009.0091. [DOI] [PubMed] [Google Scholar]
- 48. Ehret A. E., Böl M., and Itskov M., “A Continuum Constitutive Model for the Active Behaviour of Skeletal Muscle,” Journal of the Mechanics and Physics of Solids 59, no. 3 (2011): 625–636, 10.1016/j.jmps.2010.12.008. [DOI] [Google Scholar]
- 49. Calvo B., Ramírez A., Alonso A., et al., “Passive Nonlinear Elastic Behaviour of Skeletal Muscle: Experimental Results and Model Formulation,” Journal of Biomechanics 43, no. 2 (2010): 318–325, 10.1016/j.jbiomech.2009.08.032. [DOI] [PubMed] [Google Scholar]
- 50. Pandolfi A., Gizzi A., and Vasta M., “Coupled Electro‐Mechanical Models of Fiber‐Distributed Active Tissues,” Journal of Biomechanics 49, no. 12 (2016): 2436–2444, 10.1016/j.jbiomech.2016.01.038. [DOI] [PubMed] [Google Scholar]
- 51. Pandolfi A., Gizzi A., and Vasta M., “Visco‐Electro‐Elastic Models of Fiber‐Distributed Active Tissues,” Meccanica 52, no. 14 (2017): 3399–3415, 10.1007/s11012-017-0622-4. [DOI] [Google Scholar]
- 52. Latorre M. and Montáns F. J., “Strain‐Level Dependent Nonequilibrium Anisotropic Viscoelasticity: Application to the Abdominal Muscle,” Journal of Biomechanical Engineering 139, no. 10 (2017): 101007–101015, 10.1115/1.4037405. [DOI] [PubMed] [Google Scholar]
- 53. Khodaei H., Mostofizadeh S., Brolin K., Johansson H., and Östh J., “Simulation of Active Skeletal Muscle Tissue With a Transversely Isotropic Viscohyperelastic Continuum Material Model,” Proceedings of the Institution of Mechanical Engineers, Part H: Journal of Engineering in Medicine 227 (2013): 571–580, 10.1177/0954411913476640. [DOI] [PubMed] [Google Scholar]
- 54. Ahamed T., Rubin M. B., Trimmer B. A., and Dorfmann L., “Time‐Dependent Behavior of Passive Skeletal Muscle,” Continuum Mechanics and Thermodynamics 28, no. 1 (2016): 561–577, 10.1007/s00161-015-0464-z. [DOI] [Google Scholar]
- 55. Wheatley B. B., Odegard G. M., Kaufman K. R., and Haut Donahue T. L., “A Case for Poroelasticity in Skeletal Muscle Finite Element Analysis: Experiment and Modeling,” Computer Methods in Biomechanics and Biomedical Engineering 20, no. 6 (2017): 598–601, 10.1080/10255842.2016.1268132. [DOI] [PMC free article] [PubMed] [Google Scholar]
- 56. Wheatley B. B., Odegard G. M., Kaufman K. R., and Haut Donahue T. L., “Modeling Skeletal Muscle Stress and Intramuscular Pressure: A Whole Muscle Active‐Passive Approach,” Journal of Biomechanical Engineering 140, no. 8 (2018): 081006, 10.1115/1.4040318. [DOI] [PMC free article] [PubMed] [Google Scholar]
- 57. Röhrle O. and Pullan A. J., “Three‐Dimensional Finite Element Modelling of Muscle Forces During Mastication,” Journal of Biomechanics 40, no. 15 (2007): 3363–3372, 10.1016/j.jbiomech.2007.05.011. [DOI] [PubMed] [Google Scholar]
- 58. Röhrle O., Davidson J. B., and Pullan A. J., “A Physiologically Based, Multi‐Scale Model of Skeletal Muscle Structure and Function,” Frontiers in Physiology 3, no. 358 (2012): 1–14, 10.3389/fphys.2012.00358. [DOI] [PMC free article] [PubMed] [Google Scholar]
- 59. Röhrle O., “Simulating the Electro‐Mechanical Behavior of Skeletal Muscles,” Computing in Science & Engineering 12, no. 6 (2010): 48–58, 10.1109/MCSE.2010.30. [DOI] [Google Scholar]
- 60. Röhrle O., “Skeletal Muscle Modelling,” in Encyclopedia of Continuum Mechanics, ed. Altenbach H. and Öchsner A. (Springer, 2018), 1–10, 10.1007/978-3-662-53605-6_39-1. [DOI] [Google Scholar]
- 61. Meier P. and Blickhan R., “FEM‐Simulation of Skeletal Muscle: The Influence of Inertia During Activation and Deactivation,” in Skeletal Muscle Mechanics: From Mechanism to Function, 1st ed., ed. Herzog W. (John Wiley & Sons, 2000), 209–224. [Google Scholar]
- 62. Teran J., Blemker S., Ng‐Thow‐Hing V., and Fedkiw R., “Finite Volume Methods for the Simulation of Skeletal Muscle,” in Eurographics/SIGGRAPH Symposium on Computer Animation, vol. 3, ed. Breen D. and Lin M. (Eurographics Association, 2003), 68–74, 10.2312/SCA03/068-074. [DOI] [Google Scholar]
- 63. Lemos R. R., Epstein M., Herzog W., and Wyvill B., “A Framework for Structured Modeling of Skeletal Muscle,” Computer Methods in Biomechanics and Biomedical Engineering 7, no. 6 (2004): 305–317, 10.1080/10255840412331317398. [DOI] [PubMed] [Google Scholar]
- 64. Johansson T., Meier P., and Blickhan R., “A Finite‐Element Model for the Mechanical Analysis of Skeletal Muscles,” Journal of Theoretical Biology 206, no. 1 (2000): 131–149, 10.1006/jtbi.2000.2109. [DOI] [PubMed] [Google Scholar]
- 65. Wheatley B. B., Odegard G. M., Kaufman K. R., and Haut Donahue T. L., “A Validated Model of Passive Skeletal Muscle to Predict Force and Intramuscular Pressure,” Biomechanics and Modeling in Mechanobiology 16, no. 3 (2017): 1011–1022, 10.1007/s10237-016-0869-z. [DOI] [PubMed] [Google Scholar]
- 66. Schmid L., Klotz T., Siebert T., and Röhrle O., “Characterization of Electromechanical Delay Based on a Biophysical Multi‐Scale Skeletal Muscle Model,” Frontiers in Physiology 10, no. 1270 (2019): 1–13, 10.3389/fphys.2019.01270. [DOI] [PMC free article] [PubMed] [Google Scholar]
- 67. Martins P. A. L. S., Natal Jorge R. M., and Ferreira A. J. M., “A Comparative Study of Several Material Models for Prediction of Hyperelastic Properties: Application to Silicone‐Rubber and Soft Tissues,” Strain 42, no. 3 (2006): 135–147, 10.1111/j.1475-1305.2006.00257.x. [DOI] [Google Scholar]
- 68. Zhang G., Chen X., Ohgi J., et al., “Biomechanical Simulation of Thorax Deformation Using Finite Element Approach,” Biomedical Engineering Online 15, no. 18 (2016): 1–18, 10.1186/s12938-016-0132-y. [DOI] [PMC free article] [PubMed] [Google Scholar]
- 69. Marcucci L., Reggiani C., Natali A. N., and Pavan P. G., “From Single Muscle Fiber to Whole Muscle Mechanics: A Finite Element Model of a Muscle Bundle With Fast and Slow Fibers,” Biomechanics and Modeling in Mechanobiology 16, no. 6 (2017): 1833–1843, 10.1007/s10237-017-0922-6. [DOI] [PubMed] [Google Scholar]
- 70. Pavan P. G., Todros S., Pachera P., Pianigiani S., and Natali A. N., “The Effects of the Muscular Contraction on the Abdominal Biomechanics: A Numerical Investigation,” Computer Methods in Biomechanics and Biomedical Engineering 22, no. 2 (2019): 139–148, 10.1080/10255842.2018.1540695. [DOI] [PubMed] [Google Scholar]
- 71. Pavan P. G., Pachera P., Forestiero A., and Natali A. N., “Investigation of Interaction Phenomena Between Crural Fascia and Muscles by Using a Three‐Dimensional Numerical Model,” Medical and Biological Engineering and Computing 55, no. 9 (2017): 1683–1691, 10.1007/s11517-017-1615-0. [DOI] [PubMed] [Google Scholar]
- 72. Tang C. Y., Zhang G., and Tsui C. P., “A 3D Skeletal Muscle Model Coupled With Active Contraction of Muscle Fibres and Hyperelastic Behaviour,” Journal of Biomechanics 42, no. 7 (2009): 865–872, 10.1016/j.jbiomech.2009.01.021. [DOI] [PubMed] [Google Scholar]
- 73. Yamamura N., Alves J. L., Oda T., Kinugasa R., and Takagi S., “Effect of Tendon Stiffness on the Generated Force at the Achilles Tendon: 3D Finite Element Simulation of a Human Triceps Surae Muscle During Isometric Contraction,” Journal of Biomechanical Science and Engineering 9, no. 3 (2014): 13‐00294, 10.1299/jbse.13-00294. [DOI] [Google Scholar]
- 74. Kinugasa R., Yamamura N., Sinha S., and Takagi S., “Influence of Intramuscular Fiber Orientation on the Achilles Tendon Curvature Using Three‐Dimensional Finite Element Modeling of Contracting Skeletal Muscle,” Journal of Biomechanics 49, no. 14 (2016): 3592–3595, 10.1016/j.jbiomech.2016.09.014. [DOI] [PubMed] [Google Scholar]
- 75. Chi S.‐W., Hodgson J., Chen J.‐S., et al., “Finite Element Modeling Reveals Complex Strain Mechanics in the Aponeuroses of Contracting Skeletal Muscle,” Journal of Biomechanics 43, no. 7 (2010): 1243–1250, 10.1016/j.jbiomech.2010.01.005. [DOI] [PMC free article] [PubMed] [Google Scholar]
- 76. Oomens C., Maenhout M., van Oijen C., Bemelman W., and Baaijens F., “Finite Element Modelling of Contracting Skeletal Muscle,” Philosophical Transactions of the Royal Society, B: Biological Sciences 358, no. 1437 (2003): 1453–1460, 10.1098/rstb.2003.1345. [DOI] [PMC free article] [PubMed] [Google Scholar]
- 77. Hernández‐Gascón B., Grasa J., Calvo B., and Rodríguez J. F., “A 3D Electro‐Mechanical Continuum Model for Simulating Skeletal Muscle Contraction,” Journal of Theoretical Biology 335 (2013): 108–118, 10.1016/j.jtbi.2013.06.029. [DOI] [PubMed] [Google Scholar]
- 78. Kuravi R., Leichsenring K., Böl M., and Ehret A. E., “3D Finite Element Models From Serial Section Histology of Skeletal Muscle Tissue – The Role of Micro‐Architecture on Mechanical Behaviour,” Journal of the Mechanical Behavior of Biomedical Materials 113 (2021): 104109, 10.1016/j.jmbbm.2020.104109. [DOI] [PubMed] [Google Scholar]
- 79. Lemos R., Epstein M., Herzog W., and Wyvill B., “Realistic Skeletal Muscle Deformation Using Finite Element Analysis,” in 14th Brazilian Symposium on Computer Graphics and Image Processing, Florianopolis, Brazil (IEEE, 2001), 192–199. [Google Scholar]
- 80. Böl M. and Reese S., “Micromechanical Modelling of Skeletal Muscles Based on the Finite Element Method,” Computer Methods in Biomechanics and Biomedical Engineering 11, no. 5 (2008): 489–504, 10.1080/10255840701771750. [DOI] [PubMed] [Google Scholar]
- 81. Böl M. and Reese S., “Finite Element Modelling of Rubber‐Like Polymers Based on Chain Statistics,” International Journal of Solids and Structures 43, no. 1 (2006): 2–26, 10.1016/j.ijsolstr.2005.06.086. [DOI] [Google Scholar]
- 82. Rehorn M. R. and Blemker S. S., “The Effects of Aponeurosis Geometry on Strain Injury Susceptibility Explored With a 3D Muscle Model,” Journal of Biomechanics 43, no. 13 (2010): 2574–2581, 10.1016/j.jbiomech.2010.05.011. [DOI] [PMC free article] [PubMed] [Google Scholar]
- 83. Sharafi B. and Blemker S. S., “A Micromechanical Model of Skeletal Muscle to Explore the Effects of Fiber and Fascicle Geometry,” Journal of Biomechanics 43, no. 16 (2010): 3207–3213, 10.1016/j.jbiomech.2010.07.020. [DOI] [PMC free article] [PubMed] [Google Scholar]
- 84. Kuravi R., Leichsenring K., Trostorf R., Morales‐Orcajo E., Böl M., and Ehret A. E., “Predicting Muscle Tissue Response From Calibrated Component Models and Histology‐Based Finite Element Models,” Journal of the Mechanical Behavior of Biomedical Materials 117 (2021): 104375, 10.1016/j.jmbbm.2021.104375. [DOI] [PubMed] [Google Scholar]
- 85. Martins J. A. C., Pato M. P. M., and Pires E. B., “A Finite Element Model of Skeletal Muscles,” Virtual and Physical Prototyping 1, no. 3 (2006): 159–170, 10.1080/17452750601040626. [DOI] [Google Scholar]
- 86. Grasa J., Ramírez A., Osta R., Muñoz M. J., Soteras F., and Calvo B., “A 3D Active‐Passive Numerical Skeletal Muscle Model Incorporating Initial Tissue Strains. Validation With Experimental Results on Rat Tibialis Anterior Muscle,” Biomechanics and Modeling in Mechanobiology 10, no. 5 (2011): 779–787, 10.1007/s10237-010-0273-z. [DOI] [PubMed] [Google Scholar]
- 87. Heidlauf T., Klotz T., Rode C., et al., “A Multi‐Scale Continuum Model of Skeletal Muscle Mechanics Predicting Force Enhancement Based on Actin–Titin Interaction,” Biomechanics and Modeling in Mechanobiology 15, no. 6 (2016): 1423–1437, 10.1007/s10237-016-0772-7. [DOI] [PubMed] [Google Scholar]
- 88. Zajac F., “Muscle and Tendon: Properties, Models, Scaling, and Application to Biomechanics and Motor Control,” Critical Reviews in Biomedical Engineering 17, no. 4 (1989): 359–411. [PubMed] [Google Scholar]
- 89. Seydewitz R., Siebert T., and Böl M., “On a Three‐Dimensional Constitutive Model for History Effects in Skeletal Muscles,” Biomechanics and Modeling in Mechanobiology 18, no. 6 (2019): 1665–1681, 10.1007/s10237-019-01167-9. [DOI] [PubMed] [Google Scholar]
- 90. Walter F., Seydewitz R., Mitterbach P., Siebert T., and Böl M., “On a Three‐Dimensional Model for the Description of the Passive Characteristics of Skeletal Muscle Tissue,” Biomechanics and Modeling in Mechanobiology 22, no. 5 (2022): 1499–1514, 10.1007/s10237-022-01664-4. [DOI] [PMC free article] [PubMed] [Google Scholar]
- 91. Spyrou L. A., Agoras M., and Danas K., “A Homogenization Model of the Voigt Type for Skeletal Muscle,” Journal of Theoretical Biology 414 (2017): 50–61, 10.1016/j.jtbi.2016.11.018. [DOI] [PubMed] [Google Scholar]
- 92. Spyrou L., Brisard S., and Danas K., “Multiscale Modeling of Skeletal Muscle Tissues Based on Analytical and Numerical Homogenization,” Journal of the Mechanical Behavior of Biomedical Materials 92 (2019): 97–117, 10.1016/j.jmbbm.2018.12.030. [DOI] [PubMed] [Google Scholar]
- 93. Bleiler C., Ponte Castañeda P., and Röhrle O., “A Microstructurally‐Based, Multi‐Scale, Continuum‐Mechanical Model for the Passive Behaviour of Skeletal Muscle Tissue,” Journal of the Mechanical Behavior of Biomedical Materials 97 (2019): 171–186, 10.1016/j.jmbbm.2019.05.012. [DOI] [PubMed] [Google Scholar]
- 94. Konno R. N., Nigam N., and Wakeling J. M., “Modelling Extracellular Matrix and Cellular Contributions to Whole Muscle Mechanics,” PLoS One 16, no. 4 (2021): e0249601, 10.1371/journal.pone.0249601. [DOI] [PMC free article] [PubMed] [Google Scholar]
- 95. He X., Taneja K., Chen J., et al., “Multiscale Modeling of Passive Material Influences on Deformation and Force Output of Skeletal Muscles,” International Journal for Numerical Methods in Biomedical Engineering 38, no. 4 (2022): e3571, 10.1002/cnm.3571. [DOI] [PubMed] [Google Scholar]
- 96. Yucesoy C. and Huijing P., “Specifically Tailored Use of the Finite Element Method to Study Muscular Mechanics Within the Context of Fascial Integrity: The Linked Fiber‐Matrix Mesh Model,” International Journal for Multiscale Computational Engineering 10 (2012): 155–170, 10.1615/IntJMultCompEng.2011002356. [DOI] [Google Scholar]
- 97. Klotz T., Bleiler C., and Röhrle O., “A Physiology‐Guided Classification of Active‐Stress and Active‐Strain Approaches for Continuum‐Mechanical Modeling of Skeletal Muscle Tissue,” Frontiers in Physiology 12 (2021): 685531, 10.3389/fphys.2021.685531. [DOI] [PMC free article] [PubMed] [Google Scholar]
- 98. Giantesio G., Musesti A., and Riccobelli D., “A Comparison Between Active Strain and Active Stress in Transversely Isotropic Hyperelastic Materials,” Journal of Elasticity 137, no. 1 (2018): 63–82, 10.1007/s10659-018-9708-z. [DOI] [Google Scholar]
- 99. Ambrosi D. and Pezzuto S., “Active Stress vs. Active Strain in Mechanobiology: Constitutive Issues,” Journal of Elasticity 107, no. 2 (2012): 199–212, 10.1007/s10659-011-9351-4. [DOI] [Google Scholar]
- 100. Röhrle O., Yavuz U. S., Klotz T., Negro F., and Heidlauf T., “Multiscale Modeling of the Neuromuscular System: Coupling Neurophysiology and Skeletal Muscle Mechanics,” WIREs Systems Biology and Medicine 11, no. 6 (2019): e1457, 10.1002/wsbm.1457. [DOI] [PubMed] [Google Scholar]
- 101. Ramírez A., Grasa J., Alonso A., et al., “Active Response of Skeletal Muscle: In Vivo Experimental Results and Model Formulation,” Journal of Theoretical Biology 267, no. 4 (2010): 546–553, 10.1016/j.jtbi.2010.09.018. [DOI] [PubMed] [Google Scholar]
- 102. Lamsfuss J. and Bargmann S., “Skeletal Muscle: Modeling the Mechanical Behavior by Taking the Hierarchical Microstructure Into Account,” Journal of the Mechanical Behavior of Biomedical Materials 122 (2021): 104670, 10.1016/j.jmbbm.2021.104670. [DOI] [PubMed] [Google Scholar]
- 103. Spyrou L. and Aravas N., “Muscle and Tendon Tissues: Constitutive Modeling and Computational Issues,” Journal of Applied Mechanics 78, no. 4 (2011): 0410151, 10.1115/1.4003741. [DOI] [Google Scholar]
- 104. Sharifimajd B. and St°alhand J., “A Continuum Model for Skeletal Muscle Contraction at Homogeneous Finite Deformations,” Biomechanics and Modeling in Mechanobiology 12, no. 5 (2013): 965–973, 10.1007/s10237-012-0456-x. [DOI] [PubMed] [Google Scholar]
- 105. Giantesio G., Marzocchi A., and Musesti A., “Loss of Mass and Performance in Skeletal Muscle Tissue: A Continuum Model,” Communications in Applied and Industrial Mathematics 9, no. 1 (2018): 1–19, 10.1515/caim-2018-0001. [DOI] [Google Scholar]
- 106. Herzog W., “The Multiple Roles of Titin in Muscle Contraction and Force Production,” Biophysical Reviews 10, no. 4 (2018): 1187–1199, 10.1007/s12551-017-0395-y. [DOI] [PMC free article] [PubMed] [Google Scholar]
- 107. Riccobelli D. and Ambrosi D., “Activation of a Muscle as a Mapping of Stress–Strain Curves,” Extreme Mechanics Letters 28 (2019): 37–42, 10.1016/j.eml.2019.02.004. [DOI] [Google Scholar]
- 108. Arya K. and Singh A., “Active Behavior of Skeletal Muscle and Modeling Sarcopenia With a Mixture Active Strain Approach Based Constitutive Model,” International Journal of Solids and Structures 248 (2022): 111669, 10.1016/j.ijsolstr.2022.111669. [DOI] [Google Scholar]
- 109. Rockenfeller R. and Günther M., “How to Model a Muscle's Active Force‐Length Relation: A Comparative Study,” Computer Methods in Applied Mechanics and Engineering 313 (2017): 321–336, 10.1016/j.cma.2016.10.003. [DOI] [Google Scholar]
- 110. van Leeuwen J. L., “Muscle Function in Locomotion,” in Mechanics of Animal Locomotion, Ser. Advances in Comparative and Environmental Physiology, vol. 11, 1st ed., ed. Alexander R. M. (Springer, 1992), 191–250. [Google Scholar]
- 111. Hill A. V., “The Heat of Shortening and the Dynamic Constants of Muscle,” Proceedings of the Royal Society of London, Series B: Biological Sciences 126, no. 843 (1938): 136–195, 10.1098/rspb.1938.0050. [DOI] [PubMed] [Google Scholar]
- 112. Böl M. and Reese S., “A New Approach for the Simulation of Skeletal Muscles Using the Tool of Statistical Mechanics,” Materialwissenschaft und Werkstofftechnik 38, no. 12 (2007): 955–964, 10.1002/mawe.200700225. [DOI] [Google Scholar]
- 113. Rode C., Siebert T., and Blickhan R., “Titin‐Induced Force Enhancement and Force Depression: A ‘Stickyspring’ Mechanism in Muscle Contractions?,” Journal of Theoretical Biology 259, no. 2 (2009): 350–360, 10.1016/j.jtbi.2009.03.015. [DOI] [PubMed] [Google Scholar]
- 114. Loumeaud A., Pouletaut P., Bensamoun S. F., George D., and Chatelin S., “Multiscale Mechanical Modeling of Skeletal Muscle: A Systemic Review of the Literature,” Journal of Medical and Biological Engineering 44, no. 3 (2024): 337–356, 10.1007/s40846-024-00879-3. [DOI] [Google Scholar]
- 115. Fernandez J., Buist M., Nickerson D., and Hunter P., “Modelling the Passive and Nerve Activated Response of the Rectus Femoris Muscle to a Flexion Loading: A Finite Element Framework,” Medical Engineering & Physics 27, no. 10 (2005): 862–870, 10.1016/j.medengphy.2005.03.009. [DOI] [PubMed] [Google Scholar]
- 116. Maier B. and Schulte M., “Mesh Generation and Multi‐Scale Simulation of a Contracting Muscle–Tendon Complex,” Journal of Computational Science 59 (2022): 101559, 10.1016/j.jocs.2022.101559. [DOI] [Google Scholar]
- 117. Röhrle O., Davidson J. B., and Pullan A. J., “Bridging Scales: A Three‐Dimensional Electromechanical Finite Element Model of Skeletal Muscle,” SIAM Journal on Scientific Computing 30, no. 6 (2008): 2882–2904, 10.1137/070691504. [DOI] [Google Scholar]
- 118. Röhrle O., Sprenger M., Ramasamy E., and Heidlauf T., “Multiscale Skeletal Muscle Modeling: From Cellular Level to a Multi‐Segment Skeletal Muscle Model of the Upper Limb,” in Computer Models in Biomechanics, ed. Holzapfel G. and Kuhl E. (Springer, 2013), 103–116, 10.1007/978-94-007-5464-5_8. [DOI] [Google Scholar]
- 119. Böl M., Weikert R., and Weichert C., “A Coupled Electromechanical Model for the Excitation‐Dependent Contraction of Skeletal Muscle,” Journal of the Mechanical Behavior of Biomedical Materials 4, no. 7 (2011): 1299–1310, 10.1016/j.jmbbm.2011.04.017. [DOI] [PubMed] [Google Scholar]
- 120. Stojanovic B., Svicevic M., Kaplarevic‐Malisic A., Gilbert R. J., and Mijailovich S. M., “Multi‐Scale Striated Muscle Contraction Model Linking Sarcomere Length‐Dependent Cross‐Bridge Kinetics to Macroscopic Deformation,” Journal of Computational Science 39 (2020): 101062, 10.1016/j.jocs.2019.101062. [DOI] [Google Scholar]
- 121. Shorten P., O'Callaghan P., Davidson J., and Soboleva T., “A Mathematical Model of Fatigue in Skeletal Muscle Force Contraction,” Journal of Muscle Research and Cell Motility 28 (2007): 293–313, 10.1007/s10974-007-9125-6. [DOI] [PubMed] [Google Scholar]
- 122. Lamsfuss J. and Bargmann S., “Computational Modeling of Damage in the Hierarchical Microstructure of Skeletal Muscles,” Journal of the Mechanical Behavior of Biomedical Materials 134 (2022): 105386, 10.1016/j.jmbbm.2022.105386. [DOI] [PubMed] [Google Scholar]
- 123. Giantesio G. and Musesti A., “A Continuum Model of Skeletal Muscle Tissue With Loss of Activation,” in Multiscale Models in Mechano and Tumor Biology, vol. 122, ed. Gerisch A., Penta R., and Lang J. (Springer, 2017), 139–159, 10.1007/978-3-319-73,371-5_7. [DOI] [Google Scholar]
- 124. Knaus K. R., Handsfield G. G., and Blemker S. S., “A 3D Model of the Soleus Reveals Effects of Aponeuroses Morphology and Material Properties on Complex Muscle Fascicle Behavior,” Journal of Biomechanics 130 (2022): 110877, 10.1016/j.jbiomech.2021.110877. [DOI] [PMC free article] [PubMed] [Google Scholar]
- 125. Fiorentino N. M. and Blemker S. S., “Musculotendon Variability Influences Tissue Strains Experienced by the Biceps Femoris Long Head Muscle During High‐Speed Running,” Journal of Biomechanics 47, no. 13 (2014): 3325–3333, 10.1016/j.jbiomech.2014.08.010. [DOI] [PMC free article] [PubMed] [Google Scholar]
- 126. Kiapour A., Kiapour A. M., Kaul V., et al., “Finite Element Model of the Knee for Investigation of Injury Mechanisms: Development and Validation,” Journal of Biomechanical Engineering 136, no. 1 (2014): 011002, 10.1115/1.4025692. [DOI] [PMC free article] [PubMed] [Google Scholar]
- 127. Holzapfel G. A., Nonlinear Solid Mechanics: A Continuum Approach for Engineering, 1st ed. (Wiley, 2000): 238. [Google Scholar]
- 128. Criscione J. C., Douglas A. S., and Hunter W. C., “Physically Based Strain Invariant Set for Materials Exhibiting Transversely Isotropic Behavior,” Journal of the Mechanics and Physics of Solids 49, no. 4 (2001): 871–897, 10.1016/S0022-5096(00)00047-8. [DOI] [Google Scholar]
- 129. Gorelick M. L. and Brown J. M. M., “Mechanomyographic Assessment of Contractile Properties Within Seven Segments of the Human Deltoid Muscle,” European Journal of Applied Physiology 100, no. 1 (2007): 35–44, 10.1007/s00421-007-0397-8. [DOI] [PubMed] [Google Scholar]
- 130. Fuglevand A., Winter D. A., and Patla A. E., “Models of Recruitment and Rate Coding Organization in Motorunit Pools,” Journal of Neurophysiology 70 (1993): 2470–2488, 10.1152/jn.1993.70.6.2470. [DOI] [PubMed] [Google Scholar]
- 131. Guan D., Gao H., Cai L., and Luo X., “A New Active Contraction Model for the Myocardium Using a Modified Hill Model,” Computers in Biology and Medicine 145 (2022): 105417, 10.1016/j.compbiomed.2022.105417. [DOI] [PubMed] [Google Scholar]
- 132. Linari M., Piazzesi G., Pertici I., Dantzig J. A., Goldman Y. E., and Lombardi V., “Straightening out the Elasticity of Myosin Cross‐Bridges,” Biophysical Journal 118, no. 5 (2020): 994–1002, 10.1016/j.bpj.2020.01.002. [DOI] [PMC free article] [PubMed] [Google Scholar]
- 133. 4C , “4C: A Comprehensive Multi‐Physics Simulation Framework,” 2024, https://www.4cmultiphysics.org.
- 134. Hawkins D. and Bey M., “A Comprehensive Approach for Studying Muscle‐Tendon Mechanics,” Journal of Biomechanical Engineering 116, no. 1 (1994): 51–55, 10.1115/1.2895704. [DOI] [PubMed] [Google Scholar]
- 135. Einarsson F., Runesson E., Karlsson J., and Fridén J., “Muscle Biopsies From the Supraspinatus in Retracted Rotator Cuff Tears Respond Normally to Passive Mechanical Testing: A Pilot Study,” Knee Surgery, Sports Traumatology, Arthroscopy 19, no. 3 (2010): 503–507, 10.1007/s00167-010-1284-0. [DOI] [PubMed] [Google Scholar]
- 136. Böl M., Ehret A. E., Leichsenring K., Weichert C., and Kruse R., “On the Anisotropy of Skeletal Muscle Tissue Under Compression,” Acta Biomaterialia 10, no. 7 (2014): 3225–3234, 10.1016/j.actbio.2014.03.003. [DOI] [PubMed] [Google Scholar]
- 137. Branch M. A., Coleman T. F., and Li Y., “A Subspace, Interior, and Conjugate Gradient Method for Large‐Scale Bound‐Constrained Minimization Problems,” SIAM Journal on Scientific Computing 21, no. 1 (1999): 1–23, 10.1137/S1064827595289108. [DOI] [Google Scholar]
- 138. Virtanen P., Gommers R., Oliphant T. E., et al., “SciPy 1.0: Fundamental Algorithms for Scientific Computing in Python,” Nature Methods 17 (2020): 261–272, 10.1038/s41592-019-0686-2. [DOI] [PMC free article] [PubMed] [Google Scholar]
- 139. Nie X., Cheng J.‐I., Chen W. W., and Weerasooriya T., “Dynamic Tensile Response of Porcine Muscle,” Journal of Applied Mechanics 78, no. 2 (2011): 021009, 10.1115/1.4002580. [DOI] [Google Scholar]
- 140. Takaza M., Moerman K. M., Gindre J., Lyons G., and Simms C. K., “The Anisotropic Mechanical Behaviour of Passive Skeletal Muscle Tissue Subjected to Large Tensile Strain,” Journal of the Mechanical Behavior of Biomedical Materials 17 (2013): 209–220, 10.1016/j.jmbbm.2012.09.001. [DOI] [PubMed] [Google Scholar]
- 141. Wheatley B. B., “Investigating Passive Muscle Mechanics With Biaxial Stretch,” Frontiers in Physiology 11 (2020): 1021, 10.3389/fphys.2020.01021. [DOI] [PMC free article] [PubMed] [Google Scholar]
- 142. Bouaicha S., Slankamenac K., Moor B. K., Tok S., Andreisek G., and Finkenstaedt T., “Cross‐Sectional Area of the Rotator Cuff Muscles in MRI – Is There Evidence for a Biomechanical Balanced Shoulder?,” PLoS One 11, no. 6 (2016): e0157946, 10.1371/journal.pone.0157946. [DOI] [PMC free article] [PubMed] [Google Scholar]
- 143. Holzbaur K. R., Murray W. M., Gold G. E., and Delp S. L., “Upper Limb Muscle Volumes in Adult Subjects,” Journal of Biomechanics 40, no. 4 (2007): 742–749, 10.1016/j.jbiomech.2006.11.011. [DOI] [PubMed] [Google Scholar]
- 144. Yanagisawa O., Dohi M., Okuwaki T., Tawara N., Niitsu M., and Takahashi H., “Appropriate Slice Location to Assess Maximal Cross‐Sectional Area of Individual Rotator Cuff Muscles in Normal Adults and Athletes,” Magnetic Resonance in Medical Sciences: MRMS 8, no. 2 (2009): 65–71, 10.2463/mrms.8.65. [DOI] [PubMed] [Google Scholar]
- 145. Langenderfer J., Jerabek S. A., Thangamani V. B., Kuhn J. E., and Hughes R. E., “Musculoskeletal Parameters of Muscles Crossing the Shoulder and Elbow and the Effect of Sarcomere Length Sample Size on Estimation of Optimal Muscle Length,” Clinical Biomechanics 19, no. 7 (2004): 664–670, 10.1016/j.clinbiomech.2004.04.009. [DOI] [PubMed] [Google Scholar]
- 146. Cubit , Cubit Version 13.2 (Sandia National Laboratories, 2012). [Google Scholar]
- 147. de Souza Neto E. A., Perić D., Dutko M., and Owen D. R. J., “Design of Simple Low Order Finite Elements for Large Strain Analysis of Nearly Incompressible Solids,” International Journal of Solids and Structures 33, no. 20 (1996): 3277–3296, 10.1016/0020-7683(95)00259-6. [DOI] [Google Scholar]
- 148. Choi H. F. and Blemker S. S., “Skeletal Muscle Fascicle Arrangements Can Be Reconstructed Using a Laplacian Vector Field Simulation,” PLoS One 8, no. 10 (2013): e77576, 10.1371/journal.pone.0077576. [DOI] [PMC free article] [PubMed] [Google Scholar]
- 149. Mitsuhashi N., Fujieda K., Tamura T., Kawamoto S., Takagi T., and Okubo K., “BodyParts3D: 3D Structure Database for Anatomical Concepts,” Nucleic Acids Research 37 (2009): D782–D785, 10.1093/nar/gkn613. [DOI] [PMC free article] [PubMed] [Google Scholar]
- 150. Materialise GmbH , Materialise 3‐Matic, Version 13.0 (Materialise GmbH, 2019). [Google Scholar]
- 151. Geuzaine C. and Remacle J.‐F., “Gmsh: A Three‐Dimensional Finite Element Mesh Generator With Built‐In Pre‐ and Post‐Processing Facilities (Version 2.12.0),” International Journal for Numerical Methods in Engineering 79, no. 11 (2009): 1309–1331. [Google Scholar]
- 152. Carey J., Small C. F., and Pichora D. R., “In Situ Compressive Properties of the Glenoid Labrum,” Journal of Biomedical Materials Research 51, no. 4 (2000): 711–716, . [DOI] [PubMed] [Google Scholar]
- 153. Smith C. D., Masouros S. D., Hill A. M., Wallace A. L., Amis A. A., and Bull A. M. J., “Tensile Properties of the Human Glenoid Labrum,” Journal of Anatomy 212, no. 1 (2008): 49–54, 10.1111/j.1469-7580.2007.00832.x. [DOI] [PMC free article] [PubMed] [Google Scholar]
- 154. Holtermann A., Roeleveld K., and Karlsson J. S., “Inhomogeneities in Muscle Activation Reveal Motor Unit Recruitment,” Journal of Electromyography and Kinesiology 15, no. 2 (2005): 131–137, 10.1016/j.jelekin.2004.09.003. [DOI] [PubMed] [Google Scholar]
- 155. Schlink B. R., Nordin A. D., and Ferris D. P., “Human Myoelectric Spatial Patterns Differ Among Lower Limb Muscles and Locomotion Speeds,” Physiological Reports 8, no. 23 (2020): e14652, 10.14814/phy2.14652. [DOI] [PMC free article] [PubMed] [Google Scholar]
- 156. Falla D. and Gallina A., “New Insights Into Pain‐Related Changes in Muscle Activation Revealed by High‐Density Surface Electromyography,” Journal of Electromyography and Kinesiology 52 (2020): 102422, 10.1016/j.jelekin.2020.102422. [DOI] [PubMed] [Google Scholar]
- 157. Abboud J. A. and Soslowsky L. J., “Interplay of the Static and Dynamic Restraints in Glenohumeral Instability,” Clinical Orthopaedics and Related Research 400 (2002): 48–57, 10.1097/00003086-200,207,000-00007. [DOI] [PubMed] [Google Scholar]
- 158. Halder A. M., Kuhl S. G., Zobitz M. E., Larson D., and An K. N., “Effects of the Glenoid Labrum and Glenohumeral Abduction on Stability of the Shoulder Joint Through Concavity‐Compression: An In Vitro Study,” Journal of Bone and Joint Surgery (American Volume) 83, no. 7 (2001): 1062–1069, 10.2106/00004623-200,107,000-00013. [DOI] [PubMed] [Google Scholar]
- 159. Parsons I. M., Apreleva M., Fu F. H., and Woo S. L., “The Effect of Rotator Cuff Tears on Reaction Forces at the Glenohumeral Joint,” Journal of Orthopaedic Research 20, no. 3 (2002): 439–446, 10.1016/S0736-0266(01)00137-1. [DOI] [PubMed] [Google Scholar]
- 160. Huegel J., Williams A. A., and Soslowsky L. J., “Rotator Cuff Biology and Biomechanics: A Review of Normal and Pathological Conditions,” Current Rheumatology Reports 17, no. 1 (2015): 476, 10.1007/s11926-014-0476-x. [DOI] [PubMed] [Google Scholar]
- 161. US National Library of Medicine , “The Visible Human Project,” 2020, www.nlm.nih.gov/research/visible/.
- 162. Hart N., Nimphius S., Rantalainen T., Ireland A., Siafarikas A., and Newton R., “Mechanical Basis of Bone Strength: Influence of Bone Material, Bone Structure and Muscle Action,” Journal of Musculoskeletal & Neuronal Interactions 17, no. 3 (2017): 114–139. [PMC free article] [PubMed] [Google Scholar]
- 163. Méndez J. and Keys A. B., “Density and Composition of Mammalian Muscle,” Metabolism, Clinical and Experimental 9 (1960): 184–188. [Google Scholar]
- 164. Gatti C. J., Maratt J. D., Palmer M. L., Hughes R. E., and Carpenter J. E., “Development and Validation of a Finite Element Model of the Superior Glenoid Labrum,” Annals of Biomedical Engineering 38, no. 12 (2010): 3766–3776, 10.1007/s10439-010-0105-4. [DOI] [PubMed] [Google Scholar]
- 165. Bavier E., Hoemmen M., Rajamanickam S., and Thornquist H., “Amesos2 and Belos: Direct and Iterative Solvers for Large Sparse Linear Systems,” Scientific Programming 20, no. 3 (2012): 241–255, 10.3233/SPR-2012-0352. [DOI] [Google Scholar]
- 166. Berger‐Vergiat L., Glusa C. A., Hu J. J., et al., MueLu User's Guide (Sandia National Laboratories, 2019). [Google Scholar]
- 167. Berger‐Vergiat L., Glusa C. A., Hu J. J., et al., “MueLu Multigrid Framework,” 2019, www.trilinos.org/packages/muelu.
- 168. Haque S., Mehataz T., Afros F., et al., “Correlation Between the Maximum Length and the Weight of the Human Humerus Bone,” Community Based Medical Journal 13 (2024): 60–65, 10.3329/cbmj.v13i1.71080. [DOI] [Google Scholar]
- 169. Ahmed S. S., Siddiqui F. B., and Bayer S. B., “Sex Differentiation of Humerus: An Osteometric Study,” Journal of Clinical and Diagnostic Research 12, no. 5 (2018): AC01–AC05, 10.7860/JCDR/2018/35768.12325. [DOI] [Google Scholar]
- 170. Huang T.‐H., Lin S., Chang F., Hsieh S., Liu S.‐H., and Yang R.‐S., “Effects of Different Exercise Modes on Mineralization, Structure, and Biomechanical Properties of Growing Bone,” Journal of Applied Physiology 95 (2003): 300–307, 10.1152/japplphysiol.01076.2002. [DOI] [PubMed] [Google Scholar]
- 171. Chang L., Shen S., Zhang Z., Song X., and Jiang Q., “Study on the Relationship Between Age and the Concentrations of Heavy Metal Elements in Human Bone,” Annals of Translational Medicine 6, no. 16 (2018): 320, 10.21037/atm.2018.08.09. [DOI] [PMC free article] [PubMed] [Google Scholar]
Associated Data
This section collects any data citations, data availability statements, or supplementary materials included in this article.
Supplementary Materials
Data S1. Supporting Information.
Data Availability Statement
The material models investigated in this study were implemented in the open‐source, comprehensive multi‐physics simulation framework 4C [133], available at github.com/4C‐multiphysics/4C. All other data is available from the corresponding author upon reasonable request.