



Summary
Systemic immune responses caused by chronic hypercholesterolemia contribute to atherosclerosis initiation, progression, and complications 1. However, individuals often change dietary habits over time 2, and the effects of alternating high-fat diet on atherosclerosis remain unclear. To address this relevant issue, we developed a protocol using atherosclerosis-prone mice to compare alternate versus continuous high-fat diet (HFD) while maintaining similar overall exposure periods. We found that alternate HFD accelerated atherosclerosis in Ldlr−/− and Apoe−/− mice compared to continuous HFD. This pro-atherogenic effect of alternate HFD was also observed in Apoe−/−Rag2−/− mice lacking T, B, and NKT cells, ruling out the role of the adaptive immune system in the observed phenotype. Discontinuing the HFD in the alternate group downregulated Runx1 3, promoting inflammatory signaling in bone marrow myeloid progenitors. Upon re-exposure to HFD, these cells produced IL-1β, leading to emergency myelopoiesis and increased neutrophil levels in blood. Neutrophils infiltrated plaques and released neutrophil extracellular traps, exacerbating atherosclerosis. Specific depletion of neutrophils or inhibition of IL-1β pathways abolished emergency myelopoiesis and reversed the pro-atherogenic effects of alternate HFD. This study highlights the role of IL-1β-dependent neutrophil progenitor reprogramming in accelerated atherosclerosis induced by alternate HFD.
Introduction
Atherosclerosis-related cardiovascular diseases are expected to remain the main cause of death globally within the next 15 years, owing to a rapidly increasing prevalence in developing countries and Eastern Europe and the rising incidence of obesity and diabetes in Western countries 4. These facts force us to revisit cardiovascular disease and consider new strategies for prediction, prevention, and treatment. Human studies, as well as experimental animal models, provided accumulating evidence that atherosclerosis is a chronic inflammatory disease of large and medium sized arteries that develops in response to subendothelial retention and modification of ApoB containing lipoproteins (LDL) 1. Inflammatory activation of endothelial cells orchestrates the recruitment of different subsets of circulating leukocytes, notably monocytes, into the vascular wall. Recruited monocytes significantly contribute to the pool of intimal macrophages, which promote the growth of atherosclerotic plaque after differentiation, activation and proliferation. More recent studies showed that circulating neutrophils also participate in the early stage of experimental atherosclerosis, as well as in plaque rupture in patients 5.
Most of our understanding of the pathophysiological mechanisms of atherosclerosis relies on experimental models using animals fed continuously with high fat diet (HFD) leading to chronic hypercholesterolemia 6, which differs from the human condition, where changes in dietary habits over time are frequent, for various reasons (season, country migration, social behavior..), and are associated with variations in plasma cholesterol levels. In the same line, statin discontinuation leads to the increase in LDL-cholesterol level and higher risk for cardiovascular events 7. Overall, little is known about the consequences of an alternate HFD and hypercholesterolemia re-exposure on atherosclerosis.
This question has gained even more significance since the recent observation that myeloid cells can adapt a long-lasting nonspecific pro-inflammatory phenotype, a process called trained immunity, after a brief exposure either to Danger-associated molecular patterns, including micro-organisms membrane components or oxidized lipids, in vitro 8 or in vivo 9. Such complex immunometabolic programming enables a robust cellular response to re-stimulation, especially with regard to cytokine production 10. The aim of our study was to assess the effects of an alternate HFD on systemic immune responses and atherosclerosis development.
Results
Alternate HFD and atherosclerosis
To investigate the impact of hypercholesterolemia re-exposure on atherosclerosis, we developed a protocol with 2 different diet regimens. One group of 6-week-old female Ldlr−/− mice was put on a so-called “alternate” HFD consisting of a first period of 4 weeks of HFD, followed by 8 weeks of regular chow diet, and then a final 4-weeks of HFD. The control group was fed a so-called “continuous” HFD during the last 8 weeks of the protocol (Figure 1a). As expected, alternate diet caused variations of plasma cholesterol levels over time, but the cumulative cholesterol burden, as an estimation of the total exposure to cholesterol, was similar in the two groups (Figure 1b & Extended Data Fig.1a). Body weight gain was similar between groups (Figure 1c & Extended Data Fig.1b). Interestingly, we observed that alternate HFD lead to accelerated atherosclerosis with larger plaques in the aortic sinus (343 ± 31 vs 242 ± 15. 103 μm2, P=0.019) (Figure 1d) and along the thoracic aorta (4.5 ± 0.8 vs 0.9 ± 0.1 %, P=0.008) (Figure 1e), as compared with continuous HFD. Alternate HFD also aggravated atherosclerosis development in male Ldlr−/− (Figure 1f), as well as in male Apoe−/− mice (Figure 1g), another classical model of atherosclerosis. The quantification of macrophage content (Figure 1h & Extended Data Fig.1c) and necrotic core size (Figure 1i & Extended Data Fig.1d) revealed that alternate HFD induced a switch toward a more advanced plaque phenotype.
Figure 1. Alternate HFD accelerates experimental atherosclerosis.

a, experimental protocol comparing athero-prone mice fed either alternate (Red) or continuous (Black) HFD. b, kinetics of plasma cholesterol levels of Ldlr−/− mice (n=6/group/timepoint). c, kinetics of body weight of Ldlr−/− mice (n=6/group/timepoint). d, at sacrifice, cholesterolemia, quantitative analysis and representative photomicrographs of atherosclerotic lesions in the aortic sinus of female Ldlr−/− mice mice (n=10/group). Scale bar 200 μm. e, quantitative analysis and representative photomicrographs of atherosclerotic lesions along the thoraco-abdominal aorta of female Ldlr−/− mice mice (n=5/group). Scale bar 1 mm. f, at sacrifice, plasma cholesterol levels, quantitative analysis and representative photomicrographs of atherosclerotic lesions in the aortic sinus of male Ldlr−/− mice (n=8/group). Scale bar 200 μm. g, at sacrifice, plasma cholesterol levels, quantitative analysis and representative photomicrographs of atherosclerotic lesions in the aortic sinus of male Apoe−/− mice (n=12/group). Scale bar 200 μm. h, representative photomicrographs and quantitative analysis of macrophage accumulation (MOMA staining, red) in atherosclerotic lesions of male Ldlr−/− mice (n=8/group). Scale bar 100 μm. i, representative photomicrographs and quantitative analysis of acellular area (Masson’s Trichrome) in atherosclerotic lesions of male Ldlr−/− mice mice (n=10/group). Scale bar 100 μm. Data are presented as mean values +/− SD. P values were calculated using two-tailed Mann-Whitney test.
Alternate HFD and gut microbiota
To decipher the mechanisms reponsible for the accelerated atherosclerosis in the “alternate” group, we first investigated the role of intestinal microbiota, a recently identified key driver for cardiovascular diseases, whose composition is modulated by diet regimen 11. The microbiota composition was analyzed using 16S rRNA based sequencing in Ldlr−/− mice that were exposed transiently to HFD from 6 to 10 weeks of age. Microbiota analysis was done at 14 weeks of age, 4 weeks after HFD discontinuation (Extended Data Fig.2a). As expected, the microbiota was dominated by bacteria from the Firmicutes, Bacteroidota and Proteobacteria Phyla. While there were no significant differences in alpha diversity between mice fed transient HFD or chow diet (Extended Data Fig.2b), beta diversity analysis showed a significant difference between the 2 groups, as demonstrated by the PCoA plot of Bray-Curtis distance (Figure 2a). To determine which taxonomic groups accounted for these differences, we performed linear discriminant analysis with effect size (Lefse). Compared to chow diet fed mice, transient HFD-fed mice displayed an increase in the pathobiont Helicobacter with a concomitant decrease in Akkermansia, a genus associated with a lean body type and favorable metabolic outcomes 12 (Figure 2b & Extended Data Fig.2c).
Figure 2. Alternate HFD accelerates atherosclerosis independently of gut microbiota or adaptive immunity.

a, left, Principal Component Analysis of the top 500 most variable genes (n=6/group). b, experimental protocol comparing male Ldlr−/− mice fed either alternate (Red) or continuous (Black) HFD and treated with antibiotics. c, at sacrifice, plasma cholesterol levels, quantitative analysis and representative photomicrographs of atherosclerotic lesions in the aortic sinus of male Ldlr−/− mice fed either continuous or alternate HFD and treated with antibiotics (n=5 Cont. and n=7 Alt.). Scale bar 200 μm. d, mRNA levels of spleen cytokines at sacrifice (n=12 Cont. n=13 Alt.). e, cytokine production by stimulated splenocytes from continuous or alternate ldlr−/−groups (n=12 Cont. n=13 Alt.). f, blood leukocyte subsets counts at sacrifice from continuous or alternate HFD ldlr−/−groups (n=12 Cont. n=13 Alt). g, h, spleen leukocyte subsets counts and flow cytometry picture from continuous or alternate HFD ldlr−/−groups (n=12 Cont. n=13 Alt.). i, representative photomicrographs and quantitative analysis of T cell content (CD3 staining, red) in atherosclerotic lesions of male Ldlr−/− mice fed either continuous or alternate HFD (n=11 Cont. n=12 Alt.). Scale bar 100 μm. j, protocol with surgical splenectomy (Sx). k, quantitative analysis and representative photomicrographs of atherosclerotic lesions of splenectomized male Apoe−/− mice mice fed either continuous or alternate HFD (n=6/group). Scale bar 200 μm. l, 6-week old male Apoe−/−Rag2−/− mice were fed either alternate or continuous HFD. m, plasma cholesterol levels, quantitative analysis and representative photomicrographs of atherosclerotic lesions of male Apoe−/− Rag2−/− mice fed either continuous or alternate HFD (n=7 Cont. n=9 Alt.); Scale bar 200 μm. n, cytokine production by stimulated splenocytes from continuous or alternate HFD Apoe−/−Rag2−/− groups (n=7 Cont. n=9 Alt.). Data are presented as mean values +/− SD. P values were calculated using two-tailed Mann-Whitney test.
To evaluate the contribution of HFD-induced dysbiosis in the vascular phenotype, ldlr−/− mice receiving either a continuous or an alternate HFD regimen were treated orally with a cocktail of antibiotics during the entire protocol period. As depicted in Figure 2c, despite gut microbiota depletion, alternated HFD still accelerated atherosclerosis development in the aortic sinus (592 ± 38 vs 329 ± 57. 103 μm2, P=0.005). This result highly suggests that the gut microbiota did not mediate the effects of alternate HFD on atherosclerosis.
Alternate HFD and immune responses
Given the well known effects of hypercholesterolemia on inflammatory responses, we sought to test whether HFD re-exposure modulated systemic immune responses. At sacrifice (Week 16), we found higher levels of Il-6 and Tnfα mRNA levels in the spleen of mice fed alternate HFD (Figure 2d), as well as higher production of IL-6, IL-18 and TNF-α by ex vivo stimulated splenocytes (Figure 2e). Leukocyte populations were analyzed by flow cytometry in both blood and spleen at sacrifice. We did not observe any significant difference in myeloid populations between groups, but B cells were slightly increased in the blood of alternate HFD mice, compared to continuous HFD mice (Figure 2f). Splenocyte number was similar between groups (Extended Data Fig.2 d–e) but the proportion of T and B cells was higher in the alternate group (Figure 2g–h & Extended Data Fig.2f). We found higher numbers of infiltrating CD3+ T cells in the atherosclerotic plaques of mice fed alternate HFD (Figure 2i). To evaluate the contribution of spleen immune cells and of lymphocytes in the pro-atherogenic effects of alternate HFD, we used 2 different strategies: one surgical approach with splenectomy in 4-week old Ldlr−/−mice (Figure 2j) and one genetically-modified mouse model, Apoe−/−Rag2−/− mice lacking mature T- and B-lymphocytes (Figure 2l). Despite no differences in plasma cholesterol levels (Extended Data Fig.2g), alternate HFD still aggravated atherosclerosis development in splenectomized mice (367 ± 29 vs 223 ± 27. 103 μm2, P=0.009) (Figure 2k), as well as in Apoe−/−Rag2−/− mice (310 ± 33 vs 183 ± 19. 103 μm2, P=0.012) (Figure 2m), ruling out a role of adaptive immunity in the pro-atherogenic effects of alternate HFD. At sacrifice, we also found higher production of IL-6 and IL-18 by ex vivo stimulated splenocytes of Apoe−/−Rag2−/− mice fed alternate HFD (Figure 2n).
Alternate HFD and myeloid responses
In order to decipher the mechanisms underlying the pro-atherogenic effects of alternate HFD, we performed RNA sequencing of the aorta from mice fed continuous or alternate HFD. Such investigations were performed 1 week after HFD re-exposure (Week 13) when plaque size was similar between groups in order to avoid confounders (Figure 3a). Despite no differences in lesion size, the whole transcriptomic profile of the aorta was markedly modified by the alternate HFD, with a clear distinction between the two diets on the principal component analysis (Figure 3b, left). Gene Ontology analysis of the 175 differential expressed genes between the two diets revealed “myeloid homeostasis” in the most enriched pathways (Figure 3b, right). Based on this finding, we next analyzed how alternate HFD modulated myeloid cell kinetics in the blood. As depicted in Figure 3c, the variations of circulating monocyte counts matched with variations in plasma cholesterol levels. Following initiation of HFD and rise in plasma cholesterol level, blood monocyte counts increased slowly and remained high after switching from HFD to regular chow diet, then decreased to baseline levels, as did plasma cholesterol levels. After re-exposure to HFD, blood monocyte counts reincreased and the changes induced by the 2nd exposure to HFD were similar to those observed after the 1st exposure (Figure 3d). MOMA+ macrophage contents in atherosclerotic plaques were similar between continuous and alternate HFD groups (Figure 3e). In addition, we characterized aortic immune cell populations in both groups, using single-cell RNA-seq with cellular indexing of transcriptomes and epitopes by sequencing (CITE-seq) 13 of total CD45+ cells from aortas (Extended Data Fig.3a). Based on the expression of canonical cell surface markers and lineage-specific transcripts, immune cell subsets were identified and annotated (Extended Data Fig.3b–c). Reclustering of cells corresponding to monocytes and macrophages identified previously described subsets of aortic resident, inflammatory and foamy macrophages (Extended Data Fig.3d–e), but proportions of monocyte/macrophage subpopulations did not significantly differ between the two groups (Extended Data Fig.3f).
Figure 3. HFD re-exposure induces acute neutrophilia and NETosis responsible for accelerated atherosclerosis.

a, kinetics of plaque size in the aortic sinus (n=6/group/timepoint). b, left, Principal Component Analysis of the top 500 most variable genes. Right Top 10 enriched pathways of the analysis of 175 differentially expressed genes between the two diets (n=4 Cont. N=5 Alt.). c, kinetics of monocyte counts in the blood (n=6/group/timepoint). d, comparison in alternate group of the variations in blood monocyte counts induced by exposure versus re-exposure to HFD (n=11 Cont. n=10 Alt.). e, macrophage content (MOMA staining, red) in atherosclerotic lesions at Week 13 (n=5/group). Scale bar 100 μm. f, kinetics of neutrophil counts in the blood (n=6/group/timepoint). g, comparison in alternate group of the variations of blood neutrophil counts induced by exposure versus re-exposure to HFD (n=10/group). h, proportion of immature CD62L+ neutrophils in the blood (n=5/group). i, comparison of plasma levels of Cxcl1, Cxcl2 and Ccl3 during exposure versus re-exposure to HFD. Variations are expressed relative to baseline value (n=5/group). j, top left: UMAP plot centered on the two aortic neutrophil subpopulations; top right: percentage of Neutro1 and Neutro2 populations among total aortic neutrophils; bottom: expression of selected marker genes in aortic neutrophil subpopulations. k, NET content (yellow) in atherosclerotic lesions (n=5/group) at Week 13. Scale bar 100 μm. l, male Ldlr−/− mice treated IP by isotype or anti-Ly6G depleting monoclonal antibody. m, examples of neutrophil depletion in the blood 48 hours after anti-Ly6G mAb injection. n, neutrophil kinetic in the blood of Ldlr−/− mice treated with isotype control (n=6) or anti-Ly6G mAb (n=7/group). o, quantitative analysis and representative photomicrographs of MPO+ cells (Green) in atherosclerotic lesions of male Ldlr−/− mice (isotype control n=7; anti-Ly6G mAb n=8); Scale bar 50 μm. p, atherosclerotic lesions in the aortic sinus of male Ldlr−/− mice treated by isotype control (n=7/group) or anti-Ly6G mAb (n=8/group); Scale bar 200 μm. All data are presented as mean values +/− SD except for a,c,f presented as mean values +/− SEM. P values were calculated using two-tailed Mann-Whitney test or Kruskal-Wallis test (n,o,p).
Given that myeloid and oxidative stress pathways were up-regulated in the aorta of the alternate HFD group (Figure 3b, right), we next focused on investigating the role of neutrophils. Following initiation of HFD, blood neutrophil counts also increased slowly and dropped after switching from HFD to chow diet (Figure 3f). More interestingly, after re-exposure to HFD, blood neutrophil counts increased again, but changes after the 2nd exposure to HFD were 5-fold higher than those following the 1st exposure (Delta neutrophil count: 5552 ± 1438 vs 970 ± 319 cells/μl) (Figure 3 f–g), associated with an increase in CD62L+ immature blood neutrophils (Figure 3h & Extended Data Fig.4a). These observations are consistent with the increase in plasma levels of CXCL1, CXCL2 and CCL3 during HFD re-exposure, major chemokines regulating neutrophil trafficking 14 (Figure 3i). Sc-RNA-seq analysis of aortic leukocytes identified two discrete neutrophil clusters, including a cluster (Neutro2) with a highly proinflammatory profile (Il1a, Il1b, Nlrp3, Tnf) that appeared numerically enriched in aortas of the alternate HFD group (Figure 3j). Neutrophil extracellular traps (NETs) content in atherosclerotic plaques was significantly higher in mice fed alternate HFD (Figure 3k) at this time point (week 13), as well as at the end of the protocol (Extended Data Fig.4b, week 16). Finally, to directly evaluate the contribution of alternate HFD-induced acute neutrophilia on atherosclerosis acceleration, animals were treated with isotype or mouse anti-Ly6G depleting antibody during the re-exposure period (Figure 3l). Preliminary tests confirmed that the newly developed mouse anti-Ly6G monoclonal antibody almost fully depleted circulating neutrophils with a protocol of IP injection every 48 hours (Figure 3m and Extended Data Fig.4c–d–e). Mice receiving repetitive injections of isotype control showed acute and transient neutrophilia in the alternate group after HFD diet re-exposure (Figure 3n) associated with a huge infiltration of MPO+ neutrophils in atherosclerotic plaques (Figure 3o), as well as increased atherosclerosis (Figure 3p). In animals treated with the mouse anti-Ly6G mAb, almost all circulating neutrophils were depleted during the study period, as well as the neutrophil content in vascular lesions (Figure 3n–o), and the pro-atherogenic effects of alternate HFD were abolished (Figure 3p). Plasma cholesterol levels were similar in all groups (Extended Data Fig.5a).
Alternate HFD and myelopoiesis
Altogether, our results highly suggest that alternate HFD selectively affected neutrophil trafficking and maturation, which subsequently accelerates atherosclerosis development. Previous works have shown that pre-exposure of animals to β-glucan 15 or Western diet 9 induced functional and epigenetic reprogramming of bone marrow (BM) granulocyte/macrophage progenitor cells (GMP), a process called “trained immunity” 10. To evaluate the contribution of BM cells on alternate HFD-induced atherosclerosis acceleration, we performed BM transplantation experiments. Briefly, Ldlr−/− mice were transiently exposed to a HFD (“exposed”) or regular chow during the early stage of life (6–10 weeks of age) and then fed a regular chow diet during 8 weeks (Figure 4a). At 18 weeks of age, blood monocyte and neutrophil counts were similar between groups (Extended Data Fig.5b), but the GMP and neutrophils were significantly higher in the BM of the exposed animals (Figure 4b–d & Extended Data Fig.6). We found higher levels of Il1β, Il6, Il18 and Tnfα mRNA in BM cells transiently exposed to HFD (Figure 4e). ScRNA-seq revealed that transient HFD had long term impact on neutrophilic progenitors profile with upregulation of the expression of 28 genes and downregulation of the expression of 29 genes, including Runx1, a master transcription factor in hematopoiesis (Figure 4f & Extended Data Fig.7). Next, isolated BM cells from exposed and non exposed animals were transplanted into irradiated naive Ldlr−/− mice and then put on a HFD for 8 weeks (Figure 4g). Interestingly, chimeric Ldlr−/− mice transplanted with BM cells from exposed mice, so-called “re-exposed”, developed 2-fold larger atherosclerotic plaques than chimeric control exposed mice (Figure 4h) despite similar plasma cholesterol levels (Figure 4i). These experiments confirmed that HFD promotes long term BM cell reprogramming toward a pro-atherogenic profile. In addition, re-exposed chimeric Ldlr−/− displayed a pro-inflammatory profile with higher BM production of IL-6 (Figure 4j).
Figure 4. Alternate HFD induces TLR4-dependent IL-1β production in the bone marrow responsible for neutrophil progenitor reprogramming.

a, experimental protocol with male Ldlr−/− mice. b, at 18 weeks, proportion of long-term (LT) and short-term (ST) hematopoietic stem cells (HSC) (n=5 non-expo, n=6 expo). c, proportion of BM Granulocyte/macrophage progenitors (GMP), Megakaryocyte/Erythroid progenitors (MEP), Common Lymphoid progenitors (CLP) (n=5 non-expo, n=6 expo). d, monocyte and neutrophil counts in the BM (n=5/group). e, mRNA levels of cytokines in the BM (n=5 non expo, n=7 expo). f, Volcano plot showing gene expression down regulated (blue) and up-regulated (red) in BM progenitors (n=5/group). g, experimental protocol of BM cell transplantation. h, atherosclerotic lesions in the aortic sinus (n=10/group). Scale bar 200 μm. i, plasma cholesterol levels (n=10/group). j, cytokine production by stimulated BM cells (n=10/group). k,l, proportion of hematopoietic stem cells and progenitors in the BM of male Ldlr−/− mice (n=6/group), one week after HFD re-exposure. m, immature CD62L+ neutrophils in the BM at week 13 (n=5/group). n, quantification of immature CD62L+ neutrophils producing IL-1 β in the BM at week 13 (N=5/group). o, cytokine production by stimulated BM cells (n=5/group). p, protocol of HFD re-exposure in C57Bl6 mice. q, kinetics of plasma cholesterol levels (n=5/group). r, kinetics of blood neutrophils in C57Bl6 (n=8/group). s, comparison in C57Bl6 (n=8 expo and n=7 re-expo), Cd36−/− (n=5), Myd88−/− (n=4) and Tlr4−/− (n=4 expo n=5 re-expo) mice of the variations of blood neutrophil counts. t, Il-1β mRNA levels in the BM of C57Bl6 (n=8), Cd36−/− (n=5), Myd88−/− (n=4) and Tlr4−/− (n=5) mice at sacrifice. u, experimental protocol with Ldlr−/− mice. v, proportion of GMP expressing Runx1 in the BM at week 13 (n=8/group). w,x, experimental protocol with Runx1+/+ GMP (Runx1lox/lox) and Runx1−/−GMP (Runx1lox/lox;Cebpa-Cre) mice and neutrophil kinetics in the blood (n=5/group). y, proportion of neutrophils producing IL-1 β in the BM after 4 weeks of HFD (n=5/group). Data are presented as mean values +/− SD. P values were calculated using two-tailed Mann-Whitney test or Kruskal-Wallis test (t).
Next, we investigated whether alternate HFD modulated hematopoietic and myeloid progenitors specifically in the experimental design illustrated in Figure 1a. Analyses were perfomed 1 week after re-exposure to HFD (Week 13). We found that the GMP population decreased in the BM of alternate HFD mice (Figure 4k–l), whereas immature CD62L+ neutrophils increased (Figure 4m), which reflects rapid myeloid progenitor maturation and emergency myelopoiesis 16 in response to HFD re-exposure. The proportion of immature CD62L+ neutrophils producing Il-1β also increased in the BM of alternate group (Figure 4n). Conversely, the megakaryocyte–erythroid progenitor proportion was higher in the BM of alternate HFD group (Figure 4l), whereas blood platelet counts trended to be lower (Extended Data Fig.8a), suggesting differentiation blockade. At this time point, BM cells from the alternate HFD group produced more IL-1β and IL-6 than BM cells from the continuous HFD group (Figure 4o). We next investigated which upstream receptors for lipids could be involved in emergency myelopoiesis, using genetically modified mouse models. First, we validated that acute neutrophilia following HFD re-exposure was also observed in C57Bl6 mice despite small variations of plasma cholesterol levels (Figure 4p–r). Interestingly, acute neutrophilia induced by HFD re-exposure was maintained in Cd36−/− mice, but was abolished in Myd88−/− and Tlr4−/− mice (Figure 4s) without any difference in plasma cholesterol levels between groups (Extended Data Fig.8b). We analyzed IL-1β levels in the BM which is an important mediator for myeloid lineage commitment 17 and differentiation of BM myeloid progenitors. IL-1β mRNA levels increased in the BM during re-exposure, compared to those after the first exposure to HFD (Extended Data Fig.8c). In addition, during re-exposure, IL-1β mRNA levels in BM were strongly reduced in mice deficient in Myd88 and Tlr4 (Figure 4t). Altogether these experiments support a critical role of TLR-4 receptor engagement in both emergency myelopoiesis and IL-1β production by BM cells in response to HFD re-exposure. Interestingly, the Runx1 transcription factor is required in GMP to negatively regulate inflammatory cytokine production by neutrophils 3. In our scRNA-seq analysis (Figure 4f), we found that Runx1 gene expression was downregulated in GMP after HFD discontinuation, and confirmed this in mice under alternate diet at week 12 just before re-exposure to HFD (Extended Data Fig.9a) and at week 13, one week after HFD re-exposure (Figure 4u–v). However, Runx1 expression in GMP was not different beween groups at week 16 (Extended Data Fig.9a), in agreement with the absence of differences in blood neutrophil count between groups at this time point. We reasoned that if decreased Runx1 levels contribute to neutrophilia in mice exposed to HFD, then elimination of Runx1 entirely may exacerbate neutrophilia. Indeed, mice in which both Runx1 alleles were eliminated in GMP by Cebpa-Cre (Runx1−/−GMP) developed neutrophilia after 4 weeks of HFD, as compared to control mice with floxed Runx1 alleles but lacking Cebpa-Cre (Runx1+/+GMP) (Figure 4w–x). Furthermore, the population of neutrophils producing IL-1β was 4-fold higher in the BM of Runx1−/−GMP mice, highlighting the key role of Runx1 in restraining the inflammatory phenotype of neutrophils (Figure 4y).
Using flow cytometry, we found that after HFD re-exposure, neutrophils were the main source of IL-1β in the BM. IL1 receptor was mainly expressed by GMP and neutrophils (Extended Data Fig.9b). In addition, qPCR analysis of sorted BM cells confirmed that IL-1β gene expression was 20-fold higher in purified neutrophils than in purified monocytes (Extended Data Fig.9c–d).
IL-1β pathways blockade
To subsequently evaluate the role of BM IL-1β overproduction in emergency myelopoiesis and accelerated atherosclerosis induced by alternate HFD, Ldlr−/− mice were lethally irradiated and transplanted with Il1β−/− BM cells. Four weeks after BM transplantation, required for recovery, chimeric Il1β−/− Ldlr−/− mice were put under alternate or continuous HFD (Figure 5a). Alternate HFD-induced acute neutrophila was abolished in the absence of IL-1β (Figure 5b). At sacrifice, plasma cholesterol levels were similar between mice fed continuous or alternate HFD (Figure 5c), and alternate HFD acceleration of atherosclerosis was abolished (Figure 5d). At sacrifice, IL-6 production by BM cells and splenocytes was similar between groups (Figure 5e & Extended Data Fig.10a). Next, in order to evaluate directly the contribution of Il1β downstream pathways in myeloid cells to the systemic and vascular effects of alternate HFD, Ldlr−/− mice were lethally irradiated and transplanted with BM cells isolated from LysMCre+/−Il1rlox/lox mice, carrying a specific deletion of IL-1 receptor in myeloid cells as well as in BM progenitors 18 (Figure 5f). Blockade of IL-1β downstream signaling pathway abolished acute neutrophilia (Figure 5g), and the acceleration of atherosclerosis (Figure 5h–i) induced by alternate HFD. Finally, IL-6 production by BM cells and splenocytes from chimeric Ldlr−/− LysMCre+/−Il1r lox/lox mice was also similar between groups at sacrifice (Figure 5j & Extended Data Fig.10b).
Figure 5. IL-1β signaling pathway blockade abolishes alternate HFD-induced neutrophilia and accelerated atherosclerosis.

a, experimental protocol with chimeric Il1β −/−Ldlr−/− mice. b, comparison in alternate group of the variations of blood neutrophil count induced by exposition versus re-exposition to HFD (n=10/group). c, plasma cholesterol levels at sacrifice (n=8/group). d, quantitative analysis and representative photomicrographs of atherosclerotic lesions in the aortic sinus of chimeric Il1β −/− Ldlr−/− mice. Scale bar 200 μm. e, cytokine production by stimulated BM cells at sacrifice from continuous or alternate HFD fed chimeric Il1β−/−Ldlr−/− mice (n=8/group). f, experimental protocol with chimeric LysMCre+/−Il1rlox/lox Ldlr−/− mice. g, comparison in alternate LysMCre+/−Il1rlox/lox Ldlr−/− group of the variations of blood neutrophil counts induced by exposure versus re-exposure to HFD (N=9/group). h, plasma cholesterol levels at sacrifice (n=9/group). i, quantitative analysis and representative photomicrographs of atherosclerotic lesions in the aortic sinus of LysMCre+/−Il1rlox/loxLdlr−/− (n=10 Cont. n=9 Alt.). Scale bar 200 μm. j, cytokine production by stimulated BM cells at sacrifice (n=9/group). k, Ldlr−/− mice were treated by anti-IL-1β neutralizing antibody during the last 4 weeks of the protocol. l, comparison in anti-IL-1β-treated alternate group of the variations of blood neutrophil count induced by exposition versus re-exposition to HFD (n=8/group). m, plasma cholesterol levels at sacrifice of anti-IL-1β-treated Ldlr−/− mice fed either continuous (n=7) or alternate HFD (n=8). n, quantitative analysis and representative photomicrographs of atherosclerotic lesions in the aortic sinus of anti-IL1β -treated Ldlr−/− mice (n=8). Scale bar 200 μm. o, cytokine production by stimulated BM cells at sacrifice from anti-IL1β-treated Ldlr−/− mice fed either continuous (n=7) or alternate HFD (n=8). Data are presented as mean values +/− SD. P values were calculated using two-tailed Mann-Whitney test.
Both genetically-modified mice models highlighted the critical role of IL-1β in the pro-atherogenic effects of alternate HFD. Finally, we tested an immunomodulatory pharmacological approach to reverse the pathogenic impact of alternate HFD. Ldlr−/− mice under a continuous or alternate HFD were treated with neutralizing anti-IL-1β antibody during the re-exposure period (Figure 5k). Interestingly, we found that IL-1β pharmacological blockade abolished the pro-inflammatory (Figure 5 l–o & Extended Data Fig.10c) and pro-atherogenic effects (Figure 5m–n) of alternate HFD. We obtained the same athero-protective effect when animals when treated with MCC950, a pharmacological inhibitor of NLRP3 inflammasome 19, during the re-exposition period (Extended Data Fig.10d–h).
Discussion
Using several in vivo complementary approaches, we demonstated that alternate HFD significantly accelerated atherosclerosis in Ldlr−/− and Apoe−/− mice throughout the aorta (aortic sinus, ascending and descending aorta), and induced a more advanced plaque phenotype, independently of the adaptive immunity. This accelerated atherosclerosis was accounted for by IL-1β-dependent differentiation of BM neutrophil progenitors responsible for neutrophilia and NETosis induced by HFD re-exposure.
Animal models of atherosclerosis were undoubtedly helpful to decipher the immune pathophysiological mechanisms of atherosclerosis. However, analyses were classically done in experimental models of athero-prone animals that develop chronic hypercholesterolemia under continuous HFD. Obviously, experimental continuous diet regimen markedly differs from the human condition where changes in dietary habits, or in the use of cholesterol lowering drugs, and associated variations in plasma cholesterol levels occur over time. Weight cycling, a good example for dietary habit changes (also known as “Yo-yo dieting” that describes the pattern of losing weight, regaining it and then dieting again) is independently associated with an increased risk of developing stroke and myocardial infarction 2. Our experimental findings are also in agreement with epidemiological observations in humans showing an acute burden of cardiovascular events after statin therapy discontinuation in previously adherent 75-year-olds treated for primary 7.
To decipher the pro-atherogenic mechanisms of accelerated atherosclerosis induced by alternate HFD, we first analyzed blood monocytes, a central population in atherosclerosis development. Previous works have shown that blood monocyte count correlates with atherosclerotic plaque size in mice 20 and the inhibition of monocytosis through chemokine/chemokine receptor gene deletion strongly reduces experimental atherosclerosis development 20. Here, we observed that a first exposure to HFD induced a progressive increase in blood monocytes that returned to baseline after switching to regular chow diet. HFD re-exposure had the same impact on monocytosis as the first exposure. Monocyte infiltration and macrophage content in atherosclerotic plaques were similar between continuous and alternate HFD groups at early and late stages. All these observations highly suggested that alternate HFD had no specific effect on monocyte trafficking but did not exclude the possibility that monocytes/macrophages have a pro-inflammatory phenotype. Christ et al. previously reported that transient Western Diet modulates circulating monocytes with higher expression of CD86 and higher production of pro-inflammatory cytokines and chemokines, but the phenotype was obtained after acute LPS challenge, which markedly differs from our experimental conditions 9.
Our transcriptomic findings showing that myeloid pathways and oxidation-related pathways were enriched in atherosclerotic plaques of mice fed alternate HFD led us to investigate more specifically the role of neutrophils. We found that alternate HFD had major effects on the neutrophil population. Circulating neutrophil counts markedly increased following HFD re-exposure, associated with a rise in plasma levels of CXCL1, CXCL2 and CCL3, chemokines regulating granulocyte trafficking 14. Such a finding is particularly clinically relevant in that neutrophilia has been identified as an independent predictor of cardiovascular outcomes in various human clinical studies 21. We also found increased infiltrating neutrophil numbers in plaques of alternate HFD groups. Although experiments using anti-Ly6G depleting antibody provided direct evidence for the pro-atherogenic role of neutrophils under conditions of alternate HFD, we did not address the mechanisms whereby neutrophils aggravated atherosclerosis. Myeloperoxidase, stored within primary granules, might be an atherogenic weapon facilitating the formation of reactive oxygen species (ROS). ROS has known roles in lipoprotein modification and endothelial cell activation 22. Kalafati et al. recently reported that β-glucan induces BM neutrophil reprogramming, resulting in an enhanced anti-tumor neutrophil phenotype that is mediated by ROS production 23. Similarly, BCG vaccination reprograms neutrophil function towards increased ROS production 24. NETs, which significantly accumulate at both early and late stages in plaques of alternate HFD mice, may promote atherosclerosis through local vascular and immune cell activation. Warnatsch et al. have reported that NETs can directly prime macrophages for IL-1β and IL-6 production 25. In humans, NETs are associated with markers of plaque vulnerability and may be associated with athero-thrombotic complications 26. Finally, as underlined by our transcriptomic analysis, infiltrating neutrophils in plaques of alternate HFD diet may release locally pro-inflammatory and pro-atherogenic cytokines 27.
The long-term effects (several weeks) of alternate HFD are unlikely due to direct impact of hypercholesterolemia on blood neutrophils, as these cells have a short lifespan in the circulation. Recent works showed transcriptomic and epigenetic reprogramming of BM progenitors after β-glucan challenge or transient Western diet feeding 9,15. Consistently, we observed higher proportion of GMP in the BM of mice transiently fed a HFD. This observation is relevant for human cardiovascular diseases. Rohde et al. demonstrated that BM hematopoietic stem cells (HSC) from patients with atherosclerosis and hypertension or post-myocardial infarction showed higher proliferation rate compared to controls, specifically in common myeloid and granulocyte macrophage progenitors 28. Noz et al. also reported, using transcriptomic analysis, enrichment of neutrophil-related pathways of HSC/GMP cell populations in patients with established coronary artery disease 29. Finally, BM cell transplantation (pre-exposed or not to HFD) in naïve Ldlr−/− mice demonstrated that BM myeloid progenitors expansion induced by HFD had pro-atherogenic effects.
When comparing continuous versus alternate HFD, we observed one week after re-exposure to HFD that the GMP population decreased in the BM, whereas neutrophil counts in the blood increased suggesting acute differentiation of GMP for emergency myelopoiesis 30. Consistently, the proportion of CD62L+ immature neutrophils in both BM and blood increased. Such response was mediated by TLR4, since acute neutrophilia as well as IL-1β production were abolished during HFD re-exposure in Myd88−/− and Tlr4−/− mice.
We also identified Runx1 as a key regulator of emergency myelopoiesis during HFD re-exposure. Runx1 is well characterized for its roles as a key transcriptional regulator of haematopoiesis and blood malignancies 31. Recently, Runx1 was shown to restrain a pro-inflammatory epigenetic and transcriptional program in GMP and neutrophils, and Runx1 gene deletion in GMP results in overproduction of inflammatory cytokines by neutrophils in response to LPS 3,32. This is in line with our results showing increased IL-1β+ neutrophils in the BM and increased neutrophilia in mice in which Runx1 was eliminated in GMP compared to control mice after 4 weeks of HFD. In our study, we found that Runx1 expression decreased in GMP after HFD discontinuation, but this effect was transient, since Runx1 expression in GMP progressively increased in the alternate group during the period of HFD re-exposure, reaching the same level as that in mice under continuous HFD at sacrifice. Our findings highlight the key role of Runx1 as regulator of emergency myelopoiesis. Further studies are required to decipher the underlying molecular mechanisms controlling its expression during HFD exposure and discontinuation.
In emergency myelopoiesis, cell-fate decision already takes place at the level of non-committed progenitors 33. Myeloid-lineage priming is regulated by a complex interplay between myeloid-specific growth factors, cytokines, and transcriptions factors 33. IL-1β promotes proliferation and myeloid differentiation in HSPCs and progenitors by inducing a PU.1-based myeloid gene program 17. Herein, we showed that HFD re-exposure resulted in increased levels of IL-1 β in the BM but not in the spleen. Flow cytometry analysis as well as qPCR analysis of sorted cells in the BM showed that IL-1β was mainly produced by neutrophils, while its receptor was expressed by GMP and neutrophils. Altogether, these results highly suggest that during HFD re-exposure, IL1β stimulated newly generated neutrophils in an autocrine manner and promoted GMP differentiation into neutrophils, resulting in an amplification loop. Experiments using genetically-modified mouse models and anti-IL-1β neutralizing antibody provided compelling evidence that IL-1β played a central role in both emergency myeloipoiesis and atherosclerosis acceleration induced by alternate HFD. Spleen IL-6 levels in alternate HFD fed mice were higher than those in continuous HFD, but these differences were abolished in chimeric Ldlr−/−Il1β−/− and Ldlr−/− LysMCre+/−Il1rlox/lox mice, highly suggesting that IL-6 overproduction by alternate HFD was due to IL-1 β pathway engagement 34. Finally, using anti-IL1β neutralizing mAb, we showed that alternate HFD-induced BM reprogramming could be reversed, paving the way for future immunomodulatory approaches for cardiovascular diseases in patients with hypercholesterolemia. Our results echo the recent CANTOS trial, which showed benefit of IL-1β blockade in humans at cardiovascular risk 35.
Finally, we found that alternate HFD still accelerated atherosclerosis development despite antibiotic-mediated gut microbiota depletion, which suggests that the pro-atherogenic effect of alternate HFD was unlikely due to gut microbiota modulation. However, additional experiments (ie. germ-free and/or gut microbiota transfer) are required to specifically address the role of microbiota in alternate HFD-induced accelerated atherosclerosis.
Conclusion
Altogether, our studies showed that alternate HFD accelerates atherosclerosis through IL-1β -dependent neutrophil progenitor reprogramming. Pro-atherogenic effect of alternate HFD could be reversed by anti-IL1β neutralizing antibody or inflammasome inhibitor.
Methods
Animals.
Experiments were conducted according to the guidelines formulated by the European Community for experimental animal use (L358–86/609EEC) and were approved by the Ethical Committee of INSERM (APAFIS #29371) and the French Ministry of Agriculture (MESRI #29371). Apoe−/−, Ldlr−/−, Apoe−/−Rag2−/− mice were obtained from Jackson Laboratories (Bar Harbor, ME, USA). C57bl/6J Cd36−/− mice (null for the Cd36 gene) were generated in Dr. Roy Silverstein’s laboratory (Febbraio et al JBC 1999). Tlr4−/− and Myd88−/− mice were a kind gift of S. Akira (Osaka, Japan) and were provided by F. Pène (Institut Cochin, Inserm U1016, CNRS UMR8104, Université de Paris, Paris). Cebpa-Cre+/− Runx1lox/lox mice were described previously (Zezulin et al 2023). Il1β−/− and LysMCre+/− Il1rlox/lox were provided by Dr Emmanuel Pinteaux (University of Manchester, Manchester, UK). All mice were on C57bl/6J background. To generate chimeric Ldlr−/− mice, 10-week old C57bl/6J Ldlr−/− mice were subjected to medullar aplasia by lethal whole-body irradiation (9.5 grays). The mice were repopulated with an intravenous injection of bone marrow cells isolated from femurs and tibias of sex-matched Il1β−/− or LysMCre+/− Il1r lox/lox littermates. After 4 weeks of recovery, mice were fed specific diet. For in vivo experiments, a pro-atherogenic HFD was used containing 15% fat, 1.25% cholesterol, and 0% cholate.
Pharmacological in vivo treatment
To deplete neutrophils, animals were treated by a mouse anti-Ly6G IgG2a monoclonal antibody intraperitoneally (200 µg/48 hours) (Clone 1A8, cat. N° Ab00295–2.0, Absolute Antibody company) during 4 weeks 36. To block in vivo the interaction of IL-1β with its receptors, animals were treated by anti-mouse IL-1β IgG2a monoclonal antibody IP (200 mg/kg/5 days intraperitoneally during 4 weeks). The IL-1β neutralizing antibody was a donation from Novartis (Basel, Switzerland). The first dose of anti- IL-1β mAb was injected one day before re-exposure to HFD. To block inflammasome in vivo, mice were treated by NLRP3 inflammasome pharmacological inhibitor (MCC950, 10 mg/kg every 2 days IP) during the last 4 weeks of the protocol.
Extent and composition of atherosclerotic lesions.
Plasma cholesterol was measured using a commercial cholesterol kit (DiaSys® Cholestérol FS*). Quantification of lesion size was performed as described previously 37. Briefly, the basal half of the heart ventricles and the ascending aorta were perfusion-fixed in situ with 4% paraformaldehyde, then transferred to a PBS-30% sucrose solution, embedded in frozen OCT and stored at −80°C. Serial 10-μm sections of the aortic sinus with valves (80 per mouse) were cut on a cryostat. One section out of 5 was used for plaque size quantification after Oil red O staining. In total, 16 sections spanning over 800 μm of the aortic root were used to determine the mean lesion area for each mouse. After PBS flushing, the aorta from the root to the iliac bifurcation was removed and fixated with 10% neutral-buffered formalin. After thorough PBS washing, the adventitial tissue was removed and the aorta was longitudinally opened to expose the luminal surface for en-face visualization of atherosclerotic lesions after Oil Red O staining. Quantification of Oil Red O positive surface area was performed by a blinded operator. Aortic collagen content was detected using Sirius red staining. Necrotic core surface was quantified after Masson’s Trichrome staining. At least 4 sections per mouse were examined for each immunostaining, and appropriate negative controls were used. Morphometric studies were performed using Histolab software (Microvisions, version 11.1.1). For immunostaining on mouse atherosclerotic plaques, we used antibodies raised against MOMA-2 (MAB1852, Merck Milllipore®, 1:100) and CD3 (A0452, Dako®, 1:200) to detect macrophages and T cells respectively. All analyses were performed blindly. No randomization and no sample size calculation were performed.
Cell culture.
Splenocytes or bone marrow cells were cultured in RPMI 1640 supplemented with Glutamax, 10% fetal calf serum (FCS), 0.02 mM β-mercaptoethanol and antibiotics. For cytokine measurements, splenocytes were stimulated with TLR agonists PAM3 (10μg /ml) or LPS (1 μg/ml) and IFN-γ (100 UI/ml) for 24 hours. IL-1β, IL-6, IL-10, IL-18 and TNF-α production in the supernatants were measured using specific ELISA immunoassay kits (BD Biosciences).
Flow cytometry
Blood, spleen and bone marrow samples were collected at sacrifice for analysis of leukocyte subsets. Classical monocytes were defined as NK1.1-CD11b+Ly6G-Ly6Chigh cells; Non-classical monocytes were defined as NK1.1-CD11b+Ly6G-Ly6Clow cells; neutrophils were defined as NK1.1-CD11b+Ly6G+ cells. CD4+ T Lymphocytes were selected as NK1.1-B220-CD11b-CD3+CD4+ cells, CD8+ T Lymphocytes were selected as NK1.1-B220-CD11b-CD3+CD8+ cells. B cells were defined as NK1.1-CD11b-B220+ cells. In the bone marrow, LT-HSC were defined as Lin-CD45+MHCII-ckithighScahighCD48-CD150+ and ST-HSC were defined as Lin-CD45+MHCII-ckithighScahighCD48-CD150+. C, Proportion of BM progenitors :granulocyte/macrophage progenitors (GMP, Lin-CD45+MHCII-ckithighSca−CD16+CD34+), Megakaryocyte/erythroid progenitors (MEP, Lin-CD45+MHCII-ckithighSca−CD16-CD34-), Common Lymphoid progenitors (CLP, Lin-CD45+MHCII-ckitlowSca+CD135+). The following primary conjugated antibodies were used for staining in the blood, the bone marrow and the spleen: anti-CD45 (PerCP, clone 30-F11, BD Biosciences), anti-CD11b (eFluor 450, clone M1/70, eBioscience), anti-Ly6C (FITC, clone AL-21, BD Biosciences), anti-Ly6G (PE, clone 1A8, BD Biosciences), anti-CD3e (PerCP-Cy5.5, clone 145–2C11, eBioscience), anti-CD45R (B220) (V500, clone RA3–6B2, BD Biosciences), anti-CD4 (PE-Cy7, clone RM4–5, eBioscience), anti-CD8a (Alexa Fluor 700, clone 53–6.7, BD Biosciences), anti-NK1.1 (APC, clone PK136, eBioscience), anti-CD62L (eFluor 450, clone MEL-14, eBioscience). Anti-CD11b (FITC, clone M1/70, BD Biosciences), anti-CD11c (PECy7, clone HL3, BD Biosciences), anti-CD45 (BV510, clone 30-F11, BD Biosciences), anti-Lin (CD3e, CD11b, B220, Ter119, Ly6C+Ly6G, BV450, clones 500A2; M1/70; RA3–6B2; TER119; RB6–8C5, BD Biosciences), anti-Sca1 (BUV395, clone E13–161.7, BD Biosciences), anti-FLK2 (CD135) (APC, clone A2F10.1, BD Biosciences), anti-CD3e (APC, clone 145–2C11, eBioscience), anti-RUNX-1 (PE, clone RXDMC, eBioscience), anti-MHCII (FITC, clone M5/114.15.2, eBioscience), anti-pro IL1b (PECy7, clone NJTEN3, eBioscience), anti-IL1R (APC, clone JAMA-147, Biolegend), anti- cKIT (CD117) (APC-Cy7, clone 2B8, Biolegend), anti-CD150 (BV711, clone TC15–12F12.2, Biolegend), anti- CD48 (PE, clone HM48–1, Biolegend), anti-CD34 (PECy7, clone MEC14.7, Biolegend), anti-CD16/32 (FITC, clone 93, Biolegend), anti-Ter119 (BV510, clone Ter119, Biolegend). anti-CD115 (PE, clone AFS98, Tonbo). All antibodies were used at the dilution 1:100. Forward scatter (FSC) and side scatter (SSC) were used to gate live cells excluding red blood cells, debris, and cell aggregates in total blood cells and splenocytes preparations. Cells were acquired using a BD LSRII Fortessa flow cytometer (BD Biosciences) and analyzed with FlowJo™ (Becton Dickinson & Company (BD) version 10.9.0).
Quantitative real time PCR
Quantitative real time PCR was performed using a Step-one Plus (Applied Biosystems™). Gapdh cycle threshold was used to normalize gene expression: Forward 5’-CGTCCCGTAGACAAAATGGTGAA-3’; Reverse 5’-GCCGTGAGTGGAGTCATACTGGAACA-3’. The following primer sequences were used: Il1b: Forward 5’-GAAGAGCCCATCCTCTGTGA-3’; Reverse 5’-GGGTGTGCCGTCTTTCATTA-3’; Tnfa: Forward 5’-GATGGGGGGCTTCCAGAACT-3’, Reverse: 5’-CGT GGG CTA CAG GCT TGT CAC-3’, Il6: Forward 5’-TGACAACCACGGCCTTCCCTA-3’, Reverse 5’-TCAGAATTGCCATTGCACAACTCTT-3’, Il10: Forward 5’-CTCCTAGAGCTGCGGACTGCCTTCA-3’, Reverse 5’-CTGGGGCATCACTTCTACCAGGTAAAA-3’. Relative expression was calculated using the ∆∆Ct method. For the microarray gene analysis, total RNAs were retrotranscribed with RT2 First Strand Kit (SABiosciences, Tebu-bio, Le Perray-en-Yvelines, France) for PCR arrays (Mouse Innate Immune Profiler PCR Arrays; SABiosciences). All PCRs were performed in a MyiQ Thermal Cycler and quantified by iQ5 software (Qiagen). PCR array results were analyzed using PCR Array Data Analysis Software (SABiosciences) and normalized with 5 house- keeping genes (GEO number :GSE161216).
Single cell RNA-seq of aortic leukocytes
Ldlr−/− mice were fed a HFD according to the “Continuous” or “Alternate” diet protocols. C57bl6/J mice were used as healthy controls. Before sacrifice, mice received an i.v. injection of 2.5µg anti-CD45.2 APC (clone 104, Biolegend, cat. #109814) under isoflurane anesthesia to exclude contaminating blood leukocytes during FACS sorting. Mice were killed by cervical dislocation under isoflurane anesthesia, perfused via intracardiac injection of PBS, and the aorta excised and cleaned of perivascular adipose tissue. Aortas from 2 mice were pooled to generate each sample for single cell RNA-seq (scRNA-seq). The aortas were digested for 1 hour at 37°C under agitation in RPMI containing 450U/ml collagenase I (Sigma-Aldrich, #C0130), 125U/ml Collagenase XI (Sigma-Aldrich, C7657), 60U/ml Hyaluronidase (Sigma-Aldrich, H3506), 60U/ml DNAse (Roche #11284932001). After washing with PBS supplemented with 1% FCS, aortic cell preparations were incubated on ice in PBS+1%FCS supplemented with 1:50 FcBlock (BioLegend TruStain FcXTM) for 10 minutes, and further incubated for 25 minutes with a mix of fluorochrome coupled antibodies (anti-CD45.2-Alexa488 Biolegend #109815, clone 104, 1:300, anti-Ter119-PE-Cy7, Biolegend, #116221, clone TER119, 1:300), a viability dye (ThermoFisher Fixable Viability Dye e780), TotalSeq-A CITE-seq (all from BioLegend, see table below) and mouse TotalSeq-A Hashtag antibodies (1:200; BioLegend). Cell preparations were labeled using the following scheme:
Hashtag 1 to 5: 5 pools of 2 aortas from Ldlr−/− mice fed the “Continuous” diet protocol
Hashtag 6 to 10: 5 pools of 2 aortas from Ldlr−/− mice fed the “Alternate” diet protocol
Hashtag 11 to 13: 3 pools of 2 aortas from healthy C57BL6/J mice
After two washes, all cell preparations were pooled for simultaneous sorting. We sorted viable Ter119negCD45.2(i.v.)negCD45.2-Alexa488pos in PBS supplemented with 0.2% ultrapure BSA (ThermoFisher) using a FACS Aria III with a 100µm nozzle. After sorting and washing, cells were resuspended in PBS supplemented with 0.2% ultrapure BSA at a concentration of 500 cells/µl and loaded into the 10x Genomics Chromium in duplicate lanes. Single Cell 3’ v3 reagents, 10x Genomics) and scRNA-seq, ADT and HTO libraries prepared and sequenced as described in 38. The following CITE-seq antibodies were used:
Ly6G (barcode ACATTGACGCAACTA, dilution 1/500), F4/80 (TTAACTTCAGCCCGT, 1/200), CD11b (TGAAGGCTCATTTGT, 1/200), CD86 (CTGGATTTGTGTATC, 1/400), CD62L (TGGGCCTAAGTCATC, 1/400), CD135 (GTAGCAAGATTCAAG, 1/300), IA-IE (GGTCACCAGTATGAT, 1/500), CD103 (TTCATTAGCCCGCTG,1/300), ICAM1 (ATAACCGACACAGTG, 1/300), CD169 (ATTGACGACAGTCAT,1/300), Ly6C (AAGTCGTGAGGCATG 600), CD8a (TACCCGTAATAGCGT, 1/400), CD115 (TTCCGTTGTTGTGAG, 1/300), SiglecH (CCGCACCTACATTAG, 1/300), CXCR4 (GTCGTGGTGTTGTTC, 1/300), CD19 (ATCAGCCATGTCAGT, 1/400), Msr1 (AGCTAGACACGTTGT, 1/300), CD3 (GTATGTCCGCTCGAT, 1/400), CD64 (AGCAATTAACGGGAG, 1/300), CD63 (ATCCGACACGTATTA, 1/300), FCeRIa (AGTCACCTCGAAGCT,1/300), CD9 (TAGCAGTCACTCCTA, 1/300), CCR3 (TAGAACCGTATCCGT,1/300), CD163 (GAGCAAGATTAAGAC, 1/300), CD49d (CGCTTGGACGCTTAA, 1/300), NK1.1 (GTAACATTACTCGTC, 1/300), CD80 (GACCCGGTGTCATTT, 1/400), CD279 (GAAAGTCAAAGCACT, 1/300), CD117 (TGCATGTCATCGGTG, 1/300), CD127 (GTGTGAGGCACTCTT, 1/300), Sca1 (TTCCTTTCCTACGCA, 1/300), CD68 (CTTTCTTTCACGGGA, 1/300), CD11c (GTTATGGACGCTTGC, 1/300), Sirpa (GATTCCCTTGTAGCA, 1/300), TIM4 (TGCTGGAGGGTATTC, 1/200), CD274 (TCGATTCCACCAACT, 1/300), CX3CR1 (CACTCTCAGTCCTAT ,1/200), ITGB7 (TCCTTGGATGTACCG, 1/300), XCR1 (TCCATTACCCACGTT,1/200), CD4 (AACAAGACCCTTGAG, 1/400), CD26 (ATGGCCTGTCATAAT,1/200), TCRgd (AACCCAAATAGCTGA, 1/300), MGL2 (CTTGCCTTGCGATTT,1/200).
10X Genomics data, including HTO and ADT libraries, was demultiplexed using Cell Ranger software (Pipeline Version 6.0.2). Mouse mm10 reference genome was used for the alignment and counting steps. The Feature-Barcode matrix obtained from Cell Ranger was further analyzed in Seurat v3.1.1 39. The “HTODemux” function was used to identify sample of origin of single cells, exclude multiplets (i.e. cells positive for more than one hashtag signal) and cells with no detectable hashtag signal. Cells with more than 10% mitochondrial transcripts were excluded from further analysis. Data were normalized using the “NormalizeData” function, and 2000 variable features identified with the “FindVariableFeatures” function using the “vst” selection method. Data were scaled using the “ScaleData” function and principal component (PC) analysis performed. Batch correction of duplicate scRNA-seq libraries was performed using Harmony 40. Clustering was performed using the “FindNeighbors” and “FindClusters” functions with 20 PCs and a resolution parameter of 0.3. Uniform Manifold Approximation and Projection (UMAP) dimensional reduction was performed using 20 PCs. Immune cell populations were identified based on marker transcripts and CITE-seq signal for established cell surface markers. Cells corresponding to monocytes/macrophages were subset in a new Seurat object and reclustered, and annotated based on previous analyses 41. Enriched transcripts and cell surface markers in monocyte/macrophage and neutrophil populations were determined using the “FindAllMarkers” function. Data visualizations were generated using built-in functions in Seurat (e.g. “FeaturePlot”, “DotPlot”) and dittoSeq (https://github.com/dtm2451/dittoSeq).
scRNA-seq analysis of bone marrow progenitors
Multiplexed scRNA-seq library preparation
Femur bones from HFD-exposed and non-exposed Ldlr−/− mice (n=4/group) were dissected. Bone marrow cells were flushed with DMEM + 10%FCS, washed once and passed through 70 μm cell strainers. CD11b+ cells were first depleted with CD11b magnetic microbeads (Miltenyi Biotec, Bergish Gladbach, Germany) and flow through was collected. The cells were later applied to the mouse lineage cell depletion kit (Miltenyi Biotec) to enrich progenitor cells. On average, around 9×10⁵ Lin− cells were isolated per mouse. Lin− cells were fixed according to Evercode Fixation (ParseBiosciences, Seattle, USA) protocol and single cell RNA libraries were prepared based on SPLiT-Seq approach with ParseBio Evercode WT Mega v2 kit. Sequencing was performed in Illumina NovaSeq 6000 sequencer with S4 flow cell 200 cycle kit according to sequencing protocol provided by Evercode kit (v1.5).
Multiplexed scRNA-seq data analysis
The conversion of BCL to FASTQ files was executed using Illumina’s bcl2fastq (version 2.20.0.422). ParseBio’s analysis pipeline split-pipe (version 1.0.5p) facilitated demultiplexing, alignment of sequencing reads, and the compilation of the cell-by-gene count matrix, referencing the mm10 genome. Subsequent analyses were conducted in R (version 4.2) employing Seurat (version 4.3.0.1, 42). Cells with a gene detection range outside of 1,000 to 8,000, or a mitochondrial gene ratio exceeding 10% (or at 0%), were excluded. scDblFinder’s default parameters were utilized to identify and remove potential doublets 43. Normalization involved dividing feature counts per cell by the total cell counts, followed by scaling to 10,000 and log transformation (log1p). The top 2,000 genes, identified by Seurat’s FindVariableFeatures with the vst method, were used for Principal Component Analysis (PCA). For the subsequent visualization via UMAP, the first 20 principal components were employed to expedite calculations. Clustering entailed a KNN graph which was constructed using the first 20 principal components and Euclidean distance within the PCA framework, with the Louvain algorithm set at a resolution of 1.2. Cell types were annotated manually via known marker gene expression within each cluster. Differential gene expression was determined using Seurat’s FindMarkers, with a significance threshold of p < 0.01.
Stool collection and DNA extraction
Fecal samples were homogenized and 0.2g aliquots were stored at −80°C for further analysis. DNA was extracted from fecal samples as previously described 44. Briefly, following microbial lysis by mechanical and chemical methods, nucleic acids were precipitated in isopropanol for 10 min at room temperature, incubated for 15 min on ice and centrifuged at 20,000g for 30 min at 4°C. Pellets were resuspended in 450 μl of PBS and 50 μl of potassium acetate. After RNase treatment and DNA precipitation, nucleic acids were recovered via centrifugation at 20,000g for 30 min at 4°C. The pelleted DNA was resuspended in 80 μl of trypsin-EDTA buffer.
Sequencing
Microbiota analysis was performed by amplicon sequencing of the V3-V4 region of the 16S ribosomal RNA gene. This region was amplified using the following primers – 16S sense 5′-TACGGRAGGCAGCAG-3′ and anti-sense 5′-CTACCNGGGTATCTAAT-3′ – according to an optimized and standardized 16S amplicon library preparation protocol (Metabiote, GenoScreen, Lille, France). Briefly, PCR of the 16S DNA was performed with 5 ng of genomic DNA according to the manufacturer’s protocol (Metabiote), with bar-coded primers (Metabiote MiSeq Primers) to a final concentration of 0.2 μmol/l, with an annealing temperature of 50°C for 30 cycles. Purification of the PCR products was performed with Agencourt AMPure XP-PCR purification system (Beckman Coulter, Brea, CA, USA), and quantified following the manufacturer’s instructions. The samples were multiplexed at equal concentrations. Sequencing was performed on an Illumina MiSeq platform (Illumina, San Diego, CA, USA) using a 250 bp paired-end sequencing protocol at GenoScreen. Raw paired-end reads were subjected to the following processes: (1) quality filtering using the PRINSEQ-lite PERL script 45, by truncating the bases from the 3′ end, that did not exhibit a quality <30, based on the Phred algorithm and (2) searching for and removing both forward and reverse primer sequences using CutAdapt, with no mismatches allowed in the primer sequences. Only sequences where perfect matching forward and reverse primers were detected were included.
Microbiota analysis
Reads were processed through Qiime2 (version 2020.8.0; 46): low-quality reads and sequencing adaptors were removed using Cutadapt, and remaining sequences were denoised with Dada2 47 using custom parameters (--p-trunc-len-f 230 --p-trunc-len-r 220). Taxonomic assignation of resulted ASVs was done using a trained SILVA database (version 138–99; 48) based on scikit-learn’s naïve Bayes algorithm. Results were deep analyzed with the Phyloseq package 49 in R (version 4.0.5) as for the analysis of taxonomic and alpha diversity. Statistical analyses were performed using rstatix (version 0.7) and figures were plotted using the ggplot2 package. The normality and homoscedasticity of the data were checked before using t-tests. Principal Coordinates Analysis (PCoA) was carried out on the Bray-Curtis dissimilarity matrice constructed from the abundance of species. Communities that emerged were verified using a PERMANOVA test with Vegan package (version 2.5–7), and the confidence interval were plotted at 95% and 97% confidence limits using the standard deviation method. Differential analysis was performed using the linear discriminant analysis effect size (LEfSe) method 50. In all statistical analyses, differences with p values < 0.05 were considered significant.
RNA sequencing and analysis
After RNA extraction, RNA concentrations were obtained using nanodrop or a fluorometric Qubit RNA assay (Life Technologies, Grand Island, New York, USA). The quality of the RNA (RNA integrity number) was determined on the Agilent 2100 Bioanalyzer (Agilent Technologies, Palo Alto, CA, USA) as per the manufacturer’s instructions. RNA sequencing libraries were prepared from 100 ng of total mRNA using the Illumina® Stranded Total RNA Prep. Fastq files were aligned using STAR algorithm (version 2.7.6a), on the mm10 Ensembl release 101 reference. Reads were then count using RSEM (v1.3.1) and the statistical analyses on the read counts were performed with R (version 3.6.3) and the DESeq2 package (DESeq2_1.26.0), with the Benjamini-Hochberg FDR control procedure to identify the differentially expressed genes. We performed the gene set enrichment analysis using clusterProfiler v4.0.5.
Statistical analysis.
Graphs and statistical analyses were performed using Prism software (Graphpad). Values are expressed as mean ± s.e.m. Differences between values were examined using the two-tailed Mann-Whitney test. When 3 or more experimental groups were compared, two-tailed Kruskal-Wallis test was used. Statistical significance was reached when P<0.05.
Extended Data
Extended Data figure 1. Characteristics of mice and plaque composition in continuous vs alternate HFD.

a, cholesterol burden evaluated using the area under the curve of repetitive plasma cholesterol levels measured during the experimental protocol (n=6/group). b, body weight of mice at sacrifice (female Ldlr−/− n=10/group; male Ldlr−/− n=5/group; male Apoe−/− n=12/group; male Apoe−/−Rag2−/− n=7 Cont. n=9 Alt.). c, representative photomicrographs and quantitative analysis of macrophage accumulation (MOMA staining, red) in atherosclerotic lesions of Apoe−/− after 8 weeks of continuous or alternate HFD regimen (2 experiments pooled, n=12 Cont. n=13 Alt.); Scale bar 100 μm. d, representative photomicrographs and quantitative analysis of acellular area (Masson’s Trichrome) of Apoe−/− after 8 weeks of continuous or alternate HFD regimen (2 experiments pooled, n=11 Cont. n=13 Alt.); Scale bar 100 μm. Data are presented as mean values +/− SD. P values were calculated using two-tailed Mann-Whitney test.
Extended Data Figure 2. Microbiota and immune characterization.

a, Ldlr−/− mice were exposed or not transiently to HF diet during 4 weeks and four weeks later gut microbiota was analyzed. b, bacterial diversity on the basis of Shannon and Chao in the fecal samples (n=4/group). c, bacterial-taxon-based analysis at the phylum level in the fecal microbiota. d, blood cell counts at sacrifice of Ldlr−/− mice fed either a continuous or an alternate HFD (2 experiments pooled, n=12 Cont. n=13 Alt.). e, spleen cell count at sacrifice of Ldlr−/− mice fed either a continuous or an alternate HFD (2 experiments pooled, n=12 Cont. n=13 Alt.). f, gating strategy by flow cytometry in the blood. Classical monocytes were defined as NK1.1-CD11b+Ly6G-Ly6Chigh cells; Non-classical monocytes were defined as NK1.1-CD11b+Ly6G-Ly6Clow cells; neutrophils were defined as NK1.1-CD11b+Ly6G+ cells. CD4+ T Lymphocytes were selected as NK1.1-B220-CD11b-CD3+CD4+ cells, CD8+ T Lymphocytes were selected as NK1.1-B220-CD11b-CD3+CD8+ cells. B cells were defined as NK1.1-CD11b-B220+ cells. g, cholesterolemia at sacrifice of splenectomized Apoe−/− mice fed either a continuous or an alternate HFD (2 experiments pooled, n=7/group). Data are presented as mean values +/− SD (d, e, g). Data are presented as box and whiskers (1st quartile, 3rd quartile, median) in b. P values were calculated using two-tailed Mann-Whitney test.
Extended Data Figure 3. Single-cell RNA-seq analysis of aortic leukocytes.

a, UMAP plot of total CD45+ leukocytes and annotation of cell identities based on b) expression of marker transcripts and c) expression of cell surface markers; d) reclustering of leukocytes annotated as monocytes and macrophages identifies aortic monocyte/macrophage subpopulations; e) selected marker genes of monocyte/macrophage clusters used for their annotation; f) percentage of monocyte/macrophage subsets among total monocytes/macrophages across experimental conditions. In f, each datapoint represents a pool of two aortas, all aortas were processed for scRNA-seq together via cell hashing (see methods) (n=3 healthy, n=5 Cont. n=5 Alt.). Data are presented as mean values +/− SD (f).
Extended Data Figure 4. Modulation of HFD induced neutrophils.

a, neutrophils were defined as CD45+CD11b+Ly6G+ cells ; immature neutrophils were defined as CD62L+ cells. FMO, Fluorescent Minus One. b, quantitative analysis and representative photomicrographs of NET content (citrullinated histone 3 staining, yellow) in atherosclerotic lesions of male Ldlr−/− mice fed either continuous (Black) or alternate (Red) HFD (n=5/group) at week 16. Scale bar 100 μm. c, neutrophils were defined as CD45+NK1.1-CD11b+CD115-Ly6C-CXCR2+ cells. d, experimental protocol to validate murine anti-Ly6G mAb. e, kinetic of blood neutrophils in the blood at baseline and just before mAb re-injection at H48. n=5 mice/timepoint. P values were calculated using two-tailed Mann-Whitney test. Data are presented as mean values +/− SD (b) or mean values +/− SEM (e).
Extended Data Figure 5. Characterization of murine models.
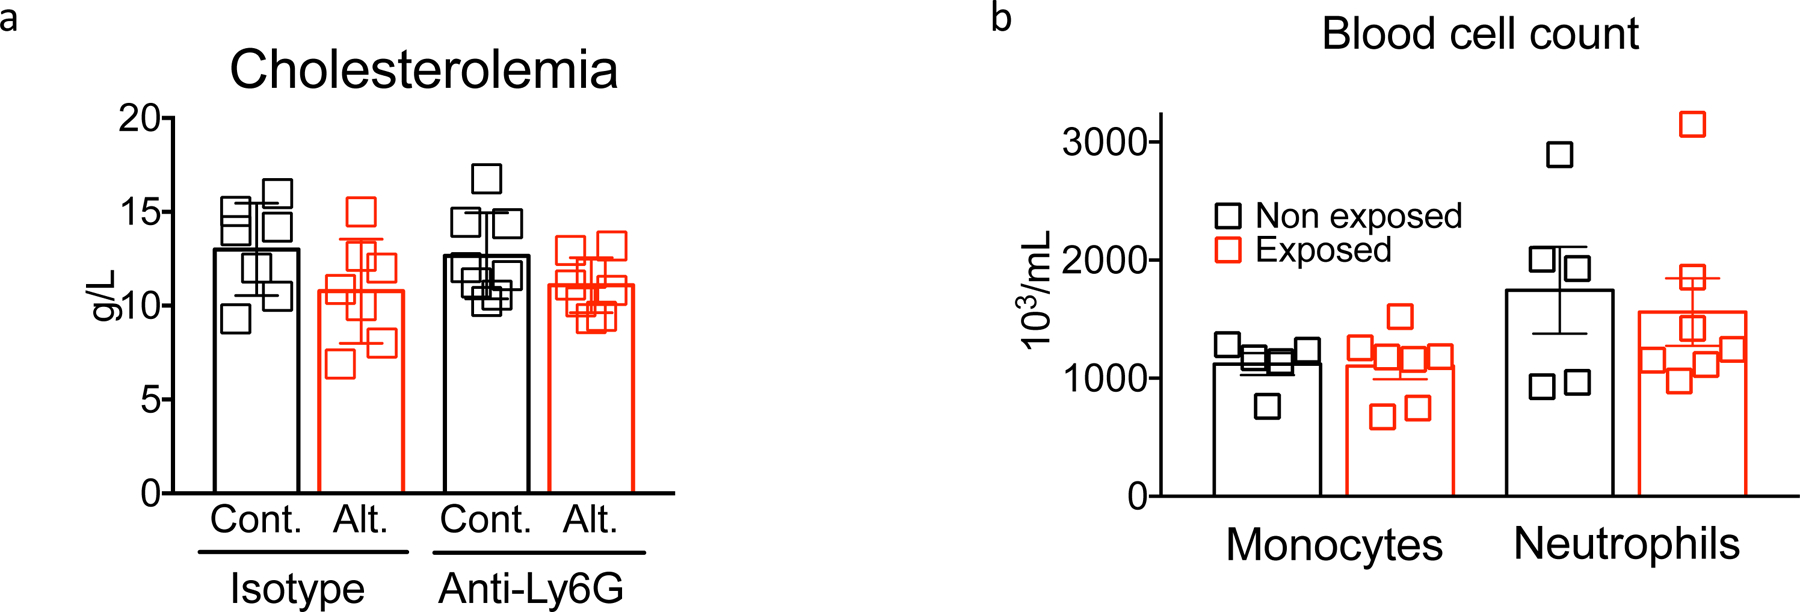
a, plasma cholesterol levels of male Ldlr−/− mice fed either continuous (Black) or alternate (Red) HFD and treated by isotype control or anti-Ly6G mAb depleting antibody (isotype, n=7/group; anti-Ly6G, n=8/group). b, male Ldlr−/− mice, called exposed (n=7), were put under a HFD during 4 weeks from 6 to 10 weeks of age and next subsequently subjected to regular chow diet for 8 weeks. Non-exposed mice were put only under a regular chow diet (n=5). Blood monocyte (NK1.1-CD11b+Ly6C+Ly6G-) and neutrophil (NK1.1-CD11b+Ly6G+) counts at sacrifice. Data are presented as mean values +/− SD.
Extended Data Figure 6. Flow cytometry gating strategy to identify progenitors in the bone marrow.

long-term (LT) and short-term (ST) hematopoietic stem cells (HSC). LT-HSC were defined as Lin-CD45+MHCII-ckithighScahighCD48-CD150+ and ST-HSC were defined as Lin-CD45+MHCII-ckithighScahighCD48-CD150-. BM progenitors : granulocyte/macrophage progenitors (GMP, Lin-CD45+MHCII-ckithighSca-CD16+CD34+), Megakaryocyte/erythroid progenitors (MEP, Lin-CD45+MHCII-ckithighSca-CD16-CD34-), Common Lymphoid progenitors (CLP, Lin-CD45+MHCII-ckitlowSca+CD135+).
Extended Data Figure 7. Characterization of neutrophilic progenitors in the bone marrow using ScRNA seq.

a, UMAP plot of bone marrow Lin- population isolated from HFD non-exposed and transiently HFD exposed mice. b, feature plots of marker genes commonly used in the literature to define BM progenitor cell subsets. c, bubble chart showing the expression of marker genes in each cell cluster. d, UMAP clustering of BM Lin- cells from non-exposed and HFD exposed mice (n=4). Lin- BM cells captured from individual mice color coded separately. e, total numbers and percentages of scRNA-Seq based annotated Lin- cell subsets. Each bone marrow scRNA-Seq dataset resulted within the range of 4561–10207 annotated cells after various quality filtering methods (n=5/group). f, heatmap of all DEGs in neutrophilic progenitors of HFD non-exposed and exposed mice. Data are presented as mean values +/− SD (e).
Extended Data Figure 8. Impact of re-exposure on myeloid cells.

a, red blood cells and platelets counts in the blood of Ldlr−/− mice one week after HFD re-exposure (Week 13), (n=10/group). b, kinetic of plasma cholesterol levels (n=5 C57Bl6, Cd36−/− , Tlr4−/− n=3 Myd88−/− ). P values were calculated using paired non-parametric test for each group at 2 timepoints. c, C57Bl6 mice were put under a high fat diet (HFD) during 4 weeks, then under a chow diet (CD) during 5 weeks and finally under a HFD during 2 weeks. BM cells were isolated after 2 weeks of exposure or 2 weeks of re-exposure and il1b mRNA levels were quantified by qPCR (n=5 expo and n=4 re-expo). P values were calculated using two-tailed Mann-Whitney test. Data are presented as mean values +/− SD (a,c) or mean values +/− SEM (b).
Extended Data Figure 9. Impact of re-exposure on BM progenitors and myeloid cells.

a, proportion of GMP expressing Runx1 in the BM at week 4, 12 and 16 in Ldlr−/− mice receiving either continuous or Alternate HFD (Flow cytometry). n=7/group 4W-16W and n=8/group W12. P values were calculated using two-tailed Mann-Whitney test. b, flow cytometry characterization of BM subsets producing pro-IL-1β or expressing IL1R receptor. Neutrophils were defined as gated CD45+Cd11b+Ly6G+, monocytes were defined ad CD45+CD11b+Ly6G-Ly6C+ and GMP as Lin-CD45+cKit+Sca1-CD34+CD16/32+. c, strategy for cell sorting of BM monocytes and neutrophils. d, quantification of Il-1β mRNA levels on sorted monocytes and neutrophils at week 13 (n=5/group). P values were calculated using two-tailed Mann-Whitney test. Data are presented as mean values +/− SD.
Extended Data Figure 10. Modulation of IL1β pathways.

a, cytokine production by stimulated splenocytes at sacrifice from continuous or alternate HFD fed chimeric Il1β−/−Ldlr−/− mice (n=9/group). b, cytokine production by stimulated BM cells at sacrifice from continuous or alternate LysMCre+/−Il1rlox/loxLdlr−/− groups (n=9 Cont. N=10 Alt.). c, cytokine production by stimulated splenocytes at sacrifice from anti-IL1β-treated Ldlr−/− mice fed either continuous or alternate HFD (n=7 Cont. n=8 Alt.). d, experimental protocol, 6-week-old Apoe−/− mice were fed either alternate (Red) or continuous (Grey) HFD and treated by NLRP3 inflammasome pharmacological inhibitor (MCC950, 10 mg/kg every 2 days IP) during the last 4 weeks of the protocol. e, comparison in MCC950-treated alternate group of the variations of blood neutrophil count induced by exposition versus re-exposition to HFD (n=5/group). f, plasma cholesterol levels at sacrifice. g, quantitative analysis of atherosclerotic lesions in the aortic sinus of MCC950-treated Apoe−/− mice (n=5/group). Scale bar 200 um. h, cytokine production by stimulated splenocytes isolated at sacrifice from MCC950-treated Apoe−/− mice (n=5/group). P values were calculated using two-tailed Mann-Whitney test. Data are presented as mean values +/− SD.
Acknowledgements
We would like to thank Nicolas Perez (Animal core facility, PARCC Inserm U970, Paris, France), Camille Knosp (Flow cytometry core facility, PARCC Inserm U970, Paris, France) and Pepijn Van Houten (Radboud University Medical Centre, Nijmegen, The Netherlands) for their help.
Fundings
This work was supported by Inserm (HAO, ST, AT), the Fondation pour la Recherche Médicale (HAO, ST), la Fondation de l’avenir (HAO), ERA-NET Joint Transnational call 2018, project MEMORY, 2018T093 (HAO, NPR, AS), the RUNX1 Research Program (DY, NAS), and NIH U01HL100405 (NAS). C. Cochain was supported by Deutsche Forschungsgemeinschaft (DFG, German Research Foundation; project numbers 432915089, 458539578, 471705758 and 453989101-SFB1525). NPR is further supported by a grant from the Dutch Cardiovascular Alliance/Dutch Heart Foundation (CVON2018-27), a Matching Grant from the Dutch Heart Foundation (01-003-2021-0346 2021), and a Project Program Grant from NHLBI (NIH/NHLBI P01HL131478) and DY is supported by NIH T32 HL-07439. AS and MV were funded by the Deutsche Forschungsgemeinschaft (DFG, German Research Foundation) under Germany’s Excellence Strategy – EXC2151 – 390873048 (AS, MV), SFB 1454-P05-432325352 (AS, MV) and an Emmy Noether research grant (SCHL2116/1 to AS).
Footnotes
Competing interests
The authors declare no financial and non-financial competing interests
Data availability
The authors declare that the data supporting the findings of this study are available within the paper and its supplementary information files. Source data are provided with this paper. RNA-sequencing data of mouse aorta generated for this report has been deposited in Gene Expression Omnibus (GSE254105 and GSE251907). RNA-sequencing data of bone marrow generated for this report has been deposited in Gene Expression Omnibus (GSE252604) . Microbiota 16s RNA data are accessible with the following link https://www.ncbi.nlm.nih.gov/sra/PRJNA1063660.
References
- 1.Libby P The changing landscape of atherosclerosis. Nature 592, 524–533, doi: 10.1038/s41586-021-03392-8 (2021). [DOI] [PubMed] [Google Scholar]
- 2.Strohacker K, Carpenter KC & McFarlin BK Consequences of Weight Cycling: An Increase in Disease Risk? Int J Exerc Sci 2, 191–201 (2009). [DOI] [PMC free article] [PubMed] [Google Scholar]
- 3.Zezulin AU et al. RUNX1 is required in granulocyte-monocyte progenitors to attenuate inflammatory cytokine production by neutrophils. Genes Dev 37, 605–620, doi: 10.1101/gad.350418.123 (2023). [DOI] [PMC free article] [PubMed] [Google Scholar]
- 4.Roth GA et al. Global Burden of Cardiovascular Diseases and Risk Factors, 1990–2019: Update From the GBD 2019 Study. J Am Coll Cardiol 76, 2982–3021, doi: 10.1016/j.jacc.2020.11.010 (2020). [DOI] [PMC free article] [PubMed] [Google Scholar]
- 5.Silvestre-Roig C, Braster Q, Ortega-Gomez A & Soehnlein O Neutrophils as regulators of cardiovascular inflammation. Nat Rev Cardiol 17, 327–340, doi: 10.1038/s41569-019-0326-7 (2020). [DOI] [PubMed] [Google Scholar]
- 6.Zadelaar S et al. Mouse models for atherosclerosis and pharmaceutical modifiers. Arterioscler Thromb Vasc Biol 27, 1706–1721, doi: 10.1161/ATVBAHA.107.142570 (2007). [DOI] [PubMed] [Google Scholar]
- 7.Giral P, Neumann A, Weill A & Coste J Cardiovascular effect of discontinuing statins for primary prevention at the age of 75 years: a nationwide population-based cohort study in France. Eur Heart J 40, 3516–3525, doi: 10.1093/eurheartj/ehz458 (2019). [DOI] [PMC free article] [PubMed] [Google Scholar]
- 8.Bekkering S et al. Oxidized low-density lipoprotein induces long-term proinflammatory cytokine production and foam cell formation via epigenetic reprogramming of monocytes. Arterioscler Thromb Vasc Biol 34, 1731–1738, doi: 10.1161/ATVBAHA.114.303887 (2014). [DOI] [PubMed] [Google Scholar]
- 9.Christ A et al. Western Diet Triggers NLRP3-Dependent Innate Immune Reprogramming. Cell 172, 162–175 e114, doi: 10.1016/j.cell.2017.12.013 (2018). [DOI] [PMC free article] [PubMed] [Google Scholar]
- 10.Riksen NP, Bekkering S, Mulder WJM & Netea MG Trained immunity in atherosclerotic cardiovascular disease. Nat Rev Cardiol 20, 799–811, doi: 10.1038/s41569-023-00894-y (2023). [DOI] [PubMed] [Google Scholar]
- 11.Tang WHW, Li DY & Hazen SL Dietary metabolism, the gut microbiome, and heart failure. Nat Rev Cardiol 16, 137–154, doi: 10.1038/s41569-018-0108-7 (2019). [DOI] [PMC free article] [PubMed] [Google Scholar]
- 12.Depommier C et al. Supplementation with Akkermansia muciniphila in overweight and obese human volunteers: a proof-of-concept exploratory study. Nat Med 25, 1096–1103, doi: 10.1038/s41591-019-0495-2 (2019). [DOI] [PMC free article] [PubMed] [Google Scholar]
- 13.Stoeckius M et al. Simultaneous epitope and transcriptome measurement in single cells. Nat Methods 14, 865–868, doi: 10.1038/nmeth.4380 (2017). [DOI] [PMC free article] [PubMed] [Google Scholar]
- 14.Capucetti A, Albano F & Bonecchi R Multiple Roles for Chemokines in Neutrophil Biology. Front Immunol 11, 1259, doi: 10.3389/fimmu.2020.01259 (2020). [DOI] [PMC free article] [PubMed] [Google Scholar]
- 15.Mitroulis I et al. Modulation of Myelopoiesis Progenitors Is an Integral Component of Trained Immunity. Cell 172, 147–161 e112, doi: 10.1016/j.cell.2017.11.034 (2018). [DOI] [PMC free article] [PubMed] [Google Scholar]
- 16.Boettcher S et al. Cutting edge: LPS-induced emergency myelopoiesis depends on TLR4-expressing nonhematopoietic cells. J Immunol 188, 5824–5828, doi: 10.4049/jimmunol.1103253 (2012). [DOI] [PubMed] [Google Scholar]
- 17.Pietras EM et al. Chronic interleukin-1 exposure drives haematopoietic stem cells towards precocious myeloid differentiation at the expense of self-renewal. Nat Cell Biol 18, 607–618, doi: 10.1038/ncb3346 (2016). [DOI] [PMC free article] [PubMed] [Google Scholar]
- 18.Al-Rifai R et al. JAK2V617F mutation drives vascular resident macrophages toward a pathogenic phenotype and promotes dissecting aortic aneurysm. Nat Commun 13, 6592, doi: 10.1038/s41467-022-34469-1 (2022). [DOI] [PMC free article] [PubMed] [Google Scholar]
- 19.Coll RC et al. A small-molecule inhibitor of the NLRP3 inflammasome for the treatment of inflammatory diseases. Nat Med 21, 248–255, doi: 10.1038/nm.3806 (2015). [DOI] [PMC free article] [PubMed] [Google Scholar]
- 20.Combadiere C et al. Combined inhibition of CCL2, CX3CR1 and CCR5 abrogates Ly6C(hi) and Ly6C(lo) monocytosis and almost abolishes atherosclerosis in hypercholesterolemic mice. Circulation 117, 1649–1657 (2008). [DOI] [PubMed] [Google Scholar]
- 21.Luo J, Thomassen JQ, Nordestgaard BG, Tybjaerg-Hansen A & Frikke-Schmidt R Neutrophil counts and cardiovascular disease. Eur Heart J 44, 4953–4964, doi: 10.1093/eurheartj/ehad649 (2023). [DOI] [PMC free article] [PubMed] [Google Scholar]
- 22.Soehnlein O Multiple roles for neutrophils in atherosclerosis. Circ Res 110, 875–888, doi: 10.1161/CIRCRESAHA.111.257535 (2012). [DOI] [PubMed] [Google Scholar]
- 23.Kalafati L et al. Innate Immune Training of Granulopoiesis Promotes Anti-tumor Activity. Cell 183, 771–785 e712, doi: 10.1016/j.cell.2020.09.058 (2020). [DOI] [PMC free article] [PubMed] [Google Scholar]
- 24.Moorlag S et al. BCG Vaccination Induces Long-Term Functional Reprogramming of Human Neutrophils. Cell Rep 33, 108387, doi: 10.1016/j.celrep.2020.108387 (2020). [DOI] [PMC free article] [PubMed] [Google Scholar]
- 25.Warnatsch A, Ioannou M, Wang Q & Papayannopoulos V Inflammation. Neutrophil extracellular traps license macrophages for cytokine production in atherosclerosis. Science 349, 316–320, doi: 10.1126/science.aaa8064 (2015). [DOI] [PMC free article] [PubMed] [Google Scholar]
- 26.Valles J et al. Neutrophil extracellular traps are increased in patients with acute ischemic stroke: prognostic significance. Thromb Haemost 117, 1919–1929, doi: 10.1160/TH17-02-0130 (2017). [DOI] [PubMed] [Google Scholar]
- 27.Tedgui A & Mallat Z Cytokines in atherosclerosis: pathogenic and regulatory pathways. Physiol Rev 86, 515–581 (2006). [DOI] [PubMed] [Google Scholar]
- 28.Rohde D et al. Bone marrow endothelial dysfunction promotes myeloid cell expansion in cardiovascular disease. Nat Cardiovasc Res 1, 28–44, doi: 10.1038/s44161-021-00002-8 (2022). [DOI] [PMC free article] [PubMed] [Google Scholar]
- 29.Noz MP et al. Reprogramming of bone marrow myeloid progenitor cells in patients with severe coronary artery disease. Elife 9, doi: 10.7554/eLife.60939 (2020). [DOI] [PMC free article] [PubMed] [Google Scholar]
- 30.Schultze JL, Mass E & Schlitzer A Emerging Principles in Myelopoiesis at Homeostasis and during Infection and Inflammation. Immunity 50, 288–301, doi: 10.1016/j.immuni.2019.01.019 (2019). [DOI] [PubMed] [Google Scholar]
- 31.Bellissimo DC & Speck NA RUNX1 Mutations in Inherited and Sporadic Leukemia. Front Cell Dev Biol 5, 111, doi: 10.3389/fcell.2017.00111 (2017). [DOI] [PMC free article] [PubMed] [Google Scholar]
- 32.Bellissimo DC et al. Runx1 negatively regulates inflammatory cytokine production by neutrophils in response to Toll-like receptor signaling. Blood Adv 4, 1145–1158, doi: 10.1182/bloodadvances.2019000785 (2020). [DOI] [PMC free article] [PubMed] [Google Scholar]
- 33.Boettcher S & Manz MG Regulation of Inflammation- and Infection-Driven Hematopoiesis. Trends Immunol 38, 345–357, doi: 10.1016/j.it.2017.01.004 (2017). [DOI] [PubMed] [Google Scholar]
- 34.Deon D et al. Cross-talk between IL-1 and IL-6 signaling pathways in rheumatoid arthritis synovial fibroblasts. J Immunol 167, 5395–5403, doi: 10.4049/jimmunol.167.9.5395 (2001). [DOI] [PubMed] [Google Scholar]
- 35.Ridker PM et al. Antiinflammatory Therapy with Canakinumab for Atherosclerotic Disease. N Engl J Med, doi: 10.1056/NEJMoa1707914 (2017). [DOI] [PubMed] [Google Scholar]
Additional references
- 36.Olofsen PA et al. Effective, Long-Term, Neutrophil Depletion Using a Murinized Anti-Ly-6G 1A8 Antibody. Cells 11, doi: 10.3390/cells11213406 (2022). [DOI] [PMC free article] [PubMed] [Google Scholar]
- 37.Ait-Oufella H et al. B cell depletion reduces the development of atherosclerosis in mice. J Exp Med 207, 1579–1587, doi:jem.20100155 [pii] 10.1084/jem.20100155 (2010). [DOI] [PMC free article] [PubMed] [Google Scholar]
- 38.Rizzo G et al. Dynamics of monocyte-derived macrophage diversity in experimental myocardial infarction. Cardiovasc Res, doi: 10.1093/cvr/cvac113 (2022). [DOI] [PMC free article] [PubMed] [Google Scholar]
- 39.Stuart T et al. Comprehensive Integration of Single-Cell Data. Cell 177, 1888–1902 e1821, doi: 10.1016/j.cell.2019.05.031 (2019). [DOI] [PMC free article] [PubMed] [Google Scholar]
- 40.Korsunsky I et al. Fast, sensitive and accurate integration of single-cell data with Harmony. Nat Methods 16, 1289–1296, doi: 10.1038/s41592-019-0619-0 (2019). [DOI] [PMC free article] [PubMed] [Google Scholar]
- 41.Zernecke A et al. Integrated single-cell analysis based classification of vascular mononuclear phagocytes in mouse and human atherosclerosis. Cardiovasc Res, doi: 10.1093/cvr/cvac161 (2022). [DOI] [PMC free article] [PubMed] [Google Scholar]
- 42.Hao Y et al. Integrated analysis of multimodal single-cell data. Cell 184, 3573–3587 e3529, doi: 10.1016/j.cell.2021.04.048 (2021). [DOI] [PMC free article] [PubMed] [Google Scholar]
- 43.Germain PL, Lun A, Garcia Meixide C, Macnair W & Robinson MD Doublet identification in single-cell sequencing data using scDblFinder. F1000Res 10, 979, doi: 10.12688/f1000research.73600.2 (2021). [DOI] [PMC free article] [PubMed] [Google Scholar]
- 44.Sokol H et al. Fungal microbiota dysbiosis in IBD. Gut 66, 1039–1048, doi: 10.1136/gutjnl-2015-310746 (2017). [DOI] [PMC free article] [PubMed] [Google Scholar]
- 45.Schmieder R & Edwards R Quality control and preprocessing of metagenomic datasets. Bioinformatics 27, 863–864, doi: 10.1093/bioinformatics/btr026 (2011). [DOI] [PMC free article] [PubMed] [Google Scholar]
- 46.Bolyen E et al. Reproducible, interactive, scalable and extensible microbiome data science using QIIME 2. Nat Biotechnol 37, 852–857, doi: 10.1038/s41587-019-0209-9 (2019). [DOI] [PMC free article] [PubMed] [Google Scholar]
- 47.Callahan BJ et al. DADA2: High-resolution sample inference from Illumina amplicon data. Nat Methods 13, 581–583, doi: 10.1038/nmeth.3869 (2016). [DOI] [PMC free article] [PubMed] [Google Scholar]
- 48.Quast C et al. The SILVA ribosomal RNA gene database project: improved data processing and web-based tools. Nucleic Acids Res 41, D590–596, doi: 10.1093/nar/gks1219 (2013). [DOI] [PMC free article] [PubMed] [Google Scholar]
- 49.McMurdie PJ & Holmes S phyloseq: an R package for reproducible interactive analysis and graphics of microbiome census data. PLoS One 8, e61217, doi: 10.1371/journal.pone.0061217 (2013). [DOI] [PMC free article] [PubMed] [Google Scholar]
- 50.Segata N et al. Metagenomic biomarker discovery and explanation. Genome Biol 12, R60, doi: 10.1186/gb-2011-12-6-r60 (2011). [DOI] [PMC free article] [PubMed] [Google Scholar]
Associated Data
This section collects any data citations, data availability statements, or supplementary materials included in this article.
Data Availability Statement
The authors declare that the data supporting the findings of this study are available within the paper and its supplementary information files. Source data are provided with this paper. RNA-sequencing data of mouse aorta generated for this report has been deposited in Gene Expression Omnibus (GSE254105 and GSE251907). RNA-sequencing data of bone marrow generated for this report has been deposited in Gene Expression Omnibus (GSE252604) . Microbiota 16s RNA data are accessible with the following link https://www.ncbi.nlm.nih.gov/sra/PRJNA1063660.