

Abstract
Although anthocyanin is frequently found in various barley organs, the genetic basis of the pigmentation is still poorly understood. In this study, we examined the development of anthocyanin in GemCraft, a malting barley cultivar showing purple leaf sheath (PLS), and found that the pigmentation became visible on the leaf sheath at the early tillering stage. This study employed single nucleotide polymorphism (SNP) array genotyping data in two F2 populations developed using GemCraft and two barley lines with green leaf sheath throughout the plant development. Genetic and quantitative trait locus (QTL) analyses suggested regulation of the purple pigment accumulation by a single major QTL that was inherited as a dominant allele, which was necessary for the phenotype to develop. A major QTL, named qPLS2 (purple leaf sheath2 locus), was found on chromosome 2H and explained >70% of the trait variation. Nonetheless, the genetic model in the two mapping populations resonated between multiple loci and a single locus that determines the trait variation. Accordingly, in one of the populations, three minor QTL were also detected on chromosomes 1H and 5H: each of these QTL explained <5% variation and showed influence in regulation of the purple pigment intensity. In the qPLS2 QTL interval, comparative genomic analysis of annotated genes that are widely known to regulate anthocyanin development in plants identified a single candidate gene encoding a basic helix–loop–helix (bHLH) transcription factor. The study identified a new major QTL associated with the purple leaf sheath and generated further information for validation and cloning the causal gene for effective utilization of anthocyanin in barley genetic improvement.
Core Ideas
Two biparental F2 mapping populations were developed to study the genetic loci controlling purple leaf sheath in a barley cultivar, GemCraft.
A new major quantitative trait locus (QTL) (purple leaf sheath2 locus [qPLS2]) on 2H and three minor QTL associated with the purple leaf sheath were mapped.
Comparative genomic analysis revealed a single candidate gene at the qPLS2 locus.
Abbreviations
- bHLH
basic helix–loop–helix
- LOD
logarithm of odds
- qPLS2
purple leaf sheath2 locus
- QTL
quantitative trait locus
- SNP
single nucleotide polymorphism
1. INTRODUCTION
Development of diverse pigments in various organs and tissues is frequently found in the plant kingdom. The wide range of pigmentations is mostly caused by the accumulation of anthocyanins, which are one major class of flavonoids that result in conspicuous plant pigments (Holton & Cornish, 1995). Pigment intensity increases with anthocyanin concentration that accumulates during plant growth and development (Chin et al., 2016). In cereal crop plants, although these pigments are prominent in the reproductive organs, they also develop in vegetative organs, including leaf blade and sheath, which can be used as morphological markers for distinguishing different varieties and purity control of hybrid seeds (Dhesi et al., 1969). Additionally, cereal grains with anthocyanin accumulation may contribute some health benefits for humans, such as antioxidants and α‐glucosidase inhibiting activity (Jin et al., 2022). Recent studies suggested that increasing anthocyanin accumulation may improve the resistance to biotic and abiotic stresses in plants as many genes associated with anthocyanin biosynthesis were upregulated under various stresses (Kaur et al., 2023). However, the development of purple pigment in the green plant tissues may affect photosynthesis efficiency. In rice (Oryza sativa), the accumulation of anthocyanins significantly reduced CO2‐fixation efficiency in leaves (Khan et al., 2020), and grain yield sharply declined in the ectopic overexpression mutants (W. Hu et al., 2020).
The mechanisms that regulate anthocyanin throughout the plant are complex. The remarkable differential regulation among plant organs and developmental stages has been a focal research topic. While the regulation of anthocyanins by MYB‐bHLH‐WD40 domains containing proteins complex is conserved in plants at the molecular level (Zheng et al., 2019), adaptive neo‐functionalization and escape from adaptive conflict between duplicated genes was demonstrated for the tissue‐specific regulation of anthocyanin (Des Marais & Rausher, 2008). These anthocyanin genes have undergone duplication and expansion leading to sub‐functionalization in the different plant parts (Carretero‐Paulet et al., 2010; Jiang & Rao, 2020; Shoeva et al., 2023). The intraspecific variation for the genetic basis of the anthocyanin development has been widely studied as it is crucial for wide adaptation of plant species (Dawson et al., 2015). Understanding diversity in tissue‐specific and wide regulation of anthocyanin biosynthesis enables a prudent deployment of genes for specific end uses and climate resilience (Kaur et al., 2023).
Barley (Hordeum vulgare, 2n = 2x = 14) belongs to the grass (Poaceae) family, which also includes rice (Oryza sativa), wheat (Triticum aestivum), maize (Zea mays), sorghum (Sorghum bicolor), and many other important food crops. It is an ancient crop consumed for food, animal feed, and malting industries worldwide. Recently, barley has also received attention for developing personal care products and pharmaceuticals (Chakraborty et al., 2023). The accumulation of anthocyanin is observed in many parts of barley plants including leaf sheaths, auricles, awns, and grains (Cockram et al., 2010; Gordeeva et al., 2019; Himi et al., 2012; Nyegaard Kristiansen & Rohde, 1991; Mullick et al., 1958). It has been reported that the biosynthesis of anthocyanins in barley is related to multiple genes, including the structural genes that encode the enzymes that directly participate in the synthesis and the regulatory genes that regulate the expression of structural genes (Druka et al., 2003; Jaakola et al., 2002; Yao et al., 2022). The anthocyanin accumulation has been studied by traditional genetic methods such as allelism tests and over 30 genetically independent loci have been identified in barley (Himi et al., 2012). However, molecular studies of pigmentation mostly focused on barley grains, and the results suggested that purple or black grains were controlled by multiple genes or quantitative trait loci (QTL) located on different chromosomes (Gordeeva et al., 2019; Jia et al., 2016; Long et al., 2019; Shoeva et al., 2017, 2016; Yao et al., 2018).
In the grasses, vegetative tissues such as the leaf sheath play an essential role for plant growth and development by preventing breakage, lodging, and damage of the meristematic tissue (Cornwall et al., 2021; Kempe et al., 2013; Wu et al., 2012), and it also shows a remarkable accumulation of the anthocyanin pigment. In barley, although the candidate gene Ant1 on chromosome 7H has been shown to influence the anthocyanin pigmentation in the leaf sheath (Himi & Taketa, 2015; Zakhrabekova et al., 2015), the genetic basis of the trait development is still not well understood. The leaf sheath pigmentation has been studied in other crops including rice, pearl millet (Pennisetum glaucum), and rapeseed (Brassica napus) (Azhaguvel et al., 2003; Khan et al., 2020; H. Li et al., 2022). In rice, OsC1 encoding a MYB family transcription factor on chromosome 6 (Chin et al., 2016; Gao et al., 2011) and an undefined gene on chromosome 1 (Wang et al., 2009) were reported to regulate the pigment on the leaf sheath. Since some rice varieties develop pigmentations on both the leaf sheath and the grains, separate genetic regulation between them seems a possibility (Kang et al., 2023).
GemCraft is a newly released spring malt barley cultivar that was developed by the USDA‐ARS Small Grains and Potato Germplasm Research Unit (SGPGR) (G. Hu et al., 2024). It showed high yield potential and desirable malting quality and has been used to develop a new meristem‐based (or shoot tips) barley transformation system (Gao et al., 2024). Like many other malting cultivars, GemCraft exhibits a purple leaf sheath, but the genetic basis of the pigment has not been determined. In this study, genetic analyses and molecular mapping were carried out to dissect the genetic basis of purple leaf sheath in the cultivar GemCraft.
2. MATERIALS AND METHODS
2.1. Plant materials, mapping population, and phenotype evaluation
The grains of the purple leaf sheath cultivar GemCraft (PI 701910) and two breeding lines 17ARS091‐5 or 409 for short (malting barley with green leaf sheath) and 18ARS211‐5 or 514 for short (food barley with green leaf sheath) were provided by the barley and oat breeding program at the USDA‐ARS SGPGR in Aberdeen, ID. The leaf sheath colors were evaluated twice a week starting from seedling emergence till the appearance of the purple leaf sheath in GemCraft, but all plants were observed and maintained until they developed mature grains. The two lines with green leaf sheath, 409 and 514, were crossed to the line with the purple leaf sheath, GemCraft, which is the pollen source, and two biparental F2 populations were developed. The leaf sheath color phenotype in 185 plants in the F2 population between 409 and GemCraft, and 163 plants in the F2 population between 514 and GemCraft were evaluated and scored as purple (like GemCraft), green (like 409 and 514), and partial purple, which is an apparently lower intensity of pigmentation compared to that in the purple leaf sheath parental line. The three phenotypic groups (purple, partial purple, and green leaf sheath) and the two phenotypic groups (by merging the purple and partial purple) were used for genetic analysis using the chi‐square test.
Core Ideas
Two biparental F2 mapping populations were developed to study the genetic loci controlling purple leaf sheath in a barley cultivar, GemCraft.
A new major quantitative trait locus (QTL) (purple leaf sheath2 locus [qPLS2]) on 2H and three minor QTL associated with the purple leaf sheath were mapped.
Comparative genomic analysis revealed a single candidate gene at the qPLS2 locus.
2.2. Genotyping analysis
The grains of the two F2 populations and the parental lines were planted in 4‐cm cones and grown in the SGPGR greenhouse. At the seedling stage, 5‐cm leaf segment from the F2 plant subsets used for phenotypic evaluation and the parental lines were collected separately for the two mapping populations. The tissue samples were freeze‐dried and sent to the USDA ARS Small Grains Genotyping Laboratory in Fargo, ND, for DNA extraction and genotyping. The 409 X GemCraft population was genotyped using the SoyWheOatBar‐3K Illumina iSelect single nucleotide polymorphism (SNP) array, which is a platform for genotyping multiple species including 3058 SNPs in the barley genome (Jason Fiedler unpublished), and the 514 X GemCraft F2 population was genotyped using the 50K SNP array (Bayer et al., 2017). The SNP positions were called based on the Morex V2 barley reference genome (Monat et al., 2019) and converted later into the positions in the Morex V3 genome (Mascher et al., 2021).
The Infinium SNP‐array intensities of each marker in both populations were manually re‐clustered in the GenomeStudio software (Illumina). The data processing was guided by duplicate samples of the parental lines. Monomorphic markers and those with missing genotype data in >10% of sample plants were removed. Similarly, sample plants with >10% missing genotype data were filtered out. Imputation of missing genotypes was carried out in TASSEL using the LD KNNI imputation algorithm.
2.3. Linkage map construction and QTL mapping
The three phenotypic groups (purple, partial purple, and green leaf sheath) and two phenotypic groups (by merging the purple and partial purple) were used for genetic analysis and QTL mapping. Genetic linkage map was constructed using the QTL IciMapping software (Meng et al., 2015). The physical position of markers was used as the anchor for the linkage map construction. The default software parameters were used including 2.5 logarithm of odds (LOD) threshold, k‐optimality algorithm, and 5‐markers window size. QTL mapping was made using a 1000 permutations LOD threshold as well. The linkage groups were determined using the 50‐cM genetic distance threshold between adjacent markers, which is a random 50% recombination fraction. QTL analysis was also carried out using QTL IciMapping software using inclusive composite interval mapping of additive effects (ICIM‐IDD). Like in the genetic analysis, the three phenotypic groups (purple, partial purple, and green leaf sheath) and two phenotypic groups (by merging the purple and partial purple) were used for QTL mapping.
2.4. Identification of candidate genes
The region of candidate genes in the barley reference genome (Mascher et al., 2017; Monat et al., 2019) was defined based on the physical positions of the SNPs flanking the narrower genomic interval of the major QTL identified in the two biparental populations. All genes in the major QTL interval were extracted from the annotated barley genome (Morex V3) (https://phytozome‐next.jgi.doe.gov) and blast searched against the Rice Genome Annotation Project (http://rice.uga.edu) to identify orthologous genes. The sorghum orthologs (V5 genome) of all the annotated barley genes in the region were also identified as the top similarity genes in the Phytozome (https://phytozome‐next.jgi.doe.gov) database protein homologs resource. The candidate genes in the comparative analysis perspective were further examined for empirical functional and evolutionary evidence in previous studies for the identification of high potential candidates. To gain insight on the functional features of candidate genes, their expression profile was searched against the BarleyExpDB database (T. Li et al., 2023).
3. RESULTS
3.1. Development of purple pigment in GemCraft
The development of leaf sheath pigment in barley cv. GemCraft was observed through all growth stages (from germination to grain maturity). The purple leaf sheath pigmentation showed growth stage dependence as only green leaf sheath was observed at the first leaf stage (Figure 1A; Figure S1A). The pigment accumulation started at early tiller stage (or about three to four fully developed leaves stages depending on the growth conditions [Figure 1B; Figure S1B]), which was approximately 3 weeks after planting. Through vegetative growth, more anthocyanin was accumulated in the leaf sheath of adult plants (Figure 1C; Figure S1C), and the purple leaf sheath was maintained till maturity. Apart from the leaf sheath, unstable accumulation of the purple pigment on the GemCraft spike was observed (Figure 1D), which, when penetrant, manifested narrowly as stripes and disappeared quickly on the drying head (spikelet) (Figure 1E). The GemCraft lemma showed a relatively higher accumulation of the pigment compared to the grain on which the pigment was not easily spotted. The environmental conditions that regulated the unstable purple pigment in the spike were not determined in this study (Figure 1F). As the check barley lines, both 409 and 514 invariably developed the green pigment on leaf sheath and spike.
FIGURE 1.
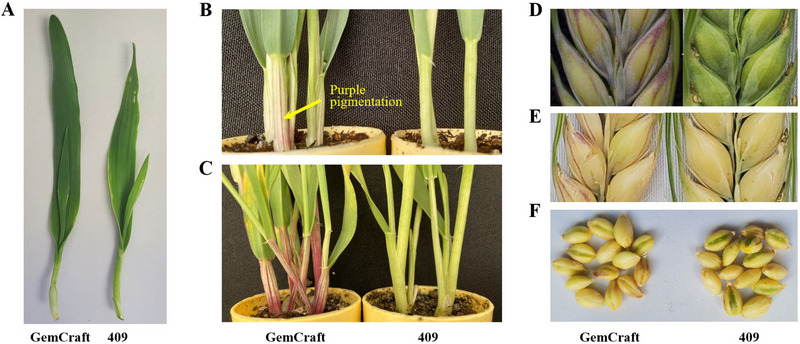
The purple pigment development in GemCraft compared to 409. (A) Young seedling; (B) early tillering plant (about three‐leaf stage); (C) late tillering plant; (D–E) barley head (spike); (F) barley grains.
3.2. Genetic analysis of the purple leaf sheath
The F1 plants between GemCraft and the two green leaf sheath parents showed purple leaf sheath (Figure S2A). The leaf sheath in the biparental F2 populations of the two crosses (Figure S2B) showed the parental purple and green phenotypes in large proportions suggesting distinct phenotypic variation. Relatedness of plants in the mapping populations was visualized using parental‐genotype matching between each pair of F2 plants (Figure S2C,D). Nonetheless, a relatively wide range of the partial purple pigmentation was also observed both in the pigment intensity and the affected tissue area. In a 349 F2 plant population of the 409 X GemCraft cross, 159, 79, and 111 showed purple, partial purple, and green leaf sheath, respectively. The phenotypic ratio of purple and partial purple plants to green plants was 2.1:1, which deviated from the 3:1 and 1:2:1 expected ratios of the single dominant gene and partially dominant gene models and the 15:1 expected ratio for the two unlinked dominant gene models (all chi‐squares > 8.6, p‐values < 0.01). In 163 F2 plants of the 514 X GemCraft cross, 94, 20, and 49 showed purple, partial purple, and green leaf sheath, respectively. In contrast to the 409 X GemCraft population, the ratio of purple and partial purple plants to green plants of the 514 X GemCraft population fits the 3:1 phenotypic ratio (chi‐squares = 2.2; p‐value = 0.14) of a single dominant gene model.
To further examine the phenotypic results, F2:3 families of 163 F2 plants of the 514 X GemCraft cross were evaluated using mostly 12 plants per family. In the 49 F3 families obtained from the F2 plants with the green leaf sheath, 46 families showed the green leaf sheath, two families showed segregation of green, purple, and/or partial purple, and one family showed accumulation of the pigment in a dozen evaluated plants. Among the remaining 114 F3 plant families derived from the F2 plants with purple or partial purple leaf sheath, 27 showed purple and/or partial purple leaf sheath, 86 showed segregation, and only one family showed green sheath. Therefore, evaluation of the F2:3 families indicated a phenotyping accuracy of 98% (159/163 × 100) compared to that at F2. The three F3 families that showed phenotypic segregation but were scored as green at F2 are probably due to either error in the phenotype evaluation as the partial purple phenotype was not always immediately spotted, or lack of penetrance of the phenotype in those F2 plants. These three F2 plants were retained in all analyses in this study.
3.3. QTL mapping of the purple leaf sheath
The genetic loci associated with the purple leaf sheath in GemCraft were mapped using the barley 3K SNP array genotyping data in the F2 population of the 409 X GemCraft cross. A total of 616 high‐quality polymorphic markers were found in 185 F2 plant samples. Markers that showed the same distance in the genetic linkage map were filtered, and 449 markers that showed distinct positions in the genetic map were used for QTL analysis. The marker number ranged from 43 on 1H to 85 on 5H. The linkage map constructed by IciMapping using anchor chromosomal position of the markers were distributed across the barley genome, and single or a few genetic distances between adjacent markers showed >10 cM, and the maximum was 28, 31, 17, 25, 32, 11, and 26 cM in the chromosome 1H–7H, respectively. Thus, all markers showed ˂50 cM, and the linkage groups corresponded to the seven barley chromosomes. Using a 1000 permutations LOD threshold of 8.2, a QTL peak with LOD score of 63 was identified on chromosome 2H that explained >70% variation (Figure 2). Additionally, three minor effect QTLs were detected above the default 2.5 LOD threshold, two on chromosome 1H and one on chromosome 5H with LOD score of 3.6, 3.4, and 3.6, and variance explained of 4.4, 1.8, and 3.4, respectively (Figure 2; Figure S3). The major effect QTL, named qPLS2 (purple leaf sheath2 locus), showed 0.88 additive and 0.63 dominant effects (Figure S4).
FIGURE 2.

Molecular mapping of the purple leaf sheath in the F2 population of the 409 X GemCraft cross. The genetic map by chromosome. The x‐axis shows genetic map position of markers in all barley chromosomes (1H–7H), and the y‐axis shows the logarithm of odds (LOD) score. The arrows indicate the significant quantitative trait loci (QTLs) (LOD > 2.5).
The F2 population derived from the 514 X GemCraft cross was genotyped using the barley 50K Illumina iSelect SNP array (Bayer et al., 2017) and the linkage map was constructed by IciMapping software using anchor physical chromosomal positions. In 163 F2 plants, 3062 high‐quality SNPs with unique distance in the linkage map with single breakpoint (>50 cM) between adjacent SNPs on each chromosome were found. Several other breakpoints that separated a single or a couple of SNPs at ends of the linkage groups were discarded. Finally, QTL was reported based on 1228 evenly selected SNPs from the 3062 SNPs with minimal reduction on chromosomes where QTL was detected. The number of SNPs ranges from 139 on chromosome 4H to 280 on chromosome 5H. Each chromosome showed a single breakpoint, and the seven chromosomes showed 14 linkage groups. A single major QTL on chromosome 2H was detected using this mapping population, which explained 78% variation. None of the three minor effect QTLs found in the 409 X GemCraft population was detected in the 514 X GemCraft population (Figure S5).
In the 185 plants of the F2 mapping population of the 409 X GemCraft cross, the genotype proportion in the four QTL regions was further examined to better understand inheritance of the trait (Figure 3). The population showed 75, 48, and 62 plants with purple, partial purple, and green leaf sheath, respectively. Like the phenotypic ratio, in the single major QTL qPLS2 for this population, the marker data deviated from the expected 1:2:1 genotype ratio of the simple Mendelian inheritance (chi‐square = 45, p‐value = 0.02e‐105). Nevertheless, all the purple F2 plants carried the purple parental allele. In addition, only one in the 48 partial purple plants carried the green parental genotype and one in the 62 green leaf sheath plants carried the purple parental genotype. The genotype fractions in the F2 mapping population suggested that the allele in the purple leaf sheath parental line GemCraft confers complete dominance over the allele carried by the green parental line 409. On the other hand, 85% (41/48) partial purple plants carried the heterozygote genotype suggesting an allelic dosage effect on the pigment intensity. Interestingly, compared to the green plants and the heterozygote genotype in all phenotypic categories, the purple and partial purple plants in the three minor QTLs showed alternating relative proportions of the parental genotypes that might influence the pigment intensity (Figure 3).
FIGURE 3.

Genotype proportion in the four quantitative trait locus (QTL) regions for leaf sheath color. The fraction of parental genotypes at the four QTLs is depicted from markers that are significantly associated to the phenotypic variation in the 409 X GemCraft F2 mapping population. The red and blue intensities show the relative proportion of all genotypes for purple leaf sheath2 locus (qPLS2) and the minor QTLs separately for each QTL and phenotype.
3.4. Identification of candidate genes and their orthologs in rice and sorghum
A QTL interval spans all markers significantly associated to the phenotype, and the widest interval is flanked by the immediately adjacent nonsignificant markers. For the qPLS2 QTL interval in the 409 X GemCraft mapping population, the two nonsignificant flanking markers were JHI‐Hv50k‐2016‐110496 and JHI‐Hv50k‐2016‐112097. These markers were located at 593,223,252 and 597,716,242 bp on chromosome 2H in the Morex V3 reference genome, which is about 4.5‐Mb QTL interval. For the 514 X GemCraft population, only the single locus qPLS2 was detected that is consistent with the 3:1 phenotypic ratio for this population. The nonsignificant flanking markers were JHI‐Hv50k‐2016‐105791 and JHI‐Hv50k‐2016‐113283 located at 565,278,104 and 600,499,723 bp on chromosome 2H, which is about 35‐Mb QTL interval and was much wider than that (4.5 Mb) in the 409 X GemCraft (Table 1) and partially overlaps with or spans the 4.5‐Mb interval depending on the SNPs subset used. Thus, the 4.5‐Mb qPLS2 interval shared by both populations was used for analysis of the candidate genes. Based on the genomic locations of the flanking markers, a total of 79 annotated genes were found in the 4.5‐Mb region (Table S1).
TABLE 1.
The genomic positions of the molecular markers flanking and significantly associated with the major effect quantitative trait locus (QTL) on chromosome 2H in the two biparental mapping populations.
| Population | Marker | Phenotype association | Linkage distance (cM) | Genomic position (bp)‐V3 |
|---|---|---|---|---|
| 409 X GemCraft | JHI‐Hv50k‐2016‐110496 | No | 79.00 | 593,223,252 |
| BOPA1_1635‐691 | Yes | 79.55 | 593,730,327 | |
| JHI‐Hv50k‐2016‐111124 | Yes | 80.09 | 594,549,476 | |
| JHI‐Hv50k‐2016‐112097 | No | 81.21 | 597,716,242 | |
| 514 X GemCraft | JHI‐Hv50k‐2016‐105791 | No | 163.20 | 565,278,104 |
| JHI‐Hv50k‐2016‐110405 | Yes | 177.25 | 592,727,990 | |
| JHI‐Hv50k‐2016‐112988 | Yes | 181.68 | 599,991,651 | |
| JHI‐Hv50k‐2016‐113283 | No | 189.26 | 600,499,723 |
To identify the qPLS2 candidate genes associated with the purple leaf sheath in GemCraft, the annotated peptide sequences of all 79 barley genes in the 4.5‐Mb QTL interval were used to search against the Rice Genome Annotation Project Database (http://rice.uga.edu). Homologous genes were found for 76 genes including one that showed homology to a transposon‐related gene in rice. The best hits (with highest similarity score and lowest E‐value) for 51 barley orthologous genes were found in rice indicating synteny between the 4.5‐Mb QTL region in barley chromosome 2H and the 2.6‐Mb region (from 25,826,665 to 28,435,990 bp) in rice chromosome 4 (Figure 4; Table S1). No significant hit (E‐value < 1 × 10⁻⁵) was found for the remaining three barley genes. A similar comparative genomic analysis between the qPLS2 genomic interval and the sorghum genome (https://phytozome‐next.jgi.doe.gov) revealed 49 orthologous genes in a 3.7‐Mb syntenic region (from 50,922,629 to 54,592,847 bp) in sorghum chromosome 6 (Table S1).
FIGURE 4.

The syntenic relationship between the 4.5‐Mb genomic region on barley chromosome 2H and the orthologous genes on rice chromosome 4. The yellow rectangles indicate that the syntenic genes were detected between barley and rice. The dark gray rectangles mean that the homologous genes were detected in rice, but they were located on other rice chromosomes. The light gray rectangles represent four barley genes for which no hit was found in rice, or the hit was transposon. The red dots show three potential candidate genes, and no orthologous gene was found for HORVU.MOREX.r3.2HG0189360 on rice chromosome 4.
Among the 76 annotated genes in the qPLS2 QTL interval, three genes were considered potential candidates for controlling the purple leaf sheath in GemCraft as all these genes encode transcription factors that play important roles in plant anthocyanin regulation (Cockram et al., 2010; Gao et al., 2011; Shoeva et al., 2023). The genes are HORVU.MOREX.r3.2HG0188710 encoding the basic helix–loop–helix (bHLH) protein, HORVU.MOREX.r3.2HG0189360 encoding WD40 transcription factor, and HORVU.MOREX.r3.2HG0189810 encoding MYB transcription factor. These genes were further used to search against the BarleyExpDB website, which is a publicly available database that integrates the barley gene expression profiles of different developmental stages and tissues under diverse stress conditions (T. Li et al., 2023). These three candidate genes were expressed with distinct expression patterns. HORVU.MOREX.r3.2HG0189360 was expressed in nearly all growth stages and all tissues, but HORVU.MOREX.r3.2HG0188710 and HORVU.MOREX.r3.2HG0189810 were highly expressed in stems and anthers, respectively (Table S2). Further, the HORVU.MOREX.r3.2HG0188710 transcript was detected in the leaf tissue of a few samples among diverse barley accessions, whereas the HORVU.MOREX.r3.2HG0189810 transcript was not detected at all (Table S2).
4. DISCUSSION
4.1. A new major QTL for the purple leaf sheath in barley
Previous reports indicate multiple loci across the barley genome contribute to the purple pigment variation of the barley grain color, namely, black lemma and pericarp (Blp) on chromosome 1H (Shoeva et al., 2016), Ant2 (Cockram et al., 2010; Gordeeva et al., 2019) and Pre2 (Jia et al., 2016) in 2H, Ant28 in 3H (Himi et al., 2012), HvMyc2 in 4H, Ant13 in 6H (Shoeva et al., 2023), and Cfi in 5H (Druka et al., 2003) and Ant18 in 7H (Nyegaard Kristiansen & Rohde, 1991). In addition, five complementary genes (Blx1 to Blx5) were reported to regulate pigmentation of the aleurone layer (Finch & Simpson, 1978). These reported loci carry the transcription factors MYB, WD40, and bHLH that are widely known to regulate the pigment variation and some structural genes. Compared to these previous studies on grain, the genetic basis of the pigment on the barley plant vegetative tissues is highly limited. Thus far, only Ant1 on chromosome 7H encoding a MYB transcription factor was reported to regulate the purple leaf sheath in barley (Himi & Taketa, 2015; Zakhrabekova et al., 2015). In this study, the genetic basis of purple leaf sheath in barley showed difference between mapping populations, and four QTLs were found associated with the phenotype. The QTL on chromosome 2H, qPLS2, explained >70% of the phenotypic variation. To our knowledge, the qPLS2 genomic region was not previously reported for the purple leaf sheath.
In the qPLS2 genomic region, three candidate genes (HORVU.MOREX.r3.2HG0189360, HORVU.MOREX.r3.2HG0189810, and HORVU.MOREX.r3.2HG0188710) were identified for the variation in the leaf sheath pigment. HORVU.MOREX.r3.2HG0189360 encoding WD40 protein was expressed in all tissues and at nearly all growth stages (Table S2), which was inconsistent with the accumulation of the pigment with development. Also, compared to the WD40‐domain orthologous genes in rice and barley (OsTTG1 and Ant13) that were reported to regulate purple pigmentation both on the leaf sheath and the grain (Shoeva et al., 2023; X. Yang et al., 2021), HORVU.MOREX.r3.2HG0189360 carried a dissimilar peptide sequence suggesting that the gene encodes a highly divergent protein (Figure S6). The other two candidate genes are discussed below.
The second candidate gene, HORVU.MOREX.r3.2HG0189810, which encodes MYB transcription factor showed no expression in the leaf tissue in diverse barley accessions but was highly expressed in the anther (Table S2). Similarly, transcript of the rice ortholog (OsDUO1, LOC_Os04g46384) was detected only in the pollen at the later stage of pollen development (S. L. Li et al., 2010). Interestingly, both OsDUO1 and the sorghum ortholog (Sobic.006G169700) were targeted by microRNA that was enriched during pollen development (Dhaka et al., 2020; Wei et al., 2011). Similarly, the homologous gene (R2R3‐MYB TF DUO1, AT3G60460) in Arabidopsis thaliana was expressed specifically in the male germline and showed an essential role for pollen differentiation (Borg et al., 2011). The other MYB transcription factor OsC1 (LOC_Os06g10350), which was reported to regulate purple leaf sheath in rice (Chin et al., 2016; Gao et al., 2011), showed an orthologous relationship to a different barley gene, HORVU.MOREX.r3.7HG0662710.
Unlike the two candidate genes discussed above, HORVU.MOREX.r3.2HG0188710, which encodes a bHLH transcription factor, was highly expressed in stems but also expressed in leaves. In addition to its rice and sorghum orthologs (LOC_Os04g47080 and Sobic.006G175700), two other colocalized homologous genes in both rice (LOC_Os04g47040 and LOC_Os04g47059) and sorghum (Sobic.006G175200 and Sobic.006G175500) were found (Table S1), which might relate to gene expansion with the tissue‐specific regulation of the trait (Carretero‐Paulet et al., 2010). LOC_Os04g47080 and LOC_Os04g47040 were shown to regulate the rice purple stigma and apiculus, respectively (Meng et al., 2021), and the sorghum ortholog Sobic.006G175700 was reported to regulate purple leaf sheath (P. Yang et al., 2024). The analysis of syntenic‐ortholog showed empirical evidence for evolutionary attributes (gene expansion) for the trait, which is consistent to HORVU.MOREX.r3.2HG0188710 as the candidate qPLS2 gene. However, we would like to point out that the other genes located between 593 and 598 Mb on chromosome 2H may also be the potential candidate genes for the purple leaf sheath in GemCraft. Thus, large mapping populations and high‐density markers are needed to obtain more recombination to narrow down the genomic region associated with the purple leaf sheath in GemCraft and further confirm the candidate gene. More experiments, including gene cloning and transformation, are also necessary to validate the candidate gene.
Interestingly, the bHLH candidate gene of qPLS2 was the previously reported Ant2 for regulation of the purple pigment in the barley grain (Cockram et al., 2010; Gordeeva et al., 2019; Shoeva et al., 2016). However, in this study, the pigment accumulation on the barley spike of the purple parental line (GemCraft) was unstable and when penetrant, the pigment intensity was weak compared to that on the leaf sheath. Further, the pigment was not easily spotted on the grain compared to the lemma. H. Li et al. (2024) reported that Ant2 gene contained abundant cis‐acting regulatory elements, including a light response feature, and encoded a hydrophilic unstable protein. The rice syntenic‐orthologous locus carried three closely related bHLH genes (Table S1), and two of them showed tissue‐specific regulation of pigmentation in stigma and apiculus (Meng et al., 2021). Similarly, the sorghum syntenic‐orthologous locus carried three closely related genes (Table S1), one of which regulated pigmentation in the leaf sheath (P. Yang et al., 2024). In contrast, the singleton candidate gene locus in barley might have maintained the function in multiple tissue systems, although within‐species variation might exist. Altogether, environment, genome background, and potentially allelic variation might influence the tissue‐specific role of the gene and stability of the encoded protein for accumulation of the purple pigment in the barley plant system.
4.2. The genetic regulation of the purple leaf sheath
Previous studies showed that the accumulation of anthocyanins is regulated by either a single genetic locus (Chin et al., 2016; Himi et al., 2012) or multiple loci (Shoeva et al., 2016; Yao et al., 2018). Similarly, in this study, the segregations of purple and partial purple to green leaf sheath were influnced by multiple genes for one biparental F2 population, whereas the other population showed a single gene genetic model. The identification of multiple QTLs was consistent to deviation from the genetic model for Mendelian inheritance. In the single major QTL (qPLS2), nonetheless, all purple and partial purple F2 plants carried either the purple leaf sheath parental genotype or the heterozygote suggesting that qPLS2 was necessary for the pigment development, and the 85% heterozygote in the partial‐purple category suggests the influence of allelic dose on the pigment intensity (Figure 3).
The relative parental genotype frequency for the three minor effect QTLs might imply an aspect of their influence on intensity of the purple pigment (Figure 3). Like the multiple loci in this study, the pigmentation in the rice vegetative tissue was regulated by inter‐allelic interaction of several genes (Lap et al., 2024). These minor QTLs might have moderately affected the pigment intensity. Also, the accumulation of anthocyanin on the barley leaf sheath and other tissues may be impacted by genetic background and other regulatory elements such as enhancers or suppressors that may modify the phenotypes; despite this, hypothesis needs to be tested. Environmental factors may need to be investigated in the future, as we found pigmentation instability on the GemCraft plant heads. The three minor QTLs from the 409/GemCraft were not detected in the 514 X GemCraft population, and it is possible that the green leaf sheath parental lines 409 and 514 carry different alleles that can affect pigment intensity. The limited F2 individuals may also affect our genetic mapping and the number of minor effect QTL.
4.3. Impacts of purple leaf sheath on barley improvement
Anthocyanins extracted from plants are widely used as dye, food colorant and pharmaceutical ingredients as they contain antidiabetic, anticancer, and other healthful effects (Khoo et al., 2017). It has been revealed that purple barley grains contain higher antioxidants and α‐glucosidase inhibiting activity (Jin et al., 2022). In addition, the stable purple leaf sheath phenotype might serve as a phenotypic marker in barley crop improvement. However, it is not well understood whether the anthocyanin chemical and the purple pigmentation over the green leaf sheath influence barley yield and other traits. It seems that the accumulation of anthocyanin can significantly affect grain dormancy in barley (Himi et al., 2012). Purple leaf sheath is common in the wild rice species and the rice landraces, but modern rice cultivars typically have green leaf and leaf sheath (Chin et al., 2016) suggesting that purple pigmentation may represent an unfavorable trait for breeding (Zheng et al., 2019). However, purple pigment is commonplace in both wild barley species and improved barley cultivars, including the two popular malting barley varieties Morex, which was selected for generating the barley reference genome (Mascher et al., 2017), and Golden Promise, which was widely used for barley transformation (Tingay et al., 1997).
The accumulation of anthocyanins in various plant tissues, including leaf sheath, has been considered an adaptive response to abiotic and biotic stress factors, including drought, UV‐B, heavy metals, and resistance to herbivores and pathogens (Gould, 2004). These plant responses might conflict with other environmental signals, including those in artificial growth conditions and in non‐adapted plant genotypes like genetic mapping populations. In the process of developing the mapping population in this study, we observed the possibility that the pigment accumulation is influenced by the relative difference in exposure to light, which resulted in an overaccumulation of the pigment when accompanied by high temperature as in summer under greenhouse condition. The purple pigmentation was observed in the leaf blade as well at the elevated temperature in association with the overaccumulation in the leaf sheath that severely impaired plant growth. Indeed, some plants with purple leaf sheath had died but all plants with green leaf sheath grew well under the same growth condition. Interestingly, the effect of high temperature on accumulation of the pigment on the barley head appeared to be the opposite of that in the vegetative tissue. Barley is usually planted in temperate areas although adapted to a wide agroecology (Dawson et al., 2015). Thus, it is worth investigating the impacts of anthocyanin accumulations on barley yield for effective utilization of these traits in the development of the future barley idiotypes.
AUTHOR CONTRIBUTIONS
Demeke B. Mewa: Investigation; writing—original draft; writing—review and editing. Ann Caspersen: Data curation; investigation. Jason D. Fiedler: Data curation; investigation; resources; writing—review and editing. Gongshe Hu: Resources; writing—review and editing. Dongying Gao: Conceptualization; data curation; investigation; supervision; writing—review and editing.
CONFLICT OF INTEREST STATEMENT
The authors declare no conflicts of interests.
Supporting information
Supplementary Material
Supporting Data
ACKNOWLEDGMENTS
The authors thank Mary Osenga at the USDA ARS North Central Regional Small Grains Genotyping Laboratory for generating genotyping data.
Mewa, D. B. , Caspersen, A. , Fiedler, J. D. , Hu, G. , & Gao, D. (2025). Genetic analysis and molecular mapping of the purple leaf sheath in barley (Hordeum vulgare). The Plant Genome, 18, e70034. 10.1002/tpg2.70034
Assigned to Associate Editor Laura Rossini.
DATA AVAILABILITY STATEMENT
The genotyping data of the two genetic populations can be found in the supplementary excel file “Genotyping Data Sets.”
REFERENCES
- Azhaguvel, P. , Hash, C. T. , Rangasamy, P. , & Sharma, A. (2003). Mapping the d1 and d2 dwarfing genes and the purple foliage color locus P in pearl millet. Journal of Heredity, 94, 155–159. 10.1093/jhered/esg025 [DOI] [PubMed] [Google Scholar]
- Bayer, M. M. , Rapazote‐Flores, P. , Ganal, M. , Hedley, P. E. , Macaulay, M. , Plieske, J. , Ramsay, L. , Russell, J. , Shaw, P. D. , Thomas, W. , & Waugh, R. (2017). Development and evaluation of a barley 50k iSelect SNP array. Frontiers in Plant Science, 8, 1792. 10.3389/fpls.2017.01792 [DOI] [PMC free article] [PubMed] [Google Scholar]
- Borg, M. , Brownfield, L. , Khatab, H. , Sidorova, A. , Lingaya, M. , & Twell, D. (2011). The R2R3 MYB transcription factor DUO1 activates a male germline‐specific regulon essential for sperm cell differentiation in Arabidopsis . The Plant Cell, 23, 534–549. 10.1105/tpc.110.081059 [DOI] [PMC free article] [PubMed] [Google Scholar]
- Carretero‐Paulet, L. , Galstyan, A. , Roig‐Villanova, I. , Martínez‐García, J. F. , Bilbao‐Castro, J. R. , & Robertson, D. L. (2010). Genome‐wide classification and evolutionary analysis of the bHLH family of transcription factors in Arabidopsis, Poplar, Rice, Moss, and Algae. Plant Physiology, 153, 1398–1412. 10.1104/pp.110.153593 [DOI] [PMC free article] [PubMed] [Google Scholar]
- Chakraborty, A. , Adhikary, S. , Bhattacharya, S. , Dutta, S. , Chatterjee, S. , Banerjee, D. , Ganguly, A. , & Rajak, P. (2023). Pharmaceuticals and personal care products as emerging environmental contaminants: Prevalence, toxicity, and remedial approaches. ACS Chemical Health & Safety, 30, 362–388. 10.1021/acs.chas.3c00071 [DOI] [Google Scholar]
- Chin, H. S. , Wu, Y. P. , Hour, A. L. , Hong, C. Y. , & Lin, Y. R. (2016). Genetic and evolutionary analysis of purple leaf sheath in rice. Rice, 9, Article 8. 10.1186/s12284-016-0080-y [DOI] [PMC free article] [PubMed] [Google Scholar]
- Cockram, J. , White, J. , Zuluaga, D. L. , Smith, D. , Comadran, J. , Macaulay, M. , Luo, Z. , Kearsey, M. J. , Werner, P. , Harrap, D. , Tapsell, C. , Liu, H. , Hedley, P. E. , Stein, N. , Schulte, D. , Steuernagel, B. , Marshall, D. F. , Thomas, W. T. , Ramsay, L. , … Wang, M. (2010). Genome‐wide association mapping to candidate polymorphism resolution in the unsequenced barley genome. Proceeding of the National Academy of Science, 107, 21611–21616. 10.1073/pnas.1010179107 [DOI] [PMC free article] [PubMed] [Google Scholar]
- Cornwall, J. , Stubbs, C. J. , McMahan, C. S. , & Robertson, D. J. (2021). The overlooked biomechanical role of the clasping leaf sheath in wheat stalk lodging. Frontiers in Plant Science, 12, 617880. 10.3389/fpls.2021.617880 [DOI] [PMC free article] [PubMed] [Google Scholar]
- Dawson, I. K. , Russell, J. , Powell, W. , Steffenson, B. , & Thomas, W. T. , & Waugh, R. (2015). Barley: A translational model for adaptation to climate change. New Phytology, 206, 913–931. 10.1111/nph.13266 [DOI] [PubMed] [Google Scholar]
- Des Marais, D. L. , & Rausher, M. D. (2008). Escape from adaptive conflict after duplication in an anthocyanin pathway gene. Nature, 454, 762–765. 10.1038/nature07092 [DOI] [PubMed] [Google Scholar]
- Dhaka, N. , Sharma, S. , Vashisht, I. , Kandpal, M. , Sharma, M. K. , & Sharma, R. (2020). Small RNA profiling from meiotic and post‐meiotic anthers reveals prospective miRNA‐target modules for engineering male fertility in sorghum. Genomics, 112, 1598–1610. 10.1016/j.ygeno.2019.09.009 [DOI] [PubMed] [Google Scholar]
- Dhesi, N. S. , Desormeaux, R. W. , & Pauksens, J. (1969). Identification of wheat and barley varieties at the seedling stage. Proceedings of the Association of Official Seed Analysts, 59, 134–140. https://www.jstor.org/stable/23432366 [Google Scholar]
- Druka, A. , Kudrna, D. , Rostoks, N. , Brueggeman, R. , von Wettstein, D. , & Kleinhofs, A. (2003). Chalcone isomerase gene from rice (Oryza sativa) and barley (Hordeum vulgare): Physical, genetic and mutation mapping. Gene, 302, 171–178. 10.1016/S0378-1119(02)01105-8 [DOI] [PubMed] [Google Scholar]
- Finch, R. A. , & Simpson, E. (1978). New colours and complementary colour genes in barley. Zeitschrift fur Pflanzenzuchtung, 81, 40–53. [Google Scholar]
- Gao, D. , Abdullah, S. , Baldwin, T. , Caspersen, A. , Williams, E. , Carlson, A. , Petersen, M. , Hu, G. , Klos, K. E. , & Bregitzer, P. (2024). Agrobacterium‐mediated transfer of the Fusarium graminearum Tri6 gene into barley using mature seed‐derived shoot tips as explants. Plant Cell Report, 43, Article 40. 10.1007/s00299-023-03129-z [DOI] [PMC free article] [PubMed] [Google Scholar]
- Gao, D. , He, B. , Zhou, Y. , & Sun, L. (2011). Genetic and molecular analysis of a purple sheath somaclonal mutant in japonica rice. Plant Cell Report, 30, 901–911. 10.1007/s00299-011-1004-3 [DOI] [PubMed] [Google Scholar]
- Gordeeva, E. I. , Glagoleva, A. Y. , Kukoeva, T. V. , Khlestkina, E. K. , & Shoeva, O. Y. (2019). Purple‐grained barley (Hordeum vulgare L.): Marker‐assisted development of NILs for investigating peculiarities of the anthocyanin biosynthesis regulatory network. BMC Plant Biology, 19, 49–57. 10.1186/s12870-019-1638-9 [DOI] [PMC free article] [PubMed] [Google Scholar]
- Gould, K. S. (2004). Nature's swiss army knife: The diverse protective roles of anthocyanins in leaves. BioMed Research International, 5, 314–320. 10.1155/S1110724304406147 [DOI] [PMC free article] [PubMed] [Google Scholar]
- Himi, E. , & Taketa, S. (2015). Isolation of candidate genes for the barley Ant1 and wheat Rc genes controlling anthocyanin pigmentation in different vegetative tissues. Molecular Genetics and Genomics, 290, 1287–1298. 10.1007/s00438-015-0991-0 [DOI] [PubMed] [Google Scholar]
- Himi, E. , Yamashita, Y. , Haruyama, N. , Yanagisawa, T. , Maekawa, M. , & Taketa, S. (2012). Ant28 gene for proanthocyanidin synthesis encoding the R2R3 MYB domain protein (Hvmyb10) highly affects grain dormancy in barley. Euphytica, 188, 141–151. 10.1007/s10681-011-0552-5 [DOI] [Google Scholar]
- Holton, T. A. , & Cornish, E. C. (1995). Genetics and biochemistry of anthocyanin biosynthesis. The Plant Cell, 7, 1071–1083. 10.1105/tpc.7.7.1071 [DOI] [PMC free article] [PubMed] [Google Scholar]
- Hu, G. , Evans, C. P. , Satterfield, K. , Ellberg, S. , Marshall, J. M. , Schroeder, K. L. , & Obert, D. E. (2024). Registration of ‘GemCraft’ spring malting barley cultivar. Journal of Plant Registrations, 18, 11–16. 10.1002/plr2.20331 [DOI] [Google Scholar]
- Hu, W. , Zhou, T. , Han, Z. , Tan, C. , & Xing, Y. (2020). Dominant complementary interaction between OsC1 and two tightly linked genes, Rb1 and Rb2, controls the purple leaf sheath in rice. Theoretical and Applied Genetics, 133, 2555–2566. 10.1007/s00122-020-03617-w [DOI] [PubMed] [Google Scholar]
- Jaakola, L. , Maatta, K. , Pirttila, A. M. , Torronen, R. , Karenlampi, S. , & Hohtala, A. (2002). Expression of genes involved in anthocyanin biosynthesis in relation to anthocyanin, proanthocyanidin, and flavonol levels during bilberry fruit development. Plant Physiology, 130, 729–739. 10.1104/pp.006957 [DOI] [PMC free article] [PubMed] [Google Scholar]
- Jia, Q. , Wang, J. , Zhu, J. , Hua, W. , Shang, Y. , Yang, J. , & Liang, Z. (2017). Toward identification of black lemma and pericarp gene Blp1 in barley combining bulked segregant analysis and specific‐locus amplified fragment sequencing. Frontiers in Plant Science, 8, 1414. 10.3389/fpls.2017.01414 [DOI] [PMC free article] [PubMed] [Google Scholar]
- Jia, Q. , Zhu, J. , Wang, J. , Yang, J. , & Zhang, G. (2016). Genetic mapping and molecular marker development for the gene Pre2 controlling purple grains in barley. Euphytica, 208, 215–223. 10.1007/s10681-015-1593-y [DOI] [Google Scholar]
- Jiang, C. K. , & Rao, G. Y. (2020). Insights into the diversification and evolution of R2R3‐MYB transcription factors in plants. Plant Physiology, 183, 637–55. 10.1104/pp.19.01082 [DOI] [PMC free article] [PubMed] [Google Scholar]
- Jin, H. M. , Dang, B. , Zhang, W. G. , Zheng, W. C. , & Yang, X. J. (2022). Polyphenol and anthocyanin composition and activity of highland barley with different colors. Molecules, 27, 3411. 10.3390/molecules27113411 [DOI] [PMC free article] [PubMed] [Google Scholar]
- Kang, S. G. , Lee, K. E. , Cho, J. , Lee, J. W. , Do, G. S. , & Matin, M. N. (2023). The purple leaf (Pl) alleles, Plw and Pli , regulate leaf color development independently from the Pb gene of purple pericarp (Prp) in rice. Agronomy, 13, 2845. 10.3390/agronomy13112845 [DOI] [Google Scholar]
- Kaur, S. , Tiwari, V. , Kumari, A. , Chaudhary, E. , Sharma, A. , Ali, U. , & Garg, M. (2023). Protective and defensive role of anthocyanins under plant abiotic and biotic stresses: An emerging application in sustainable agriculture. Journal of Biotechnology, 361, 12–29. 10.1016/j.jbiotec.2022.11.009 [DOI] [PubMed] [Google Scholar]
- Kempe, A. , Sommer, M. , & Neinhuis, C. (2013). A comparative analysis of the mechanical role of leaf sheaths of Poaceae, Juncaceae, and Cyperaceae . Journal of Botany, 2013, 690549. 10.1155/2013/690549 [DOI] [Google Scholar]
- Khan, A. , Jalil, S. , Cao, H. , Tsago, Y. , Sunusi, M. , Chen, Z. , Shi, C. , & Jin, X. (2020). The purple leaf (pl6) mutation regulates leaf color by altering the anthocyanin and chlorophyll contents in rice. Plants, 9, 1477. 10.3390/plants9111477 [DOI] [PMC free article] [PubMed] [Google Scholar]
- Khoo, H. E. , Azlan, A. , Tang, S. T. , & Lim, S. M. (2017). Anthocyanidins and anthocyanins: Colored pigments as food, pharmaceutical ingredients, and the potential health benefits. Food & Nutrition Research, 61(1), 1361779. 10.1080/16546628.2017.1361779 [DOI] [PMC free article] [PubMed] [Google Scholar]
- Lap, B. , Magudeeswari, P. , Tyagi, W. , & Rai, M. (2024). Genetic analysis of purple pigmentation in rice seed and vegetative parts—Implications on developing high‐yielding purple rice (Oryza sativa L.). Plant Genetics, 65, 241–254. 10.1007/s13353-023-00825-0 [DOI] [PubMed] [Google Scholar]
- Li, H. , Du, Y. , Zhang, J. , Feng, H. , Liu, J. , Yang, G. , & Zhu, Y. (2022). Unraveling the mechanism of purple leaf formation in Brassica napus by integrated metabolome and transcriptome analyses. Frontiers in Plant Science, 13, 945553. 10.3389/fpls.2022.945553 [DOI] [PMC free article] [PubMed] [Google Scholar]
- Li, H. , Yao, Y. , An, L. , Li, X. , Cui, Y. , Bai, Y. , Yao, X. , & Wu, K. (2024). Isolation and expression analysis of the HvnAnt2 gene in qingke barley (Hordeum vulgareL. var. nudum Hook. f.) varieties with different grain colours. Czech Journal of Genetics and Plant Breeding, 60, 107–118. 10.17221/7/2024-CJGPB [DOI] [Google Scholar]
- Li, S. L. , Zong, J. , Zhou, Z. G. , David, T. , & Zhang, D. B. (2010). Cloning and expression analysis of OsDUO1 encoding a rice MYB transcription factor. Plant Physiology Communications, 46, 1033–1039. [Google Scholar]
- Li, T. , Li, Y. , Shangguan, H. , Bian, J. , Luo, R. , Tian, Y. , Li, Z. , Nie, X. , & Cui, L. (2023). BarleyExpDB: An integrative gene expression database for barley. BMC Plant Biology, 23, Article 170. 10.1186/s12870-023-04193-z [DOI] [PMC free article] [PubMed] [Google Scholar]
- Long, Z. , Jia, Y. , Tan, C. , Zhang, X. , Angessa, T. , Broughton, S. , Westcott, S. , Dai, F. , Zhang, G. , Sun, D. , Xu, Y. , & Li, C. (2019). Genetic mapping and evolutionary analyses of the black grain trait in barley. Frontiers in Plant Science, 9, 1921. 10.3389/fpls.2018.01921 [DOI] [PMC free article] [PubMed] [Google Scholar]
- Ludwig, S. R. , Habera, L. F. , Dellaporta, S. L. , & Wessler, S. R. (1989). Lc, a member of the maize R gene family responsible for tissue‐specific anthocyanin production, encodes a protein similar to transcriptional activators and contains the myc‐homology region. Proceeding of the National Academy of Science, 86, 7092–7096. 10.1073/pnas.86.18.7092 [DOI] [PMC free article] [PubMed] [Google Scholar]
- Mascher, M. , Gundlach, H. , Himmelbach, A. , Beier, S. , Twardzoik, A. O. , Wicker, T. , Radchuk, V. , Dockter, C. , Hedley, P. E. , Russell, J. , Bayer, M. , Ramsay, L. , Liu, H. , Haberer, G. , Zhang, X. Q. , Zhang, Q. , Barrero, R. A. , Li, L. , Taudien, S. , … Stein, N. (2017). A chromosome conformation capture ordered sequence of the barley genome. Nature, 544, 427–433. 10.1038/nature22043 [DOI] [PubMed] [Google Scholar]
- Mascher, M. , Wicker, T. , Jenkins, J. , Plott, C. , Lux, T. , Koh, C. S. , Ens, J. , Gundlach, H. , Boston, L. B. , Tulpová, Z. , Holden, S. , Hernández‐Pinzón, I. , Scholz, U. , Mayer, K. F. X. , Spannagl, M. , Pozniak, C. J. , Sharpe, A. G. , Šimková, H. , Moscou, M. J. , … Stein, N. (2021). Long‐read sequence assembly: A technical evaluation in barley. The Plant Cell, 33, 1888–1906. 10.1093/plcell/koab077 [DOI] [PMC free article] [PubMed] [Google Scholar]
- Meng, L. , Li, H. , Zhang, L. , & Wang, J. (2015). QTL IciMapping: Integrated software for genetic linkage map construction and quantitative trait locus mapping in biparental populations. The Crop Journal, 3, 269–283. 10.1016/j.cj.2015.01.001 [DOI] [Google Scholar]
- Meng, L. , Qi, C. , Wang, C. , Wang, S. , Zhou, C. , Ren, Y. , Cheng, Z. , Zhang, X. , Guo, X. , Zhao, Z. , Wang, J. , Lin, Q. , Zhu, S. , Wang, H. , Wang, Z. , Lei, C. , & Wan, J. (2021). Determinant factors and regulatory systems for anthocyanin biosynthesis in rice apiculi and stigmas. Rice, 14, Article 37. 10.1186/s12284-021-00480-1 [DOI] [PMC free article] [PubMed] [Google Scholar]
- Monat, C. , Padmarasu, S. , Lux, T. , Wicker, T. , Gundlach, H. , Himmelbach, A. , Ens, J. , Li, C. , Muehlbauer, G. J. , Schulman, A. H. , Waugh, R. , Braumann, I. , Pozniak, C. , Scholz, U. , Mayer, K. F. X. , Spannagl, M. , Stein, N. , & Mascher, M. (2019). TRITEX: Chromosome‐scale sequence assembly of Triticeae genomes with open‐source tools. Genome Biology, 20, Article 284. 10.1186/s13059-019-1899-5 [DOI] [PMC free article] [PubMed] [Google Scholar]
- Mullick, D. B. , Faris, D. G. , Brink, V. C. , & Acheson, R. M. (1958). Anthocyanins and anthocyanidins of the barley pericarp and aleurone tissues. Canadian Journal of Plant Science, 38, 445–456. 10.4141/cjps58-071 [DOI] [Google Scholar]
- Nyegaard Kristiansen, K. , & Rohde, W. (1991). Structure of the Hordeum vulgare gene encoding dihydroflavonol‐4‐reductase and molecular analysis of ant18 mutants blocked in flavonoid synthesis. Molecular and General Genetics MGG, 230, 49–59. 10.1007/BF00290650 [DOI] [PubMed] [Google Scholar]
- Shoeva, O. Y. , Mock, H. P. , Kukoeva, T. V. , Börner, A. , & Khlestkina, E. K. (2016). Regulation of the flavonoid biosynthesis pathway genes in purple and black grains of Hordeum vulgare . PLoS One, 11(10), e0163782. 10.1371/journal.pone.0163782 [DOI] [PMC free article] [PubMed] [Google Scholar]
- Shoeva, O. Y. , Mukhanova, M. A. , Zakhrabekova, S. , & Hansson, M. (2023). Ant13 encodes regulatory factor WD40 controlling anthocyanin and proanthocyanidin synthesis in barley (Hordeum vulgare L.). Journal of Agricultural and Food Chemistry, 1, 6967–6977. 10.1021/acs.jafc.2c09051 [DOI] [PubMed] [Google Scholar]
- Tamura, K. , Stecher, G. , & Kumar, S. (2021). MEGA 11: Molecular evolutionary genetics analysis version 11. Molecular Biology and Evolution, 38, 3022–3027. 10.1093/molbev/msab120 [DOI] [PMC free article] [PubMed] [Google Scholar]
- Tingay, S. , McElroy, D. , Kalla, R. , Fieg, S. , Wang, M. , Thornton, S. , & Brettell, R. (1997). Agrobacterium tumefaciens‐mediated barley transformation. The Plant Journal, 11, 1369–1376. 10.1046/j.1365-313X.1997.11061369.x [DOI] [Google Scholar]
- Wang, W. Y. , Ding, H. F. , Li, G. X. , Jiang, M. S. , Li, R. F. , Liu, X. , Zhang, Y. , & Yao, F. Y. (2009). Delimitation of the PSH1(t) gene for rice purple leaf sheath to a 23.5 kb DNA fragment. Genome, 52, 268–274. 10.1139/G08-121 [DOI] [PubMed] [Google Scholar]
- Wei, L. Q. , Yan, L. F. , & Wang, T. (2011). Deep sequencing on genome‐wide scale reveals the unique composition and expression patterns of microRNAs in developing pollen of Oryza sativa . Genome Biology, 12, Article R53. 10.1186/gb-2011-12-6-r53 [DOI] [PMC free article] [PubMed] [Google Scholar]
- Wu, W. , Huang, J. , Cui, K. , Nie, L. , Wang, Q. , Yang, F. , & Shah, F. (2012). Sheath blight reduces stem breaking resistance and increases lodging susceptibility of rice plants. Field Crop Research, 128, 101–108. 10.1016/j.fcr.2012.01.002 [DOI] [Google Scholar]
- Yang, P. , Bai, Y. , Zhao, D. , Cui, W. , Yang, W. , Gao, Y. , Zhang, J. , Wang, Z. , Wang, M. , Xue, W. , & Chang, J. (2024). Identification and functional marker development of SbPLSH1 conferring purple leaf sheath in sorghum. Theoretical and Applied Genetics, 137, Article 137. 10.1007/s00122-024-04623-y [DOI] [PubMed] [Google Scholar]
- Yang, X. , Wang, J. , Xia, X. , Zhang, Z. , He, J. , Nong, B. , Luo, T. , Feng, R. , Wu, Y. , Pan, Y. , Xiong, F. , Zeng, Y. , Chen, C. , Guo, H. , Xu, Z. , Li, D. , & Deng, G. (2021c). OsTTG1, a WD40 repeat gene, regulates anthocyanin biosynthesis in rice. The Plant Journal, 107, 198–214. 10.1111/tpj.15285 [DOI] [PubMed] [Google Scholar]
- Yao, X. , Wu, K. , Yao, Y. , Bai, Y. , Ye, J. , & Chi, D. (2018). Construction of a high‐density genetic map: Genotyping by sequencing (GBS) to map purple seed coat color (Psc) in hulless barley. Hereditas, 155, Article 37. 10.1186/s41065-018-0072-6 [DOI] [PMC free article] [PubMed] [Google Scholar]
- Yao, X. , Yao, Y. , An, L. , Li, X. , Bai, Y. , Cui, Y. , & Wu, K. (2022). Accumulation and regulation of anthocyanins in white and purple Tibetan Hulless Barley (Hordeum vulgare L. var. nudum Hook. f.) revealed by combined de novo transcriptomics and metabolomics. BMC Plant Biology, 22, Article 391. 10.1186/s12870-022-03699-2 [DOI] [PMC free article] [PubMed] [Google Scholar]
- Zakhrabekova, S. , Dockter, C. , Ahmann, K. , Braumann, I. , Gough, S. P. , Wendt, T. , Lundqvist, U. , Mascher, M. , Stein, N. , & Hansson, M. (2015). Genetic linkage facilitates cloning of Ert‐m regulating plant architecture in barley and identified a strong candidate of Ant1 involved in anthocyanin biosynthesis. Plant Molecular Biology, 88, 609–626. 10.1007/s11103-015-0350-x [DOI] [PubMed] [Google Scholar]
- Zheng, J. , Wu, H. , Zhu, H. , Huang, C. , Liu, C. , Chang, Y. , Kong, Z. , Zhou, Z. , Wang, G. , Lin, Y. , & Chen, H. (2019). Determining factors, regulation system, and domestication of anthocyanin biosynthesis in rice leaves. New Phytologist, 223, 705–721. 10.1111/nph.15807 [DOI] [PubMed] [Google Scholar]
Associated Data
This section collects any data citations, data availability statements, or supplementary materials included in this article.
Supplementary Materials
Supplementary Material
Supporting Data
Data Availability Statement
The genotyping data of the two genetic populations can be found in the supplementary excel file “Genotyping Data Sets.”