

Abstract
It is important to study the fracture mechanism of fractured rocks. Uniaxial compression tests and discrete element numerical simulations were conducted on sandstone specimens with fixed dip angles and parallel fractures. With the help of acoustic emission detection technology, the effects of different fracture spacings and number of fractures on the mechanical properties, fracture mechanism and acoustic emission full dynamic time-varying evolution of sandstone were investigated. The results show that: there is an obvious correlation between the number of fractures and elastic modulus and no obvious correlation with strength. There is no clear relationship between fracture spacing, elastic modulus, and peak strength. The fracture spacing determines the basic type of crack aggregation, and the number of cracks mainly affects the diversity of crack aggregation types. Spalling damage mainly occurs at the middle position of through-bridge shear cracks, and plate crack damage mainly occurs at the position on both sides of the specimen. Through-bridge shear cracks are a common type of crack in specimens containing parallel fractures, which influence the initiation location of the main shear crack and the damage mechanism of the specimen, and affect the overall strength of the specimen by changing the local narrowest width of the “column” structure. There is a mutual excitation between the tension and shear cracks, and each sudden increase in the shear-tension crack ratio corresponds to a macroscopic rupture of the specimen. The multifractal parameters of acoustic emission can provide a more detailed description of signal complexity. The abrupt changes in the time-varying multifractal parameters Δα and Δf(α) can serve as short-range prediction indicators for disaster occurrences.
Keywords: Fracture mechanism, Parallel fractures, Discrete elements, Agglomeration types, Through-bridge shear cracks, Time-varying multifractal
Subject terms: Engineering, Materials science, Mathematics and computing
Rocks are composed of mineral aggregates that contain numerous internal defects, including weak inclusions, pores, joints, and fractures. These defects are typically random in scale and spatial distribution. The anisotropy of these defects, along with their varying sizes, shapes, and distributions, results in differences in the mechanical properties of the rocks1,2. To gain a deeper understanding of the damage mechanisms in rock bodies containing fracture structures, numerous experimental and numerical studies have been conducted on various rock materials and rock-like materials with different fracture geometries. The findings from these studies can enhance the understanding of the damaging mechanisms that destabilize rock engineering, particularly in areas such as nuclear waste disposal, slope stability, and deep underground engineering.
In the past decades, scholars all over the world have carried out a large number of experimental, numerical computational, and simulation studies on rock containing flaw, and have deeply analyzed the crack extension and fracture mechanisms3–8. Researchers have indicated that the cracking and penetration behavior of rock bodies tends to concentrate near the tip of a fracture. Additionally, as cracks expand around the fracture, many macroscopic cracks form, linking the near-field and far-field areas9,10. Among them, a variety of factors such as fracture length, width, dip, inclination and shape all have some influence on the cracking and mechanical behavior of the rock mass. Differences in the mechanical properties of the filler materials within the fractures can also affect the crack evolution process to varying degrees11–13. In addition, differences in the number and relative position of the fractures also affect the crack evolution process14–18. When subjected to compressive loading, wing cracking starting from the end of the fracture and the emergence of a large number of secondary cracks around the surroundings of the fracture are regarded as the two most basic modes of crack initiation in fracture rock tests19,20. As the load increases, the initiation cracks will further expand and continuously affect the distribution of the surrounding stress concentration, resulting in the emergence of a large number of secondary cracks. They undergo agglomeration and merging, eventually inducing macroscopic destruction of the rock.21. This indicates that the process of crack consolidation can significantly influence the damage behavior of rocks, where crack coalescence and consolidation within a multi-fractured rock specimen may be more complex.
The current study analyzes the agglomeration behavior of cracks under compressive loading of parallel-fractured specimens with different angles22–25. Zhou et al.26 identified ten types of crack agglomeration based on the crack interactions between wing cracks, secondary cracks, and out-of-plane tensile/shear cracks. Scholars have also carried out extensive studies on the agglomeration behavior of specimens containing non-parallel fractures under uniaxial compression27–29, and several types of agglomerated cracks were identified30. However, most of the current studies on the cracking behavior of multi-fractured rock samples have focused on less than three fractures, and there is a lack of more in-depth studies and analyses on multi-fractured rock samples containing specific forms of fracture distribution.
With the rapid development of computational technology, there are more and more numerical studies on rock crack evolution. Currently, RFPA31, FEM32, FRANC33, PFC34, NMM35, AUTODYN36, FLAC37, DDA38, UDEC39, and PD40 have been successfully applied to simulate the rock crack initiation, extension, and coalescence behaviors. Among them, PFC is a discrete-cell computational method, which has now been more successfully applied in modeling rock crack evolution. For example, Zhang and Wong41 used PFC to study the crack evolution process of a rock-like material containing two prefabricated fractures, analyzed the effects of crack geometry on mechanical parameters, crack initiation type and crack consolidation mode, and the numerical simulation results are in good agreement with the laboratory experimental results. Yang et al.42 used PFC to study the crack evolution mechanism of brittle sandstone under uniaxial compression. They traced the distribution of parallel bonding forces around the tips of prefabricated fractures as well as the expansion paths of new cracks. The studies by Zhang and Wong41, Liu et al.43, and Huang et al.44 have shown that PFC performs well in reproducing the experimental results and analyzing the fine-scale mechanisms of rock crack consolidation. In addition, various traditional testing techniques have been optimized and developed, among which the use of acoustic emission (AE) to record and analyze the cracking behavior of intact or defective specimens under different loading conditions is more common and effective45.
Currently, there are many studies examining how the length, width, angle, and shape of fractures affect rock cracking and mechanical behavior. However, fewer studies focus on how the number and spacing of cleavages influence the mechanical properties of rocks and their fracture mechanisms. For this purpose, rock mechanics indoor tests and numerical simulation tests on fractured sandstone specimens were carried out in this study. Based on the results of the specimen fracture tests and the evolution of microcracks observed in numerical simulations, this study summarizes the crack agglomeration pattern of fractured sandstone observed during indoor tests. It also reveals the underlying damage mechanisms by analyzing particle displacement characteristics and the stress field surrounding the cracks. The analysis of AE multifractal features supports numerical simulation results and can be used as an early warning signal for specimen fracture. This study aims to enhance our understanding of how the number and spacing of fractures affect the mechanical properties and damage characteristics of rocks. Additionally, it will serve as a reference for early warning systems related to dynamic hazards in sandstones that exhibit varying numbers and spacing of fractures.
Mechanism of crack extension in parallel-fracture specimens under compressive loading
The process of rock damage involves gradual cracking, expansion, and the penetration of internal cracks due to external forces. In a multi-stress environment, the wing crack will expand and rupture at the point of maximum tensile stress. Once the wing crack reaches a certain size, the shear crack will begin to develop, as illustrated in Fig. 1. Where the length of the fracture is 2a and the angle between the fracture and the horizontal direction is β. The coordinate system xoy is established to obtain the far-field stress expression:
 |
1 |
 |
2 |
Fig. 1.

Mechanical model of crack extension of single-fracture specimen under compression shear condition(Figure: ①wing cracks; ②anti-wing cracks; ③coplanar shear cracks) .
If the fracture is an open fracture , the stress field at the crack tip can be expressed as
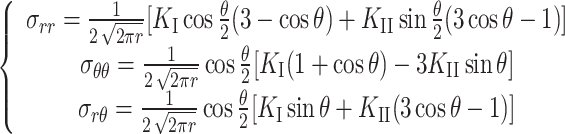 |
3 |
where θ is the polar angle in polar coordinates, r is the distance of the micro unit from the fracture tip, and KI and KI are the stress intensity factors for type I and type II cracks, respectively.
According to the theory of fracture mechanics, the stress intensity factor of the tip of the fracture containing the center tilt is calculated as:
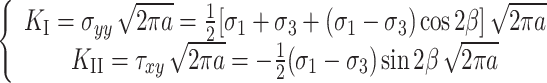 |
4 |
From Eq. (4), it is evident that under compressive loading, the Type I stress intensity factor is negative and lacks physical significance. Neglecting the effect of fracture opening and assuming that the upper and lower surfaces of the fracture do not contact each other, KI equals zero when subjected to compressive stress. According to the circumferential tensile stress criterion, the crack initiation condition for type I cracks caused by shear slip is known as:
 |
5 |
 |
6 |
According to Eqs. (5) and (6), the heave angle θ = 70.5° for the wing crack can be calculated. As the wing crack expands, its stress intensity factor gradually decreases until it can no longer reach the fracture toughness of the tension crack, causing it to stop expanding. Meanwhile, the prefabricated fracture gradually closes under compressive stress. At this stage, shear cracks begin to form at the end of the primary fracture. These shear cracks mainly consist of anti-wing cracks and coplanar shear cracks. Based on the maximum circumferential tensile stress criterion, we propose a maximum radial shear stress criterion to determine the crack initiation condition for shear cracks.
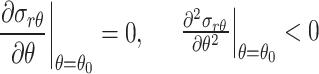 |
7 |
The calculated θ0 = 0° or θ0 = ± 123.8° . Where the radial force is tensile when θ0 = 123.8° , which is not compatible with the compressive loading mode and therefore discarded. The theoretically calculated cracking angles θ0 are 0° and -123.8° , where θ0 = 0° corresponds to coplanar shear cracks and θ0 = -123.8° corresponds to anti-wing cracks.
Further theoretical research is conducted to investigate the issues of secondary shear cracks and anti-wing cracks, including the conditions for crack initiation and the modes of combination. Order:
 |
8 |
then
 |
9 |
 |
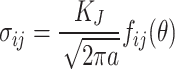
10 |
where: KJ is the stress intensity factor and fij(θ) is the directivity function of θ.
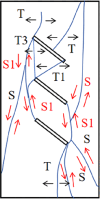
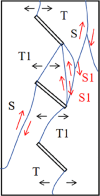
The dependence of the directional functions fθθ(θ), frθ(θ) for θ is shown in Fig. 2. Keeping the fracture dip angle, specimen material, and external loading conditions constant, the stress component at the end of the fracture is dependent on the fij(θ). The shear stress factor frθ(θ) progressively decreases in the direction of the increasing tensile stress factor fθθ(θ). In the direction of increasing tensile stress factor fθθ(θ), the shear stress factor frθ(θ) gradually decreases. At θ0 = 70.5°, fθθ(θ) reaches its maximum, and when the axial load is loaded to a certain extent, the wing cracks are generated. At θ0 = 0°, fθθ(θ) is required to be minimum, while at -123.8°, cracks can be generated as long as fθθ(θ) decreases to 0.588, so it can be seen that anti-wing cracks are more likely to initiate than coplanar shear cracks. When a parallel fracture specimen is subjected to axial loading, the wing crack initially expands to a certain extent. Following this, anti-wing cracks and shear cracks (originating at the ends of adjacent cracks) expand in sequence. Theoretically, these two cracks will merge at a specific location, resulting in the formation of a unique shear crack, as illustrated in Fig. 3. Due to the shielding effect of the crack, when the shear crack penetrates, it prevents the expansion of the coplanar shear crack generated by the upper crack and the anti-wing crack generated on the right side of the lower crack.
Fig. 2.

The variation law of fθθ(θ) and frθ(θ) with circumferential θ angle.
Fig. 3.

Mechanical model of crack extension of double-fracture specimen under pressure-shear condition(Figure: ①wing crack; ②anti-wing crack; ③coplanar shear crack) .
Subsequently, experiments and numerical simulations will be conducted to further elucidate the mechanisms of crack growth and damage characteristics in specimens with parallel fractures.
Research methodology
Rock materials and contact modeling
The test sandstone specimens were taken from the Baoanying Tunnel of the Chengkun Railway, which are mainly fine-grained non-homogeneous material crystallized in a blocky structure, with an average unit weight of about 2703 kg/m3. According to the X-ray diffraction (XRD) results, as shown in Fig. 4, the minerals in the sample are mainly plagioclase feldspar, quartz, calcite, potassium feldspar and rhodochrosite. It is a very hard rock specimen with no visible defects, featuring a uniform and dense texture that demonstrates good integrity. To ensure that the physical and mechanical properties of the selected test specimens are similar, and to avoid large cracks in the rock that might affect the test results and introduce significant variability, we utilized a non-metallic ultrasonic testing instrument (GTJ-U920) to measure the longitudinal wave speed of the green sandstone. We selected the longitudinal wave speed, which is approximately 3890 m/s, as the standard for the test specimens.
Fig. 4.

X-ray diffraction analysis results of fine sandstone.
There is no macroscopic mechanical ontological model used in PFC to directly define the rock material, and the mechanical parameters are mainly transferred through the contact between the particles. Adjustment of the contact parameters between the particles allows for obtaining fine mechanical parameters that achieve satisfying macroscopic mechanical properties. Currently, in the discrete element numerical analysis of rock deformation and damage mechanism, the most common models include two kinds: Linear Parallel Bonding Model (PBM) and Flat-Joint Model (FJM). Among them, the linear parallel bonding model results in a low ratio of compressive strength to the tensile strength of the specimen due to the failure to provide a sufficiently large rotational resistance46. The flat-joint model overcomes this defect, since the contact in the flat-joint model is spliced by multiple units (as in Fig. 5), when the stress on one element exceeds its allowable stress, the element will break, but at this time the other elements in contact with it are not damaged, so that the rotation will be inhibited. The flat-joint model is the best option to simulate the high-strength extremely brittle rock material.
Fig. 5.

Fine-grain mechanical modeling of the flat-joint model46.
Preparation of prefabricated fracture specimens
According to the standard of the International Society of Rock Mechanics, the sandstone specimen was processed and polished into a cylindrical laboratory specimen of Φ50mm × 100mm, with a fracture dip angle of 45°, the thickness and length of the fracture are 1.5mm and 15mm, respectively. The parameters of the number of fractures and the fracture spacings are shown in Table 1, and the distribution of fractures is shown in Fig. 6. Where d denotes the distance between two adjacent fractures, D denotes the distance between the top fracture and the bottom fracture.
Table 1.
Fracture geometry parameters of sandstone specimens.
| Test specimen | Number of fractures (bars) | Fracture dip angle(º) | Fracture length l(mm) | Fracture spacing d(mm) | |
|---|---|---|---|---|---|
| Intact specimens | Intact-1,2,3 | 0 | — | — | — |
| Single-fracture specimens | A-1,2,3 | 1 | 45 | 15 | — |
| Double-fracture specimens | B-I-1,2,3 | 2 | 45 | 15 | 10 |
| B-II-1,2,3 | 2 | 45 | 15 | 20 | |
| B-III-1,2,3 | 2 | 45 | 15 | 30 | |
| B-IV-1,2,3 | 2 | 45 | 15 | 40 | |
| Triple-fracture specimens | C-I-1,2,3 | 3 | 45 | 15 | 10 |
| C-II-1,2,3 | 3 | 45 | 15 | 20 | |
| C-III-1,2,3 | 3 | 45 | 15 | 30 | |
| C-IV-1,2,3 | 3 | 45 | 15 | 40 |
Fig. 6.

Fracture distribution characteristics.
To avoid many problems, such as uneven surface defects caused by direct deletion of particles, the author proposes an applicable method for generating fractures for modeling. First, the wall is generated at a prefabricated fracture location before pre-compressing the modeled particles and deleting the particles on the inside of the wall, followed by pre-compressing as well as generating the cementation properties, and finally deleting the wall.
Experimental equipment and simulation program
The test was carried out with the help of the TAW-2000 rock test system (Fig. 7). To obtain a stable strain rate, the axial loading method was controlled by axial strain control, and the loading rate was controlled at 0.03 mm/min until the specimen was destroyed, and the acoustic emission monitoring was synchronized with the uniaxial loading test. The acoustic emission probe and the rock sample were joined using vaseline as a coupling agent to decrease signal attenuation.
Fig. 7.

TAW-2000 rock triaxial test system.
In Fig. 8, the numerical simulation shows the loading of the fracture specimen. The numerical specimens were subjected to displacement control loading as well. The use of two horizontal walls as loading platforms resulted in the removal of two vertical walls. The end condition for post-peak simulation was set to 0.75 times the peak axial stress.
Fig. 8.

Numerical simulation loading diagram.
Numerical simulation for fine-scale parameter calibration
The micromechanical parameters between particles in the flat nodule model in the PFC program mainly include: nodule installation gap fj_gap, normal stiffness fj_kn, tangential stiffness fj_ks, friction coefficient fj_fric, tensile strength fj_ten, cohesion fj_coh, angle of internal friction fj_fa and many other mechanical parameters. In order to verify the accuracy and reasonableness of the particle properties used in the numerical simulation, it is necessary to calibrate the match between the macroscopic mechanical behavior and the micro-parameters. During the calibration process, the trial-and-error method was used to verify the micro-parameters. The micro-parameters were calibrated one by one based on the uniaxial compression test results of single and multi-fracture specimens and repeatedly calibrated until the numerical results matched well with the experimental results. Table 2 shows the micromechanical parameters that are specific.
Table 2.
The microscopic parameters used in the numerical model.
| Parameters | Numerical value |
|---|---|
| Minimum particle radius Rmin/mm | 0.3 |
| Ratio of particle diameter Rmax/Rmin | 1.67 |
| Effective modulus fj_emod/Gpa | 11 |
| Normal-to-shear stiffness ratio, κ* = κn/κs | 1.0 |
| Tensile strength fj_ten/Mpa | 40 |
| Cohesion fj_coh/Mpa | 56 |
| Friction angle fj_fa/º | 25 |
| Friction coefficient fj_fric | 0.577 |
| Number of elements in radial direction fj_n | 4 |
In Fig. 9, the results of numerical calculation and indoor test for uniaxial compression of single-fracture and triple-fracture specimens are shown, respectively. The numerically calculated stress curves and specimen damage results are basically consistent with the test results, as shown in Fig. 9. It shows that the model parameters and the selection of the particle bonding model have certain rationale.
Fig. 9.

Complete specimen test and numerical simulation curves.
Experimental and simulation results
Stress curve and mechanical parameters
Figures 10 and 11 show the mechanical parameters characterized by uniaxial compression and the stress profiles of different specimens, respectively. The number of fractures is indicated by B in the label B-I-1, I indicates the spacing between them, and 1 indicates the initial specimen in each group. In Fig. 10, d = -10 mm and d = 0 mm denote the test results of intact rock samples and single-fracture rock samples, respectively. The uniaxial compressive strength as well as the elastic modulus of the prefabricated fracture specimens are smaller than that of the intact specimens, and the elastic modulus of the double-fracture and triple-fracture specimens are smaller than that of the single-fracture specimens. The elastic modulus of the double-fracture rock samples initially decreases and then increases as the fracture spacing increases. The lowest value of 20.54 GPa is observed when the fracture spacing is 20 mm. On the other hand, the elastic modulus of the triple-fracture rock samples increases with the increase of fracture spacing. It tends to stabilize when the fracture spacing is greater than 20 mm, with the lowest value of 19.73 GPa occurring at a fracture spacing of 10 mm. The overall change trend of the peak strength of the double-fracture and triple-fracture specimens is similar, with the increase in the spacing of the peak strength of the fractures are shown as the first decrease and then increase the rule of change. The minimum value of compressive strength of 102.97 MPa for the double-fracture specimen appeared at d = 30 mm, and the minimum value of compressive strength of 108.91 MPa for the triple-fracture specimen also appeared at d = 30 mm. In addition, when the fracture spacing is d = 20 mm ~ 40 mm, the peak strength of the triple-fracture specimen was even higher than that of the double-fracture specimen, which can be seen that the peak strength of the specimen was not positively correlated with the number of parallel fractures. It can be inferred that the peak strength of the specimen is not positively correlated with the number of parallel fractures. As can be seen from Fig. 11, the stress curve of the intact specimen is the smoothest, and the single-fracture specimen does not show significant stress drop before the peak but after the peak. The double-fracture specimen did not show significant stress drop except for d = 10mm in the pre-peak stage, the other three cases all showed large stress drop before the peak, and the stress curves of the triple-fracture specimens all show different degrees of stress drop in the pre-peak stage, which indicates that the specimens all showed more obvious macroscopic damage in the pre-peak stage. The post-peak stress drop continues to exist, indicating that the crack propagation process in the post-peak stage is gradual, and the energy release process is also gradual.
Fig. 10.

Characterization of mechanical parameters of the specimen.
Fig. 11.

Stress curve of specimen under uniaxial compression.
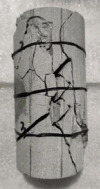
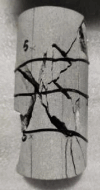
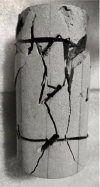
Characteristics of crack localization and aggregation patterns
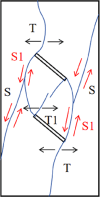
Two prefabricated fractures are joined by newly formed crack under loading, which is called crack agglomeration. The initiation of cracks and the final joining of prefabricated fractures are important for understanding the mechanism of rock damage. According to the damage characteristics of the specimens and the numerical calculations, it was found that the cracks connected to the end of the parallel cleavage are mainly S1 type cracks, which coincides with the results of the paper47. This type of crack is characterized by not cracking from the end of the prefabricated fracture, but cracking in the middle of the line connecting the tips of the same side of the prefabricated fracture, and gradually extends towards the tip of the prefabricated fracture with the increased of the compressive stresses, and the authors named this type of S1 type of shear cracks that penetrate through the rock bridges between the neighboring prefabricated fractures as the "through-bridge shear crack".
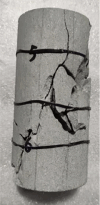
The displacement field of the PFC provides valuable information for identifying different types of cracks48,49. Figure 12 illustrates the displacement decomposition method and summarizes the displacement characteristics of two particles corresponding to three types of cracks. Tensile cracks occur when two particles have relative displacements perpendicular to the particle contact surface. Shear cracks occur when two particles have relative displacements parallel to the particle contact surface. Mixed tension-shear cracks occur when both particles have relative displacements in a direction perpendicular to the parallel direction of the particle contact surface. Based on this method, the displacement field distribution of particles on both sides of the crack in different regions of the numerical calculation results is shown in Fig. 13. Regions 2 and 3 of the specimen exhibit shear cracks. Figure 14 shows a typical specimen C-II-3 after fracture damage, with white friction marks indicating the presence of shear cracks. It is evident that the through cracks between the prefabricated fractures are all shear cracks, which is consistent with the results of the numerical calculation in Fig. 13. This suggests that the cracks penetrating through the rock bridge between neighboring prefabricated fractures are mainly shear cracks.
Fig. 12.

Summary of the displacement distribution of the three types of cracks after specimen damage.
Fig. 13.

Macroscopic cracks produced during the destruction of fractured sandstone.
Fig. 14.

Schematic diagram of shear crack fracture surface.
Therefore, according to the experimental results and numerical calculation results, three main types of crack merging between adjacent cracks were identified: I. Merging of wing cracks (tension cracks) with fracture tips, II. Merging of through-bridge shear cracks with fracture tips, and III. Merging of through-bridge shear cracks and wing cracks with fracture tips, as shown in Table 3.
Table 3.
Summary of the types of coalescence observed in this study.
| Coalescence type | I | II | III |
|---|---|---|---|
| Pattern | 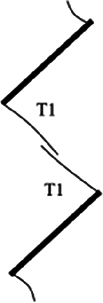 |
 |
(a)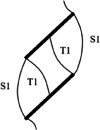 (b) (b)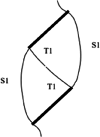 (c) (c)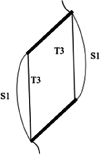
|
| Characteristic | Coalescence due to tension cracks | Coalescence due to shear cracks | Coalescence due to tension cracks and shear cracks |
Destruction model
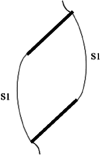
The damage schematic for each specimen is presented in Table 4. Although crack coalescence between two prefabricated fracture tips was mainly caused by tension crack T and shear crack S, the crack coalescence mode varied with the number and spacing of fracture. For the double-fracture specimens, the crack coalescence mode varies with the change of fracture spacing. The wing crack T1 and through-bridge shear crack S1 are the main coalescence mode between the two prefabricated fractures in Specimen B-I-1, and the main shear crack is derived from the middle of through-bridge shear crack S1. In Specimen B-II-2, tension crack T3 and through-bridge shear crack S1 are used to penetrate the end of the prefabricated fractures, respectively, and the main shear crack is a shear crack derived from the middle of the through-bridge shear crack S1 expanding toward the side of the specimen. The main connection mode between the prefabricated fractures of specimen B-III-1 is wing crack T1 and bridge shear crack S1. The two wing cracks T1 are directly connected, and the main shear crack is derived from the middle of the bridge shear crack S1. The wing crack T1 is the main penetration mode between the prefabricated fractures of specimen B-IV-3, and the main shear crack initiates and propagates from the end of the prefabricated fracture.
Table 4.
Failure mode of specimen.
| B-I-1 | B-II-2 | B-III-1 | B-IV-3 |
|---|---|---|---|
 |
 |
 |
 |
 |
 |
 |
 |
| C-I-3 | C-II-3 | C-III-2 | C-IV-1 |
 |
 |
 |
 |
 |
 |
 |
 |
In contrast, the crack coalescence mode of the three-fracture specimen is more complex. In Specimen C-I-3, the main coalescence type between adjacent fractures is wing crack T1 and through-bridge shear crack S1. The main shear crack originates from the fracture tip at the upper end and extends to the outside of the specimen. Specimen C-II-3 was penetrated by a combination of wing crack T1, tension crack T3, and through-bridge shear crack S1 at the upper center fracture tip, and by through-bridge shear crack S1 at the lower center fracture tip. Specimen C-III-2 was penetrated at the upper center crack end by a combination of wing crack T1 and through-bridge shear crack S1 mode, and at the lower center crack end by a combination of shear crack T1 mode. Specimen C-IV-1 has a similar crack coalescence type as specimen C-III-2.
In addition, different degrees of stripped damage can be observed on all specimens, and plate crack damage occurs in individual specimens. Among them, the stripped damage mainly occurs in the middle position of the through-bridge shear crack S1, while the plate crack damage mostly occurs in the positions on both sides of the specimens in the prefabricated fracture type I coalescence type, such as the specimens B-III-1 and C-III-2.
In view of the above analysis, Table 5 summarizes the effect on the type of damage as the number of fractures as well as the fracture spacing changes are summarized. From the results of the table, it can be seen that due to the increase in the number of fractures the type of aggregation in the triple-fracture specimens is more complicated than in the double-fracture specimens. The crack coalescence type of the triple-fracture are all two types and each contains the crack aggregation type of the double-fracture specimens with the same spacing. This indicates that the prefabricated fracture spacing mainly affects the change of the basic crack coalescence type, while the increase in the number of prefabricated fractures causes the diversification of coalescence type but does not change the basic coalescence type.
Table 5.
Summary of coalescence types of green sandstone specimens with different number and spacing of cracks.
| B-I | B-II | B-III | B-IV | C-I | C-II | C-III | C-IV | |
|---|---|---|---|---|---|---|---|---|
| Type I | √ | √ | √ | √ | ||||
| Type II (a) | √ | |||||||
| Type III (a) | √ | √ | ||||||
| Type III (b) | √ | √ | √ | |||||
| Type III (c) | √ | √ |
Internal stress evolution
Stress distribution is crucial for the analysis of crack evolution mechanism analysis of rock materials50. The use of an averaging approach allows for transition analysis from the micro-scale to the continuum. The average stress σij in the material volume V is defined as:
 |
11 |
The numerical results of two groups of B-III and C-IV specimens were selected for analysis. Figure 15 demonstrates the stress curves obtained from numerical calculations as well as the variation curves of crack number, and Fig. 16 shows the crack evolution process of the sandstone containing double-fracture spacing of 30 mm. In Fig. 16, the yellow circle indicates the measuring circle, the blue line indicates the tension crack, and the red line indicates the shear crack. Where the radius of the measuring circle is defined as 1.5 mm, which contain approximately 22–25 particles. The variation of stress detected by the measuring circle with axial strain as well as crack extension at each major location is given in Fig. 16, respectively.
Fig. 15.

The relationship between the axial stress-axial strain curve and the number of microcracks(B-III).
Fig. 16.

Crack evolution process of sandstone(B-III) .
In Fig. 17, positive values indicate tensile stress in that direction, while negative values represent compressive stress in that direction. When the specimen is loaded to point a (ε1 = 8.4 × 10⁻⁴, σ1 = 18.24 MPa), the wing crack 1 initially began to form at the outer end of the prefabricated fractures. At this point, the horizontal tensile stress, as measured by the measuring circle ①, reached its maximum value before gradually decreasing to zero within a short period of time. Additionally, the vertical compressive stress is found to be smaller than the horizontal stress (Fig. 17a). The wing crack initiation at the inner end of the prefabricated fracture is slightly later than the former, and the variant rule of the horizontal tensile stresses measured by measuring circle ② is closer to that of measuring circle ① as a whole, and only slightly lags behind the results of measuring circle ①. Before the initial crack expansion, the vertical compressive stress at measuring circle ② increases gradually, and the horizontal tensile stress increases slowly, while the vertical compressive stress at measuring circle ① is almost zero, and the tensile stress increases faster.
Fig. 17.

Measuring circle ① ~ ⑧ stress variation with axial strain (B-III).
As the cracks at the measured circle ① and ② continue to expand the axial deformation increases, and the compressive stress at the two measured points gradually increases, in which the compressive stress at the inner end of the prefabricated fracture is significantly higher than that at the outer end of the prefabricated fracture. At point b ( ε1 = 3.56 × 10⁻³, σ1 = 76.68 MPa ), the wing crack 1 propagates to the measuring circle ③, the horizontal stress at this place suddenly changes from compressive stress to tensile stress and reaches the peak point very quickly, and accompanied by the increase of the horizontal tensile stress, the vertical compressive stress decreases slightly. At the same time, crack 2 and crack 3 start to expand from the center of the line connecting the ends of the two prefabricated fracture, and at first the initiating crack there is a tensile crack, which corresponds to the horizontal tensile stresses at the measuring circles ⑤ and ⑦, which suddenly decrease but do not reach zero, and the vertical compressive stresses are slightly increased. When reaching point c (ε1 = 5.49 × 10⁻³, σ1 = 103.13 MPa), crack 1 expands and reaches the measuring circle ④, where the horizontal tensile stress suddenly increases and reaches the peak soon, and along with the increase of the horizontal tensile stress, the vertical compressive stress shows a huge stress drop, which indicates that the wing crack is almost completely penetrated the specimen. The sudden increase in the vertical stress of the measured circles ⑥ and ⑦ can be used as strong evidence, while the compressive stress at the center of the crack suddenly decreases. At this time, crack 2 and crack 3 suddenly begin to expand to both ends of the prefabricated fracture in the form of tensile shear crack and form an arc shape. The middle part of the prefabricated fracture is completely split, and the tensile and compressive stresses at the measuring circles ⑦ and ⑧ are all reduced to around 0.
When the axial stress decreases to point d ( ε1 = 6.17 × 10⁻³, σ1 = 104.13MPa ), near-field crack 4 extends to the far-field from the location of crack 2 initiation. At the same time, the far-field crack 5 extends and diffuses along the vertical direction, and the vertical stress level of each monitoring point has been greatly reduced. The main bearing structure is completely cracked. At this time, the main bearing structure is completely rupture, which also indicates that the specimen has reached its ultimate load and started to progress towards irreversible damage. When the axial stress decreases to point e (ε1 = 6.88 × 10⁻³, σ1 = 73.01 MPa), crack 4 and crack 5 continue to extend, and the specimen has already undergone a permanent destabilization damage.
Multifractal signal characteristics of acoustic emission
Multiple fractals are proposed on the basis of single fractals, which can identify the subtle gaps between data more precisely51,52. In this study, the multiple fractal concept of the box counting method is used to analyze the acoustic emission waveform characteristics of the sandstone specimens containing parallel fractures during the compression process, the time series is regarded as a dataset {Ti}, and by the same time spacing n the time series can be divided into N subsets, and the obtained dataset {Ti} will be processed by the difference process, to obtain the number of the 2 mth power of the number of segmented sets N, where m is a positive integer. At this point the scale n can be defined n = Ti2-m (m = 0,1,2,…) , the probability density of the ith partition set when the scale is n is denoted as:
 |
12 |
where vi(n) is the ith segmented data cumulative value and i is a positive integer.
This results in a set of probability distribution functions characterized by multiple fractals, and the probability measure Pi(n) is expressed in terms of a composite power-exponential relationship with scale n:
 |
13 |
where αi is the Coarse-Hoider index or singularity strength, which represents the density of the data distribution in the ith segmentation set.
It is worth noting that different sets of partitions are likely to have the same singular strength since this way. According to the definition of the box dimension method, the number of probabilistic subsets with the same singular strength at the n scale is represented by Nα(n), which can be expressed as:
 |
14 |
where f (α) is the fractal dimension of α.
Define the allocation function as:
 |
15 |
where, τ(q) is the quality function. q is the weighting factor, the value range is [-∞, + ∞], usually the larger the value of q the better the effect, however, in order to simplify the calculation, it is generally limited to a fixed range, take the variation interval of q as [-50, + 50].
The mass function τ (q) can be expressed as
 |
16 |
The relationship between α , f(α), and τ(q) can be obtained from based on the legendre transformation.
 |
17 |
 |
18 |
The spectral widths Δα and Δf(α) are defined as
 |
19 |
 |
20 |
According to the calculation formula of the multifractal spectrum, the multifractal calculation program is written by Matlab software, and the multifractal spectrum of the characteristic time series of the acoustic emission waveforms of the specimen B-I-1 in the compression process is obtained as shown in Fig. 18(b). It can be seen that Δf (α) all change with the change of Δα indicating that the damage process of the green sandstone specimen has self-similarity.
Fig. 18.

Sample 2–10 full stress curve and multifractal spectrum at key feature points (a)Specimen B-I-1 stress curve (b)Multifractal spectrum at key feature points of samples B-I-1.
Since the Δf (α) and Δα of different specimens have similar patterns, the full stress curves of specimen B-I-1 and the multifractal spectra of the acoustic emission at each characteristic point during the crack extension process are given in Fig. 18, and the time-varying characteristics of the full range of the dynamic time-varying characteristics of Δf (α) and Δα are shown in Fig. 19. From Fig. 19(b), it is easy to see that the acoustic emission signals of sandstone with parallel fractures have obvious multiple fractal characteristics throughout the loading process, and the acoustic emission signals mainly come from the closure of the original fractures in the specimen at the beginning of the loading process. At this time, Δα is in a small fluctuation of about -0.6 to 0.0, which shows that the degree of fractal inhomogeneity is relatively low, and the fluctuation of the signals is stable. And Δf (α) > 0 (about 0.5 to 1), indicating that the large-scale rupture is less mainly dominated by small-scale compression-tight rupture, in the process Δf (α) and Δα are relatively smooth although small fluctuations but the overall change is not large, the acoustic emission signal nonlinear multifractal characteristics are not obvious. When loading reaches the ab stage, the specimen gradually enters the linear elastic stage. Due to the stress concentration at the end of the prefabricated fracture, the tensile cracks gradually sprouted and expanded, resulting in a small decrease in Δα and a small increase in Δf (α). The signal fluctuation remains stable, and the crack expansion inside the specimen does not cause a large-scale rupture. When loading reaches the bc stage, the specimen enters the late stage of linear elasticity, and Δα begins to show a significant enhancement while Δf (α) shows a significant decrease, indicating that the rupture exhibits multiscale nature and complexity. Into the cd stage, the specimen enters into the critical state of destruction, the change of Δα and Δf (α) is exactly the opposite of the change rule of the bc stage. When entering the cd stage, the specimen enters the critical damage state, the changes of Δα and Δf (α) are opposite to those of the bc stage, and the specimen enters the stable crack expansion stage again, which is characterized by the sporadic distribution of microcracks in the specimen, but not expanding into a nucleus. In the de stage, a large number of cracks expand and nucleate into a macroscopic main rupture zone, and both Δf (α) and Δα show a sudden jump phenomenon, which indicates that the nonlinear characteristics of the specimen and the rupture scale reach the maximum value in a very short time when the specimen is destabilized, and this is a good reflection of the instantaneous destabilizing damage characteristics of hard rock. It can be seen that the dynamic changes of Δf (α) and Δα can be used not only to explain the fracture mechanism of rocks from the fine-scale supervision but also as the short-term precursor information of the destabilizing damage of fracture-containing hard rocks.
Fig. 19.

Multifractal time-varying evolution diagram of acoustic emission (a) overall schematic diagram (b) Local diagram.
Discussion
Effect of number and spacing of fractures on mechanical parameters and failure characteristics of specimens
To further analyze the influence of the number and spacing of parallel cleavage on the mechanical properties of the specimens, numerical simulations were carried out for different spacing double-fracture specimens and different numbers of specimens with the same spacing (d = 10mm), and the results are shown in Table 6.
Table 6.
Damage model simulation results.

As can be seen from Table 6, for the double-fracture specimens, with the increase of the fracture spacing, the main shear crack initiation position of the specimen is shifted from the middle position of the through-bridge shear crack to the tip of the fracture, and the cracks between the fracture are gradually shifted from outward bending to inward bending, in which the fracture expansion pattern of the specimens from 2–10 is similar to that of the single-fracture specimens. And the fracture expansion pattern of the rest of the specimens is much more different from that of the single-fracture specimens. For the multi-fracture specimens, with the increase of the number of fractures, the crack initiation position of the main shear crack is shifted from the specimen centerline to the upper and lower ends of the specimen. The difference between the crack extension pattern and that of the single-fracture specimens gradually becomes larger.
The effect of the number and spacing of fractures on strength, deformation and elastic modulus is shown in Fig. 20, where the red dashed line represents data from a single fracture specimen. It can be seen that the elastic modulus of the multi-fracture specimens is lower than that of the single-fracture specimens. As the number of fractures increases, the elastic modulus of the sample gradually decreases, and as the fracture spacing increases, the elastic modulus generally shows a trend of decreasing first and then increasing. It shows that the number of fractures has a higher influence on the elastic modulus of the sample than the fracture spacing, which is related to the volume of the effective bearing structure of the sample. The peak strain of multi-fracture specimens is almost higher than that of single-crack specimens ( except for specimen 2–40 ). On the whole, the peak strain of multi-fracture specimens is slightly higher than that of double-fracture specimens. Moreover, the larger the number of fractures, the greater the difference, and the peak strain decreases first and then increases with the increase of fracture spacing. The peak strength of multi-fracture and double-fracture specimens is generally smaller than that of single-fracture specimens. When D ≤ 40mm, the influence of the number of fractures on the peak strength of the sample can be almost ignored. At this time, the fracture spacing D dominates the peak strength of the sample. When D ≥ 50mm, the number and spacing of fractures affect the peak strength of the sample, and the peak strength of the multi-fracture sample is generally lower than that of the double-fracture sample.
Fig. 20.

Schematic diagram of mechanical parameters.
Quantitative evaluation theory of specimen strength based on column structure
The column structure theory is introduced to establish a mechanical model to further explain the strength uncertainty characteristics of samples with different fracture spacing and fracture number. Due to the extended wing cracks at the end of the prefabricated fractures and the through-bridge shear cracks, the specimen is divided into two “columns” and an intermediate “isolator” structure. In fact, the final compression structure is mainly carried out by the “columns” on both sides of the specimen. The final compressive structure is mainly borne by the “columns” on both sides. As shown in Fig. 21(a), where α = cosβ. The final compressive structure is mainly borne by the two side “column”, as shown in Fig. 21(a). For ease of calculation, the two side columns are approximated and equated as vertical columns of width t ≈ w/2 and length b = 2(l + αt), bending outward under axial load (the narrower the more likely to bend). As shown in Fig. 21(b).
Fig. 21.

Schematic diagram of the wing crack and through-bridge shear crack splitting the specimen into vertical “column”.
When a column of width t and length b is subjected to axial stress σa and bending moment M, the maximum surface stress σy of the column can be expressed as:
 |
21 |
Due to the occurrence of "through-bridge shear cracks" in the parallel fracture specimen, which narrows the narrowest width of the assumed column structure, the maximum axial stress can be expressed as:
 |
22 |
where Δ is the length of the local width reduction of the “column” due to through-bridge shear crack penetration and r is the half-length of the prefabricated fracture.
At the narrowest part of the column, the local bending moment can be expressed as:
 |
23 |
From Eqs. (21)-(23), the axial stress required for plastic deformation to begin at the narrowest section of the column can be calculated as:
 |
24 |
From Eq. (24), it can be seen that the conditions affecting the onset of plastic deformation at the narrow section of the column are mainly influenced by a total of four factors, t, α, r and Δ. Among them, t is positively correlated with σ1, and α, r and Δ are negatively correlated with σ1.
Defining the axial stress σ1 and the maximum surface stress σy as the stress ratio Kd, Eq. (25) is obtained.
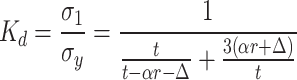 |
25 |
If respectively make t = 25mm and α = 45°, r take 1mm, 3mm, 5mm and 7mm can obtain the stress ratio Kd with Δ change rule curve, as shown in Fig. 22.
Fig. 22.

The variation curve of stress ratio Kd with Δ.
It can be seen from the diagram that when the maximum surface stress σy that the column can withstand is constant, the larger the Δ, the smaller the stress ratio Kd, that is, the smaller the strength σ1 of the sample. It indicates that the localized narrowing of the column caused by through-bridge shear cracks is the main reason for reducing the strength of the specimen. When the crack length 2r is smaller, the effect of Δ on the stress ratio Kd is more significant. By comparing the values of stress ratio Kd at different fracture spacings, it is possible to theoretically compare the changes in the strength values of the specimens due to the reduced length Δ at different fracture spacings.
For the parallel fracture specimens containing specific dip angles and lengths in this study t, α and r remain constant, and differences in the local width of the column occur when the number and spacing of the fractures differ. When only the fracture spacing is changed, the numerical simulation results of fracture evolution of specimens with double-fracture are drawn in Fig. 23. It is found that as the spacing D increases from 10 to 80 mm, the trend of Δ change is roughly increasing and then decreasing (up to 0 mm).The stress σ1 corresponding to the beginning of plastic strain at the narrowest part of the beam decreases first and then increases, which is consistent with the experimental and numerical results. Where, Δ is the largest due to the maximum arc formed by the through-bridge shear crack penetration when D = 30 mm, resulting in the smallest value of axial stress σ1. The value of σ1 corresponding to a Δ of 0 is the largest when D = 60 mm because the through-bridge shear crack is not penetrated. It is worth noting that Δ is also 0 at D = 70 and 80 mm, and the strength of the specimen is less than that at D = 60 mm. This may be due to the prefabricated fracture too close to the end of the sample so that the sample is divided into several blocks earlier, resulting in a decrease in the overall strength of the sample. Given this, it is shown that the theory of quantitative evaluation of specimen strength based on column structure in this study can respond to the mechanism of the emergence of through-bridge shear cracks on specimen strength during compression of specimens containing parallel fractures.
Fig. 23.

Schematic of the effect of through-bridge shear cracking on the local narrowest width of the columns.
In addition, from the numerical calculations in Fig. 20, it can be seen that there is not much difference between the strength of the multi-fracture specimen and the strength of the double-fracture specimen when the fracture spacing D is constant. This suggests that changes in the number of fractures have little effect on the length of the column’s localized width reduction. It can be seen that the fracture spacing D is the main factor affecting the type of crack extension as well as the overall strength of the specimen, while the adjacent fracture spacing d affects the type of crack extension as well as the overall strength of the specimen to a small extent.
Interfeeding mechanism of tension-shear cracks in the specimen damage process
Figure 24 shows the compressive stress distribution law under four characteristic stresses, and Fig. 25 gives the local compressive stress evolution law of the specimen in the deformation damage process, the lateral deformation law of the specimen, and the changing law of the shear-tension crack ratio, respectively. The shear-tension crack ratio λ is calculated as follows:
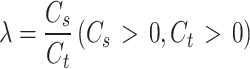 |
26 |
where Cs and Ct are the number of shear cracks and tension cracks, respectively.
Fig. 24.

Compressive stress distribution of specimen at 4 characteristic stress points.
Fig. 25.

Schematic diagram of the variation patterns of compressive stress, lateral deformation and shear-tension crack ratio.
In Fig. 24, the black area is the main concentration of compressive stress, which is also the expansion area of through-bridge shear cracks and main shear cracks, and the blue area is the concentration of compressive stress in the equivalent “column” structure. As can be seen from the figure, the compressive stress concentration region between the fractures with increasing axial load remains unchanged before the peak value, and the shape of the region is approximately the same as the shape of the through-bridge shear crack in Fig. 3, which indicates the reasonableness of the theoretical analysis results. With the penetration of the wing crack and the formation of through-bridge shear cracks, the main compressive stress concentration area of the specimen is shifted to both sides of the specimen to form a “column” structure, as shown in the blue area in the figure. This means that the “column” structure is the main load-bearing structure for the final compression of the specimen, and its dimensions determine the final peak strength of the specimen. This once again confirms the soundness of the theory of quantitative evaluation of specimen strength based on column structure.
In Fig. 25(a), the vertical stresses at monitoring points 1 and 2 suddenly increase with the expansion of through-bridge shear cracks and wing cracks, while the lateral deformation of the specimen is also significantly elevated. It is shown that the increase of transverse strain space enhances the stress intensity factor at the end of the wing crack and provides conditions for the continued expansion of the wing crack. After that, the slope of the vertical stress growth curve is significantly higher than before. It shows that the propagation of wing cracks aggravates the stress growth rate in the compressive stress concentration area, which provides a more intense stress concentration environment for the generation and propagation of subsequent main shear cracks. It can be seen that there is a mutual excitation mechanism between tensile cracks and shear cracks.
In Fig. 25(b), each stress decrease in the test curve corresponds to a sudden increase in the number of cracks and the shear-tension crack ratio, and the two rules of change are basically the same. This indicates that the increase of the proportion of shear cracks in the sample is the main reason for the significant macroscopic failure of the sample. In the specimen deformation damage process shear crack ratio λ law can be divided into stable stage, transition stage and mutation stage. In the stable stage, there is a relatively steady increase in tension-shear cracks. In the transition stage, the percentage of shear cracks grows gradually. In the mutation stage, shear cracks grow significantly. These three stages always occur in sequence before and after each stress drop. The different stages of change in the shear-tension crack ratio before and after the two stress drops are given in Fig. 25(b). It can be seen that the evolution process of cracks is gradually carried out under the mutual excitation of two types of cracks. Due to the different defect conditions within the specimen, the final damage may need to undergo several mutual excitation effects before it is completed.
Conclusions
A series of uniaxial compression tests and numerical simulation tests were carried out on parallel-fractured sandstone specimens to investigate the effects of fracture number and spacing on fracture aggregation, damage characteristics, and mechanical parameters. Some of the main conclusions are listed below.
Prefabricated fractures have a weakening effect on the uniaxial compressive strength and elastic modulus of the specimens. Except for the obvious correlation between the number of fractures and the elastic modulus, there is no obvious correlation between the number and spacing of fractures and the peak strength of the specimens. And there is no obvious correlation between the number of fractures and the peak strength.
The crack aggregates of the triple-fracture specimens are more complex and each contains the same type of crack aggregates of the double-fracture specimens with the same spacing. This suggests that the prefabricated fracture spacing mainly influences the variation of crack aggregation types, whereas the number of prefabricated fractures influences the diversity of aggregation types but does not affect their basic aggregation types. In addition, spalling damage is common in the specimens while plate cracking damage occurs occasionally, in which spalling damage mainly occurs in the middle of the through-bridge shear cracks, and plate cracking damage is mostly related to the main shear cracks and occurs on both sides of the specimens.
The through-bridge shear crack is formed by the confluence of the anti-wing crack at the end of the adjacent prefabricated fracture and the secondary shear crack. It is easier to expand and penetrate when the crack spacing is small, and the crack gradually disappears as the fracture spacing increases. The appearance of through-bridge shear cracks changed the damage process and crack evolution characteristics of the specimen. With the increase of prefabricated fracture spacing, the main shear crack initiation location gradually shifted from the middle of the through-bridge shear cracks to the end of the prefabricated fractures, and eventually affected the compressive strength of the specimen by changing the local narrowest width of the “column” structure.
There is a mutual excitation relationship between the tensile crack and the shear crack in the compression process of the specimen with parallel fractures. On the one hand, the expansion of tensile cracks promotes the concentration of compressive stress, which accelerates the generation and expansion of shear cracks. On the other hand, the extension of shear crack can provide transverse strain space for the extension of tensile crack to increase the stress intensity factor at the end of the wing crack and thus promote the extension of tensile crack. Each sudden increase of the shear-tension crack ratio λ predicts a larger-scale damage of the specimen, indicating that the large-scale extension of the shear crack is the main factor leading to the final damage of the specimen.
The acoustic emission multifractal dimension takes into account the internal damage timing characteristics of the rock, which can more finely delineate the complexity of the signal. In the pre-peak stage, with the increase of axial stress, the acoustic emission ring counts and the fractal spectral width Δα show an overall increasing trend, while the multifractal parameter Δf (α) decreases gradually. The fractal spectral width Δα shows a sudden increase in the fluctuation process near the peak stress, and the multifractal parameter Δf (α) shows a sudden decrease in the fluctuation process. The dynamic time-varying trend of the acoustic emission signals can be used as a warning signal for power disaster.
Acknowledgements
This research has received funding from the National Natural Science Foundation of China (Grant No. 51774173) and the discipline innovation team of Liaoning Technical University (Grant No. LNTU20TD08).
Author contributions
FengPu.Liu. and BaoXin. Jia. wrote the main manuscript text . ZhiYang. Zhou. prepared Figs. 1–26. HaiYang. Xie. prepared tables 1–5. All authors reviewed the manuscript.
Funding
National Natural Science Foundation of China,51774173,Discipline innovation team of Liaoning Technical University,LNTU20TD08,Liaoning Revitalization Talents Program,XLYC2007163.
Data availability
All the generated and analyzed data are available from the corresponding author upon request.
Declaration
Competing interests
The authors declare no competing interests.
Footnotes
Publisher’s note
Springer Nature remains neutral with regard to jurisdictional claims in published maps and institutional affiliations.
References
- 1.Zhao, C., Niu, J., Zhao, Q., Zhao, C. & Zhou, Y. Failure characteristics of rock-like materials with single flaws under uniaxial compression. Bull. Eng. Geol. Environ.78(1), 593–603 (2019). [Google Scholar]
- 2.Ma, C., Li, T., Zhang, H., Jiang, Y. & Song, T. A method for numerical simulation based on microseismic information and the interpretation of hard rock fracture. J. Appl. Geophys.164, 214–224 (2019). [Google Scholar]
- 3.Chen, J. R., Zhou, C. T., Zhou, T., Zhu, J. B. & Xie, H. P. Experimental study on strain evolution and failure behavior of sandstone containing a single pre-existing faw under compressive-shear loading. Chin. J. Rock Mech. Eng.42(07), 1743–1758 (2023a). [Google Scholar]
- 4.Haeri, H., Shahriar, K., Marji, M. F. & Moarefvand, P. Cracks coalescence mechanism and cracks propagation paths in rock-like specimens containing pre-existing random cracks under compression. J. Cent. South Univ.21, 2404–2414 (2014). [Google Scholar]
- 5.Xu, J. et al. Simulation of compression-induced shear-mode cracks in rocks based on experimental investigations performed on gypsum specimens. Bull. Eng. Geol. Env.79(3), 1–11 (2020). [Google Scholar]
- 6.Li, X. F. et al. Investigating the crack initiation and propagation mechanism in brittle rocks using grain-based fnitediscrete element method. Int. J. Rock Mech. Min. Sci.127, 104219 (2020). [Google Scholar]
- 7.Du, X., Liu, W. & Huang, B. Experimental and Simulation Studies on the Effect of Rock Bridges on Rock Failure. Geotech. Geol. Eng.42, 6301–6314 (2024). [Google Scholar]
- 8.Li, W. S. et al. Strength and failure characteristics of coal measures mudstone specimens containing a prefabricated flaw under true triaxial tests. J. Cent. South Univ.31, 196–209 (2024). [Google Scholar]
- 9.Aliabadian, Z., Sharafsafa, M. Application of DEM for modelling crack initiation and propagation in rock masses with open and closed faws. In: ARMA US rock mechanics/geomechanics symposium. ARMA (2014).
- 10.Yang, S. Q. & Jing, H. W. Strength failure and crack coalescence behavior of brittle sandstone specimens containing a single fssure under uniaxial compression. Int. J. Fract.168(2), 227–250 (2011). [Google Scholar]
- 11.Miao, S. et al. Fracture analysis of sandstone with a single filled flaw under uniaxial compression. Eng. Fract. Mech.204, 319 (2018). [Google Scholar]
- 12.Zhao, Z. & Zhou, D. Mechanical properties and failure modes of rock samples with grout-infilled flaws: A particle mechanics modeling. J. Nat. Gas Sci. Eng.34, 702–715 (2016). [Google Scholar]
- 13.Xu, G. et al. Propagation and coalescence of two infilled parallel fractures in shale: Laboratory testing and DEM simulations. Granul. Matter24(2), 1–30 (2022). [Google Scholar]
- 14.Yang, S. Q. et al. An experimental investigation of failure mechanical behavior in cylindrical granite specimens containing two non-coplanar open fractures under different confining pressures. J. Cent. South Univ.29, 1578–1596 (2022). [Google Scholar]
- 15.Huang, Y. H. et al. Fracture behavior of cylindrical sandstone specimens with two pre-existing flaws: Experimental investigation and PFC3D simulation. Geosci. J.26, 151–165 (2022). [Google Scholar]
- 16.Pang, J. et al. Experimental study of the effect of crack distribution on the failure mechanism of sandstone specimens based on inclination angles and number of parallel flaws. Geomech. Geophys. Geo-energ. Geo-resour.10, 63 (2024). [Google Scholar]
- 17.Feng, X. T., Ding, W. X. & Zhang, D. X. Multi-crack interaction in limestone subject to stress and flow of chemical solutions. Int. J. Rock Mech. Min. Sci.46(1), 159–171 (2009). [Google Scholar]
- 18.Yang, S. Q., Yang, D. S., Jing, H. W., Li, Y. H. & Wang, S. Y. An experimental study of the fracture coalescence behaviour of brittle sandstone specimens containing three fractures. Rock Mech. Rock. Eng.45(4), 563–582 (2012). [Google Scholar]
- 19.Zhang, G. et al. Fracture Coalescence Process Between Two Pre-existing Flaws in Granite Based on Coupling Exterior and Interior Observation Techniques. Rock Mech. Rock Eng.56, 5543–5566 (2023). [Google Scholar]
- 20.Wong, L. N. Y. & Einstein, H. H. Crack coalescence in molded gypsum and Carrara marble: Part I: macroscopic observations. Rock Mech. Rock. Eng.42(3), 475–511 (2009). [Google Scholar]
- 21.Bobet, A. & Einstein, H. H. Fracture coalescence in rock-type materials under uniaxial and biaxial compression. Int. J. Rock Mech. Min. Sci.35, 863–888 (1998). [Google Scholar]
- 22.Lian, S. et al. Investigation of the mechanical behavior of rock-like material with two flaws subjected to biaxial compression. Sci. Rep.14, 14136 (2024). [DOI] [PMC free article] [PubMed] [Google Scholar]
- 23.Nemat-Nasser, S. & Horii, H. Compression-induced nonplanar crack extension with application to splitting, exfoliation, and rockburst. J. Geophys. Res. Solid Earth87, 6805–6821 (1982). [Google Scholar]
- 24.Miao, S. et al. The effect of flaw geometry and infilling on crack initiation, propagation, and coalescence of a parallel flaw pair in marble. Geomech. Geophys. Geo-energ. Geo-resour.9, 4 (2023). [Google Scholar]
- 25.Zhang, X. P. & Wong, L. N. Y. Crack initiation, propagation and coalescence in rocklike material containing two flaws: A numerical study based on bonded-particle model approach. Rock Mech. Rock. Eng.46(5), 1001–1021 (2013). [Google Scholar]
- 26.Zhou, X. P., Cheng, H. & Feng, Y. F. An experimental study of crack coalescence behaviour in rock-like materials containing multiple faws under uniaxial compression. Rock Mech. Rock Eng.47, 1961–1986 (2013). [Google Scholar]
- 27.Afolagboye, L. O., He, J. & Wang, S. Experimental study on cracking behaviour of moulded gypsum containing two non-parallel overlapping faws under uniaxial compression. Acta Mech. Sin.33, 394–405 (2017). [Google Scholar]
- 28.Zheng, M. et al. Discontinuous fracture behaviors and constitutive model of sandstone specimens containing non-parallel prefabricated fractures under uniaxial compression. Theor. Appl. Fract. Mech.131, 104373 (2024). [Google Scholar]
- 29.Zhang, X. P. et al. Crack coalescence between two non-parallel flaws in rock-like material under uniaxial compression. Eng. Geol.199, 74–90 (2015). [Google Scholar]
- 30.Zhou, X. P., Lian, Y. J., Wong, L. N. Y. & Berto, F. Understanding the fracture behavior of brittle and ductile multi-fawed rocks by niaxial loading by digital image correlation. Eng. Fract. Mech.199, 438–460 (2018). [Google Scholar]
- 31.Wang, S.Y., Sloan, S.W., Sheng, D.C., Tang, C.A. 3D numerical analysis of crack propagation of heterogeneous notched rock under uniaxial tension. Tectonophysics. 677–678 (2016).
- 32.Chen, F., Sun, Z. & Xu, J. Mode I fracture analysis of the double edge cracked Brazilian disk using a weight function method Int. J. Rock Mech. Min. Sci.38(3), 475–479 (2001). [Google Scholar]
- 33.Ouinas, D., Bouiadjra, B. B., Serier, B., Benderdouche, N. & Ouinas, A. Numerical analysis of Brazilian bioceramic discs under diametrical compression loading Comput. Mater. Sci.45(2), 443–448 (2009). [Google Scholar]
- 34.Lee, H. & Jeon, S. An experimental and numerical study of fracture coalescence in pre-cracked specimens under uniaxial compression Int. J. Solids Struct.48(6), 979–999 (2011). [Google Scholar]
- 35.Wu, Z. & Wong, L. N. Y. Frictional crack initiation and propagation analysis using the numerical manifold method Comput. Geotech.39, 38–53 (2012). [Google Scholar]
- 36.Li, H. & Wong, L. N. Y. Influence of flaw inclination angle and loading condition on crack initiation and propagation Int. J. Solids Struct.49(18), 2482–2499 (2012). [Google Scholar]
- 37.Fu, J. W., Chen, K., Zhu, W. S., Zhang, X. Z. & Li, X. J. Progressive failure of new modelling material with a single internal crack under biaxial compression and the 3-D numerical simulation Eng. Fract. Mech.165, 140–152 (2016). [Google Scholar]
- 38.Ding, X. L., Jiao, Y. Y. & Zhao, J. Simulation of failure process of jointed rock. J. Centr. South Univ.15(6), 888–894 (2008). [Google Scholar]
- 39.Gui, Y. L., Zhao, Z. Y., Zhang, C. S. & Ma, S. Q. Numerical investigation of the opening effect on the mechanical behaviours in rocks under uniaxial loading using hybrid continuum-discrete element method Comput. Geotech.90, 55–72 (2017). [Google Scholar]
- 40.Zhou, X. P., Gu, X. B. & Wang, Y. T. Numerical simulations of propagation, bifurcation and coalescence of cracks in Rocks Int. J. Rock Mech. Min. Sci.80, 241–254 (2015). [Google Scholar]
- 41.Zhang, X. P. & Wong, L. N. Y. Crack initiation, propagation and coalescence in rock-like material containing two flaws: A numerical study based on bonded-particle model approach. Rock Mech. Rock Eng.46(5), 1001–1021 (2012). [Google Scholar]
- 42.Yang, S. Q., Huang, Y. H., Jing, H. W. & Liu, X. R. Discrete element modeling on fracture coalescence behavior of red sandstone containing two unparallel fractures under uniaxial compression. Eng. Geol.178, 28–48 (2014). [Google Scholar]
- 43.Liu, Y., Dai, F., Zhao, T. & Xu, N. W. Numerical investigation of the dynamic properties of intermittent jointed rock models subjected to cyclic uniaxial compression. Rock Mech. Rock Eng.50(1), 89–112 (2017). [Google Scholar]
- 44.Huang, Y. H., Yang, S. Q., Ranjith, P. G. & Zhao, J. Strength failure behavior and crack evolution mechanism of granite containing pre-existing non-coplanar holes: experimental study and particle flow modeling. Comput. Geotech.88, 182–198 (2017). [Google Scholar]
- 45.Liu, S., Yang, X. & Wu, J. Crack evolution and fractal characteristics of fractured red sandstone based on acoustic emission parameters. Sci. Rep.14, 24826 (2024). [DOI] [PMC free article] [PubMed] [Google Scholar]
- 46.Martin, Derek, C. The strength of massive Lac du Bonnet granite around underground openings. Dissertation Abstracts International. (1993).
- 47.Wang, Z., Li, Y., Cai, W., et al. Crack propagation process and acoustic emission characteristics of rock-like specimens with double parallel flaws under uniaxial compression. Theoretical and Applied Fracture Mechanics. 102983 (2021).
- 48.Zhang, X. P. & Wong, L. N. Y. Cracking processes in rock-like material containing a single flaw under uniaxialcompression: A numerical study based on parallel bonded-particle model approach Rock Mech. Rock Eng.45(5), 711–737 (2012). [Google Scholar]
- 49.Zhang, R., Zhao, C., Yang, C.Y., Xing, J.Q., Morita, C. A comprehensive study of single-flawed granite hydraulically fracturing with laboratoryexperiments and flat-jointed bonded particle modeling. Comput. Geotech. 140 (2021).
- 50.Itasca Consulting Group, Inc. PFC2D, v. 3.1. Minneapolis, MN; 2004.
- 51.Zhou, L. T., Liu, Z. K. & Gong, Y. Z. Analysis of horizontal displacement fluctuation of concrete gravity dam based on multifractal. J. Hohai Univ.: Nat. Sci.50(1), 76–84 (2022). [Google Scholar]
- 52.Chen, D. et al. Study on the fracture and the law of temporal-spatial evolution of acoustic emission of gypsum and sandstone specimens. J. China Coal Soc.43(7), 1902–1909 (2018). [Google Scholar]
Associated Data
This section collects any data citations, data availability statements, or supplementary materials included in this article.
Data Availability Statement
All the generated and analyzed data are available from the corresponding author upon request.