

Abstract
Background and Objectives
Coffee intake is linked to a reduced risk of Parkinson disease (PD), but whether this effect is mediated by gut microbiota and metabolomic changes remains unclear. This study examines PD-associated metabolomic shifts, caffeine metabolism, and their connection to gut microbiome alterations in a multicenter study.
Methods
We conducted an untargeted serum metabolomic assay using liquid chromatography with high-resolution mass spectrometry on an exploratory cohort recruited from National Taiwan University Hospital (NTUH). A targeted metabolomic assay focusing on caffeine and its 12 downstream metabolites was conducted and validated in an independent cohort from University Malaya Medical Centre (UMMC). In the exploratory cohort, the association of each caffeine metabolite with gut microbiota changes was investigated by metagenomic shotgun sequencing. A clustering-based approach was used to correlate microbiome changes with plasma caffeine metabolite level and clinical severity. Body mass index, antiparkinsonism medication use, and dietary habits (including coffee and tea intake) were recorded.
Results
Sixty-three patients with PD and 54 controls from NTUH formed the exploratory cohort while 36 patients with PD and 20 controls from UMMC served as an validation cohort to replicate the plasma caffeine findings. A total of 5,158 metabolites were detected from untargeted metabolomic analysis, with 3,131 having high confidence for analysis. Compared with controls, the abundance of 56 metabolites was significantly higher and that of 7 metabolites was significantly lower (adjusted p < 0.05 and log2 fold change >1) in patients with PD. Caffeine metabolism was significantly lower in patients with PD (p = 0.0013), and serum levels of caffeine and its metabolites negatively correlated with motor severity (p < 0.01). Targeted metabolomic analysis confirmed reduced levels of caffeine and its metabolites, including theophylline, paraxanthine, 1,7-dimethyluric acid, and 5-acetylamino-6-amino-3-methyluracil, in patients with PD; these findings were replicated in the validation cohort (p < 0.05). A clustering approach found that 56 microbiome species enriched in patients with PD negatively correlated with caffeine and its metabolites paraxanthine and theophylline (both p < 0.05), notably Clostridium sp000435655, Acetatifactor sp900066565, Oliverpabstia intestinalis, and Ruminiclostridium siraeum.
Discussion
This study identifies PD-related changes in microbial-caffeine metabolism compared with controls. Our findings offer insights for future functional research on caffeine-microbiome interactions in PD.
Introduction
Parkinson disease (PD) is a complex neurodegenerative disorder characterized by both motor and nonmotor symptoms driven by diverse pathophysiology.1 Neuropathologic evidence reveals that, at least in some patients, the pathognomonic PD pathology, termed Lewy bodies, was observed in the intestine.2 In addition, the gut microbiome is altered in patients with PD compared with unaffected controls.3 Gut microbiota affect brain health through multiple routes within the gut-brain crosstalk, including the production of neuroactive metabolites, modulating the immune system, and excretion of aggregation-prone proteins.4 The multifaceted interaction between intestinal microorganisms, the host, and their diets contributes to the metabolites in the systemic circulation, which act as signaling molecules modulating neuropathology, because these metabolites can cross the blood-brain barrier.5 Deciphering how metabolomic changes can be attributed to the gut microbiome-host interactions in PD could not only shed light on the pathophysiology of PD but also facilitate approaches to modulating diet or the gut microbiome to shape a healthy metabolome as a novel treatment strategy for PD.
Alterations of gut microbiota detected by 16S rRNA sequencing and plasma metabolites measured with targeted assays have revealed that several bacterial taxa are associated with altered metabolism in PD, including metabolism of lipid and energy,6 amino acids,7 sulfur,8 and short-chain fatty acids.9 However, characterizing gut microbial communities using the 16S rRNA gene has been hampered by inherent limitations, including challenges in generating community profiles when sequencing hypervariable regions, short read lengths, taxonomic classification difficulties due to limited resolution of closely related species, and the lack of functional pathway information. In addition, targeted metabolomic approaches may be restricted by overlooking the metabolomic response of interest. Recent advances in high-resolution untargeted metabolomic profiling allow for the simultaneous measurement of thousands of metabolites to provide novel information about the initiation and progression of PD.10 A recent study combined longitudinal untargeted metabolome data from 30 patients with drug-naïve PD and 30 controls and analyzed those with published gut microbiome data from another independent PD cohort. This revealed that sulfur metabolism driven by Akkermansia muciniphila and Bilophila wadsworthia may be involved in PD pathophysiology.8 However, studies that simultaneously measure plasma untargeted metabolomics with fecal metagenomics data within the same individuals are still lacking. In this study, we first set out to determine PD-associated metabolic changes by analyzing the plasma metabolome using an untargeted metabolomic approach. Among these pathways, caffeine metabolism was notably lower in patients with PD compared with controls. A subsequent targeted metabolomic assay focusing on caffeine and its complete downstream pathways was validated and replicated in another independent cohort. We then integrated metagenomic shotgun sequencing data obtained from the same individuals to identify the potential microbial contribution to the observed metabolic changes in PD.
Methods
Enrollment and Study Participants
Patients with PD and neurologically normal controls were enrolled from National Taiwan University Hospital (NTUH) and University Malaya Medical Centre (UMMC). PD was clinically diagnosed according to the Movement Disorder Society Clinical Diagnostic Criteria for PD11 by movement disorder specialists (CH Lin in NTUH, AH Tan and SY Lim in UMMC). The Movement Disorder Society Unified Parkinson's Disease Rating Scale (MDS-UPDRS) parts I–III was evaluated during therapy. Levodopa equivalent daily dose (LEDD) was calculated as previously described.12 Control participants were neurologically healthy individuals or spouses of patients with PD, with no neuropsychiatric disorders and normal neurologic examinations. Participants were excluded if they were vegetarians; had renal or liver disease; history of inflammatory bowel disease, irritable bowel syndrome, colitis, or colon cancer; and had used antibiotics or probiotic supplements within 3 months of enrollment.
Among the enrolled participants, those recruited from NTUH formed an exploratory cohort that underwent the untargeted metabolomic assay for plasma metabolite profiling and targeted metabolomic analyses for quantification of caffeine and its metabolites, and individuals with PD simultaneously underwent fecal metagenomic shotgun sequencing for gut microbiota compositions. A dietary history was collected using the Food Frequency Questionnaire.13 Participants were defined as coffee or tea drinkers if they drank coffee or tea 3 or more times per week for more than 1 year.14 Decaffeinated beverages and energy drinks were not included in this study. Participants recruited from UMMC served as an independent validation cohort with different dietary habits to replicate the findings of plasma levels of caffeine and its metabolites.
Standard Protocol Approvals, Registrations, and Participant Consents
The research protocol was reviewed by the Institutional Research Board Committee at NTUH (IRB number: 202205017RINB) and approved by the UMMC Medical Research Ethics Committee (MECID number: 20149-564). All participants provided written informed consent before joining the study.
Plasma Sample Collection and Metabolomics Analysis
We collected 10 mL of venous blood from each participant. Blood was sampled in the morning after participants had fasted for at least 10 hours. The methyl tert-butyl ether (MTBE) extraction protocol was used for serum metabolite extraction.15 The 50-μL plasma sample was extracted by adding MTBE, methanol, and double-distilled water. The upper portion containing mostly lipids and the lower portion containing hydrophilic metabolites were separated, dried, and stored at −80°C before analysis, as described previously.15 Details of untargeted and targeted metabolomics analysis are provided in the eMethods.
Stool Sample Collection and Metagenomics Analysis
Fecal samples were collected in stool specimen collection tubes with DNA stabilizer (Sarstedt) within 2 weeks of fasting venous blood sample collection. Fecal samples were immediately flash-frozen on dry ice and stored at −80°C before analyses. Total fecal DNA was extracted using a QIAamp DNA Stool Mini Kit, as previously described.16 Details of fecal metagenomic analysis are provided in the eMethods.
Sample Size Estimation
For untargeted metabolomics, we used the R package MetSizeR (doi: 10.1186/1471-2105-14-338) to estimate a sample size of 40 participants per group to achieve a False Discovery Rate <0.05. For metagenomics, based on previous research,17 we estimated a sample size of 50 participants per group for 80% power. Using the MultiPower R package (doi: 10.1038/s41467-020-169), we determined that 30 participants per group would provide 80% power for the multiomics analysis. Combining these estimates, we selected a final sample size of at least 50 participants per group to ensure robustness.
Statistical Analyses
All statistical analyses and visualizations were performed using R (v4.0.2). The Spearman correlation coefficient was used to assess correlations between variables, with significance tested using the cor.test function in R and adjusted by the Benjamini-Hochberg procedure. To control the influence of confounding variables, partial correlation analyses were conducted with the ppcor package in R. To identify differences in gut microbiome abundance, the Wilcoxon rank-sum test was applied, with adjustments for multiple comparisons using the Benjamini-Hochberg procedure. Comparisons of continuous variables between 2 groups were also conducted using the Wilcoxon rank-sum test.
Data Availability
The raw data of metagenomic sequencing are available to the public with no restriction at the European Nucleotide Archive with accession number PRJEB57770. The processed metabolomics and metagenomics data are provided on Zenodo at zenodo.org/records/12230084.
Results
Clinical Characteristics of Participants in the Exploratory and Validation Cohorts
Among the enrolled participants, those from NTUH (63 patients with PD and 54 controls) formed the exploratory cohort and those from UMMC (36 patients with PD and 20 controls) served as an independent validation cohort to replicate the plasma caffeine findings. In both cohorts, the age at enrollment, sex, body mass index, medical comorbidities, and percentages of coffee and tea drinkers were comparable between patients with PD and control participants (Table). Significantly worse cognitive function was observed in patients with PD than in controls, in both cohorts. In the exploratory cohort, the groups did not significantly differ in dietary intake patterns measured using the food frequency questionnaire (eTable 1).
Table.
Clinical Characteristics and Plasma Concentrations of Microbial Metabolites in Participants
| Exploratory cohort | Validation cohort | |||||
| Healthy controls (N = 54) | Patients with PD (N = 63) | p Value | Healthy controls (N = 20) | Patients with PD (N = 36) | p Value | |
| Age (y) | 67.4 ± 7.5 | 67.4 ± 7.7 | 0.95 | 64.5 ± 9.1 | 65.6 ± 9.2 | 0.54 |
| Sex (male), n (%) | 25 (46.3) | 32 (50.8) | 0.63 | 6 (30.0) | 14 (38.9) | 0.51 |
| BMI | 23.8 ± 1.9 | 22.6 ± 1.5 | 0.21 | 25.0 ± 5.4 | 22.9 ± 3.9 | 0.27 |
| Constipation, n (%) | 21 (38.9) | 31 (49.2) | 0.26 | 3 (15.0) | 13 (36.1) | 0.10 |
| Disease duration (y) | N.A. | 7.4 ± 2.4 | N.A. | 7.9 ± 2.8 | ||
| Hoehn and Yahr stage | N.A. | 3.2 ± 0.9 | N.A. | 2.2 ± 0.7 | ||
| MDS-UPDRS part I score | N.A. | 6.7 ± 2.1 | N.A. | 7.3 ± 1.9 | ||
| MDS-UPDRS part II score | N.A. | 12.9 ± 2.8 | N.A. | 11.7 ± 2.6 | ||
| MDS-UPDRS part III score | N.A. | 35.0 ± 9.9 | N.A. | 29.4 ± 8.1 | ||
| MoCA score | 28.9 ± 1.1 | 26.5 ± 2.7 | <0.01a | 29.0 ± 0.9 | 24.5 ± 2.8 | <0.01a |
| LEDD | N.A. | 649.2 ± 206.0 | N.A. | 593.5 ± 352.7 | ||
| Medical comorbidity, n (%) | ||||||
| Diabetes mellitus | 11 (20.4) | 12 (19.0) | 0.86 | 3 (15.0) | 6 (16.7) | 0.87 |
| Hypertension | 15 (27.8) | 14 (22.2) | 0.49 | 9 (45.0) | 13 (36.1) | 0.51 |
| History of stroke | 7 (12.9) | 7 (11.1) | 0.55 | 1 (5.0) | 1 (2.8) | 0.67 |
| Coffee drinker, n (%) | 46 (85.2) | 55 (87.3) | 0.74 | 17 (85.0) | 28 (77.8) | 0.51 |
| Tea drinker, n (%) | 32 (59.2) | 37 (58.7) | 0.95 | 11 (55.0) | 18 (50.0) | 0.72 |
Abbreviations: BMI = body mass index; LEDD = levodopa equivalent daily dose; MDS-UPDRS = Movement Disorder Society Unified PD Rating Scale; MoCA = Montreal Cognitive Assessment; NA = not available; PD = Parkinson disease.
Variables are expressed as mean ± SD or number (percentage).
p < 0.01.
Untargeted and Targeted Metabolomics Analyses of Plasma Samples
To characterize the serum metabolomics of PD, an LC-MS–based untargeted metabolomics analysis was performed on an exploratory cohort recruited from NTUH, including 63 participants with PD and 54 healthy controls (Figure 1A). A total of 5,158 metabolites were detected, with 60.7% (3,131 of 5,158) of these metabolites at a high confidence level because they could be matched in at least one spectrum database. Comparing the 2 groups, 56 metabolites had significantly higher abundance and 7 metabolites had significantly lower abundance in patients with PD vs controls (adjusted p value <0.05 and |log2FC| > 1) (Figure 1B, eFigure 1, and eTable 2). Metabolic pathway analysis revealed that serum metabolites were enriched in amino acid metabolism, linoleic acid metabolism, sphingolipid metabolism, and caffeine metabolism (Figure 1C and eTable 3). Caffeine metabolism not only was significantly enriched in the differential abundance metabolites (p = 0.0013) but also had a high pathway impact (Figure 1C). According to the Kyoto Encyclopedia of Genes and Genomes database, 10 metabolites from the caffeine metabolism pathway have been reported in humans and 7 of them were detected in our untargeted metabolomics analysis (Figure 2). Among these metabolites, the abundance of caffeine, paraxanthine, and 1,7-dimethyluric acid was significantly lower in the PD group compared with the healthy control group (Figure 3). Although the differences in 1-methylxanthine, theobromine, 7-methylxanthine, and 7-methylurate representation did not reach statistical significance, their abundance in the PD group was lower than in the control group (Figure 3).
Figure 1. Serum Untargeted Metabolomics Analysis in Patients With PD and Healthy Controls in the Exploratory Cohort.

(A) Flowchart and participants enrolled in the study. (B) The volcano plot reveals the metabolites with differential abundance between patients with PD and controls in the exploratory cohort. The orange and green points indicate metabolites that were in significantly higher and lower abundance in the PD group compared with the control group (adj. p value <0.05 and |log2(fold-change)| > 1). (C) Pathway enrichment analysis identified the most relevant metabolic pathways through pathway impact (x-axis) and p value (y-axis). Pathway impact represents a combination of centrality and pathway enrichment results: higher impact values indicate the relative importance of the pathway. The size and color of the points represent the impact and significance of the pathway, respectively, with more intense red colors indicating lower p values. PD = Parkinson disease.
Figure 2. KEGG Reference Caffeine Metabolism Pathway.

KEGG = Kyoto Encyclopedia of Genes and Genomes. The metabolites highlighted by orange and blue dots are observed in humans, with orange dots indicating those detected in the metabolomics analysis.
Figure 3. Comparative Abundance of Caffeine Metabolites Between the PD and Control Groups From the Untargeted Metabolomics Analysis.

PD = Parkinson disease.
To further confirm the abundance of metabolites related to caffeine metabolism, we conducted targeted metabolomics analyses to detect caffeine and its downstream 12 metabolites in the exploratory cohort and another independent validation cohort recruited from another region (Figure 1A, Table). The targeted metabolites examined included caffeine, theophylline, paraxanthine, theobromine, 3-methylxanthine, 1-methylxanthine, 5-acetylamino-6-formylamino-3-methyluracil (AFMU), 1,7-dimethyluric acid, 3,7-dimethyluric, 1-methyluric acid, 5-acetylamino-6-amino-3-methyluracil (AAMU), 1,3,7-trimethylurate, and 7-methylxanthine. Owing to the low detection rates for 3,7 dimethyluric acid (0%) and 1,3,7-trimethylurate (9.8%), these 2 metabolites were excluded from further analysis. Caffeine, theophylline, and 1,7-dimethyluric acid showed significantly lower levels in the PD group compared with levels in the controls in both cohorts (eFigures 2 and 3). Coffee consumption increases serum concentrations of caffeine metabolites, particularly caffeine, paraxanthine, and theophylline, in coffee drinkers compared with nondrinkers among both patients with PD and control individuals (eFigure 4). In the initial exploratory cohort, paraxanthine, AFMU, and AAMU were also significantly reduced in patients with PD in comparison with controls (eFigure 2). The untargeted and targeted metabolomics analyses revealed a decrease in the concentration of caffeine and its metabolites in the serum of individuals with PD compared with healthy controls. The results were replicated in another independent validation cohort (eFigure 3). Notably, the serum concentrations of abovementioned caffeine metabolites also showed a negative correlation with the UPDRS part III motor score in both cohorts (eFigure 5, A and B).
Metagenomic Shotgun Analysis of Fecal Samples
Recent investigations suggest a mutual interaction between caffeine and gut microbiota: drinking coffee may directly affect gut microbiota and gut microbiota affect caffeine metabolism, which potentially influences the development of PD.18,19 Because our metabolomics analysis revealed that serum concentrations of caffeine metabolites are negatively associated with PD, we investigated the potential connections between the gut microbiome and caffeine metabolism. To address this, we simultaneously performed a metagenomics analysis on fecal samples collected from the same individuals in the exploratory cohort of 63 participants with PD and 54 controls matched for age, sex, and dietary habits (Figure 1A), achieving an average of 74.1 million reads per sample. A total of 1,525 species were profiled in at least one sample, with Bacteroidetes and Firmicutes being the most abundant phyla across all samples (eFigure 6A). The gut metagenomes of individuals with PD exhibited significantly higher numbers of observed species (p = 0.001, Wilcoxon rank-sum test) and significantly higher diversity compared with those of controls (p = <0.001 for Shannon diversity and p = <0.001 for Faith phylogenetic diversity, Wilcoxon rank-sum test) (eFigure 6, B and C). Principal coordinate analysis based on the Bray-Curtis dissimilarity matrix showed that interindividual differences in the global composition of the gut metagenome differed significantly between the PD and control groups (p = 0.004, PERMANOVA) (eFigure 6D). Moreover, the dispersion between PD and control groups was significantly different (p = 0.036, PERMDISP). A total of 122 species exhibited differential abundance between the PD and control groups (p < 0.05, Wilcoxon rank-sum test), with 115 species enriched and 7 species depleted in the PD group (eFigure 6E and eTable 4). Among these, several species have been previously reported as PD-associated microbes, including Faecalibacterium prausnitzii, Eubacterium ramulus, and Parabacteroides distasonis (eFigure 6F).20
We next examined the association between the gut microbiome and caffeine metabolites in patients with PD. A correlation analysis using the Spearman metric on samples derived from the exploratory cohort that had both fecal metagenomics and targeted metabolomics data was performed. We focused on the microbial features that were differentially abundant in patients with PD. Of these species, the abundance of 102 species was significantly correlated with the serum concentration of at least one caffeine metabolite (p < 0.05, eFigure 7, A and B). Among these 102 species, 32 exhibited differential abundance between the PD and control groups (eFigure 7A). Among species with multiple correlated caffeine metabolites, most showed coherent correlations. For example, Parabacteroides merdae was positively correlated with caffeine, paraxanthine, theophylline, 1-methylxanthine, and 1-methyluric acid. However, several species, including Lachnoclostridium sp900066555, UBA3818 sp9000557155, Parasutterella excrementihominis, Sutterella wadsworthensis, Ruthenibacterium lactatiformans, and Blautia sp900066145, exhibited incoherent correlations with their corresponding caffeine metabolites. These findings suggest a complex interaction between the gut microbiome and caffeine metabolism in individuals with PD.
Correlation of Fecal Microbiota Changes With Caffeine Metabolism in PD
To explore the complex interactions between the gut microbiome and caffeine metabolism in PD, we proposed a clustering-based approach to identify microbiome clusters based on their correlation profiles with caffeine metabolites. A total of 8 consensus microbiome clusters, from cluster 1 to cluster 8, were identified (Figure 4 and eTable 5), each revealing distinct correlation patterns with individual caffeine metabolites (Figure 5). Among these metabolites, caffeine, paraxanthine, theophylline, AAMU, and AFMU were clustered together because of their similar correlation patterns (Figure 4). These 5 metabolites showed decreased concentrations in the PD group compared with controls (eFigure 2), reinforcing a potential link between altered gut microbiome composition and impaired caffeine metabolism in PD.
Figure 4. Heatmap Shows the Correlation Profiles Between Gut Microbiome Abundance and the Serum Concentrations of Caffeine and Its Downstream Metabolites.

Figure 5. Violin Plots Reveal the Distribution of Correlation Values Between the Abundance of Species in a Given Microbiome Cluster and a Specific Metabolite in Patients With PD.
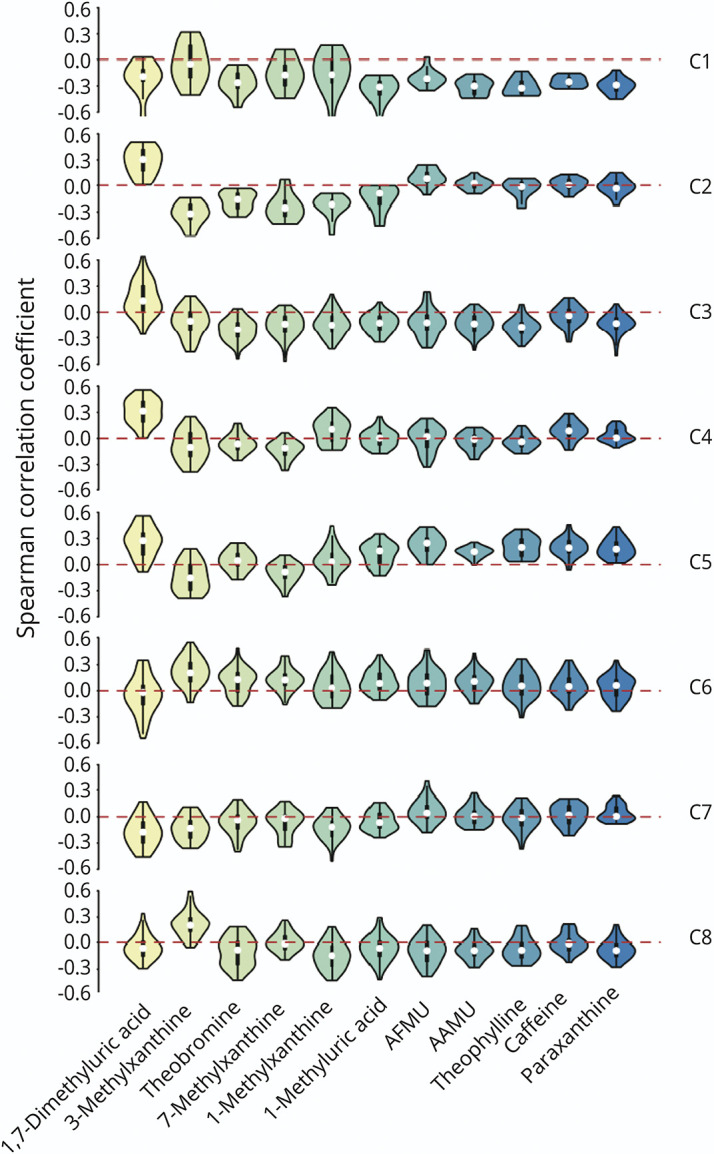
PD = Parkinson disease.
We compared the abundance of each microbiome cluster (summing up profile values of species in the given cluster) between the PD and control groups and found that the abundance of cluster 3 (C3) was significantly higher in the PD group compared with the control group (p = 0.013, Figure 6A). Moreover, the species of C3 were negatively correlated with caffeine metabolites except 1,7-dimethyluric acid (Figure 5). The abundance of the C3 microbiome also revealed significant negative correlations with the concentrations of paraxanthine, theophylline, AFMU, and AAMU (Figure 6B), consistent with the results of metabolomics analysis showing low caffeine metabolite concentrations in the serum of patients with PD. These findings suggest that the microbiome species in C3 may contribute to PD pathogenesis by disrupting caffeine metabolism.
Figure 6. Gut Microbiome Clusters Identified Based on the Correlation Profiles Between Species Abundance and Caffeine Metabolite Concentrations.

(A) Comparative abundance of the microbiome clusters in the PD and control groups. (B) The scatter plots show the correlation between the concentration of caffeine metabolite and the abundance of microbiome C3. PD = Parkinson disease.
Association Between Specific Gut Microbiome Species, Pathways, and Plasma Caffeine Metabolites and Clinical Severity in PD
A total of 56 species constituted C3 based on the correlation profiles of caffeine metabolites, and 22 of these 56 species showed differential abundance between the PD and control groups (eFigure 8A). Most species exhibited high co-abundance, except for Paraprevotella clara, Clostridium sp000435655, Veillonella nakazawae, Acetatifactor sp900066565, and Agathobaculum butyriciproducens (eFigure 9). To investigate the pathways potentially involved with these species, we used 2 pathway analysis approaches. The first approach involved performing pathway annotation on each species (eFigure 10), followed by over-representation analysis using the Fisher exact test. The significantly enriched pathways for the species in microbiome C3 are illustrated in eFigure 8B. The top 4 enriched pathways were phosphotransferase, photosynthesis, novobiocin biosynthesis, and amino acid metabolism. The second approach involved obtaining functional profiles from metagenomics data using HUMAnN 3.021 and then calculating the correlation between pathway profiles and microbiome cluster abundance. eFigure 8C depicts the pathways that are significantly correlated with microbiome C3, and most pathways were related to amino acid biosynthesis.
Among the 56 species of microbiome in C3, 2 species, Clostridium sp000435655 and Acetatifactor sp900066565, were not only enriched in the PD group compared with the control group but also were significantly negatively correlated with serum caffeine concentration (eFigures 8, D and E) and paraxanthine level (eFigures 8, F and G). These results highlight specific microbial species and pathways enriched in patients with PD that are significantly negatively correlated with serum caffeine metabolites, suggesting potential pathogenic mechanisms implicated in PD.
Furthermore, to untangle whether changes in gut microbiota are driven by caffeine intake or by PD itself, we performed a comparative analysis of the entire cohort of patients with PD and controls, stratified by caffeine use (users vs nonusers), to identify differences in the microbiota. Eighteen species showed significant differences in abundance (p < 0.05, eTable 6), and three of these species also exhibited differential abundance when comparing patients with PD and healthy controls (eFigure 11A). Among these 3 species, Butyricimonas virosa and Oliverpabstia intestinalis were more enriched in patients with PD but less abundant in coffee drinkers (eFigure 11A). By contrast, Ventricola sp900548125 was more abundant in both patients with PD and coffee drinkers. Notably, Oliverpabstia intestinalis was also found in microbiome C3, which showed a negative correlation with plasma caffeine metabolites (eFigure 8A). The abundance of Oliverpabstia intestinalis also revealed a significantly negative correlation with plasma paraxanthine concentration (eFigure 11B). However, the correlations between the abundance of Oliverpabstia intestinalis or microbiome in C3 and motor symptom severity of PD were not statistically significant (eFigures 11C and 12, and eTable 7). Our findings identify specific gut microbiome species that are less abundant in coffee drinkers but more abundant in patients with PD, with levels negatively correlated with plasma caffeine metabolites. These results suggest that coffee intake may influence PD severity by modulating both serum caffeine metabolites and gut microbiome changes, which interact with each other (eFigure 13).
Effects of Antiparkinsonism Medications on Plasma Caffeine Metabolites and Gut Microbiome Compositions in PD
Antiparkinsonism medications may influence metabolomics and gut microbiome profiles in PD.22 We next explored the associations between treatment regimens, serum caffeine metabolites, and the gut microbiome in PD. Serum concentrations of caffeine and paraxanthine were negatively correlated with LEDD, levodopa dosage, and catechol-O-methyltransferase (COMT) dosage while AFMU and AAMU were negatively correlated with LEDD and levodopa dosage (eTable 8). However, LEDD, levodopa dosages, and COMT inhibitor dosages were strongly correlated with PD motor severity (ρ = 0.84 p < 10e-10 for LEDD, ρ = 0.83, p < 10e-10 for levodopa, and ρ = 0.57, p < 0.001 for COMT). After adjusting for MDS-UPDRS part III scores through partial correlation analyses, the associations between LEDD, levodopa, and COMT inhibitor and caffeine metabolites were no longer significant (eTable 7). No significant associations were found with other medications (eTable 7).
In microbiome C3, only Dorea_A longicatena_B and Limivivens sp900543575 showed negative correlations with LEDD (p < 0.05, eTable 8). In addition, the abundance of Limivivens sp900543575 and CAG-95 sp900066375 was negatively associated with levodopa (p < 0.05, eTable 8). There were 6 species that negatively correlated with COMT dosage, including Dorea_A longicatena_B, Choladousia sp902363135, Copromonas sp900066785, Blautia_A obeum, Limivivens sp905214955, and Roseburia hominis (p < 0.05, eTable 8). Although some species exhibited differential abundance with the use of other categories of antiparkinsonism medications (eTable 8), these findings suggest that the impact of antiparkinsonism medications on the gut microbiome is majorly influenced by PD itself.
Discussion
In this integrated study, the untargeted metabolomics approach broadly implicated multiple metabolomic pathways that differed between patients with PD and controls. The subsequent targeted metabolomic assays focusing on caffeine metabolism revealed significantly decreased levels of caffeine and its downstream metabolites, including theophylline, paraxanthine, 1,7-dimethyluric acid, and AAMU, in patients with PD, and these findings were consistently observed in another independent validation cohort. Combining fecal metagenomic sequencing results, we recognized that the abundance of a cluster of microbiome species negatively correlated with serum levels of caffeine and paraxanthine, especially Clostridium sp000435655, Acetatifactor sp900066565, Oliverpabstia intestinalis, and Ruminiclostridium siraeum. Our findings, using the integration of multiomics data, uncover PD-specific patterns in microbial-caffeine metabolism that may contribute to the disease.
Our findings align with those of several previous case-control studies that found reduced serum concentration of caffeine and its major metabolites in patients with PD compared with controls.23-25 Compared with the results of a previous study conducted in Japan,24 caffeine and its downstream metabolites showed a similar profile pattern in our 2 cohorts. Recently, a large prospective cohort study with more than 20 years of follow-up found that plasma levels of caffeine and its metabolites paraxanthine and theophylline were reduced even in prediagnostic samples, suggesting that caffeine pathway metabolites could be protective in the prodromal stage of the disease.26 A further meta-analysis using a genome-scale metabolic model of PD consistently showed a reduced caffeine pathway in PD.27 Despite these clinical associations, experimental studies have shown that caffeine, at doses comparable with those of typical human exposure, attenuated MPTP-induced loss of striatal dopamine through multiple mechanisms, including attenuation of glutamatergic excitotoxicity and neuroinflammation through activating adenosine A2A receptors.28 In addition, caffeine can attenuate abnormal a-synuclein aggregation and neurotoxicity by re-establishing autophagy activity in animal models of PD.29 Furthermore, the 2 major caffeine metabolites, paraxanthine and theophylline, have also been demonstrated to mitigate motor symptoms in PD animal models.30,31 However, in an opposite trend, other caffeine-derived metabolites, for example, AFMU, 1,3,7-trimethyldihydrouric acid, and 1,3,7-trimethyl-5-hydroxyisourate, exhibited negative associations with PD, although the differences did not reach statistical significance.26 One of the possible reasons for the varying effects of caffeine metabolites on PD risk could be due to the different metabolic activities of individual hosts, with which the gut microenvironment will be involved. Understanding the mechanisms that produce these metabolites requires concomitant consideration of gut microbiome changes to decipher the impacts of changes in caffeine metabolites on PD.
The gut microbiome ecosystem contributes to systemic metabolite composition.5 Given the gastrointestinal involvement in PD, it has been speculated that the associations between coffee intake and PD risk could be mediated by gut microbiota.32 There is recent evidence for gut microorganisms interacting with caffeine metabolism in a complex and reciprocal manner in PD.18,19 Caffeine is initially absorbed in the stomach and small intestine but is further fermented in the colon by gut microbiota.32 Long-term caffeine consumption was recently found to be associated with colonic microbial composition in humans.19 Increased coffee intake was associated with an increase in anti-inflammatory Bifidobacteria and a decrease in Clostridium spp. and Escherichia coli that invade the gut mucosa in PD.33 Lower caffeine levels were associated with higher abundance of Erysipelatoclostridium, which has been linked to systemic inflammation.19 On the other side, intestinal microorganisms can, conversely, affect the metabolism of caffeine. These include prominent Pseudomonas species that subsist on caffeine in the gut of the coffee insect pest Hypothenemus hampei.34 Consistently, we observed that several PD-dominant microbiota species inversely correlated with plasma levels of caffeine and its major metabolites, including Clostridium sp000435655, Acetatifactor sp900066565, Oliverpabstia intestinalis, and Ruminiclostridium siraeum. The richness of Clostridium sp000435655 has been reported to associate with the increased risk of fatty liver disease, with potential involvement in ethanol fermentation pathways.35 Acetatifactor sp900066565 was present in higher abundance in the rats with metabolic syndrome than in rats supplemented with coffee pulp, in which caffeine is the most abundant bioactive component.36 Oliverpabstia intestinalis has been associated with the intake of human milk oligosaccharides and its abundance associated with the fecal level of SCFAs,37 which has been linked to the risk of PD.38 Finally, Ruminiclostridium siraeum has been linked to increased risk of Crohn disease,39 which is associated with increased risk of PD. All these microbiome species are directly or indirectly linked to inflammation and energy metabolism, which have been linked to PD pathophysiology.4 We hypothesize that these microbiomes may influence caffeine metabolism through various mechanisms; for example, certain gut bacteria produce enzymes that can break down caffeine, altering its metabolism and absorption by the body.34 Gut microbiota may influence the activity of liver enzymes responsible for caffeine metabolism, such as cytochrome P450 enzymes.40 Furthermore, metabolites produced by gut bacteria may affect the body's metabolic pathways, potentially affecting how caffeine is processed and used. Finally, the genetic composition of gut microbiota can interact with the host genome, influencing individual differences in caffeine metabolism.5 Future studies concomitantly including host genomics with a longitudinal study design incorporating intestinal inflammatory markers could delineate the complex interactions between the host and its microbiota affecting caffeine metabolism in PD pathology.
The strength of this study lies in its use of both serum untargeted metabolomics and fecal metagenomic sequencing approaches simultaneously in the same individuals of a cohort of patients with PD and age/sex/diet-matched controls, allowing the identification of multiple metabolic pathways that differ between the groups. Of note, the absolute concentration of caffeine and its downstream metabolites were determined using a targeted metabolomic assay and were replicated in another independently external cohort recruited from another region with different dietary habits and genetic backgrounds. Although caffeine metabolism has been known to be reduced in patients with PD, our study provides new insights by showing that altered gut microbiota with an abundance of specific species are negatively associated with the serum concentrations of caffeine and its major metabolites, providing objective evidence in humans linking PD-associated microbiota to disrupted caffeine metabolism in PD. This study has several limitations. First, coffee intake could not be quantified objectively and was based on the participants' recall. However, there were no significant differences in the percentage of individuals with caffeine intake between groups in both cohorts. Second, the observed associations could be confounded by different host susceptibility. Genes such as CYP1A2, CYP2E1, NAT2, and ADORA2A, which encode caffeine metabolism enzymes, might modify the catalyzing effect of caffeine.41 Third, this is a cross-sectional study, and we cannot determine the causal relationship between the observed gut microbiota changes and the reduced caffeine metabolism in patients with PD. A future longitudinal follow-up study including patients with drug-naïve PD is needed to further explore the complex interactions between host genetics, gut microbiota, caffeine metabolism, and antiparkinsonism medications in the progression of both motor and nonmotor symptoms of PD. Finally, all the patients with PD enrolled in this study were receiving anti-PD treatment. The use of antiparkinsonism medications is another potential confounding factor because levodopa has been shown to upregulate CYP1A2 activities, which increases caffeine metabolism. However, a study using prediagnostic blood samples from patients with PD who had not yet received any anti-PD medications also revealed reduced levels of caffeine and its metabolites compared with controls,25 reinforcing the finding that caffeine metabolism is downregulated in PD, regardless of anti-PD medication use.
In conclusion, this integrated multiomics study identified PD-specific patterns in microbial-caffeine metabolism, with key findings validated in an independent cohort. These findings provide new insights into microbial-caffeine interactions and pave the way for functional studies in the disease process of PD.
Acknowledgment
The authors thank the National Center for High-performance Computing (NCHC) of the National Applied Research Laboratories (NARLabs) of Taiwan for providing computational resources and storage resources.
Glossary
- AAMU
1,7-dimethyluric acid, 3,7-dimethyluric, 1-methyluric acid, 5-acetylamino-6-amino-3-methyluracil
- AFMU
5-acetylamino-6-formylamino-3-methyluracil
- C3
cluster 3
- LEDD
levodopa equivalent daily dose
- MDS-UPDRS
Movement Disorder Society Unified Parkinson's Disease Rating Scale
- MTBE
methyl tert-butyl ether
- NTUH
National Taiwan University Hospital
- PD
Parkinson disease
- UMMC
University Malaya Medical Centre
Author Contributions
C.-C. Chen: drafting/revision of the manuscript for content, including medical writing for content; analysis or interpretation of data. J.-Y. Chiu: drafting/revision of the manuscript for content, including medical writing for content; analysis or interpretation of data. A.H. Tan: major role in the acquisition of data. T.S. Toh: major role in the acquisition of data. S.-Y. Lim: major role in the acquisition of data. E.K. Tan: major role in the acquisition of data. S. Pettersson: major role in the acquisition of data. C.-C. Hsu: major role in the acquisition of data. J.-M. Liou: major role in the acquisition of data. M.-S. Wu: major role in the acquisition of data. C.-L. Hsu: drafting/revision of the manuscript for content, including medical writing for content; major role in the acquisition of data; analysis or interpretation of data. C.-H. Lin: drafting/revision of the manuscript for content, including medical writing for content; major role in the acquisition of data; study concept or design; analysis or interpretation of data.
Study Funding
This work was supported by the National Science and Technology Council (110-2221-E-002-129-MY3, 112-2321-B-002-023-, 113-2221-E-002-187-MY3, 113-2811-B-002-031), National Health Research Institutes (NHRI-EX114-11407NI), and National Taiwan University Hospital (NTUH 113-EDN003).
Disclosure
The authors report no relevant disclosures. Go to Neurology.org/N for full disclosures.
References
- 1.Kalia LV, Lang AE. Parkinson's disease. Lancet. 2015;386(9996):896-912. doi: 10.1016/S0140-6736(14)61393-3 [DOI] [PubMed] [Google Scholar]
- 2.Braak H, Del Tredici K, Rüb U, de Vos RA, Jansen Steur EN, Braak E. Staging of brain pathology related to sporadic Parkinson's disease. Neurobiol Aging. 2003;24(2):197-211. doi: 10.1016/s0197-4580(02)00065-9 [DOI] [PubMed] [Google Scholar]
- 3.Toh TS, Chong CW, Lim SY, et al. Gut microbiome in Parkinson's disease: new insights from meta-analysis. Parkinsonism Relat Disord. 2022;94:1-9. doi: 10.1016/j.parkreldis.2021.11.017 [DOI] [PubMed] [Google Scholar]
- 4.Tan AH, Lim SY, Lang AE. The microbiome-gut-brain axis in Parkinson disease–from basic research to the clinic. Nat Rev Neurol. 2022;18(8):476-495. doi: 10.1038/s41582-022-00681-2 [DOI] [PubMed] [Google Scholar]
- 5.Chen L, Zhernakova DV, Kurilshikov A, et al. Influence of the microbiome, diet and genetics on inter-individual variation in the human plasma metabolome. Nat Med. 2022;28(11):2333-2343. doi: 10.1038/s41591-022-02014-8 [DOI] [PMC free article] [PubMed] [Google Scholar]
- 6.Pereira PAB, Trivedi DK, Silverman J, et al. Multiomics implicate gut microbiota in altered lipid and energy metabolism in Parkinson's disease. NPJ Parkinsons Dis. 2022;8(1):39. doi: 10.1038/s41531-022-00300-3 [DOI] [PMC free article] [PubMed] [Google Scholar]
- 7.Cirstea MS, Yu AC, Golz E, et al. Microbiota composition and metabolism are associated with gut function in Parkinson's disease. Mov Disord. 2020;35(7):1208-1217. doi: 10.1002/mds.28052 [DOI] [PubMed] [Google Scholar]
- 8.Hertel J, Harms AC, Heinken A, et al. Integrated analyses of microbiome and longitudinal metabolome data reveal microbial-host interactions on sulfur metabolism in Parkinson's disease. Cell Rep. 2019;29(7):1767-1777.e8. doi: 10.1016/j.celrep.2019.10.035 [DOI] [PMC free article] [PubMed] [Google Scholar]
- 9.Shin C, Lim Y, Lim H, Ahn TB. Plasma short-chain fatty acids in patients with Parkinson's disease. Mov Disord. 2020;35(6):1021-1027. doi: 10.1002/mds.28016 [DOI] [PubMed] [Google Scholar]
- 10.Troisi J, Landolfi A, Cavallo P, Marciano F, Barone P, Amboni M. Metabolomics in Parkinson's disease. Adv Clin Chem. 2021;104:107-149. doi: 10.1016/bs.acc.2020.09.003 [DOI] [PubMed] [Google Scholar]
- 11.Postuma RB, Berg D, Stern M, et al. MDS clinical diagnostic criteria for Parkinson's disease. Mov Disord. 2015;30(12):1591-1601. doi: 10.1002/mds.26424 [DOI] [PubMed] [Google Scholar]
- 12.Tomlinson CL, Stowe R, Patel S, Rick C, Gray R, Clarke CE. Systematic review of levodopa dose equivalency reporting in Parkinson's disease. Mov Disord. 2010;25(15):2649-2653. doi: 10.1002/mds.23429 [DOI] [PubMed] [Google Scholar]
- 13.Chiu THT, Chang HR, Wang LY, Chang CC, Lin MN, Lin CL. Vegetarian diet and incidence of total, ischemic, and hemorrhagic stroke in 2 cohorts in Taiwan. Neurology. 2020;94(11):e1112-e1121. doi: 10.1212/WNL.0000000000009093 [DOI] [PMC free article] [PubMed] [Google Scholar]
- 14.Lu MY, Cheng HY, Lai JC, Chen SJ. The relationship between habitual coffee drinking and the prevalence of metabolic syndrome in Taiwanese adults: evidence from the Taiwan biobank database. Nutrients. 2022;14(9):1867. doi: 10.3390/nu14091867 [DOI] [PMC free article] [PubMed] [Google Scholar]
- 15.Kuo TH, Chung HH, Chang HY, et al. Deep lipidomics and molecular imaging of unsaturated lipid isomers: a universal strategy initiated by mCPBA epoxidation. Anal Chem. 2019;91(18):11905-11915. doi: 10.1021/acs.analchem.9b02667 [DOI] [PubMed] [Google Scholar]
- 16.Chen SJ, Chen CC, Liao HY, et al. Association of fecal and plasma levels of short-chain fatty acids with gut microbiota and clinical severity in patients with Parkinson disease. Neurology. 2022;98(8):e848-e858. doi: 10.1212/WNL.0000000000013225 [DOI] [PMC free article] [PubMed] [Google Scholar]
- 17.Ferdous T, Jiang L, Dinu I, et al. The rise to power of the microbiome: power and sample size calculation for microbiome studies. Mucosal Immunol. 2022;15(6):1060-1070. doi: 10.1038/s41385-022-00548-1 [DOI] [PubMed] [Google Scholar]
- 18.Ren X, Chen JF. Caffeine and Parkinson's disease: multiple benefits and emerging mechanisms. Front Neurosci. 2020;14:602697. doi: 10.3389/fnins.2020.602697 [DOI] [PMC free article] [PubMed] [Google Scholar]
- 19.Dai A, Hoffman K, Xu AA, et al. The association between caffeine intake and the colonic mucosa-associated gut microbiota in humans-A preliminary investigation. Nutrients. 2023;15(7):1747. doi: 10.3390/nu15071747 [DOI] [PMC free article] [PubMed] [Google Scholar]
- 20.Wallen ZD, Demirkan A, Twa G, et al. Metagenomics of Parkinson's disease implicates the gut microbiome in multiple disease mechanisms. Nat Commun. 2022;13(1):6958. doi: 10.1038/s41467-022-34667-x [DOI] [PMC free article] [PubMed] [Google Scholar]
- 21.Beghini F, McIver LJ, Blanco-Míguez A, et al. Integrating taxonomic, functional, and strain-level profiling of diverse microbial communities with bioBakery 3. Elife. 2021;10:e65088. doi: 10.7554/eLife.65088 [DOI] [PMC free article] [PubMed] [Google Scholar]
- 22.Menozzi E, Schapira AHV. The gut microbiota in Parkinson disease: interactions with drugs and potential for therapeutic applications. CNS Drugs. 2024;38(5):315-331. doi: 10.1007/s40263-024-01073-4 [DOI] [PMC free article] [PubMed] [Google Scholar]
- 23.Hatano T, Saiki S, Okuzumi A, Mohney RP, Hattori N. Identification of novel biomarkers for Parkinson's disease by metabolomic technologies. J Neurol Neurosurg Psychiatry. 2016;87(3):295-301. doi: 10.1136/jnnp-2014-309676 [DOI] [PubMed] [Google Scholar]
- 24.Takeshige-Amano H, Saiki S, Fujimaki M, et al. Shared metabolic profile of caffeine in parkinsonian disorders. Mov Disord. 2020;35(8):1438-1447. doi: 10.1002/mds.28068 [DOI] [PMC free article] [PubMed] [Google Scholar]
- 25.Fujimaki M, Saiki S, Li Y, et al. Serum caffeine and metabolites are reliable biomarkers of early Parkinson disease. Neurology. 2018;90(5):e404-e411. doi: 10.1212/WNL.0000000000004888 [DOI] [PMC free article] [PubMed] [Google Scholar]
- 26.Zhao Y, Lai Y, Konijnenberg H, et al. Association of coffee consumption and prediagnostic caffeine metabolites with incident Parkinson disease in a population-based cohort. Neurology. 2024;102(8):e209201. doi: 10.1212/WNL.0000000000209201 [DOI] [PMC free article] [PubMed] [Google Scholar]
- 27.Luo X, Liu Y, Balck A, Klein C, Fleming RMT. Identification of metabolites reproducibly associated with Parkinson's Disease via meta-analysis and computational modelling. NPJ Parkinsons Dis. 2024;10(1):126. doi: 10.1038/s41531-024-00732-z [DOI] [PMC free article] [PubMed] [Google Scholar]
- 28.Chen JF, Xu K, Petzer JP, et al. Neuroprotection by caffeine and A(2A) adenosine receptor inactivation in a model of Parkinson's disease. J Neurosci. 2001;21(10):RC143. doi: 10.1523/JNEUROSCI.21-10-j0001.2001 [DOI] [PMC free article] [PubMed] [Google Scholar]
- 29.Luan Y, Ren X, Zheng W, et al. Chronic caffeine treatment protects against α-synucleinopathy by reestablishing autophagy activity in the mouse striatum. Front Neurosci. 2018;12:301. doi: 10.3389/fnins.2018.00301 [DOI] [PMC free article] [PubMed] [Google Scholar]
- 30.Guerreiro S, Toulorge D, Hirsch E, Marien M, Sokoloff P, Michel PP. Paraxanthine, the primary metabolite of caffeine, provides protection against dopaminergic cell death via stimulation of ryanodine receptor channels. Mol Pharmacol. 2008;74(4):980-989. doi: 10.1124/mol.108.048207 [DOI] [PubMed] [Google Scholar]
- 31.Pardo M, Paul NE, Collins-Praino LE, Salamone JD, Correa M. The non-selective adenosine antagonist theophylline reverses the effects of dopamine antagonism on tremor, motor activity and effort-based decision-making. Pharmacol Biochem Behav. 2020;198:173035. doi: 10.1016/j.pbb.2020.173035 [DOI] [PubMed] [Google Scholar]
- 32.Scheperjans F, Pekkonen E, Kaakkola S, Auvinen P. Linking smoking, coffee, urate, and Parkinson's disease–a role for gut microbiota? J Parkinsons Dis. 2015;5(2):255-262. doi: 10.3233/JPD-150557 [DOI] [PubMed] [Google Scholar]
- 33.Khokhlova EV, Smeianov VV, Efimov BA, Kafarskaia LI, Pavlova SI, Shkoporov AN. Anti-inflammatory properties of intestinal Bifidobacterium strains isolated from healthy infants. Microbiol Immunol. 2012;56(1):27-39. doi: 10.1111/j.1348-0421.2011.00398.x [DOI] [PubMed] [Google Scholar]
- 34.Ceja-Navarro JA, Vega FE, Karaoz U, et al. Gut microbiota mediate caffeine detoxification in the primary insect pest of coffee. Nat Commun. 2015;6:7618. doi: 10.1038/ncomms8618 [DOI] [PMC free article] [PubMed] [Google Scholar]
- 35.Ruuskanen MO, Åberg F, Männistö V, et al. Links between gut microbiome composition and fatty liver disease in a large population sample. Gut Microbes. 2021;13(1):1-22. doi: 10.1080/19490976.2021.1888673 [DOI] [PMC free article] [PubMed] [Google Scholar]
- 36.Bhandarkar NS, Mouatt P, Majzoub ME, Thomas T, Brown L, Panchal SK. Coffee pulp, a by-product of coffee production, modulates gut microbiota and improves metabolic syndrome in high-carbohydrate, high-fat diet-fed rats. Pathogens. 2021;10(11):1369. doi: 10.3390/pathogens10111369 [DOI] [PMC free article] [PubMed] [Google Scholar]
- 37.Bajic D, Wiens F, Wintergerst E, Deyaert S, Baudot A, Van den Abbeele P. HMOs exert marked bifidogenic effects on children's gut microbiota ex vivo, due to age-related Bifidobacterium species composition. Nutrients. 2023;15(7):1701. doi: 10.3390/nu15071701 [DOI] [PMC free article] [PubMed] [Google Scholar]
- 38.Sampson TR, Debelius JW, Thron T, et al. Gut microbiota regulate motor deficits and neuroinflammation in a model of Parkinson's disease. Cell. 2016;167(6):1469-1480.e12. doi: 10.1016/j.cell.2016.11.018 [DOI] [PMC free article] [PubMed] [Google Scholar]
- 39.El Mouzan MI, Winter HS, Assiri AA, et al. Microbiota profile in new-onset pediatric Crohn's disease: data from a non-Western population. Gut Pathog. 2018;10:49. doi: 10.1186/s13099-018-0276-3 [DOI] [PMC free article] [PubMed] [Google Scholar]
- 40.Jourová L, Vavreckova M, Zemanova N, et al. Gut microbiome alters the activity of liver cytochromes P450 in mice with sex-dependent differences. Front Pharmacol. 2020;11:01303. doi: 10.3389/fphar.2020.01303 [DOI] [PMC free article] [PubMed] [Google Scholar]
- 41.Popat RA, Van Den Eeden SK, Tanner CM, et al. Coffee, ADORA2A, and CYP1A2: the caffeine connection in Parkinson's disease. Eur J Neurol. 2011;18(5):756-765. doi: 10.1111/j.1468-1331.2011.03353.x [DOI] [PMC free article] [PubMed] [Google Scholar]
Associated Data
This section collects any data citations, data availability statements, or supplementary materials included in this article.
Data Availability Statement
The raw data of metagenomic sequencing are available to the public with no restriction at the European Nucleotide Archive with accession number PRJEB57770. The processed metabolomics and metagenomics data are provided on Zenodo at zenodo.org/records/12230084.