

Abstract
The vascular endothelium features unique molecular and functional properties across different vessel types, such as between arteries, veins and capillaries, as well as between different organs, such as the leaky sinusoidal endothelium of the liver versus the impermeable vessels of the brain. However, the transcriptional networks governing endothelial organ specialization remain unclear. Here we profile the accessible chromatin and transcriptional landscapes of the endothelium from the mouse liver, lung, heart, kidney, brain and retina, across developmental time, to identify potential transcriptional regulators of endothelial heterogeneity. We then determine which of these putative regulators are conserved in human brain endothelial cells, and using single-cell transcriptomic profiling, we define which regulatory networks are active during brain maturation. Finally, we show that the putative transcriptional regulators identified by these three approaches molecularly and functionally reprogram naive endothelial cells. Thus, this resource can be used to identify potential transcriptional regulators controlling the establishment and maintenance of organ-specific endothelial specialization.
Despite a shared mesodermal origin and a host of common functions, endothelial cells (ECs), which form the inner lining of all blood vessels, show extensive functional heterogeneity and phenotypic specialization1–4. For example, the hepatic sinusoidal capillary vessels of the liver feature large intercellular gaps (or fenestrae) between ECs and they lack an organized basement membrane, which allow maximal contact and exchange between blood and hepatocytes5. These fenestrae are also essential for receptor-mediated endocytosis of lipoproteins, enabling sinusoidal ECs to function as scavengers, eliminating soluble macromolecular waste. By contrast, the primary function of ECs within the kidney glomeruli is to filter fluids and solutes6. While glomerular capillary ECs also possess inter cellular fenestrae, these gaps are smaller than in their liver sinusoidal counterparts and also cover more of the cell surface7. Unlike sinusoidal ECs, glomerular ECs secrete and deposit glycocalyx, a thick cell surface layer of membrane-associated proteoglycans, glycolipids, glycosamines and associated plasma proteins, which forms another filtration barrier8.
In addition to these interorgan-specific features, ECs also feature extensive intraorgan diversity, as the endothelium within the same organ is endowed with unique characteristics. This heterogeneity is exemplified by the unique morphological features and molecular signatures that distinguish the endothelium of arteries, arterioles, veins, venules and capillary vessels9. In addition, single-cell transcriptional profiling studies have uncovered additional distinct EC subpopulations, such as Car4 ECs in the lung10 and up to 24 EC subtypes in the kidney11. These diverse functions and morphologic features demonstrate the inherent phenotypic plasticity of the endothelium and suggest that cellular heterogeneity is a core property that enables ECs to fulfill their sometimes quite disparate tasks in very different environments (the adaptations required to thrive in the harsh environs of the kidney are distinct from those needed in capillaries located proximal to alveoli within the oxygen-rich environment of the lung).
However, all ECs share a common mesodermal origin and the same genome. Thus, their functional diversification probably derives from how that genome is activated via chromatin accessibility and/or epigenetic regulation12,13. Enhancers, non-coding regions of the genome that modify transcriptional output, are central nodes in transcriptional networks, integrating multiple upstream signals into unified outputs that act to regulate promoter activity and ultimately induce changes in gene expression14. Transcriptional regulatory elements are difficult to predict a priori due to their undefined sequence or location (with respect to their target genes). However, while several techniques have emerged to map enhancers (for example, H3K27ac (histone 3, acetylated lysine 27) ChIP-seq, DNase hypersensitivity mapping, Ep300 chromatin occupancy), they each come with significant caveats. In addition, purifying endothelium from different organs is not trivial, and complicated fluorescence activated cell sorting (FACS) procedures probably introduce artifacts given the extensive delay between tissue collection and EC isolation. Furthermore, the amount of input material required can be daunting if the lineage of interest comprises a small fraction of the cells in a tissue (for example, the adult mouse retina, which only contains approximately 5,000 ECs).
By combining Cre-dependent expression of a genetically encoded, fluorescent and epitope-tagged nuclear membrane protein (Sun1-2xsfGFP-6xMyc)15 with an endothelial-specific CreER driver line16, we rapidly isolated endothelial nuclei by affinity pulldown via isolation of nuclei tagged in specific cell types (INTACT)17. By processing a fraction of endothelial nuclei for the assay for transposase-accessible chromatin using high-throughput sequencing (ATAC-seq), which lever ages a robust, transposase enzyme-based method to profile open, accessible chromatin, and requires substantially less input (50,000 nuclei or fewer)18 and using the remainder for transcriptional analysis by RNA sequencing (RNA-seq), we identified common accessible chromatin regions present in six different mouse organs, as well as the DNA-binding motifs within these regions, to define a ‘core’ endothelial transcriptional code involving the ETS (E26 transformation-specific or erythroblast transformation specific) and SOX (SRY-related HMG box) family of transcription factors. We then identified organ-specific, accessible endothelial gene regulatory regions in embryonic and postnatal development, as well as in the adult mouse. Analysis of these regulatory regions identified transcription factor DNA-binding motifs enriched within distinct organs, while gene expression analysis identified the specific transcription factor family member(s) probably binding these uniquely accessible DNA regulatory elements. Further analysis of the regulatory landscape of the CNS endothelium using single-cell RNA-seq coupled with computational prediction algorithms determined that many of the same gene regulatory networks identified in our ATAC-seq data may govern specific stages of angiogenesis and blood–brain barrier maturation. Finally, we show that transcription factors identified in liver and brain endothelium by our approach are sufficient to molecularly and functionally reprogram naive ECs in vitro. Thus, we present a compendium of shared, and unique, transcriptome and epigenetic data across multiple organs, throughout development, for identification of the transcriptional regulatory networks governing organ-specific endothelial gene expression.
Results
Using INTACT and ATAC-seq to map accessible chromatin in ECs
To analyze organ-specific differences in endothelial chromatin accessibility and gene expression, we combined an endothelial-specific CreERT2 driver line (Cdh5-PAC-CreER)16 with a Cre-dependent myc epitope-tagged, nuclear envelope GFP reporter mouse (Rosa26CAG-lox-stop-lox-Sun1-2xsfGFP-6xMyc, or R26Sun1-sfGFP)15 to enable affinity pulldown of superfolder GFP (sfGFP)-tagged nuclei. Both input (total) and endothelial (GFP+) nuclei were processed for ATAC-seq18 and RNA-seq to identify organ-specific accessible chromatin and transcriptional signatures (Fig. 1a). ECs from the embryonic day 12.5 (E12.5) trunk, brain and heart, as well as the postnatal day 6 (P6) and adult mouse brain, retina, heart, lung, liver and kidneys, were analyzed (Supplementary Table 1).
Fig. 1 |. Isolation and characterization of tissue-specific endothelial signatures throughout development.
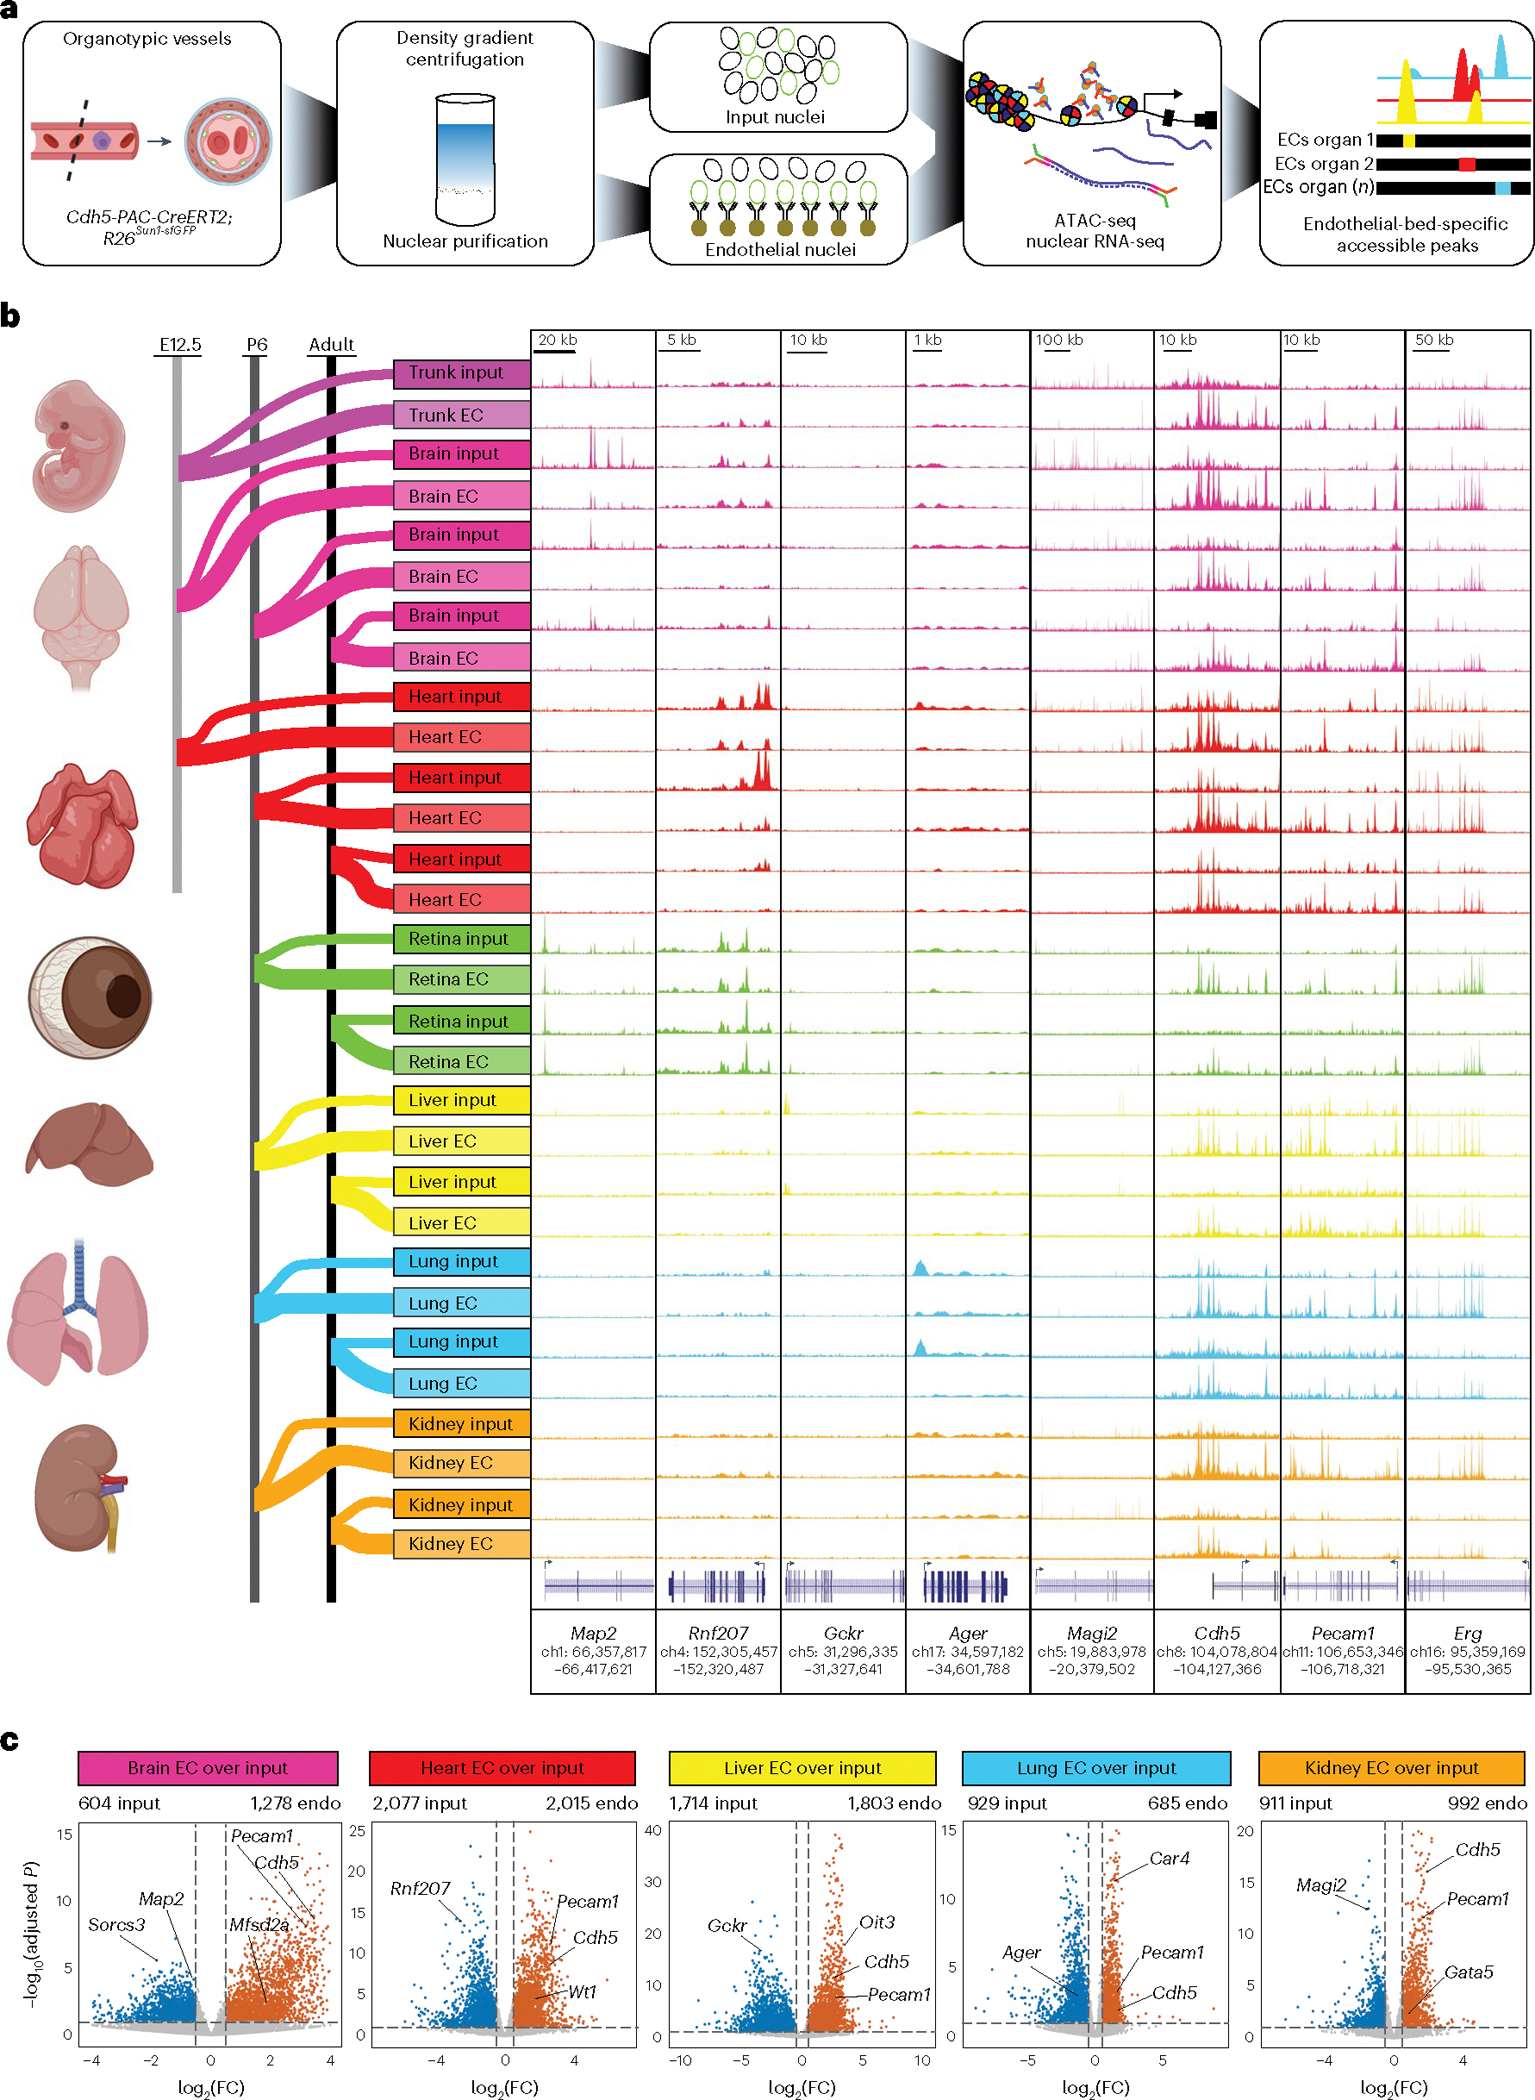
a, Workflow for genetic affinity tag labeling of ECs using Cdh5-PAC-CreERT2 and R26Sun1-sfGFP mice for INTACT. Far left: representative schematic of a blood vessel with GFP-tagged nuclei. Nuclear isolation was followed by RNA-seq profiling of nuclear transcripts and ATAC-seq mapping of accessible chromatin and aligning reads to the mouse genome (far right). b, Far left: various tissues and timepoints used to map endothelial cell diversity in the developing (E12.5), postnatal (P6) and adult (2 months of age) mouse. Far right: representative genome browser tracks from ATAC-seq highlight accessible chromatin regions unique to organ-specific genes such as Map2 in neurons, Rnf207 in cardiomyocytes, Gckr in hepatocytes, Ager in alveolar cells of the lung and Magi-2 in proximal tubule cells of the kidney, and ECs including Cdh5, Pecam1 and Erg. c, Volcano plots show differentially expressed genes (DESEQ2 Wald test two-tailed P values in which differential genes were counted if log2(FC) > 0.5 and alpha < 0.1.) between input nuclei (blue) and endothelium (red). Note that all developmental timepoints (E12.5–adult) are combined and treated as a single sample for these analyses.
To confirm our pipeline, we analyzed chromatin accessibility at loci whose transcripts are enriched in the major (non-endothelial) cellular constituents of each organ sampled. Accessibility at the Map2 (refs. 19,20) locus was enriched in brain input compared with ECs, while Rnf207 (refs. 21,22) was elevated in the heart input, Gckr23,24 in the liver input, Ager25 in the lung input and Magi-2 (refs. 26,27) in the kidney input. Conversely, chromatin accessibility around the pan-endothelial markers Cdh5 (encoding vascular endothelial cadherin (VE-cadherin))28, Pecam1 (encoding CD31)29 and Erg (encoding ERG)9 was increased in EC nuclei (Fig. 1b). RNA-seq analysis confirmed organ purity, Sorcs3 (ref. 30) and Map2 were enriched in the brain, while Rnf207 was expressed in the heart31, Gckr in the liver32, Ager in the lung33 and Magi-2 in the kidney34. These same transcripts were depleted in EC nuclei of their respective organ. Conversely, Mfsd2a was elevated in brain ECs35, Wt1 in cardiac ECs36,37, Oit3 in liver ECs38, Car4 in lung ECs10 and Gata5 in kidney ECs39. Pecam1 and Cdh5 were enriched in the endothelial nuclei of all organs (Fig. 1c). We detected little enrichment of transcripts, or chromatin accessibility, for lymphatic EC markers (Extended Data Fig. 1a,b).
ECs share core epigenetic features across organs and time
We identified 2,646 accessible regions enriched in the endothelium of all organs (Fig. 2a and Supplementary Table 2). We then used Genomic Regions Enrichment of Annotations Tool (GREAT)40 to link these open chromatin regions to genes to perform Gene Ontology (GO) analysis. Vascular development, blood vessel morphogenesis and angiogenesis were among the top GO terms common in all ECs (Fig. 2b,c and Supplementary Table 3). Hypergeometric Optimization of Motif Enrichment (HOMER)41 identification of transcription factor DNA-binding motifs enriched in these accessible chromatin regions determined that binding sites for the ETS family of transcription factors (TFs) (ERG, FLI1 and so on), which are crucial for endothelial development42–45, were the most enriched TF motifs in these common accessible regions (Fig. 2d and Supplementary Tables 4–6). Notably, validated ETS-dependent enhancers in Dll4 (encoding delta-like 4)44 and Eng (endoglin)46 were both identified by our analyses (Fig. 2e,f).
Fig. 2 |. ECs from diverse organs share a core epigenetic signature.

a, Venn diagram showing the overlap of open chromatin regions (2,646 peaks) between the mouse heart, kidney, liver, lung, retina and brain endothelium. b, Heatmap of shared peaks across the endothelial and input datasets. c, GREAT analysis of common peaks showing GO terms related to cardiovascular development and angiogenesis, among others. d, Top 20 transcription factor DNA-binding motifs in shared peaks along with their P value as determined using HOMER (one-tailed Fisher’s exact test). e, Top: position weight matrix (PWM) for transcription factor DNA binding sites of two ETS family members, with the inset box showing the frequency of motif occurrence in all endothelial cells (shared EC) as the distance from the center of the peak within accessible DNA regions as determined by ATAC-seq. f, Representative genome browser tracks from ATAC-seq data highlight accessible chromatin regions in the adult endothelium for the loci surrounding the genes Dll4 and Eng, with putative DNA binding sites for ERG and FLI highlighted in vertical yellow bars and red rectangles.
Motifs for the SOX family were the second most abundant known DNA-binding sites enriched in the accessible chromatin of ECs (Fig. 2d). SOXF subfamily members (Sox7, Sox17 and Sox18) have partial redundancy in regulating angiogenesis and vascular maintenance47–49, and Sox17 regulates arterial differentiation in mice50. The SOXB1 subfamily member Sox2 has been implicated in endothelial differentiation in vitro51 and in cerebral arteriovenous malformation52. Motifs for the Forkhead Box (FOX) family member FOXO1, which regulates angiogenesis and EC metabolism53–56, were enriched across all organs. Notably, transcripts for multiple ETS (ETS1, ERG, FLI), SOX (SOX17, SOX6, SOX7, SOX4) and FOX (FOXO1) family of TFs were detected in the ECs of all organs (Extended Data Fig. 2a).
Identification of organotypic EC transcriptional regulators
Merging the E12.5, P6.5 and adult timepoints from each organ into a single dataset, we identified 45,075 EC-enriched, differentially accessible chromatin peaks (Fig. 3a and Supplementary Table 7). These regions were linked to nearby genes40, and these genes were filtered for enriched expression in the endothelium using our nuclear RNA-seq data (q value < 0.1 and log2(fold change (FC)) > 0.5). These genes were then used to identify enriched biological processes in each organ (Fig. 3b and Supplementary Tables 8 and 9). Brain-enriched accessible chromatin regions were associated with the WNT (wingless-type mouse mammary tumor virus integration site) signaling pathway, while the vasculature of the heart and kidney showed enrichment of semaphorin–plexin signaling, and the heart showed enrichment for Notch signaling.
Fig. 3 |. Profiling accessible chromatin and expressed transcripts identifies organ-specific endothelial signatures.

a, Heatmap showing differentially accessible regions of open chromatin in the mouse brain, retina, heart, liver, lung and kidney endothelium (45,075 peaks) identified by ATAC-seq. b, Top biological processes from GREAT analysis across differentially accessible peaks in each organ. Only regions annotated to endothelial-enriched genes (determined by RNA-seq) were used in the analysis. c, Top transcription factor motifs in regions of open chromatin in the brain and heart (one-tailed Fisher’s exact test). d, Enriched motifs found by HOMER in each organ. PWM shown over frequency of motif as the distance from the peak center. e, Representative genome browser tracks from ATAC-seq highlighting accessible organ-specific chromatin regions in endothelial-enriched transcripts. Vertical gray bars indicate unique, organ-specific peaks shared across organs with an ERG or FLI DNA binding motif.
Comparison of differentially enriched TF motifs across all organs, and filtering by TF expression, revealed that DNA-binding sites for WNT signaling-related transcription factors (ZIC3, LEF1, TCF3 and so on) were enriched in the CNS endothelium (Fig. 3c and Extended Data Fig. 2b,c). Canonical WNT signaling is a key regulator of blood–brain barrier (BBB) development57–60. Motifs for FOX transcription factors were also overrepresented in the CNS endothelium. While Foxf2 has been implicated in regulating BBB-related genes60,61, and Foxl2 transcripts are enriched in brain ECs60 (Extended Data Fig. 2b,c), a requirement for FOXP1, FOXK1, FOXF1 and FOXA1 in BBB function has not been reported.
Motifs for the zinc family of transcription factors (GATA1, GATA2, GATA4 and GATA6) were enriched in the heart and liver (Fig. 3c and Extended Data Fig. 2b). GATA1 may regulate EC function in the heart and liver62, while GATA2 regulates vascular integrity in mice63. GATA4 and GATA6 expression was enriched in liver and heart ECs and are both required for cardiovascular development64–66 and endothelial maturation in the liver67,68.
Motifs for nuclear factor of activated T cell (NFAT) TFs were enriched in the cardiac endothelium (Fig. 3c and Extended Data Fig. 2b,c). Nfatc1 is a canonical endocardial marker and is required for cardiac morphogenesis69,70 and coronary vessel angiogenesis71, while Nfatc3/c4 null embryos die at E11.5 with excessive vascular growth72.
Motifs for helix-turn-helix (HTH) and winged helix Regulatory Factor binding to the X-box (RFX) are also enriched in the heart (Fig. 3a–c and Extended Data Fig. 2b)73. Transcripts for Rfx1 and Rfx2 were evident in the endothelium of all organs, and HTH-X-box has an established role in the heart74.
SOX2, SOX3 and SOX4 motifs were present in the ECs of all organs and enriched in the heart (Fig. 3c and Extended Data Fig. 2b). While a role for Sox2 and Sox3 in the cardiac endothelium or endocardium has not been shown, Sox4 is required for outflow tract morphogenesis75.
Motifs for the large musculoaponeurotic fibrosarcoma (MAF) basic leucine zipper (bZip transcription factors) MAFA and MAFB were enriched in the liver endothelium, although MAFB was more highly expressed (Extended Data Fig. 2b,c). MAF TFs interact with ETS1 and SOX TFs76, and MAFB is involved in angiogenesis77. Notably, c-MAF was not present in our motif analysis78,79.
These DNA-binding motifs were enriched in the center of regions of open chromatin (Fig. 3d and Supplementary Tables 10–14), suggesting that these factors may drive chromatin accessibility. Several of these unique, tissue-specific accessible regions occurred within, or near, loci of transcripts that are elevated in these organs, and also featured DNA-binding sites for TFs identified in our analyses (Fig. 3e). For example, Slc7a1(encoding solute carrier family 7 member 1), which is enriched in the adult cerebrovascular endothelium80,81, contains a region downstream from the transcriptional start site (TSS) that is uniquely accessible in CNS ECs and also contains a consensus LEF1 motif (Fig. 3e). This same pattern is found in endocardial genes (Cytl1(encoding cytokine-like 1))82 (NFAT motifs), liver genes (Dpp4(dipeptidyl-peptidase 4))83 (GATA4 motifs), lung genes (Ace(angiotensin-converting enzyme)) (FOXO3 motif) and kidney genes (Lgr5(leucine-rich repeat-containing G-protein coupled receptor 5))84 (HOXC9 motif).
Chromatin accessibility change during EC maturation
We identified 22,182 peaks specific to the CNS endothelium that were differentially regulated from E12.5 to adult ECs. After annotating peaks to nearby genes, we filtered these data to select for genes whose transcripts were enriched in the endothelium in our RNA-seq data (q value < 0.1 and log2(FC) > 0.5) for GO analysis (false discovery rate (FDR) < 0.05) (Fig. 4a,b and Supplementary Tables 15–18). We then rank-ordered enriched DNA-binding motifs at each timepoint by the actual expression of each TF (1 = highest, 20 = lowest) (Fig. 4c). At E12.5, FOXF1 and SOX17 were the most highly expressed TFs of those motifs that were enriched in the cerebrovasculature. Members of the ETS family (ETS1, ERG and FLI1) rounded out the remaining top 5 TFs. ETS, FOX and SOX family members made up the rest of the top 20 TFs, as well as TEAD1 and JUN. At P6, ETS1 and FLI1 were decreased, while EHF, ELF3, ELF5 and ERG, along with FOXL2, comprised the top 5. In the adult CNS endothelium, FOXL2 and FOXF1 were followed by ETS1, FLI1 and LEF1. LEF1 and TCF3, regulators of canonical WNT signaling, as well as PPARA, FOXP1, FOXO1, FOXM1, KLF1, KLF5 and NR2F1, were among the other adult-enriched TFs. The same rank ordering of TF motif abundance filtered by mRNA expression was performed for the remaining organs (Extended Data Figs. 3–6 and Supplementary Tables 19–35). Examination of established organ-specific transcriptional regulators, such as Nfatc1 (heart), Gata4 (liver) and Tcf7l2 (brain), revealed differentially accessible potential gene regulatory elements within these loci (Extended Data Fig. 7).
Fig. 4 |. Chromatin accessibility changes across time in the brain endothelium.

a, Differential chromatin accessibility determined by ATAC-seq within the brain and retinal endothelium (6,540 peaks) of E12.5, P6 and adult mice. b, Top biological processes from GREAT analysis across differentially accessible peaks at each timepoint. c, Top 20 transcription factors ranked by expression for each age. The log2 expression over input is indicated in the y axis. The motif enrichment P value is shown according to the size of the bubble (one-tailed Fisher’s exact test). d, Normalized gene expression in either E12.5, P6 or adult brain and retina endothelium (top) and genomic tracks for endothelial and input brain samples for genes upregulated in E12.5 (Adm), P6 (Tnc) or adult (Slc9a2). Unique peaks to those timepoints are indicated by the transparent vertical gray bar, and DNA binding sites of the top 20 transcription factor motifs that are present in such peaks are indicated below. avg, average.
Examination of brain-specific regions of open chromatin associated with genes that were differentially expressed in E12.5, P6 or adult CNS endothelium showed that Adm (encoding adrenomedullin), enriched in brain EC tip cells85, contains an accessible chromatin region in E12.5 at the zenith of Adm expression, but this peak is decreased at P6 and not detected in the adult. Similarly, expression of Tnc(encoding tenascin-c), whose protein product is involved in cell adhesion86, peaks at P6 and features two regions of open chromatin at this same stage that are not detected in the adult endothelium. Finally, Slc9a2, which encodes a Na+/H+ exchanger present in brain endothelium87, contains three regions of open chromatin upstream of its promoter that are enriched in the adult CNS endothelium. Each of these accessible chromatin regions contain putative binding sites for the relevant TFs identified (for example, ETS1, FOXF1 and FOXO1 at E12.5 in Adm; TCF3, FOXF1 and LEF1 at the adult in Slc9a2) (Fig. 4d).
EC transcription factor motifs are evolutionarily conserved
To determine whether the transcriptional networks identified in the mouse brain are conserved in humans, we turned to an in vitro model of the human brain endothelium: hCMEC/D3 cells88–91. A total of 93,197 open chromatin regions in human brain microvascular ECs and 13,241 peaks enriched in P6 and adult mouse brain ECs were used to identify enriched motifs. DNA-binding sites for ERG, FOXF1, FOXO3, FOXL2, FOXP1, TCF3, LEF1, FOXO1, TCF7 and ZIC3 were enriched in accessible chromatin of the adult human and mouse cerebral endothelium (Fig. 5a,b). These conserved regions of open chromatin were associated with processes such as vascular remodeling, cell junction assembly and negative regulation of the cell cycle (via BMP/SMAD and vascular endothelial growth factor (VEGF) inhibition) (Fig. 5c and Supplementary Tables 35 and 36). Examples of evolutionarily conserved, non-coding regions containing these motifs are found in Slc31a1 and proximal to Mfsd2a (Fig. 5d,e).
Fig. 5 |. Evolutionary conservation of transcription factor motifs in regions of open chromatin between humans and adult mice.

a, Diagram representing the total number of open chromatin regions in hCMEC/D3 cells and the adult endothelial brain vasculature. b, Selected known transcription factor DNA binding motifs in conserved peaks along with their P value after analysis by HOMER (one-tailed Fisher’s exact test). c, GO term analysis of genes with conserved nearby accessible chromatin regions. d,e, Representative genome browser tracks of Slc31a (d) and Mfsd2a (e) highlighting (in yellow) conserved accessible chromatin regions in humans (top) and mice (bottom) as defined by ATAC-seq and Omni-ATAC-seq. Transcription factor motifs present in the highlighted peak are shown above. Conservation at the nucleotide level within each highlighted peak is shown below each locus. Cons, conservation; verts, vertebrate.
Single-cell resolution of BBB maturation
We next used single-cell RNA-seq (scRNA-seq) and in silico prediction of endothelial gene regulatory networks as an orthogonal approach to validate our ATAC-seq and RNA-seq results. CD31+ ECs from whole brains (E9.5, E12.5 and E16.5) or the cortex (P8 and adult) were isolated by Magnetic Activated Cell Sorting (MACS) and processed for scRNA-seq. After filtering (Methods), 22,990 cells were subjected to dimensionality reduction analysis for visualization. Assigning cell identities using established markers revealed the presence of microglia, mural cells, astrocytes or radial glia, and endothelium (Supplementary Table 37 and Extended Data Fig. 8a–d).
We used NicheNET92 to predict cell–cell-based interactions between components of the neurovascular unit (NVU) from these scRNA-seq data93. Designating ECs as signal-receiving cells (receptors and downstream effectors) and all other cell types of the NVU (neurons, mural cells, glia, astrocytes) as signal-sending cells, we examined signaling networks that were upregulated in the adult brain compared with the E9.5 brain (Extended Data Fig. 8e). NicheNET predicted that pericyte-derived cadherin-2 (N-cadherin) may activate Ctnnb1 (encoding catenin beta-1/β-catenin) and Ctnnd1(catenin delta 1; P120)94. It also predicted that pericyte-presented CDH2 (cadherin-2, N-cadherin) activated WNT-related genes in ECs, including Cdkn1a95, Ccnd1 (refs. 96,97) and Ptma98.
While most activation of Ctnnb1 in the developing CNS occurs via neural-precursor-cell-mediated secretion of WNT ligands, N-cadherin+ pericytes can adhere to ECs expressing a different cadherin (that is, VE-cadherin), and binding of pericyte N-cadherin to EC-presented cadherins could impact the cytoplasmic pools of P120 and β-catenin within ECs99,100. Furthermore, pericyte-specific Cdh2 deletion increased permeability and reduced VE-cadherin-positive adherens junctions in neighboring ECs101,102, and pericyte CDH2 induces expression of WNT target genes in ECs103,104. NicheNET also predicted that smooth muscle cell-presented Itgb1 (encoding integrin beta 1) may activate Rad51, which is involved in vascular maintenance105,106.
We next used CCInx (version 0.5)107 to identify differential ligand–receptor signaling between the endothelium and pericytes in the young versus adult mouse brain (Extended Data Fig. 8f). CCInx predicted that pericyte vitronectin interacted with endothelial integrin β1 in adult mice. Recent studies showed that pericyte-derived vitronectin-mediated activation of integrin α5β1 in ECs is essential for BBB function108, and integrin β1 is required for BBB function109–111. CCInx also suggested that the chemokines that regulate leukocyte migration and maintain homeostasis, such as Cxcl12, are enriched in adult brain ECs, while its receptor, Ackr3/Cxcr7, is enriched in pericytes112,113. Similarly, adult brain ECs express Pdgfb, while its cognate receptor, Pdgfrb, was enriched in adult pericytes114,115. Conversely, Mif(encoding macrophage migration inhibitory factor), which attenuates pericyte contractility116, was reduced in adult brain ECs, and expression of multiple potential MIF receptors, including Tfrc/Cd71 (transferrin receptor 1) and Itgα4(integrin α4), was reduced in pericytes. Thus, cellular communication within the NVU can be inferred from these results, and these EC-enriched datasets may be integrated with other existing scRNA-seq datasets for further analyses.
In total, 22,990 brain ECs (Pecam1+, Cdh5+) from each timepoint (E9.5 = 6,039; E12.5 = 6,822; E16.5 = 3,358; P8 = 4,048; adult = 2,723) were extracted and combined for analysis. Dimensionality reduction and visualization117,118 revealed that while EC-specific transcripts (that is, Pecam1, Cdh5) were present across all timepoints, canonical lymphatic endothelial cell markers (that is, Lyve1, Prox1) were lowly expressed, suggesting limited presence of non-blood ECs (Fig. 6a and Extended Data Fig. 9a,b).
Fig. 6 |. Maturation of the BBB at single-cell resolution.

a, UMAP of all only subset ECs (from Extended Data Fig. 8) colored coded by timepoint and clustered using Monocle 3 to show maturation across time. b, A feature plot showing the expression score of a 66-marker panel BBB gene signature shows later acquisition of maturing BBB markers. c,d, Feature plots for the BBB maturation markers Mfsd2a (c) and Abcb1a (d). e, Confocal micrographs of sections processed for smFISH for Mfsd2a transcripts (magenta), along with antibody staining for the EC marker Cldn5 (yellow) and DAPI staining for nuclei (turquoise) from E12.5, P7 and adult mouse brains. f, Confocal micrographs of sections processed for smFISH for Abcb1a transcripts (magenta), along with antibody staining for the EC marker Cldn5 (yellow) and DAPI staining for nuclei (turquoise) from E12.5, P7 and adult mouse brains. In e and f, the area in the dashed white box is magnified in the image below. g, SCENIC binary activity heatmap representing active regulons in brain ECs across all timepoints. Vertical columns represent individual sequenced cells, while each horizontal row represents an individual regulon. Highlighted regulons are shown in the right. Differentially active regulon in the cerebral endothelium at E9.5 and E12.5 (green shading) compared with E16.5, P8 and adult (blue shading) and P8 and adult (orange shading). Highlighted for each group are representative regulons with their binding motif visualization logo and the number of genes that comprise the regulon in parentheses. h, Confocal micrographs of sections processed for smFISH for Cldn5 (top), Plagl1 (middle) and Dbp (bottom) transcripts (magenta), along with antibody staining for the EC marker Cldn5 (yellow) and DAPI staining for nuclei (turquoise) from E12.5, P7 and adult mouse brains. In the images, the area in the dashed white box is magnified in the image below.
Differential gene expression signatures were evident between the timepoints (Extended Data Fig. 9c). Interestingly, Mif, which encodes an inflammatory cytokine implicated in angiogenesis119, was robustly expressed in E9.5 brain ECs, but downregulated at later stages. Marcksl1, a gene involved in blood vessel morphogenesis120, was an upregulated gene in the E12.5 brain endothelium. Expression of Pvlap, a pan-endothelial marker that is lost in the mature BBB endothelium121,122, decreased after E12.5. Conversely, the BBB markers Mfsd2a35,123 and Slco1a4 (refs. 124,125) were highly expressed at E16.5 or later, coinciding with BBB maturation35,60. Overall, BBB-related genes126 (Supplementary Table 38) were enriched at later timepoints (Fig. 6b–d and Extended Data Fig. 9d). Immunofluorescence for the EC marker CLDN5, combined with single-molecule fluorescence in situ hybridization (smFISH) for Mfsd2a and Abcb1a (Fig. 6e,f), confirmed the trends shown in our scRNA-seq analyses.
Gene regulatory networks regulating brain EC maturation
We next correlated expression of TFs and their presumptive transcriptional targets to identify differentially active gene regulatory networks (GRNs) during cerebrovascular maturation. Using Single-Cell Regulatory Network Inference and Clustering (SCENIC)127, we identified three distinct clusters of ECs (Fig. 6g). The first cluster was enriched primarily in E9.5 and E12.5 brain ECs and included GRNs (or regulons) driven by SOX11 (106 genes), PLAGL1 (79 genes) and E2F1 (314 genes). SOX11 regulates vascular development and is active during pathological angiogenesis128,129, while PLAGL1 may impact early developmental angiogenesis130, and E2F1 modulates VEGF expression in vitro131.
The second cluster of regulons were active primarily in the E16.5, P8 and adult CNS endothelium, and included JUN (33 genes), FOXF1 (110 genes) and FOXQ1 (236 genes). Jun has been implicated in sprouting angiogenesis132–134, while Foxf1 is required for EC barrier function in the lung135. Foxq1 is enriched in the developing brain endothelium, but is not sufficient to induce expression of BBB markers60.
The third major cluster, enriched in the P8 and adult CNS endothelium, contained LEF1 (43 genes), DBP (96 genes), FOXP1 (532 genes) and NR3C1 (369 genes) GRNs. Lef1, which encodes an obligate binding partner of β-catenin in the nucleus, acts downstream of canonical WNT signaling to govern BBB function136–142. Nr3c1(nuclear receptor subfamily 3 group C member 1), which encodes a glucocorticoid receptor, regulates the WNT–β-catenin pathway143. Notably, Dbp(encoding albumin D-binding protein), a proline amino-acid-rich domain bZip (PAR bZip) transcription factor involved in circadian rhythm control in the BBB144,145, was increased in adult CNS ECs. smFISH confirmed that expression of BBB components, such as Cldn5 (encoding claudin-5), increases over time. This analysis also showed that transcriptional regulators identified by SCENIC, such as Plagl1, were enriched in the vasculature of the embryonic brain, whereas adult-enriched transcriptional regulators such as Dbp were robustly detected in the vessels of the P7 and adult mouse brain (Fig. 6g,h). Notably, many of the same GRNs identified by SCENIC (JUN, FOXF1, LEF1 and so on) were initially identified by our ATAC-seq approach (Fig. 4c).
Developmental trajectories of the mouse cerebrovasculature
Our scRNA-seq data contained a mixture of mitotic (Top2a, Mki67, Aurka), arterial (Fabp4, Fbln5, Vegfc, Gkn3, Bmx), angiogenic (Meox1, Angpt2), capillary (Hist1h1b, Car14, Gpatch1) and venous (Fmo2, Il1r1, Nr2f2, Ackr1) ECs (Fig. 7a–c and Supplementary Table 39). GO analysis revealed that Cap-1 and mitotic cells were enriched for processes related to mRNA splicing, cell cycle and mitosis. Mature clusters, such as Cap-2 and Art-2, were enriched for extracellular matrix organization, cell adhesion and negative regulation of cell proliferation (Extended Data Fig. 10).
Fig. 7 |. Temporal transcriptomic profiling of the mouse cerebrovasculature.

a, UMAP of ECs (from Fig. 6) colored coded by timepoint and clustered using Monocle 3 to show maturation across time. b, The same trajectory plot color coded by EC subtype. c, Feature plots for pan-EC (Cdh5, Pecam1), mitotic (Top2a), Cap-1 (Car2), Cap-2 (Fmo2), venous (Il1r1), angiogenic (Meox1), Art-1 (Igf1) and Art-2 (Hey1) markers. d, Pseudotime trajectory (solid black line; the dashed arrow indicates the direction of pseudotime progression) of arterial maturation projected onto the UMAP. Pseudotime scores are plotted for each single cell across the UMAP embedding in the figure. Gray cells are excluded and have no value. e, Arterial gene expression trends across pseudotime. f, Confocal micrographs of sections processed for smFISH for Stmn2 transcripts (magenta), along with antibody staining for the EC marker Cldn5 (yellow) and the smooth muscle marker SMA (white) to highlight arteries, and DAPI staining for nuclei (turquoise), from E12.5, P7 and adult mouse brains. The areas in the white boxes are magnified in the images below. g, Psuedotime trajectory of venous maturation. h, Venous gene expression trends across pseudotime. i, Confocal micrographs of sections processed for smFISH for Foxq1 transcripts (magenta), along with antibody staining for the EC marker Cldn5 (yellow) and the smooth muscle marker SMA (white) to distinguish arteries from veins, and DAPI staining for nuclei (turquoise), from E12.5, P7 and adult mouse brains. The areas in the white boxes are magnified in the images below. j, Heatmap showing the expression of arterial and venous gene modules across various populations. k, Feature plots of module expression across endothelial maturation. High value scores (red) indicate that the genes within the module are expressed higher than a set of randomized control genes in a single cell. Low module scores (blue) indicate that the genes in that module are expressed lower in aggregate compared with the background. A score of zero represents a module with equal expression to background.
Given the complexity of endothelial cell ontogeny, we separated arterial-like ECs for pseudotime trajectory analysis146. This analysis revealed a progression from a naive, mitotic identity to an intermediate arterial identity (Art-1), and ended at a mature arterial state (Art-2) (Fig. 7d). Markers of arterial maturation reflected this progression. For example, the expression of Plvap, which regulates selective permeability of endothelial fenestrations147, is elevated during development but decreased during BBB formation (Fig. 7e). Conversely, Stmn2 (stathmin-2), which encodes a microtubule-associated protein, was enriched in mature arterial endothelial ECs. Whether Stmn2 is a true marker of arterial maturation was unknown148,149. smFISH to visualize Stmn2 transcripts, combined with counterstaining for CLDN5 to label ECs, or smooth muscle actin staining to differentiate arteries from veins, confirmed our scRNA-seq results and validated Stmn2 as a marker of maturing arterial ECs (Fig. 7f).
The venous endothelium initiated from a mitotic origin in E9.5 and E12.5 ECs, and then transitioned through an early capillary (Cap-1) to an angiogenic (Angio) phase, and terminated in either a mature capillary (Cap-2) or venous (Venous) identity (Fig. 7g). Within this trajectory, the Apln expression peaked and then sharply decreased in mature venous ECs (Fig. 7h), consistent with previous reports150. smFISH showed that the expression of Foxq1, a transcription factor identified by SCENIC, increased in maturing venous ECs (Fig. 7i). Overall, these vignettes show that the trajectories derived from our scRNA-seq studies accurately inform on changes in endothelial cerebrovascular maturation.
We next quantified gene expression changes as a function of pseudotime (q value < 1 × 10−100). In total, 2,197 genes were differentially expressed across the arterial trajectory, while 2,866 transcripts changed during venous maturation. To avoid the pitfalls of relying only on clustering-based approaches151, we merged genes with similar expression patterns into co-expression modules (Fig. 7j). The arterial time course produced 16 modules, while the venous trajectory consisted of 20 modules (Supplementary Tables 40 and 41). While some modules overlapped between the trajectories (for example, arterial module 3, venous module 19), many were specific to one fate (for example, arterial module 7, venous module 5). Some modules were cluster specific, such as venous module 17, which marked angiogenic ECs. We next performed pathway enrichment analysis to predict the biological function(s) of these modules. Many of the enriched pathways in the modules were consistent with the pseudotime analyses, as arterial modules 1, 9, 12 and 14 showed enrichment for the cell cycle (Supplementary Fig. 1a and Supplementary Tables 42 and 43), and these same modules were enriched in the early mitotic cluster (Fig. 7b,k). Similarly, modules 1, 4 and 19, which were present in the mature Cap-2 and venous clusters, were enriched for blood vessel morphogenesis and positive regulation of cell migration (Supplementary Fig. 1b,c and Supplementary Tables 44 and 45).
Given the phenotypic plasticity of the endothelium152, we hypothesized that the expression of TFs enriched in mature CNS ECs should reprogram the endothelium to adopt a more BBB-like identity, while transcriptional regulators enriched in the leaky, sinusoidal endothelium of the liver should have the opposite effect.
To determine the optimal combination of BBB TFs, we focused our studies on those regulators identified by our bulk RNA-seq and ATAC-seq studies that were also identified in our scRNA-seq analyses, specifically FOXF1, FOXF2, LEF1, ZIC3, TCF7, TCF7L1 and TCF7L2. Expression of these individual factors increased electrical resistance across an endothelial monolayer (transendothelial electrical resistance (TEER)) compared with control cells. Conversely, a dominant negative TCF4 (dnTCF) had the opposite effect. At 48 h, TCF7 and FOXF1 yielded the highest resistance of the individual TFs. Given previous data implicating FOXF2 (ref. 60), we assayed their combined impact and found that they increased resistance compared with either factor alone (P < 0.05). These data were confirmed using Transwell permeability assays (Supplementary Fig. 2a,b).
We then tested various TF combinations to identify the optimal BBB-inducing TF cocktail. LEF1/ZIC3/TCF7/FOXF1/FOXF2, followed by LEF1/ZIC3/TCF7L2/FOX1/FOX2, enhanced barrier function in the TEER and Transwell assays over all other combinations, and provided the most robust induction of BBB-associated channels and transporters (ABCB1A, SLCO1A4, SLCO1C1, MFSD2A) and junctional markers (CLDN5, CDH5) (Supplementary Figs. 2c,d and 3a–d).
We compared the impact of this optimal BBB TF cocktail to regulators identified in our bulk RNA-seq and ATAC-seq mouse liver data, specifically MAFB, GATA2 and GATA4. While a role for MAFB in barrier function and an interaction with GATA2 and GATA4 in ECs have not been shown, our bulk RNA-seq and ATAC-seq studies revealed MAFA and MAFB DNA-binding motif enrichment (but only elevated Mafb transcripts). In addition, GATA2 and GATA4 are required for development153,154, and GATA4 overexpression represses continuous EC genes (Pecam1, Cav1, Emcn, Acvrl1, Sox18, Vegfa)67. Transduction of human umbilical vein endothelial cells (HUVECs) with the BBB factors induced robust impedance, yet the liver TFs, as well as dnTCF4, decreased barrier function (Fig. 8a–c). Markers of BBB maturation (ABCB1A, SLCO1A4, SLCO1C1, MFSD2A) and transcripts encoding junctional proteins (that is, CLDN5) were upregulated by the BBB cocktail, and unaffected or downregulated by dnTCF4 and the liver TFs. Notably, only the liver TFs induced the sinusoidal endothelial markers STAB1 and DNase1L3 (Fig. 8d,f). Immunostaining confirmed BBB TF induction of the tight junction markers CLDN5 and VE-cadherin (Fig. 8g). These functional studies highlight the utility of this resource to identify transcriptional regulators of organospecific EC maturation.
Fig. 8 |. Organ-specific transcription factors reprogram endothelial cell gene expression and alter barrier functionality.

a, Experimental workflow for HUVEC transduction with organ-specific transcription factor cocktails and subsequent functional analyses. b, Quantification of TEER across an endothelial monolayer over time, with T0 denoting the day of lentiviral-mediated transduction of the indicated transcription factors. c, Quantification of FITC-conjugated 40 kDa dextran leak across an endothelial monolayer in a Transwell permeability assay following lentiviral transduction with the indicated transcription factors. d–f, qRT–PCR analysis of the induction of BBB-related endothelial markers (d), genes encoding junctional proteins (e) and sinusoidal liver endothelial transcripts (f) following transduction of HUVECs with the indicated transcription factors. Expression is relative to non-transduced cells. Non-trans, non-transduced. g, Representative images of HUVECs immunostained for the junctional proteins VE-cadherin (cyan) and Claudin5 (yellow), with nuclei labeled by DAPI (gray) staining, and visualization of the mCherry reporter (magenta) following transduction with the indicated transcription factor(s). There were three biological replicates, each containing three technical replicates, for each experiment. Data shown are mean ± s.d. *P < 0.05; **P < 0.01; ***P < 0.001; ****P < 0.0001 (two-way ANOVA with Tukey’s multiple-comparison test). Panel a created with BioRender.com.
Discussion
Herein we have established a lexicon of common, accessible regions of open chromatin present within the endothelium of six organs, across development, and identified a core set of enriched transcription factor DNA binding motifs present in most ECs. Furthermore, we have also identified uniquely accessible chromatin regions in ECs of specific organs, along with the possible transcription factors that act on these regions, which may generate the functional heterogeneity evident within these different vascular beds85. We also show that these regulatory regions, and the transcription factor motifs within them, are conserved in the human CNS endothelium. Finally, using single-cell transcriptomic approaches, we uncovered numerous novel gene regulatory networks governing cerebrovasculature maturation and validated these putative regulators in vitro.
As expected given the role of ETS TFs in endothelial biology, the DNA-binding motif for this family of TFs was the most commonly occurring DNA binding site within accessible chromatin of the endothelium (regardless of organ identity)155. Other common, core motifs were those of the SOX transcription factor family48,51. Critically, organ-specific signatures also emerged, such as NFAT, AP1, SOX4 and 3, and RFX1 and 2 and FOXD3 in the heart. By analyzing samples from developing and mature organs, we identified transitions in motif usage and TF expression, such as the shift from ETS factors in angiogenic E12.5 brain ECs to FOX family members in the adult CNS endothelium. This catalog of chromatin landscapes and gene expression signatures of ECs from different organs, across development, can be used to generate new hypotheses regarding endothelial specialization, maturation and homeostasis.
Notably, the major DNA-binding motifs found in the mouse adult cerebrovasculature were present in a human cell culture BBB model and shared similar GO signatures. Future studies will interrogate the role these conserved brain-specific regulatory elements play in modulating gene expression in vivo.
Given the differences between the pre- and post-BBB endothelium156, we sought to identify the transcriptional networks mediating CNS maturation. Our scRNA-seq studies identified novel GRNs in the early brain, such as SOX11, PLAG1 and E2F1, and confirmed our ATAC-seq results. Whether the unique TFs identified herein, such as FOXF1, regulate BBB maturation remains unknown. We also identified LEF1, NR3C1 and DBP regulons in the adult brain endothelium. These data are consistent with a requirement for Lef1 in BBB maturation59,142,157,158, reports suggesting Dbp controls circadian rhythms within the CNS145,159 and studies suggesting NR3C1 plays a role in aneurysms160,161.
Previous data show FOXF2, FOXL2 and ZIC3 are enriched in the E14.5 mouse brain endothelium, and the expression of FOXF2 and ZIC3 induced the BBB ABCB1, TNFRSF19 and SLCO2B1 in HUVECs60. Our bulk RNA-seq and ATAC-seq data confirm that these TFs, as well as their DNA-binding motifs, are present in maturing cerebrovascular ECs. However, filtering these DNA-binding motifs against actual TF expression showed that FOXF1 (not FOXF2) was enriched in brain ECs, while scRNA-seq identified FOXF1 GRNs in the adult CNS endothelium. Our functional validation in HUVECs also confirmed that FOXF1 increased barrier function and BBB gene expression more robustly than FOXF2.
The four mammalian TCF genes (LEF1, TCF7, TCF7L1 (TCF3) and TCF7L2 (TCF4)) recognize nearly identical DNA sequences (5′-C/GATCAAGC/G-3′), overlap in their chromatin occupancy and show partial functionally redundancy162–165. While the expression of each individual TCF increased barrier function and BBB-related markers, TCF7 showed the most potent interaction when combined with LEF1, ZIC3, FOXF1 and FOXF2. Conversely, the transduction of TFs enriched in liver ECs (MAFB, GATA2 and GATA4) increased barrier permeability and induced the expression of the sinusoidal EC markers. Future investigations will determine whether TFs enriched during organogenesis or EC homeostasis (that is, E12.5, P6 and adult) control organotypic endothelial maturation.
Cell trajectory analysis identified unique gene expression modules within EC subpopulations during the transition from a mitotic and proliferative signature in the early cerebral endothelium to mature arterial, capillary and venous fates in the adult brain. GRNs having differential activity in early angiogenic ECs versus homeostatic adult brain ECs may play a role in controlling endothelial maturation. Future studies will determine whether human BBB differentiation features similar GRNs and whether these trajectories and the GRNs enriched within these populations are altered in animal models of neurovascular disease featuring BBB disruption.
Limitations of the present study
The transcriptional status of many loci is not determined by differential chromatin accessibility, but by differential recruitment of the transcriptional machinery or posttranslation modification of already engaged protein complexes (for example, Pol II pause–release)43,166–168. Herein we have linked potential cis regulatory elements to nearby target genes, not directly measured physical contacts, and these putative enhancers have not been validated. Bulk nuclear RNA-seq yielded fewer transcripts than bulk whole-cell RNA-seq. Whether this was due to the loss of cytoplasmic RNA or inadequate input material is unclear. Finally, the chromatin accessibility data from cultured ECs do not reflect the transcriptional complexity of the adult human brain.
Methods
Mice
All mouse protocols were approved by the Institutional Animal Care and Use Committee at Baylor College of Medicine and the University of Virginia. For all experiments, noon on the day a vaginal plug was discovered was considered E0.5, the day of birth was considered P0 and all adult mice were 8 weeks of age. Mice were housed with access to food (normal chow diet) and water ad libitum on a 12-h light–12-h dark cycle at 21 °C and 50–60% humidity.
Genotyping and mice used
Cdh5-BAC-CreERT2 mice (MGI, number 3848982) were from R. Adams (Max Planck Institute for Molecular Biomedicine). Rosa26-Sun1-sfGFP-6xMyc (for example, R26Sun1GFP; MGI, number 5443817) was purchased from Jax. Genotyping for all alleles was performed by PCR using the gene-specific primers listed in Supplementary Table 46.
Mouse endothelial nuclear isolations
For embryonic analysis, tamoxifen (0.015 mg per kg (body weight)) was administered to pregnant dams by intraperitoneal injection at E10.5 and embryos were collected at E12.5. For postnatal tissues, tamoxifen (0.015 mg per kg (body weight)) was administered by subcutaneous injection at P1 and P3, and tissues were collected at P7. For adult experiments, tamoxifen (0.015 mg per kg (body weight)) was administered by intraperitoneal injection 7 days before tissue isolation. In all cases, after gross dissection, GFP expression within the vasculature of each tissue of interest (or embryo) was confirmed by direct immunofluorescence for each sample collected. GFP-negative samples were not processed further. Nuclear isolation was performed according to ref. 15. Briefly, fresh tissue was collected on ice in Buffer HB++ composed of 0.25 M sucrose, 25 mM KCl, 5 mM MgCl2, 20 mM tricine–KOH, pH 7.8 with protease inhibitors (Roche/Sigma, catalog number 11873580001), 1 mM DTT (Sigma D0632), 0.15 mM Spermine (Sigma S1141), 0.5 mM Spermidine (Sigma S2501) and RNAse inhibitors (Promega N2611) and immediately dissected and minced into 1-mm by 1-mm portions with curved scissors. Tissue was transferred along 1 ml of HB++ in a chilled Eppendorf tube in ice and homogenized using a Bio-gen Series PRO200 homogenizer. Short bursts of ~5–8 s were done to prevent overheating. Once no large pieces were observed, the tissue was transferred to large-clearance dounce homogenizer ‘A’ (7 ml; Kontes Glass Company) and 4 ml of HB++ was added. Tissue was homogenized with 20 strokes and transferred to a small-clearance homogenizer ‘B’; 320 μl of 5% IGEPAL CA-630++ in HB++ was added, and the tissue was dounced with the tight pestle 20 more times, slowly to avoid creating bubbles and disrupting cell membranes. The homogenate was then strained using a 40-μm cell strainer into a 50-ml conical tube. Subsequently, 5 ml of working solution of 5 volumes of Optiprep solution (Sigma, D1556) and one volume of diluent (150 mM KCl, 30 mM MgCl2, 120 mM tricine–KOH, pH 7.8 in water) were added, homogenized by inversion and poured into an empty prechilled 30 ml Corex tube. Once all samples were ready, with the use of a pipette aid, the tip was placed just above the bottom surface of the Corex tube, and the sample was slowly underlying with 7.5 ml of the 30% and then 4 ml of the 40% iodixanol++ solutions (diluted with buffer HB). Nuclei were then isolated by density gradient centrifugation with Optiprep density gradient medium. Nuclei were collected from the 30–40% interface and then pre-cleared with Protein-G Dynabeads (Life Technologies, 10003D). A portion of these nuclei was held back for use as input samples. Next, GFP+ nuclei were immunoprecipitated with an anti-EGFP antibody (Thermo Fisher, number G10362; ABfinity rabbit monoclonal anti-GFP antibody; 0.2 mg ml−1) for 40 min at 4 °C with gentle agitation, followed by binding to Protein-G Dynabeads (Invitrogen, 10003D) for 20 min at 4 °C to enrich for endothelial cell nuclei. Isolated nuclei were filtered using a 20-μm Celltrics filter (Sysmex, number 04-004-2326).
Specific amounts of tissue and yields of nuclei from each tissue are listed below. For INTACT and downstream ATAC-seq and nuclear RNA-seq, tissue was collected from mice on a mixed Cdh5-PAC-CreER; Rosa26lsl-Sun1-sfGFP (FBV and C57/BL6) genetic background. In most cases, tissues were pooled from multiple animals and used as a single biological sample. The total number of biological samples for ATAC-seq and RNA-seq for each organ are shown in Supplementary Table 1. For adult hearts, 4 hearts (2 male, 2 female) were used per INTACT experiment, with 80% of the tissue processed resulting in a total of 1.07 × 10⁶ isolated nuclei. For adult lungs, 2 lungs (1 male, 1 female) per INTACT experiment were used with 60% of the tissue processed and resulting in a total of 1.1 × 10⁶ isolated nuclei. Ten adult retinas (3 female, 2 male) were used per INTACT experiment resulting in 50,000 isolated nuclei. One adult brain was used per INTACT experiment (3 total experiments, 2 EC samples were 1 male and 1 female, while the 1 input sample was from the male), resulting in 1.45 × 10⁶ isolated nuclei. One adult liver was used per INTACT experiment, with 50% of the tissue processed resulting in 5 × 10⁵ isolated nuclei. Four adult kidneys (2 male, 2 female) were used per INTACT experiment with 60% of the tissue processed and resulting in 8.5 × 10⁵ isolated nuclei. Eight P7 hearts (3 male, 5 female) were used per INTACT experiment resulting in 9 × 10⁵ isolated nuclei. Four P7 lungs (2 male, 2 female) were used per INTACT experiment resulting in 395,000 isolated nuclei. Sixteen P7 retinas (3 male, 5 female) were used per INTACT experiment resulting in 85,000 isolated nuclei. Six P7 brains (3 male, 3 female) were used per INTACT experiment with 60% of the tissue processed and resulting in 1 × 10⁶ isolated nuclei. Eight P7 livers (3 male, 5 female) were used per INTACT experiment with 60% of the tissue processed and 6.7 × 10⁵ isolated nuclei. Eight P7 kidneys (3 male, 5 female) were used per INTACT experiment resulting in 1.2 × 10⁶ isolated nuclei. Five E12.5 trunks (sex undetermined) were used per INTACT experiment resulting in 1.0 × 10⁶ isolated nuclei. Five E12.5 brains (sex undetermined) were used per INTACT experiment resulting in 1.5 × 10⁵ isolated nuclei. Five E12.5 hearts (sex undetermined) were used per INTACT experiment resulting in 47,000 isolated nuclei. Each isolation was performed at least twice.
ATAC-seq
Approximately 50,000 bead-bound EGFP+ and 50,000 input nuclei from mouse tissues were used as input for ATAC-seq. ATAC-seq libraries for mouse ECs were processed as previously described169, and libraries were generated using the Nextera DNA Sample Preparation Kit (Illumina, FC-121-1030). The quality of purified DNA libraries was checked using an Agilent High Sensitivity DNA kit (Agilent Technologies). Paired-end, 2 × 75 bp sequencing was performed on an Illumina NextSeq 500 instrument. Reads were mapped to the mm10 version of the mouse genome using Bowtie2 with default paired-end settings170. Mitochondrial reads, reads with a mapping quality (MAPQ) < 10 and reads that did not align with the reference genome were removed using Samtools (version 1.13)171. Duplicated reads were then removed with Picard MarkDuplicates172. Peak calling was carried out with MACS2 (callpeak –nomodel –broad) (v2.2.7.1)173. Diffbind (version 3.2)174,175 was used to import peaksets (min.overlap= 0.66) into RStudio Server (version 1.4.1717; https://www.rstudio.com) using R (version 4.1)176. The dba.blacklist function was used to filter out peaks that overlap with the ENCODE blacklist. Differentially accessible regions between the endothelium and the input nuclei of each organ were extracted using DESeq2 (version 1.32.0)177 with P < 0.5 and >1 fold change difference. Endothelial-enriched peaks from each organ were compared using the mergepeaks function in Homer (version 4.11)41. Peaks present in all organs were used for analysis in Fig. 2. Peaks present in single organs were used for analysis in Fig. 3 and Extended Data Figs. 3–6. Motif enrichment analysis was conducted with findMotifsGenome and enrichment graphed as previously described178. Graphs for individual motif distance from peaks were created using annotatePeaks in Homer and presented in an enrichment plot178. GO analysis was done using GREAT (version 4.0.4)40.
Nuclear RNA-seq
In parallel with our ATAC-seq experiments, all remaining bead-bound EGFP+ nuclei were processed for RNA extraction using the RNeasy Plus Micro kit (Qiagen). Nuclear RNA-seq libraries were constructed with the Stranded RNA-seq Kit with Ribo Erase (Kapa Biosystems, KK8484) with custom Y-shaped adaptors. Paired-end 2 × 75 bp NSQ 500/550 Hi Output KT v2.5 – 75 CYS (Illumina, 20024906) was performed for RNA-seq libraries on an Illumina NextSeq 500 instrument. Reads were first mapped to the mouse genome (mm10) using Salmon (version 1.5.1)179. Transcript-level quantification was then imported using txtimport (version 1.20.0)180 and analyzed using DESeq2 (ref. 177). Differentially expressed genes between the endothelial and input nuclei were defined as those transcripts with an expression log2(FC) > 0.5 and Benjamini–Hochberg adjusted P value (q value) < 0.1. Volcano plots were created using EnhancedVolcano (version 1.10.0)181.
Magnetic activated cell sorting for mouse scRNA-seq
Brain tissue was processed for CD31 MACS with slight variations depending on the timepoint analyzed. For embryonic brains (E9.5, E12.5, E16.5), embryos from timed C57BL/6 mouse matings were collected in ice-cold buffer HBSS++ (HBSS plus FBS, pen–strep and HEPES). Dissected brains were pooled and then placed in 250 μl of collagenase (1 mg ml−1) and placed at 37 °C for 15 min. Tissue was pipetted up and down every 2 min, first with a P1000, and then with a P200, until few to no clumps of tissue were visible. For P8 and adult samples, the cortex from an equal number of male and female C57BL/6 mice was dissected and pooled (10 brains for the P8 sample, 4 brains for the adult sample), and cells were dissociated using the neural tissue dissociation kit P (Miltenyi, 130-092-628). For all timepoints, the cell suspension was pelleted (5 min, 800 × g), washed two times with phosphate-buffered saline (PBS) and then resuspended in 180 μl of MACS PEB buffer (PBS (pH 7.2), 0.5% bovine serum albumin and 2 mM EDTA). The cell suspension was then incubated for 15 min with 20 μl of anti-CD31 MicroBeads (Miltenyi Biotec, catalog number 130-097-418) at 4 °C. Cells were then washed with 1 ml of PEB buffer, centrifuged at 300 × g for 5 min and applied to an MS column (Miltenyi, 130-042-201) on a magnetic stand. After three consecutive washes on a magnetic stand with PEB, cells were collected in 0.5 ml of PEB and then pelleted at 300 × g for 10 min at 4 °C. Cells were then resuspended in 1× PBS at a concentration of 50,000 cells per 50 μl, with a viability ≥90% as determined by trypan blue staining, and then used for downstream applications (see below).
scRNA-seq of mouse brain cells
scRNA-seq libraries were generated using the 10x Chromium Single Cell 3′ v2 reagent kit, according to the manufacturer’s instructions, and were sequenced on an Illumina NextSeq 500. Briefly, raw sequencing data were handled using the 10x Genomics Cell Ranger software (www.10xgenomics.com). Fastq files were mapped to the mm10 genome, and gene counts were quantified using the Cell Ranger count function. Subsequently, expression matrices from each experiment were merged and then imported into Seurat (version 4.0.4)117 (https://satijalab.org/seurat/) for log normalization. Cells with a percentage of mitochondrial reads above 10%, and with fewer than 250 features, were filtered out. Batch effects were corrected by regressing out the number of mitochondrial read percentage using the vars.to.regress function. Doublet contamination was removed using DoubletFinder (version 2.0.3)182. Sample integration was achieved using SCTransform (version 0.3.2)183 before running principal component analysis was performed and significant principal components were used for graph-based clustering. Uniform Manifold Approximation and Projection (UMAP) was used for two-dimensional visualization (https://github.com/lmcinnes/umap). To correct for batch effects, we used Harmony 1.0 (ref. 184). For finding clusters, we used the FindClusters function with a resolution of 0.3. Differential expression of genes per cluster was performed using the Wilcoxon rank sum test (FindMarkers function default). To identify transcription factors regulating the changes in gene expression across endothelial development, we use SCENIC (version 1.2.4)127. Both ±500 bp and ±10 kb around the mouse TSS motif ranking databases were used for the analysis with default parameters.
Cell cluster identities were determined using previously established marker genes validated in the literature185 or the online tool CellKb (https://www.cellkb.com)186 leading to the identification of astrocytes or radial glia (Mdk1+, Igfbp5+, Meis2+, Eno1+)187, ECs (Cldn5+, Pecam1+, Slco1c1+), pericytes (Abcc9+, Kcnj8+, Pdgfrb+, High1b+, Vtn+, Cspg4+) and SMCs (Acta2+, Tagln+)188, macrophages or megakaryocytes (Pf41+, Gp1bb+, Itga2b+, Clec1b+), and microglia (Cx3cr1+, Ccl3+, Csf1r+)189. To identify receptor–ligand interactions, we subset the endothelial, pericyte and microglia clusters from E9.5 and adult mice. The Wilcoxon signed ranked test was used to identify differentially expressed genes between timepoints in each cluster. Only genes present in at least 10% of cells and with a log fold change above 0.25 were considered. We then used CCInx (version 0.5.1)107 to identify interactions between cell populations across time. Results can be accessed at the interactive shinyapp (https://mcantug.shinyapps.io/Endo_CCInxE9Ad/). Upstream regulation of differentially expressed genes in E9.5 and adult samples was analyzed and visualized by circus plot using NicheNET (version 1.0.0)92 with default parameter settings. Only active ligands at the 95th quantile were shown.
Pseudotime analysis of scRNA-seq
For pseudotime analysis, we used Monocle 3 (version 1.0.0)146. To split the trajectories, we subset the main endothelial Seurat object by cluster. We then converted those objects into Moncole3 compatible cell_data_set (cds) object classes. We processed them according to default parameters. For root node selection, we purposefully chose nodes within the mitotic cluster for each trajectory. For projecting the individual trajectory pseudotime scores calculated in Monocle 3 back onto our original UMAP embedding (Fig. 5), we extracted the pseudotime scored from the Monocle 3 cds and added it to the Seurat object as cell metadata. To calculate the genes whose expression changes across pseudotime, we used the Monocle 3 graph test with a ‘prinicipal_grap’ setting. We subset the gene output that had a q value < 1 × 10−100. Gene modules were detected with the ‘find_gene_module’ function using default parameters. We then extracted all the genes from each individual gene module and used the AddModuleScore function in Seurat to perform co-expression module scoring on all single cells in the main dataset. Briefly, a gene-expression module score is determined by calculating the average expression of each gene within a list subtracted by the average expression of randomly selected control genes (there is no test statistic, but an aggregated expression score for the input gene list).
For gene enrichment analysis, we used Metascape190 (www.metascape.org). All gene enrichment procedures within metascape were performed with default statistical parameters (minimum overlap > 3 genes, P < 0.01, minimum enrichment > 1.5).
Omni-ATAC and RNA-seq of BBB hCMEC/D3 cells
Immortalized hCMEC/D3 (Millipore, SCC066) cells were grown to confluence using endothelial cell medium (ScienCell, number 1001) on plates coated with Collagen Type I Rat Tail (Sigma-Aldrich, number C7661). Passages four to six were used for experiments. ATAC libraries were processed as previously described191. The quality of purified DNA libraries was assessed using the Agilent High Sensitivity DNA kit (Agilent Technologies). Paired-end, 2 × 75 bp sequencing was performed on an Illumina NextSeq 500 instrument. Reads were mapped to the GRCh38 version of the human genome using Bowtie2 with default paired-end settings170. Mitochondrial reads, reads with a MAPQ < 10 and reads that did not align with the reference genome were removed using Samtools (version 1.13)171. Duplicated reads were then removed with Picard MarkDuplicates172. Peak calling was carried out with MACS2 (callpeak –nomodel –broad) (v2.2.7.1)173. Diffbind (version 3.2)174,175 was used to import peaksets (min.overlap= 0.66) into RStudio Server (version 1.4.1717, https://www.rstudio.com) using R (version 4.1; ref. 176). The dba.blacklist function was used to filter out peaks that overlap with the ENCODE blacklist. Consensus peaks were converted to mm10 using the LiftOver tool available from the UCSC Genome Browser (https://genome.ucsc.edu/cgi-bin/hgLiftOver). A region was considered conserved if a minimum 0.95 ratio of bases remapped to the mouse genome. Selected regions were also examined using the ECR Browser192 where the regions were analyzed using rVista 2.0 (ref. 193) to identify conserved transcription factor motifs. The TRANSFAC professional V10.2 vertebrate library was used with default parameters.
RNA was isolated using Trizol. Upon processing, RNA from all samples was thawed, and following confirmation of integrity and concentration using a Bioanalyzer, 100 ng was used for low-input library preparation using the NEBNext Ultra II RNA Library Prep kit for Illumina. The libraries were then quantified and sequenced using an Illumina NovaSeq 6000 at a depth of 20 million reads per sample. Reads were first mapped to the human genome (GRCh38) using Salmon (version 1.5.1)179. Transcript level quantification was then imported using txtimport (version 1.20.0)180 and analyzed using DESeq2 (ref. 177). Genes were kept and considered actively expressed if they had more than 10 raw counts and >2 log2(FC) normalized expression.
In situ hybridization and confocal imaging
Timed matings between C57BL/6 mice were set up, with noon of the day a vaginal plug was detected considered day 0.5. E12.5 embryos (sex undetermined) were collected, and embryonic tissues, as well as postnatal day 7 (P7) mouse brains from female and male mice, were immersion fixed in freshly made 4% PFA, 1× PBS and 0.1% Tween-20 overnight at 4 °C with gentle agitation. Three-week-old and adult brains from male C57BL/6 mice were processed identically, with the exception that they received a retrorbital (100 μl) and transcardiac (150 μl) injection of fluorescently labeled lectin (Vector Laboratories, number DL-1178-1) before tissue collection.
After overnight fixation, tissues were washed extensively before being mounted in 1% agarose and sectioned at 35 μm thickness using a Precisionary Instruments Compresstome (VF-300-Z). Sections were then mounted on Superfrost Plus Microscope Slides (Fisher Scientific, number 22-037-246) and then dried at 50 °C for 2 h. Slides were then washed with PBS for 5 min before being allowed to dry for another hour at 60 °C. A hydrophobic barrier around each of the samples was created using the ImmEdge Hydrophobic Barrier Pen (Advanced Cell Diagnostics, catalog number 310018). Sections were then fixed with 10% formalin for 15 min at 4 °C and then underwent successive dehydration steps using 50%, 70% and 100% ethanol. Each dehydration step was performed at room temperature and lasted for 5 min. Following ethanol dehydration, antigen retrieval was then performed using RNA Target Retrieval Reagent (Advanced Cell Diagnostics, catalog number PN 322000). Following antigen retrieval, samples were again serially dehydrated into absolute ethanol. The samples were then incubated in Protease III at 40 °C for 30 min before washing 5 times in ddH2O for 1 min each wash. Sections were then incubated in the desired probe (~5–7 drops per section) for 2 h at 40 °C. The slides were then washed 2 times in prepared 1× wash buffer (Advanced Cell Diagnostics, catalog number 310091) for 5 min each wash. Amplification and detection were performed using the RNAscope Multiplex Fluorescent Reagent Kit v2 (Advanced Cell Diagnostics, catalog number 323100). Sections were incubated with Amp1 for 30 min at 40 °C and then washed 2 times in 1× wash buffer (Advanced Cell Diagnostics) for 5 min. This process was repeated for Amp2 and Amp3. Horseradish Peroxidase for Channel 1 (Advanced Cell Diagnostics) was incubated with the sample for 15 min at 40 °C, and then the slides were washed two times in 1× wash buffer for 5 min each wash. Bound probes were detected by adding Opal Dye (Akoya, FP1496001KT) at a 1:1,000 dilution for 30 min at 40 °C, followed by washing two times in wash buffer for 10 min each wash at room temperature. Samples were then incubated in horse radish peroxidase blocking buffer for 30 min at 40 °C followed by two washes in 1× wash buffer for 10 min each wash. Following the RNA Scope steps, samples were then incubated in freshly prepared blocking buffer (10% goat serum, 1× PBS and 0.2% Triton X-100) for an hour at room temperature before adding Alexa Fluor 488-conjugated anti-Claudin-5 (Thermo Fisher; number 4C3C2, number 352588) (1:100) diluted in blocking reagent overnight at 4 °C.
The following day, samples were washed extensively in 1× wash buffer (Advanced Cell Diagnostics, catalog number 310091) before being stained with DAPI (ACD Biotechne, catalog number 320858) and mounting with Prolong Gold Antifade Mounting Medium (Thermo Fisher, catalog number P36930). Each assay was processed alongside a positive control slide probed for peptidyl-prolyl isomerase B (ACD Biotechne, catalog number 540651) and a negative control slide treated with dapB (ACD Biotechne, catalog number 707351).
Images were collected at a step size of 1 μm for a total stack size of 22 virtual slices using an LSM780 confocal laser scanning microscope (Zeiss) with a ×40 (NA = 1.4) oil objective; laser power = 0.8% (405 nm), 15.7% (488 nm), 2.0% (560 nm) and 5.5% (650 nm); and pinhole = 51 μm. A total of three images were taken per developmental timepoint. Stacks of 20–25 μm, at 0.2 μm per section, were acquired and then compressed to a maximum intensity projection using ZenBlack imaging software (Zeiss). Representative images from each developmental stage were exported as TIFs with individual and merged channels and exported to Adobe Illustrator to generate figures. The number of animals imaged is indicated in the figure legend, with male and female mice being used for the P7 analysis and only male mouse brains for the adult analysis.
Lentiviral cloning
A Gateway compatible middle entry (pME) plasmid containing luciferase followed by a carboxy terminal P2A cleavage peptide sequence and then a nuclear localized H2A mCherry reporter (JDW 926, pME-Luc-P2A-H2A-mCherry)194 was used as a template for subcloning each individual transcription factor of interest. Briefly, JDW 926 (pME-Luc-P2A-H2A-mCherry) was digested with BamHI and KpnI to remove luciferase, and then the transcription factor of interest, including a V5 epitope tag followed by a flexible GlyGlyAlaGlyGly (G2AG2) linker upstream of the open reading frame of the transcription factor, was amplified by PCR, digested to create compatible DNA overhangs with BamHI and KpnI, and then ligated to JDW 926 to create pME-V5-TF-P2A-H2A-mCherry. In the instances where a template was not available, a gene block was directly synthesized (Twist Biosciences) with 20–25-bp homology arms for cold fusion cloning (SBI Biosciences, MC100B-1) into JDW 926. The primers used, templates for PCR or synthesized gene blocks (Twist Biosciences) are listed in Supplementary Table 47.
JDW 947/pME-dnTCF4-P2A-mCherry contains a myc-tagged mouse dominant negative TCF4 (TCFL72) lacking the amino terminal 56 amino acids of TCF4, which mediate binding to β-catenin (the nuclear localization sequence and DNA binding domain in the c-terminus of TCF4 are intact, so it can still bind DNA), also referred to as myc-mTcf4ΔN. Of note, there is a missense mutation at the 5′ end, of AAC>GAC, which changes an N to a D residue; otherwise, the entirety of the insert is confirmed. A less conventional MYC tag (MQKLISEEDL) followed by a long linker is present upstream of mouse TCF4.
JDW 1391/pME-FLAG-FOXF1-P2A-H2A-mCherry was amplified from Addgene number 153122 (pCS2-FLAG-hFOXF1) (a gift of S. Koch).
All TCFs, GATAs, MAFs and FOXF2 middle-entry clones were LR recombined into pLenti6.2-CMV-DEST-PGK-BLAST (JDW 385) (Invitrogen, V36820) to generate lentiviral plasmids for packaging. FOXF1 and ZIC3 were LR recombined into pLenti-CMV-DEST-WPRE-SV40pro-BLAST (Addgene, number 17451) (JDW 1347). All plasmids will be available via Addgene: https://www.addgene.org/Joshua_Wythe/.
Lentivirus production and HUVEC transduction
For viral packaging, HEK-293T cells (ATCC-CRL3216) were maintained in DMEM, high glucose supplemented with 2 mM GlutaMAX (Gibco, 10566016), 10% FBS (HyClone Characterized FBS, New Zealand origin, 1,000 ml, irradiated 25-40kGy, number SH30406.02) and 1% Pen–Strep (Gibco, 15140122) on 10-cm plates (Corning, 430167). An endotoxin-free 10 μg mixture of equal amounts of the transfer plasmid containing a CMV promoter driving expression of the transcription factor of interest followed by a P2A cleavage sequence and then an H2A-mCherry reporter, along with three third-generation lentiviral packaging plasmids (pMDLg/pRRE containing Gag and Pol, Addgene, number 12251; pRSV-REV, Addgene, number 12253; and pMD2.G encoding VSV-G Env, Addgene, number 12259) was initially diluted in 250 μl of Opti-Mem (Gibco 31985962) before being further diluted in a 1:3 μg ratio with a 1 mg ml−1 solution of 25 kDa linear polyethylenimine (PEI) (Thermo Fisher, 043896.01). This mixture was then brought to a total volume of 500 μl with Opti-Mem. The DNA-PEI solution was incubated at room temperature for 20 min. Following incubation, the mixture was carefully added dropwise to cells. The plates were gently rocked back and forth to ensure an even distribution of the transfection mixture and then returned to a water-jacketed cell culture incubator set at 37 °C and 5% CO2. After 6 h, the medium was aspirated and replaced with antibiotic-free medium (DMEM (Gibco, 10566016) and 10% FBS (HyClone, number SH30406.02). Virus-containing conditioned medium was collected every 24 h post-transfection, over a total period of 72 h, and then centrifuged at 500 × g for 5 min at 4 °C before the supernatant was loaded onto a 10-kDa molecular weight cut-off centrifugal filter unit (Amicon UFC9010) and centrifuged at 500 × g for 35 min at 4 °C to render a final concentration of 20× (from 30 ml to 1.5 ml). The resulting conditioned medium was then aliquoted and snap frozen in liquid nitrogen and stored at −80 °C. Thawed concentrated conditioned medium was then added to low-passage HUVECs (ATCC, CRL-1730) as described below.
TEER measurements
Each well of a 24-well Transwell plate (Corning 3378) was incubated with 50 μl of rat tail collagen I (Corning CLS354236), diluted to a final concentration of 2 mg ml−1 in 1× PBS, for 1 h at room temperature. Following incubation with collagen, the collagen was aspirated and the Transwell plates rinsed twice with 1× PBS (Gibco, 10010023). After the Transwell plates were coated with collagen, 500 μl of complete endothelial cell growth medium was added to the lower chamber (Lonza, CC-3162) and 100 μl of the same medium was added to the top chamber to maintain the hydration of the Transwell membrane. Low-passage HUVECs were dissociated using TrypLE (Gibco, 12605010) and then neutralized by the addition of complete endothelial cell medium, after which 100 μl of a cell suspension (at a concentration of 5,000 cells μl−1, totaling 500,000 cells) was added to the top chamber. HUVECs were maintained on Transwell plates until confluence (defined as TEER of 100 ± 5 Ω cm−2) was maintained for over 24 h. TEER values were recorded at the same time each day following a 15-min equilibration period at room temperature. After confluence was confirmed, conditioned viral medium was premixed with complete endothelial cell media (ECM) before being added to the top chamber of the Transwell plate. Resistance measurements were taken every 6 h following viral transduction for a total of 48 h. TEER measurements were initially adjusted by subtracting the average values obtained from three Transwell plates that were not seeded with HUVECs. These adjusted measurements were then compared with the non-transduced condition. Each measurement was performed in triplicate per well, with three technical replicates analyzed for each of the three biological replicates. Impedance measurements were taken using the EVOM2 and the STX3 attachment (World Precision Instruments 91799).
FITC–dextran permeability assay
To assess cellular permeability, HUVECs were seeded in Transwell plates (Corning 3378) pre-coated with 50 μl of 2 mg ml−1 collagen I (Corning CLS354236) diluted in 1× PBS, (Gibco, 10010023) as described above. In total, 500,000 low-passage HUVECs were added to the top chamber of the insert and complete endothelial cell growth medium (Lonza, CC-3162) was added to both the upper and lower chambers. Cells were grown for 2 days to create a monolayer and then transduced with lentivirus containing the transcription factors as described above. After 48 h, 10 μl of 1 mg ml−1 40 kDa fluorescein isothiocyanate (FITC)–dextran (Sigma-Aldrich FD40S) was added to the upper chamber containing the cells and then the cells were incubated for 30 min at 37 °C and 5% CO2. Then, 10 μl of medium was collected from the bottom chamber and transferred into a 96-well plate (Corning, CLS3788). Fluorescence (excitation 485 nm, emission 535 nm) was measured using a Cytation TM 1 (BioTek, Agilent). Values are shown as arbitrary fluorescence units. Measurements were initially adjusted by subtracting the fluorescence values of each condition from the fluorescence value produced from the HUVEC medium. These adjusted measurements were then compared with the non-transduced condition. Each measurement was performed in triplicate per well, with three technical replicates analyzed for each of the three biological replicates.
Immunofluorescence and confocal imaging of HUVECs
HUVECs grown on Transwell membranes for permeability analysis were fixed onto the Transwell plates at the end of the experiment by incubating the inserts in a 24-well dish filled with 4% PFA (pH 7.4) and 1× PBS for 15 min at room temperature. Cells on the Transwell plates were then permeabilized in 0.1% Triton X-100 and 1× PBS for 30 min at room temperature, rinsed twice in 1× PBS at room temperature and then incubated in blocking buffer (1% bovine serum albumin (Fraction V), 0.1% Triton X-100 and 1× PBS) for 1 h at room temperature. The wells were then incubated with primary antibodies diluted in blocking buffer (at the concentrations indicated below) in a humidified chamber overnight at 4 °C. The following day, the cells were washed three times, 5 min per wash, in 1× PBS with gentle agitation on an orbital shaker at room temperature, and then incubated in Alexa dye-conjugated secondary antibody diluted in blocking buffer for 1 h at room temperature. The inserts were then washed for 5 min, three times, in 1× PBS, and then incubated in DAPI (diluted 1:1,000 in 1× PBS) to label nuclei. Finally, the inserts were washed for 5 min, three times, in 1× PBS. Transwell inserts were inverted and removed with a scalpel and then mounted on a glass slide (Fisher, 22-037-246) in Prolong Gold Antifade mounting medium (Thermo Fisher, P36930) and coverslipped. Antibodies and dyes used are listed in Supplementary Table 47.
Afterward, a total of 3 random 2,480 × 2,480 μm per pixel images per condition were obtained from 3 biological replicates on a ZEISS LSM 700 laser scanning microscope with a ×40 (NA = 1.4) oil objective; laser power = 2.0% (405 nm), 18.0% (488 nm), 8.0% (560 nm) and 2.5% (650 nm); and pinhole = 51 μm. Z-stacks of 10–15 μm, 0.2 μm per section, were collected and then compressed into a maximum intensity projection using ZenBlue imaging software (Zeiss). Representative images from each condition were then exported as both individual and merged channels as.TIF files to Adobe Illustrator. Representative images are shown.
qRT–PCR
A total of 3.0 × 10⁶ low-passage HUVECs were seeded onto collagen I-coated 10-cm plates (Corning, 430293) and cultured for 2 days in complete ECM medium. At 60% confluence, concentrated lentivirus-conditioned medium from HEK-293T cells was added to the HUVECs at a volumetric ratio of 1:5 conditioned medium to complete ECM. After 2 days, when nuclear mCherry expression was evident, cells were rinsed twice in 1× DPBS (Gibco, 14190144), and then lysed in 1,000 μl of Trizol (Invitrogen, 10-296-010). Lysates were collected and RNA extracted using the RNeasy Plus Kit (Qiagen, 74104). Total RNA was quantified by Nanodrop (Thermo Scientific ND-2000C) and 1 μg of total RNA was reverse transcribed in a 20-μl reaction using the high-capacity cDNA reverse transcription kit (Applied Biosystems, 43-688-14). The cDNA was then diluted 12.5-fold and 50 ng of the cDNA was subsequently used in a 20-μl qPCR with Sybr Green PCR Master Mix (Applied Biosystems 4309155). Data were normalized to TATA-box binding protein (TBP) using the ΔΔCt method195 and are shown as fold change (calculated as 2−ΔΔCt). Technical triplicates were analyzed for each biological sample, with three biological replicates (from different transduction experiments) analyzed per condition. Data were analyzed using PRISM software (GraphPad) and shown as the mean ± s.d. Statistical significance was determined using two-tailed Student’s t-test (for two groups) or a multi-way ANOVA (for multiple comparisons with more than two groups) with P < 0.05 considered significant.
Primers used for real-time quantitative reverse transcriptase polymerase chain reaction (qRT–PCR) were designed with the following criteria: ~100–250 bp size amplicon, span at least one exon–exon junction (if possible), generate a single amplicon (as determined by melt curve analysis and agarose electrophoresis) and show an efficiency above 90%. Primers are listed in Supplementary Table 49.
General statistics
Unless otherwise indicated, experiments were performed using a minimum of two independent biological replicates. The exact number of animals used per biological sample is indicated in each experimental method described above (for example, ‘Mouse endothelial nuclear isolations’ and the processing sections for the RNA-seq or ATAC-seq descriptions). Calculations to determine statistical significance are detailed within each experimental method section. For embryonic and adult mouse samples, a mixture of female and male samples was collected for all analyses.
Reporting summary
Further information on research design is available in the Nature Portfolio Reporting Summary linked to this article.
Extended Data
Extended Data Fig. 1 |. Lymphatic marker expression in RNA-Seq and ATAC-Seq.
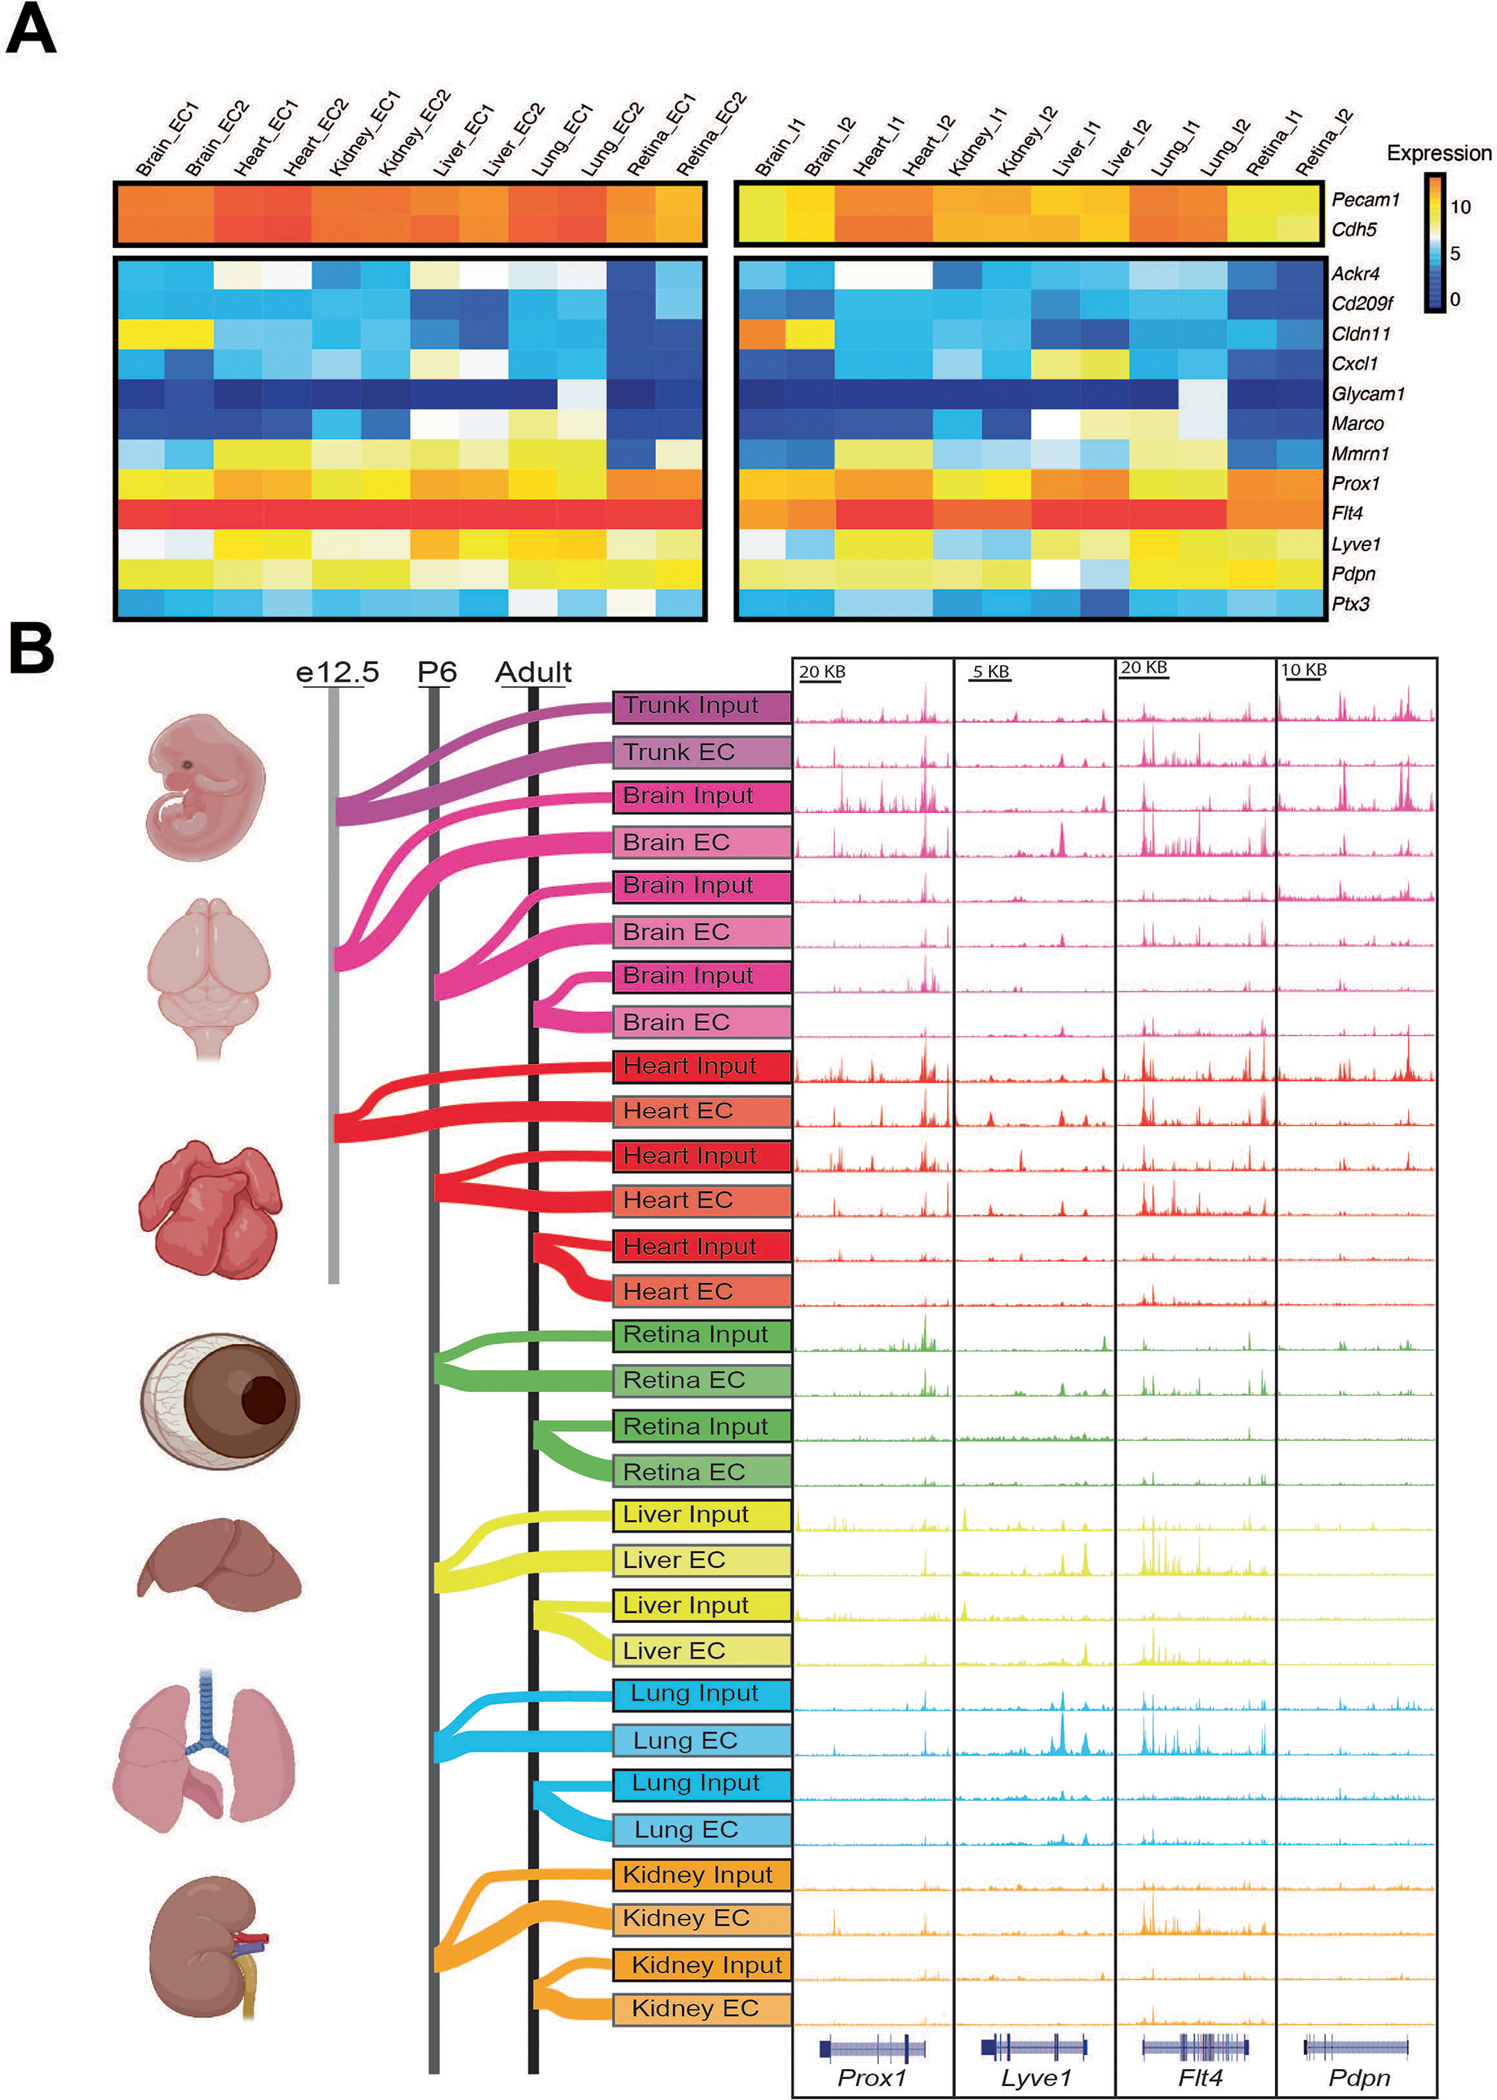
a) Expression levels of endothelial markers (top) and lymphatic markers (bottom) as determined by RNA-Sequencing of adult endothelial and input samples (normalized expression). b) Genome browser tracks of lymphatic markers in all ATAC-seq tissue samples reveals no substantial difference in genome accessibility at loci for lymphatic markers between input and endothelial enriched samples.
Extended Data Fig. 2 |. Transcription factor expression and motif presence across all organs.
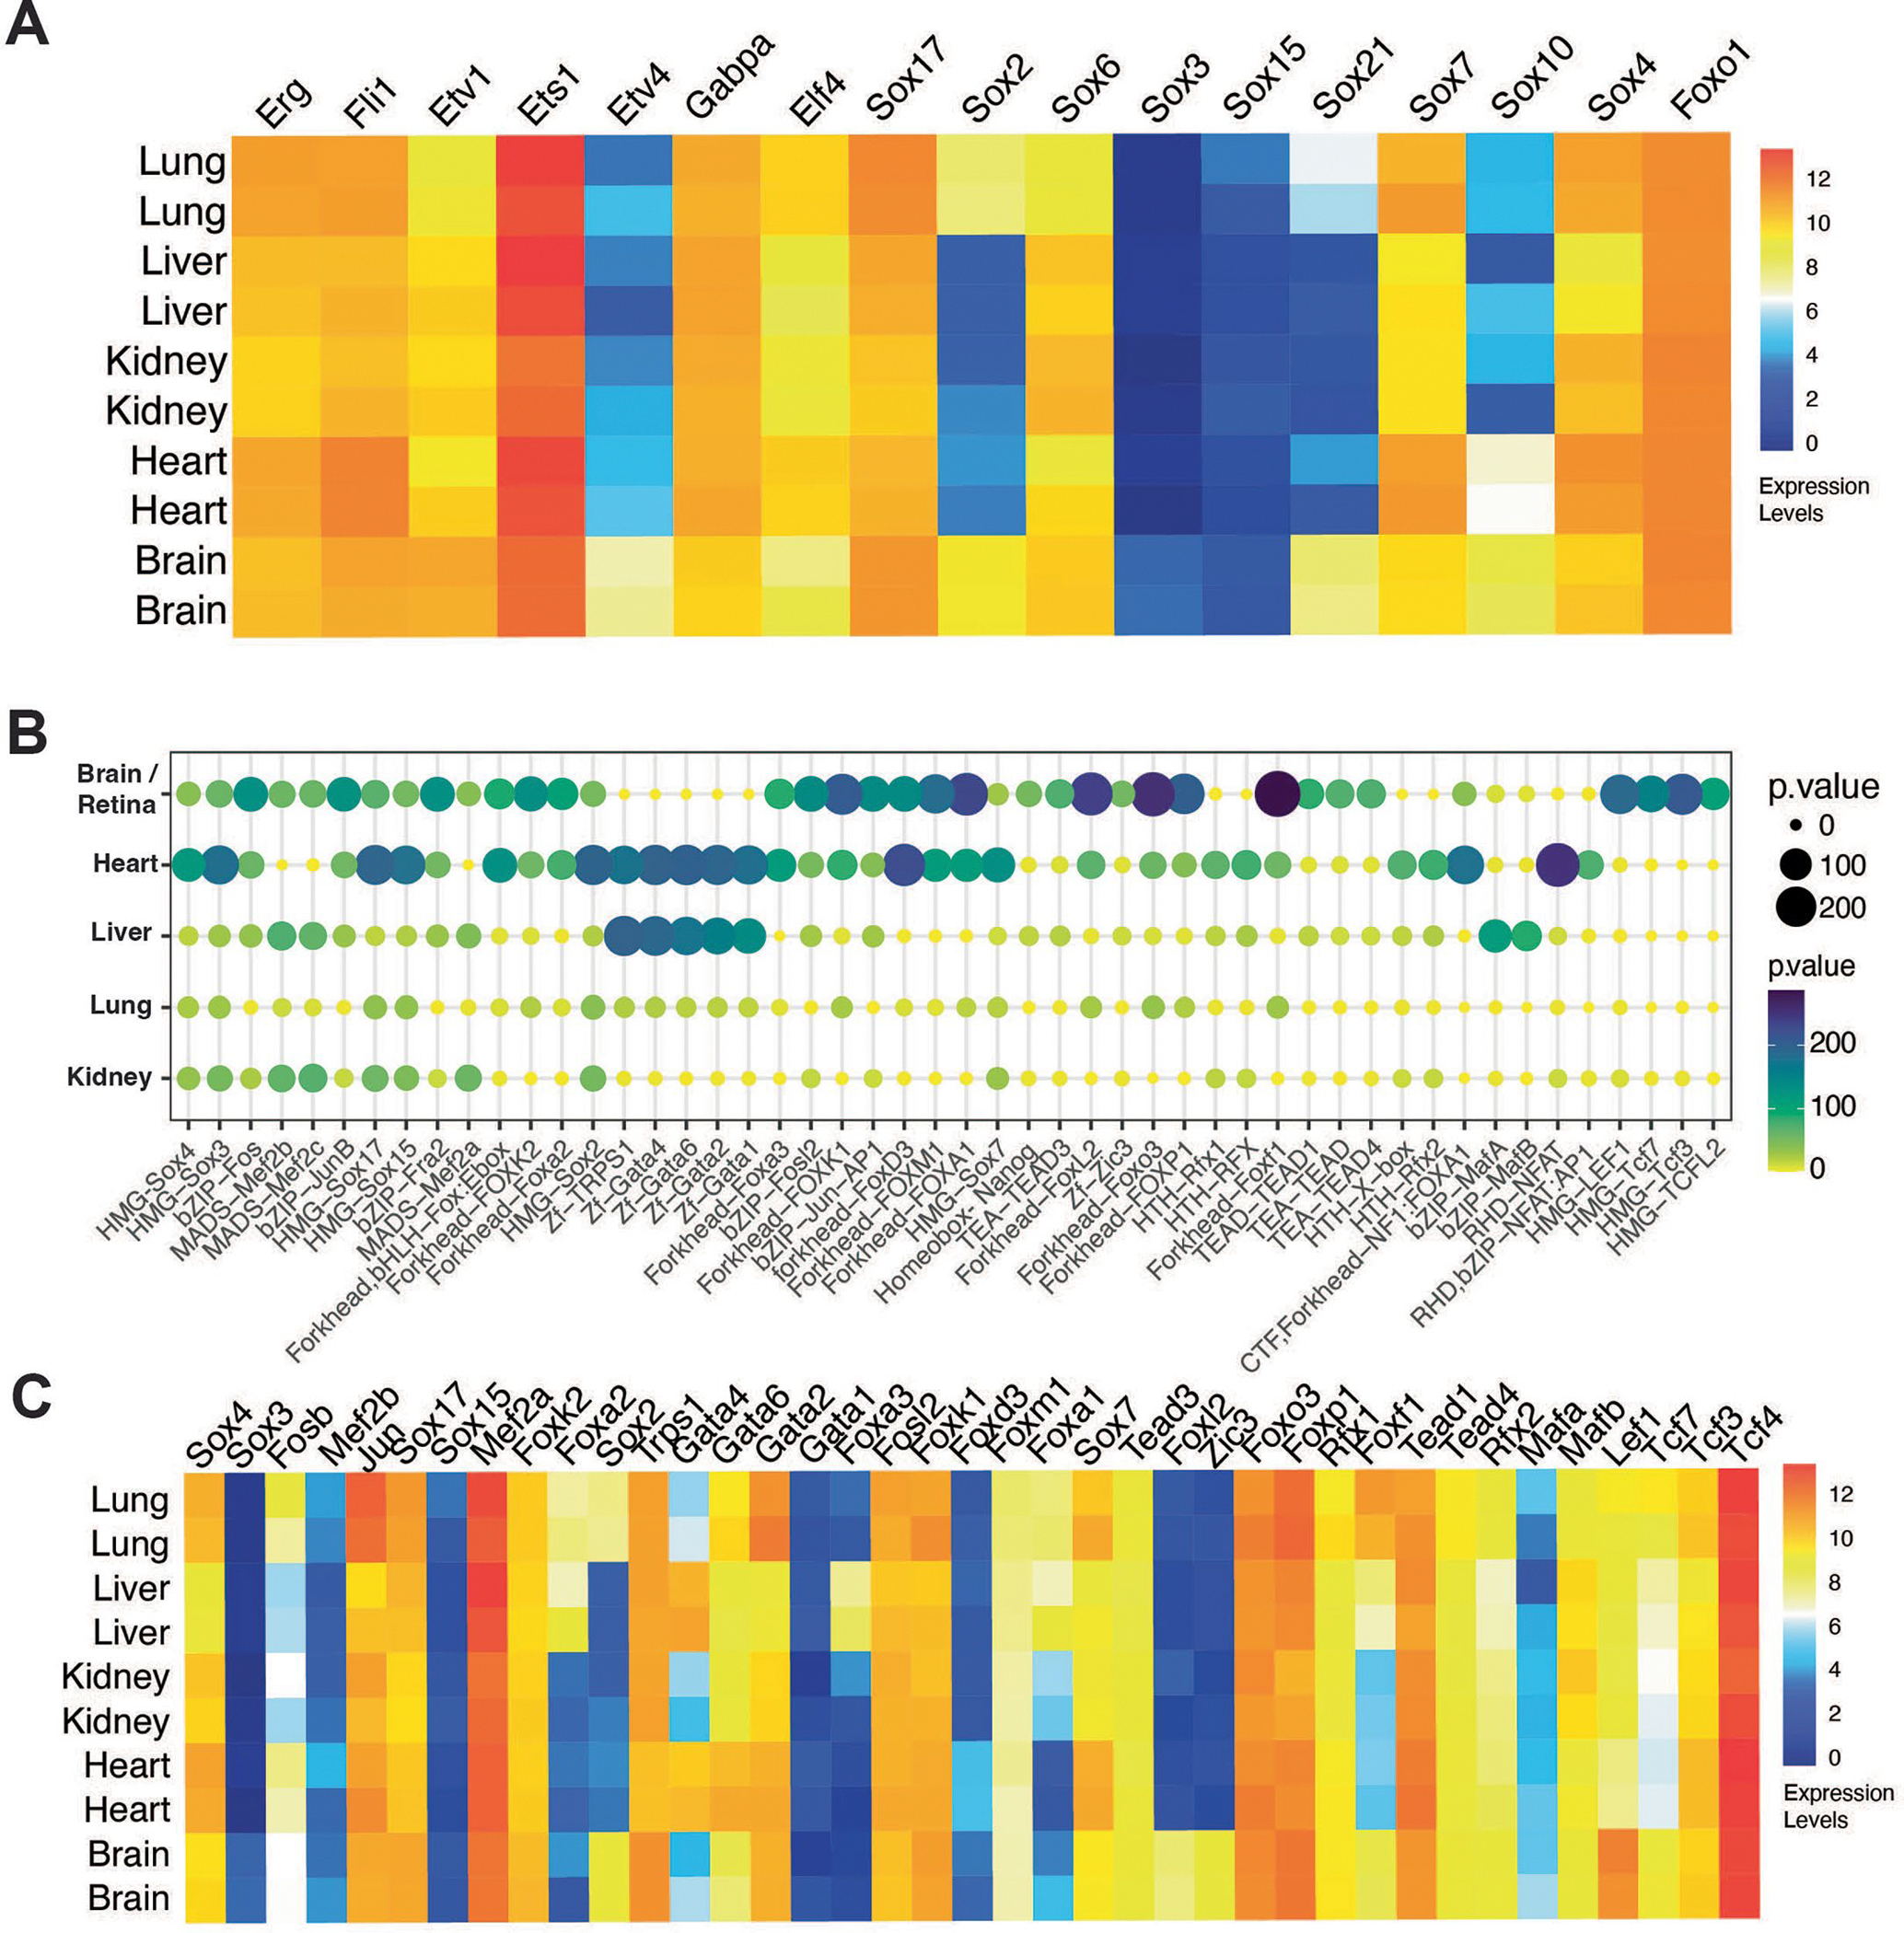
a) Expression levels of common transcription factors (related to Fig. 2) across the adult endothelium (normalized expression). b) Enriched motifs identified by HOMER (one-tailed Fisher’s exact test) from all organs, with all timepoints condensed into one sample per organ. Size of the bubble and the color represent the p-value. The top 50 motifs are shown (values represent the −log10 of the p-value). c) Expression levels of enriched transcription factors across the adult endothelium (normalized expression).
Extended Data Fig. 3 |. Chromatin Accessibility Changes Across Time in the Heart Endothelium.

a) Differential chromatin accessibility determined by ATAC-Seq peaks in the heart endothelium (11,079 peaks) at E12.5, postnatal day 6 (P6) and adult (2-month-old) mice. b) Biological processes from expressed genes and with accessible chromatin in each timepoint. c) Top 10 transcription factor motifs ranked by gene expression for each age. Log2 expression over input indicated in the y-axis. Motif enrichment p-value (one-tailed Fisher’s exact test) is shown according to the dot size.
Extended Data Fig. 4 |. Chromatin Accessibility Changes Across Time in the Liver Endothelium.
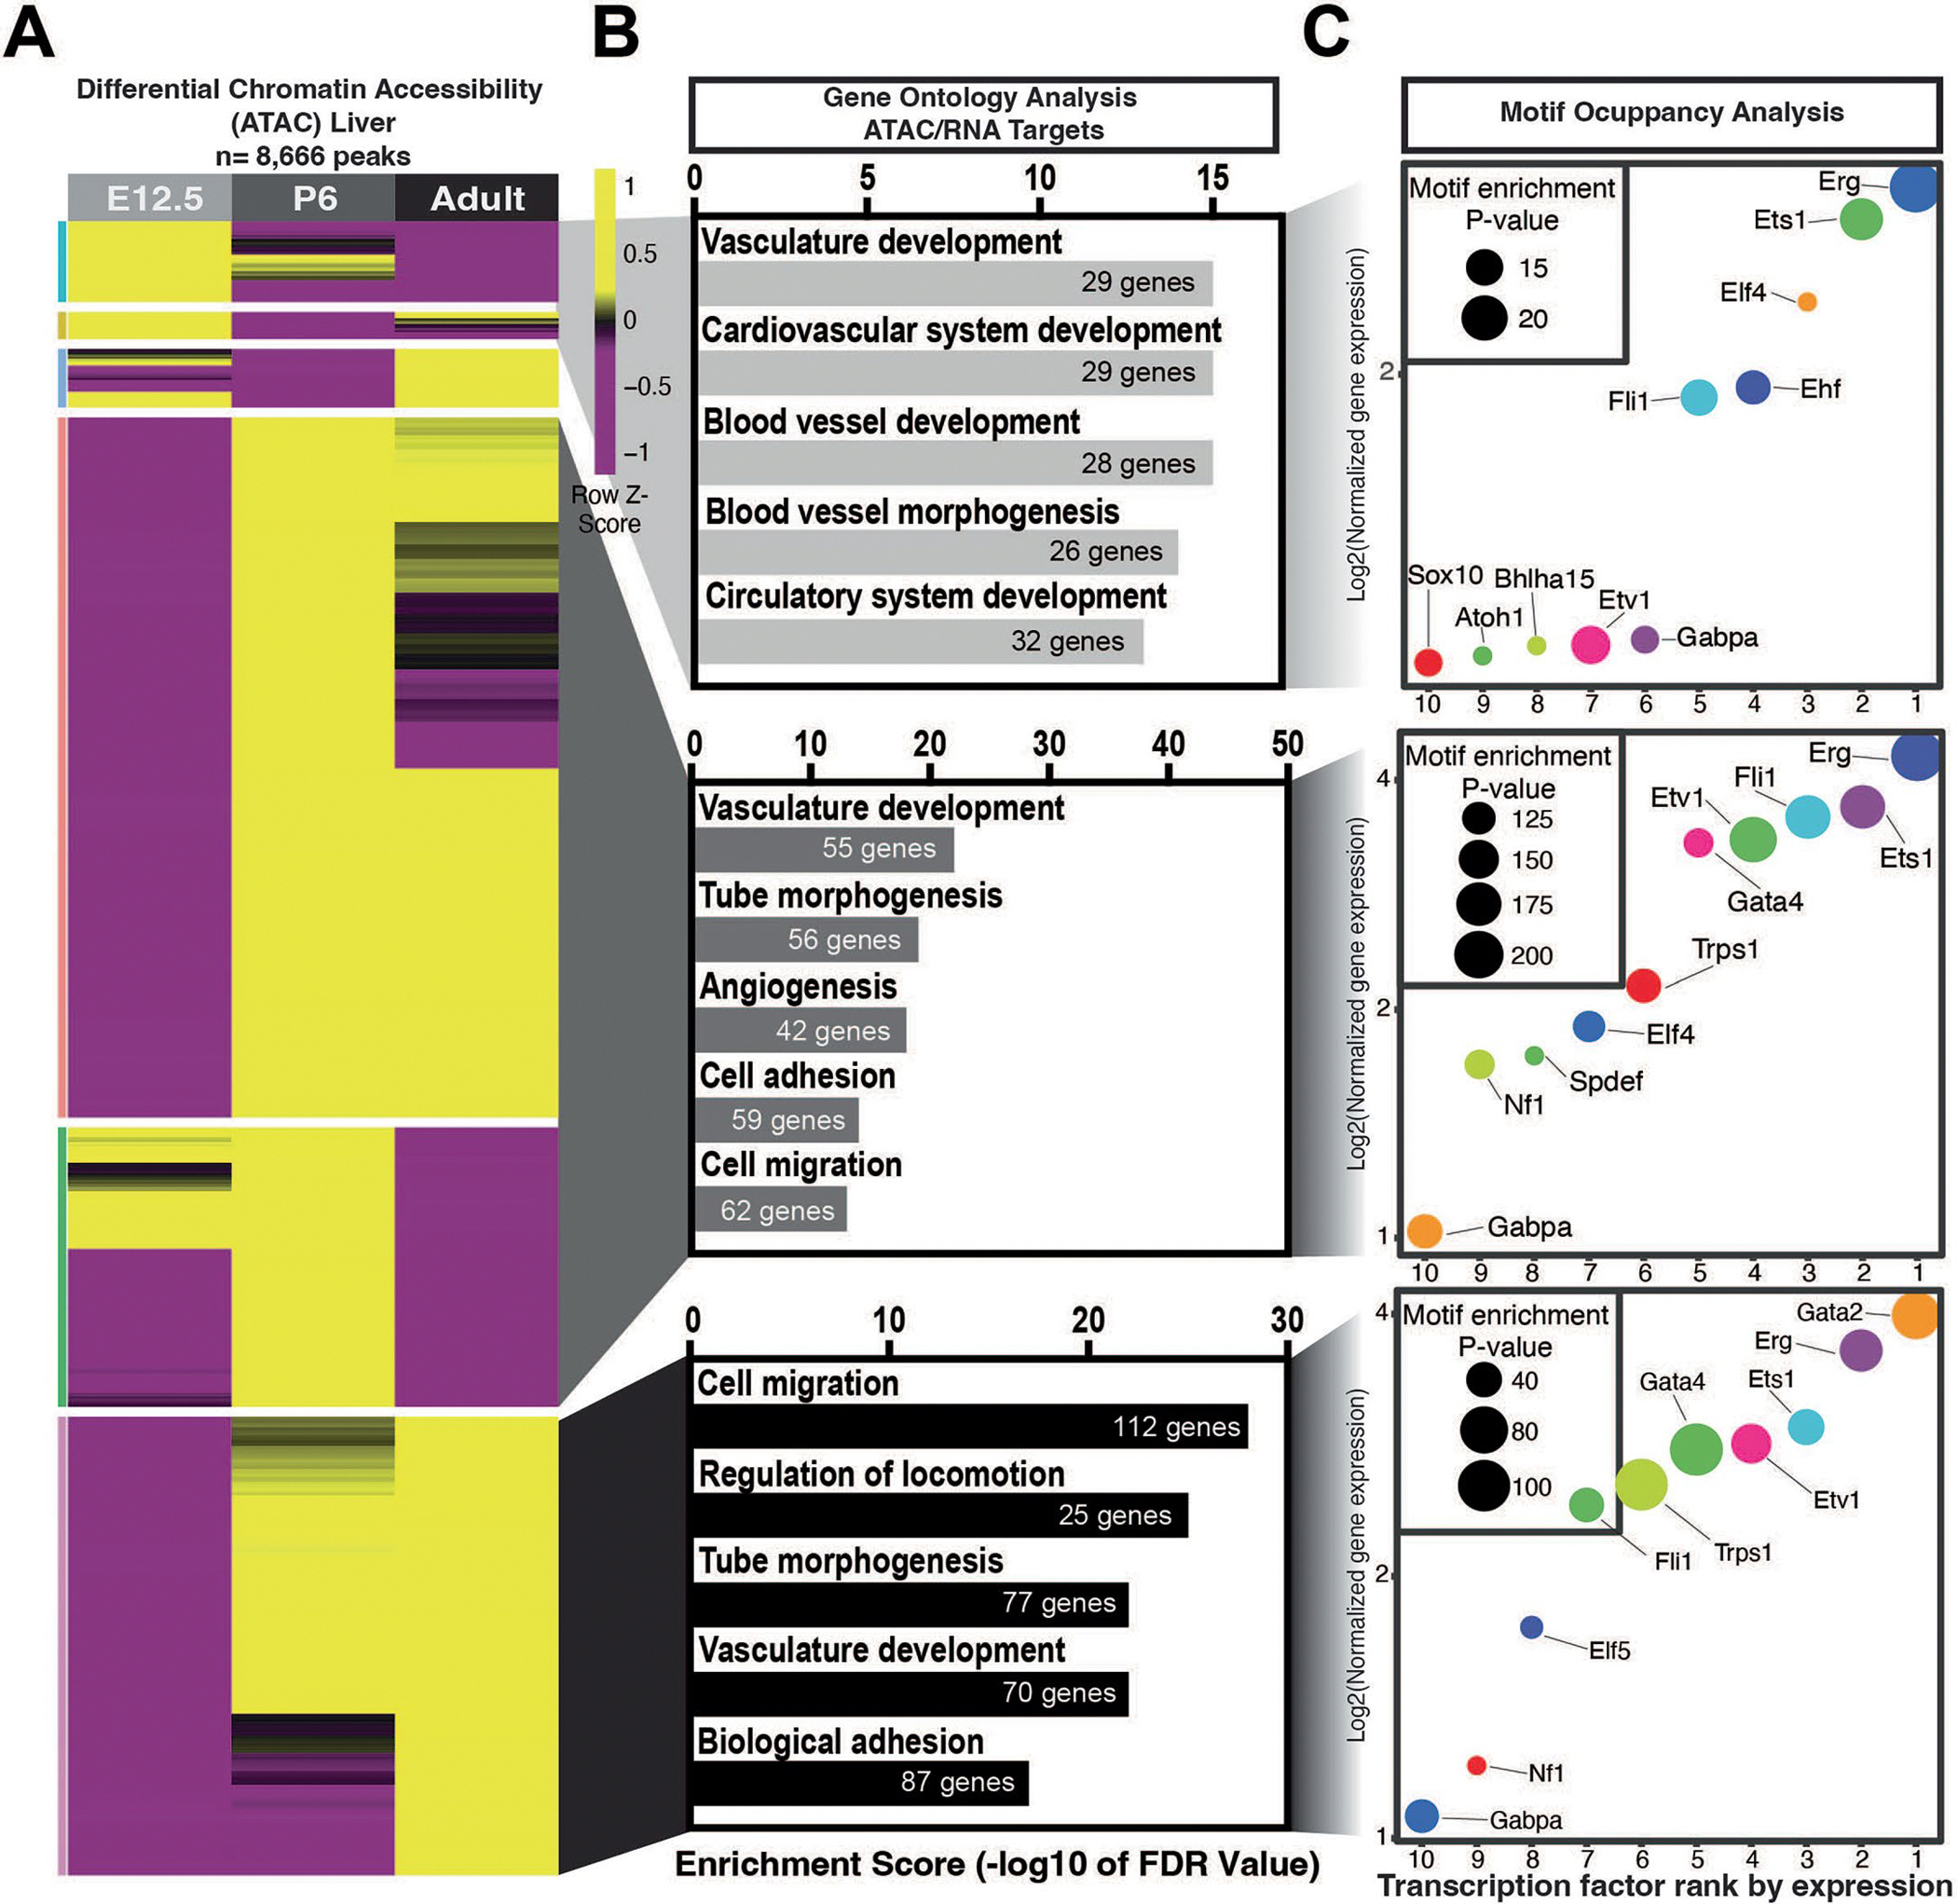
a) Differential chromatin accessibility determined by ATAC-Seq peaks in the liver endothelium (8,666 peaks) at E12.5, postnatal day 6 (P6) and adult (2-month-old) mice. b) Biological processes from expressed genes and with accessible chromatin in each timepoint. c) Top 10 transcription factor motifs ranked by gene expression for each age. Log2 expression over input indicated in the y-axis. Motif enrichment p-value (one-tailed Fisher’s exact test) is shown according to the dot size.
Extended Data Fig. 5 |. Chromatin Accessibility Changes Across Time in the Lung Endothelium.

a) Differential chromatin accessibility determined by ATAC-Seq peaks in the lung endothelium (1,731 peaks) at E12.5, postnatal day 6 (P6) and adult (2-month-old) mice. b) Biological processes from expressed genes and with accessible chromatin in each timepoint. c) Top 10 transcription factor motifs ranked by gene expression for each age. Log2 expression over input indicated in the y-axis. Motif enrichment p-value (one-tailed Fisher’s exact test) is shown according to the dot size.
Extended Data Fig. 6 |. Chromatin Accessibility Changes Across Time in the Kidney Endothelium.

a) Differential chromatin accessibility determined by ATAC-Seq peaks in the kidney endothelium (3,035 peaks) at E12.5, postnatal day 6 (P6) and adult (2-month-old) mice. b) Biological processes from expressed genes and with accessible chromatin in each timepoint. c) Top 10 transcription factor motifs ranked by gene expression for each age. Log2 expression over input indicated in the y-axis. Motif enrichment p-value (one-tailed Fisher’s exact test) is shown according to the dot size.
Extended Data Fig. 7 |. Novel potential gene regulatory elements in organ specific transcription factors.

Genome browser tracks from ATAC-seq data highlight transcription factor DNA-binding motifs in accessible chromatin regions enriched in endothelial samples from the mouse (a) brain, (b) heart and (c) liver. Motifs present and their location are highlighted in black, while the genomic loci are indicated below each panel in blue (boxes represent exons, arrows indicate the direction of transcription).
Extended Data Fig. 8 |. Cell to Cell Communication Changes in the Neurovascular Unit Over Time.

a) Schematic representation of the harvesting and isolation of endothelial cells from E9.5, E12.5, E16.5, P8 and adult mice. Cells were purified using Magnetic Isolation Cells Sorting (MACS) and processed for downstream sequencing and analysis following the 10x Genomics protocol. b) UMAP of cells clustered by collection timepoint. c) UMAP of cells with the identity of each cluster indicated. d) Feature plot showing expression of the endothelial marker Cdh5 (encodes VE-Cadherin) superimposed on the UMAP to identity endothelial cells (normalized expression values). e) Circos plot of differentially expressed ligands in non-EC cells within our dataset, as well as their target genes expressed in the CNS endothelium between E9.5 and Adult. f) Unbiased analysis of top predicted interactions of differentially expressed ligands and receptors between ECs and pericytes in E9.5 and adult using the Cell-Cell Interactions (CCInx using adjusted p-value, and average log2 fold change). Wilcoxon rank sum test, two-sided P-value.
Extended Data Fig. 9 |. Differential gene expression in endothelial cells across time.

a) UMAP of only endothelial cells (from Fig. 6) colored coded by timepoint and clustered using Monocle 3 to show maturation across time. b) Feature plots denoting normalized expression of endothelial marker genes, Pecam1 and Cdh5, and canonical lymphatic marker genes, Lyve1 and Prox1, demonstrate the preferential enrichment of blood endothelial cell transcriptomes rather than lymphatic endothelial transcriptomes. c) Heatmap of differential gene expression analysis of single cell RNA-seq results from brain endothelial cells profiled across developmental time (row z-score). Genes in red have a known role in blood brain barrier function. The top 10 differentially expressed genes for each time point are shown, followed by the pan-endothelial transcripts Pecam1, Cldn5 and Kdr (normalized expression). d) Expression of BBB-related genes over developmental time.
Extended Data Fig. 10 |. Gene Ontology analysis of endothelial maturation within the mouse brain.

The differentially expressed gene signatures from the single cell endothelial subtypes of the developing and adult mouse brain that were used for pseudotime analysis by Moncole3 were processed for Gene Ontology analysis. The heatmap reflects which pathways and processes are upregulated in each of the unique endothelial cell subtypes (values represent the −log10 of the p-value). Colored by significance of pathway enrichment (2-sided p-value).
Supplementary Material
Acknowledgements
We thank J. Fish (University Health Network, Toronto, Canada) for critical comments on the paper and K. Berman de Ruiz (Baylor College of Medicine, Houston, Texas) and A. Herman (Baylor College of Medicine, Houston, Texas) for assistance with mouse husbandry and organ isolation. This study was supported by grants from the National Institutes of Health (HL127717, HL130804 and HL118761, J.F.M.; HL159159, J.D.W.; F31 HL136065, M.C.H.; T32 HL-007284, G.E.L.); the Vivian L. Smith Foundation (J.F.M.); the American Heart Association (19PRE34410104, M.E.C.G.; 16GRNT31330023, J.D.W.); the Caroline Wiess Law Fund, the Curtis Hankamer Basic Research Fund and the ARCO Foundation Young Teacher-Investigator Award (J.D.W.); the Cancer Research and Prevention Institute of Texas (RP200402) (J.D.W.); and institutional startup funds from the CVRI at Baylor College of Medicine (J.D.W.) and from the University of Virginia School of Medicine (J.D.W.). The funders had no role in the study design, data collection and analysis, decision to publish or preparation of the paper.
Footnotes
Competing interests
J.F.M. is a cofounder of and owns shares in Yap Therapeutics. The other authors declare no competing interests.
Code availability
The code workflow used to generate data in the paper is available via GitHub at https://github.com/wythelab/Cantu_Hill_EC_Diversity.
Additional information
Extended data is available for this paper at https://doi.org/10.1038/s44161-025-00618-0.
Supplementary information The online version contains supplementary material available at https://doi.org/10.1038/s44161-025-00618-0.
Springer Nature or its licensor (e.g. a society or other partner) holds exclusive rights to this article under a publishing agreement with the author(s) or other rightsholder(s); author self-archiving of the accepted manuscript version of this article is solely governed by the terms of such publishing agreement and applicable law.
Data availability
Data within this paper were mapped to the mouse (mm10, https://genome.ucsc.edu/cgi-bin/hgTracks?db=mm10&chromInfoPage=&pix=1821) or human (hg38, https://genome.ucsc.edu/cgi-bin/hgGateway) genome. Datasets generated in this study were deposited at the Gene Expression Omnibus: mouse bulk ATAC-seq and RNA-seq data, accession GSE185345, and human dataset, accession GSE187565. Mouse ATAC-seq data can be visualized at https://genome.ucsc.edu/s/mguiterr/ATAC_Summary_Final_CyVerse. For human ATAC-seq data, tracks can be visualized at https://genome.ucsc.edu/s/mguiterr/hg38_hCMEC_ATAC. The scRNA-seq data can be explored directly using the following web-based resources: https://wythelab.shinyapps.io/ScRNA_Brain_EC_Development/ or https://singlecell.broadinstitute.org/single_cell/reviewer_access/a4af66e3-f699-4ace-995a-60e56e3bdf7f, code: MFQN6BNPDU. The R studio object for single-cell data is available via figshare at https://doi.org/10.6084/m9.figshare.28266635 (ref. 196). All plasmids described in this study are available via Addgene at https://www.addgene.org/Joshua_Wythe/. Source data are provided with this paper.
References
- 1.Aird WC Phenotypic heterogeneity of the endothelium: I. Structure, function, and mechanisms. Circ. Res. 100, 158–173 (2007). [DOI] [PubMed] [Google Scholar]
- 2.Kalucka J et al. Single-cell transcriptome atlas of murine endothelial cells. Cell 180, 764–779.e20 (2020). [DOI] [PubMed] [Google Scholar]
- 3.Nolan DJ et al. Molecular signatures of tissue-specific microvascular endothelial cell heterogeneity in organ maintenance and regeneration. Dev. Cell 26, 204–219 (2013). [DOI] [PMC free article] [PubMed] [Google Scholar]
- 4.Paik DT et al. Single-cell RNA sequencing unveils unique transcriptomic signatures of organ-specific endothelial cells. Circulation 142, 1848–1862 (2020). [DOI] [PMC free article] [PubMed] [Google Scholar]
- 5.Hwa C & Aird WC The history of the capillary wall: doctors, discoveries, and debates. Am. J. Physiol. Heart Circ. Physiol. 293, H2667–H2679 (2007). [DOI] [PubMed] [Google Scholar]
- 6.Mohamed T & Sequeira-Lopez MLS Development of the renal vasculature. Semin. Cell Dev. Biol. 91, 132–146 (2019). [DOI] [PMC free article] [PubMed] [Google Scholar]
- 7.Churg J & Grishman E Ultrastructure of glomerular disease: a review. Kidney Int. 7, 254–261 (1975). [DOI] [PubMed] [Google Scholar]
- 8.Menzel S & Moeller MJ Role of the podocyte in proteinuria. Pediatr. Nephrol. 26, 1775–1780 (2011). [DOI] [PMC free article] [PubMed] [Google Scholar]
- 9.Fish JE & Wythe JD The molecular regulation of arteriovenous specification and maintenance. Dev. Dyn. 244, 391–409 (2015). [DOI] [PubMed] [Google Scholar]
- 10.Vila Ellis L et al. Epithelial vegfa specifies a distinct endothelial population in the mouse lung. Dev. Cell 52, 617–630.e6 (2020). [DOI] [PMC free article] [PubMed] [Google Scholar]
- 11.Dumas SJ et al. Single-cell RNA sequencing reveals renal endothelium heterogeneity and metabolic adaptation to water deprivation. J. Am. Soc. Nephrol. 31, 118–138 (2020). [DOI] [PMC free article] [PubMed] [Google Scholar]
- 12.Cleuren ACA et al. The in vivo endothelial cell translatome is highly heterogeneous across vascular beds. Proc. Natl Acad. Sci. USA 116, 23618–23624 (2019). [DOI] [PMC free article] [PubMed] [Google Scholar]
- 13.Augustin HG & Koh GY Organotypic vasculature: from descriptive heterogeneity to functional pathophysiology. Science 357, eaal2379 (2017). [DOI] [PubMed] [Google Scholar]
- 14.Visel A, Rubin EM & Pennacchio LA Genomic views of distant-acting enhancers. Nature 461, 199–205 (2009). [DOI] [PMC free article] [PubMed] [Google Scholar]
- 15.Mo A et al. Epigenomic signatures of neuronal diversity in the mammalian brain. Neuron 86, 1369–1384 (2015). [DOI] [PMC free article] [PubMed] [Google Scholar]
- 16.Sorensen I, Adams RH & Gossler A DLL1-mediated Notch activation regulates endothelial identity in mouse fetal arteries. Blood 113, 5680–5688 (2009). [DOI] [PubMed] [Google Scholar]
- 17.Deal RB & Henikoff S A simple method for gene expression and chromatin profiling of individual cell types within a tissue. Dev. Cell 18, 1030–1040 (2010). [DOI] [PMC free article] [PubMed] [Google Scholar]
- 18.Buenrostro JD, Giresi PG, Zaba LC, Chang HY & Greenleaf WJ Transposition of native chromatin for fast and sensitive epigenomic profiling of open chromatin, DNA-binding proteins and nucleosome position. Nat. Methods 10, 1213–1218 (2013). [DOI] [PMC free article] [PubMed] [Google Scholar]
- 19.Matus A, Bernhardt R & Hugh-Jones T High molecular weight microtubule-associated proteins are preferentially associated with dendritic microtubules in brain. Proc. Natl Acad. Sci. USA 78, 3010–3014 (1981). [DOI] [PMC free article] [PubMed] [Google Scholar]
- 20.Kanai Y & Hirokawa N Sorting mechanisms of tau and MAP2 in neurons: suppressed axonal transit of MAP2 and locally regulate microtubule binding. Neuron 14, 421–432 (1995). [DOI] [PubMed] [Google Scholar]
- 21.Mizushima W et al. The novel heart-specific RING finger protein 207 is involved in energy metabolism in cardiomyocytes. J. Mol. Cell. Cardiol. 100, 43–53 (2016). [DOI] [PubMed] [Google Scholar]
- 22.Yuan L et al. RNF207 exacerbates pathological cardiac hypertrophy via post-translational modification of TAB1. Cardiovasc. Res. 119, 183–194 (2023). [DOI] [PubMed] [Google Scholar]
- 23.Farrelly D et al. Mice mutant for glucokinase regulatory protein exhibit decreased liver glucokinase: a sequestration mechanism in metabolic regulation. Proc. Natl Acad. Sci. USA 96, 14511–14516 (1999). [DOI] [PMC free article] [PubMed] [Google Scholar]
- 24.Vandercammen A & Van Schaftingen E Species and tissue distribution of the regulatory protein of glucokinase. Biochem. J. 294, 551–556 (1993). [DOI] [PMC free article] [PubMed] [Google Scholar]
- 25.Chung MI & Hogan BLM Ager-CreERT2: a new genetic tool for studying lung alveolar development, homeostasis, and repair. Am. J. Respir. Cell Mol. Biol. 59, 706–712 (2018). [DOI] [PMC free article] [PubMed] [Google Scholar]
- 26.Ihara K et al. MAGI-2 is critical for the formation and maintenance of the glomerular filtration barrier in mouse kidney. Am. J. Pathol. 184, 2699–2708 (2014). [DOI] [PubMed] [Google Scholar]
- 27.Ihara K, Nishimura T, Fukuda T, Ookura T & Nishimori K Generation of Venus reporter knock-in mice revealed MAGI-2 expression patterns in adult mice. Gene Expr. Patterns 12, 95–101 (2012). [DOI] [PubMed] [Google Scholar]
- 28.Harris ES & Nelson WJ VE-cadherin: at the front, center, and sides of endothelial cell organization and function. Curr. Opin. Cell Biol. 22, 651–658 (2010). [DOI] [PMC free article] [PubMed] [Google Scholar]
- 29.Newman PJ The role of PECAM-1 in vascular cell biology. Ann. N.Y. Acad. Sci. 714, 165–174 (1994). [DOI] [PubMed] [Google Scholar]
- 30.Christiansen GB et al. The sorting receptor SorCS3 is a stronger regulator of glutamate receptor functions compared to GABAergic mechanisms in the hippocampus. Hippocampus 27, 235–248 (2017). [DOI] [PubMed] [Google Scholar]
- 31.Roder K et al. RING finger protein RNF207, a novel regulator of cardiac excitation. J. Biol. Chem. 289, 33730–33740 (2014). [DOI] [PMC free article] [PubMed] [Google Scholar]
- 32.Wang ZY, Jin L, Tan H & Irwin DM Evolution of hepatic glucose metabolism: liver-specific glucokinase deficiency explained by parallel loss of the gene for glucokinase regulatory protein (GCKR). PLoS ONE 8, e60896 (2013). [DOI] [PMC free article] [PubMed] [Google Scholar]
- 33.Leikauf GD et al. Integrative assessment of chlorine-induced acute lung injury in mice. Am. J. Respir. Cell Mol. Biol. 47, 234–244 (2012). [DOI] [PMC free article] [PubMed] [Google Scholar]
- 34.Balbas MD et al. MAGI-2 scaffold protein is critical for kidney barrier function. Proc. Natl Acad. Sci. USA 111, 14876–14881 (2014). [DOI] [PMC free article] [PubMed] [Google Scholar]
- 35.Ben-Zvi A et al. Mfsd2a is critical for the formation and function of the blood–brain barrier. Nature 509, 507–511 (2014). [DOI] [PMC free article] [PubMed] [Google Scholar]
- 36.Coppiello G et al. Meox2/Tcf15 heterodimers program the heart capillary endothelium for cardiac fatty acid uptake. Circulation 131, 815–826 (2015). [DOI] [PubMed] [Google Scholar]
- 37.Duim SN, Kurakula K, Goumans MJ & Kruithof BP Cardiac endothelial cells express Wilms’ tumor-1: Wt1 expression in the developing, adult and infarcted heart. J. Mol. Cell. Cardiol. 81, 127–135 (2015). [DOI] [PubMed] [Google Scholar]
- 38.Li ZW et al. Oit3, a promising hallmark gene for targeting liver sinusoidal endothelial cells. Signal Transduct. Target. Ther. 8, 344 (2023). [DOI] [PMC free article] [PubMed] [Google Scholar]
- 39.Barry DM et al. Molecular determinants of nephron vascular specialization in the kidney. Nat. Commun. 10, 5705 (2019). [DOI] [PMC free article] [PubMed] [Google Scholar]
- 40.McLean CY et al. GREAT improves functional interpretation of cis-regulatory regions. Nat. Biotechnol. 28, 495–501 (2010). [DOI] [PMC free article] [PubMed] [Google Scholar]
- 41.Heinz S et al. Simple combinations of lineage-determining transcription factors prime cis-regulatory elements required for macrophage and B cell identities. Mol. Cell 38, 576–589 (2010). [DOI] [PMC free article] [PubMed] [Google Scholar]
- 42.Vijayaraj P et al. Erg is a crucial regulator of endocardial–mesenchymal transformation during cardiac valve morphogenesis. Development 139, 3973–3985 (2012). [DOI] [PMC free article] [PubMed] [Google Scholar]
- 43.Fish JE et al. Dynamic regulation of VEGF-inducible genes by an ERK/ERG/p300 transcriptional network. Development 144, 2428–2444 (2017). [DOI] [PMC free article] [PubMed] [Google Scholar]
- 44.Wythe JD et al. ETS factors regulate Vegf-dependent arterial specification. Dev. Cell 26, 45–58 (2013). [DOI] [PMC free article] [PubMed] [Google Scholar]
- 45.Abedin MJ et al. Fli1 acts downstream of Etv2 to govern cell survival and vascular homeostasis via positive autoregulation. Circ. Res. 114, 1690–1699 (2014). [DOI] [PMC free article] [PubMed] [Google Scholar]
- 46.Pimanda JE et al. Endoglin expression in the endothelium is regulated by Fli-1, Erg, and Elf-1 acting on the promoter and a −8-kb enhancer. Blood 107, 4737–4745 (2006). [DOI] [PubMed] [Google Scholar]
- 47.Zhou Y, Williams J, Smallwood PM & Nathans J Sox7, Sox17, and Sox18 cooperatively regulate vascular development in the mouse retina. PLoS ONE 10, e0143650 (2015). [DOI] [PMC free article] [PubMed] [Google Scholar]
- 48.Chiang IK et al. Correction: SoxF factors induce Notch1 expression via direct transcriptional regulation during early arterial development. Development 144, 3847–3848 (2017). [DOI] [PMC free article] [PubMed] [Google Scholar]
- 49.Lee SH et al. Notch pathway targets proangiogenic regulator Sox17 to restrict angiogenesis. Circ. Res. 115, 215–226 (2014). [DOI] [PubMed] [Google Scholar]
- 50.Corada M et al. Sox17 is indispensable for acquisition and maintenance of arterial identity. Nat. Commun. 4, 2609 (2013). [DOI] [PMC free article] [PubMed] [Google Scholar]
- 51.Yao Y, Yao J & Bostrom KI SOX transcription factors in endothelial differentiation and endothelial–mesenchymal transitions. Front. Cardiovasc. Med. 6, 30 (2019). [DOI] [PMC free article] [PubMed] [Google Scholar]
- 52.Yao J et al. Elevated endothelial Sox2 causes lumen disruption and cerebral arteriovenous malformations. J. Clin. Invest. 129, 3121–3133 (2019). [DOI] [PMC free article] [PubMed] [Google Scholar]
- 53.Rudnicki M et al. Endothelial-specific FoxO1 depletion prevents obesity-related disorders by increasing vascular metabolism and growth. eLife 7, e39780 (2018). [DOI] [PMC free article] [PubMed] [Google Scholar]
- 54.Wilhelm K et al. FOXO1 couples metabolic activity and growth state in the vascular endothelium. Nature 529, 216–220 (2016). [DOI] [PMC free article] [PubMed] [Google Scholar]
- 55.Potente M et al. Involvement of Foxo transcription factors in angiogenesis and postnatal neovascularization. J. Clin. Invest. 115, 2382–2392 (2005). [DOI] [PMC free article] [PubMed] [Google Scholar]
- 56.Paik JH et al. FoxOs are lineage-restricted redundant tumor suppressors and regulate endothelial cell homeostasis. Cell 128, 309–323 (2007). [DOI] [PMC free article] [PubMed] [Google Scholar]
- 57.Stenman JM et al. Canonical Wnt signaling regulates organ-specific assembly and differentiation of CNS vasculature. Science 322, 1247–1250 (2008). [DOI] [PubMed] [Google Scholar]
- 58.Liebner S et al. Wnt/beta–catenin signaling controls development of the blood–brain barrier. J. Cell Biol. 183, 409–417 (2008). [DOI] [PMC free article] [PubMed] [Google Scholar]
- 59.Daneman R et al. Wnt/beta–catenin signaling is required for CNS, but not non-CNS, angiogenesis. Proc. Natl Acad. Sci. USA 106, 641–646 (2009). [DOI] [PMC free article] [PubMed] [Google Scholar]
- 60.Hupe M et al. Gene expression profiles of brain endothelial cells during embryonic development at bulk and single-cell levels. Sci. Signal. 10, eaag2476 (2017). [DOI] [PubMed] [Google Scholar]
- 61.Reyahi A et al. Foxf2 is required for brain pericyte differentiation and development and maintenance of the blood–brain barrier. Dev. Cell 34, 19–32 (2015). [DOI] [PubMed] [Google Scholar]
- 62.Fan C et al. Novel roles of GATA1 in regulation of angiogenic factor AGGF1 and endothelial cell function. J. Biol. Chem. 284, 23331–23343 (2009). [DOI] [PMC free article] [PubMed] [Google Scholar]
- 63.Castano J et al. GATA2 promotes hematopoietic development and represses cardiac differentiation of human mesoderm. Stem Cell Reports 13, 515–529 (2019). [DOI] [PMC free article] [PubMed] [Google Scholar]
- 64.Rivera-Feliciano J et al. Development of heart valves requires Gata4 expression in endothelial-derived cells. Development 133, 3607–3618 (2006). [DOI] [PMC free article] [PubMed] [Google Scholar]
- 65.Lepore JJ et al. GATA-6 regulates semaphorin 3C and is required in cardiac neural crest for cardiovascular morphogenesis. J. Clin. Invest. 116, 929–939 (2006). [DOI] [PMC free article] [PubMed] [Google Scholar]
- 66.Nadeau M et al. An endocardial pathway involving Tbx5, Gata4, and Nos3 required for atrial septum formation. Proc. Natl Acad. Sci. USA 107, 19356–19361 (2010). [DOI] [PMC free article] [PubMed] [Google Scholar]
- 67.Geraud C et al. GATA4-dependent organ-specific endothelial differentiation controls liver development and embryonic hematopoiesis. J. Clin. Invest. 127, 1099–1114 (2017). [DOI] [PMC free article] [PubMed] [Google Scholar]
- 68.Zhao R et al. GATA6 is essential for embryonic development of the liver but dispensable for early heart formation. Mol. Cell. Biol. 25, 2622–2631 (2005). [DOI] [PMC free article] [PubMed] [Google Scholar]
- 69.de la Pompa JL et al. Role of the NF-ATc transcription factor in morphogenesis of cardiac valves and septum. Nature 392, 182–186 (1998). [DOI] [PubMed] [Google Scholar]
- 70.Ranger AM et al. The transcription factor NF-ATc is essential for cardiac valve formation. Nature 392, 186–190 (1998). [DOI] [PubMed] [Google Scholar]
- 71.Zeini M et al. Spatial and temporal regulation of coronary vessel formation by calcineurin–NFAT signaling. Development 136, 3335–3345 (2009). [DOI] [PMC free article] [PubMed] [Google Scholar]
- 72.Graef IA, Chen F, Chen L, Kuo A & Crabtree GR Signals transduced by Ca2+/calcineurin and NFATc3/c4 pattern the developing vasculature. Cell 105, 863–875 (2001). [DOI] [PubMed] [Google Scholar]
- 73.Sugiaman-Trapman D et al. Characterization of the human RFX transcription factor family by regulatory and target gene analysis. BMC Genomics 19, 181 (2018). [DOI] [PMC free article] [PubMed] [Google Scholar]
- 74.Duan Q et al. Deregulation of XBP1 expression contributes to myocardial vascular endothelial growth factor-A expression and angiogenesis during cardiac hypertrophy in vivo. Aging Cell 15, 625–633 (2016). [DOI] [PMC free article] [PubMed] [Google Scholar]
- 75.Schilham MW et al. Defects in cardiac outflow tract formation and pro-B-lymphocyte expansion in mice lacking Sox-4. Nature 380, 711–714 (1996). [DOI] [PubMed] [Google Scholar]
- 76.Yang Y & Cvekl A Large Maf transcription factors: cousins of AP-1 proteins and important regulators of cellular differentiation. Einstein J. Biol. Med. 23, 2–11 (2007). [DOI] [PMC free article] [PubMed] [Google Scholar]
- 77.Jeong HW et al. Transcriptional regulation of endothelial cell behavior during sprouting angiogenesis. Nat. Commun. 8, 726 (2017). [DOI] [PMC free article] [PubMed] [Google Scholar]
- 78.de Haan W et al. Unraveling the transcriptional determinants of liver sinusoidal endothelial cell specialization. Am. J. Physiol. Gastrointest. Liver Physiol. 318, G803–G815 (2020). [DOI] [PMC free article] [PubMed] [Google Scholar]
- 79.Gomez-Salinero JM et al. Specification of fetal liver endothelial progenitors to functional zonated adult sinusoids requires c-Maf induction. Cell Stem Cell 29, 593–609.e7 (2022). [DOI] [PMC free article] [PubMed] [Google Scholar]
- 80.Nalecz KA Solute carriers in the blood–brain barier: safety in abundance. Neurochem. Res. 42, 795–809 (2017). [DOI] [PubMed] [Google Scholar]
- 81.Zaragoza R Transport of amino acids across the blood–brain barrier. Front. Physiol. 11, 973 (2020). [DOI] [PMC free article] [PubMed] [Google Scholar]
- 82.Feng W, Chen L, Nguyen PK, Wu SM & Li G Single cell analysis of endothelial cells identified organ-specific molecular signatures and heart-specific cell populations and molecular features. Front. Cardiovasc. Med. 6, 165 (2019). [DOI] [PMC free article] [PubMed] [Google Scholar]
- 83.Varin EM et al. Circulating levels of soluble dipeptidyl peptidase-4 are dissociated from inflammation and induced by enzymatic DPP4 inhibition. Cell. Metab. 29, 320–334.e5 (2019). [DOI] [PubMed] [Google Scholar]
- 84.Wilson MR et al. Lgr5-positive endothelial progenitor cells occupy a tumor and injury prone niche in the kidney vasa recta. Stem Cell Res. 46, 101849 (2020). [DOI] [PubMed] [Google Scholar]
- 85.Sabbagh MF et al. Transcriptional and epigenomic landscapes of CNS and non-CNS vascular endothelial cells. eLife 7, e36187 (2018). [DOI] [PMC free article] [PubMed] [Google Scholar]
- 86.Chiquet-Ehrismann R & Tucker RP Tenascins and the importance of adhesion modulation. Cold Spring Harb. Perspect. Biol. 3, a004960 (2011). [DOI] [PMC free article] [PubMed] [Google Scholar]
- 87.Lam TI, Wise PM & O’Donnell ME Cerebral microvascular endothelial cell Na/H exchange: evidence for the presence of NHE1 and NHE2 isoforms and regulation by arginine vasopressin. Am. J. Physiol. Cell. Physiol. 297, C278–C289 (2009). [DOI] [PMC free article] [PubMed] [Google Scholar]
- 88.Weksler B, Romero IA & Couraud PO The hCMEC/D3 cell line as a model of the human blood brain barrier. Fluids Barriers CNS 10, 16 (2013). [DOI] [PMC free article] [PubMed] [Google Scholar]
- 89.Carl SM et al. ABC and SLC transporter expression and proton oligopeptide transporter (POT) mediated permeation across the human blood–brain barrier cell line, hCMEC/D3 [corrected]. Mol. Pharm. 7, 1057–1068 (2010). [DOI] [PMC free article] [PubMed] [Google Scholar]
- 90.Ohtsuki S et al. Quantitative targeted absolute proteomic analysis of transporters, receptors and junction proteins for validation of human cerebral microvascular endothelial cell line hCMEC/D3 as a human blood–brain barrier model. Mol. Pharm. 10, 289–296 (2013). [DOI] [PubMed] [Google Scholar]
- 91.Urich E, Lazic SE, Molnos J, Wells I & Freskgard PO Transcriptional profiling of human brain endothelial cells reveals key properties crucial for predictive in vitro blood–brain barrier models. PLoS ONE 7, e38149 (2012). [DOI] [PMC free article] [PubMed] [Google Scholar]
- 92.Browaeys R, Saelens W & Saeys Y NicheNet: modeling intercellular communication by linking ligands to target genes. Nat. Methods 17, 159–162 (2020). [DOI] [PubMed] [Google Scholar]
- 93.Schaeffer S & Iadecola C Revisiting the neurovascular unit. Nat. Neurosci. 24, 1198–1209 (2021). [DOI] [PMC free article] [PubMed] [Google Scholar]
- 94.Xia J et al. E-cadherin-mediated contact of endothelial progenitor cells with mesenchymal stem cells through beta-catenin signaling. Cell Biol. Int. 40, 407–418 (2016). [DOI] [PubMed] [Google Scholar]
- 95.Nayak G et al. Developmental vascular regression is regulated by a Wnt/beta-catenin, MYC and CDKN1A pathway that controls cell proliferation and cell death. Development 145, dev.154898 (2018). [DOI] [PMC free article] [PubMed] [Google Scholar]
- 96.Tetsu O & McCormick F Beta-catenin regulates expression of cyclin D1 in colon carcinoma cells. Nature 398, 422–426 (1999). [DOI] [PubMed] [Google Scholar]
- 97.Shtutman M et al. The cyclin D1 gene is a target of the β-catenin/LEF-1 pathway. Proc. Natl Acad. Sci. USA 96, 5522–5527 (1999). [DOI] [PMC free article] [PubMed] [Google Scholar]
- 98.Lin Y-T & Chao CCK Identification of the β-catenin/JNK/prothymosin-alpha axis as a novel target of sorafenib in hepatocellular carcinoma cells. Oncotarget 6, 38999–39017 (2015). [DOI] [PMC free article] [PubMed] [Google Scholar]
- 99.Bienz M β-catenin: a pivot between cell adhesion and Wnt signalling. Curr. Biol. 15, R64–R67 (2005). [DOI] [PubMed] [Google Scholar]
- 100.Brembeck FH, Rosario M & Birchmeier W Balancing cell adhesion and Wnt signaling, the key role of β-catenin. Curr. Opin. Genet. Dev. 16, 51–59 (2006). [DOI] [PubMed] [Google Scholar]
- 101.Kruse K et al. N-cadherin signaling via Trio assembles adherens junctions to restrict endothelial permeability. J. Cell Biol. 218, 299–316 (2019). [DOI] [PMC free article] [PubMed] [Google Scholar]
- 102.Gerhardt H, Wolburg H & Redies C N-cadherin mediates pericytic–endothelial interaction during brain angiogenesis in the chicken. Dev. Dyn. 218, 472–479 (2000). [DOI] [PubMed] [Google Scholar]
- 103.Soh BS et al. N-cadherin prevents the premature differentiation of anterior heart field progenitors in the pharyngeal mesodermal microenvironment. Cell Res. 24, 1420–1432 (2014). [DOI] [PMC free article] [PubMed] [Google Scholar]
- 104.Jho EH et al. Wnt/β-catenin/Tcf signaling induces the transcription of Axin2, a negative regulator of the signaling pathway. Mol. Cell. Biol. 22, 1172–1183 (2002). [DOI] [PMC free article] [PubMed] [Google Scholar]
- 105.Vattulainen-Collanus S et al. Bone morphogenetic protein signaling is required for RAD51-mediated maintenance of genome integrity in vascular endothelial cells. Commun. Biol. 1, 149 (2018). [DOI] [PMC free article] [PubMed] [Google Scholar]
- 106.Ahmed KM, Pandita RK, Singh DK, Hunt CR & Pandita TK β1-integrin impacts Rad51 stability and DNA double-strand break repair by homologous recombination. Mol. Cell. Biol. 10.1128/MCB.00672-17 (2018). [DOI] [PMC free article] [PubMed] [Google Scholar]
- 107.Ximerakis M et al. Single-cell transcriptomic profiling of the aging mouse brain. Nat. Neurosci. 22, 1696–1708 (2019). [DOI] [PubMed] [Google Scholar]
- 108.Ayloo S et al. Pericyte-to-endothelial cell signaling via vitronectin–integrin regulates blood–CNS barrier. Neuron 110, 1641–1655.e6 (2022). [DOI] [PMC free article] [PubMed] [Google Scholar]
- 109.Bodary SC & McLean JW The integrin beta 1 subunit associates with the vitronectin receptor alpha v subunit to form a novel vitronectin receptor in a human embryonic kidney cell line. J. Biol. Chem. 265, 5938–5941 (1990). [PubMed] [Google Scholar]
- 110.Izawa Y et al. β1-integrin–matrix interactions modulate cerebral microvessel endothelial cell tight junction expression and permeability. J. Cereb. Blood Flow Metab. 38, 641–658 (2018). [DOI] [PMC free article] [PubMed] [Google Scholar]
- 111.Kant R, Halder SK, Bix GJ & Milner R Absence of endothelial α5β1 integrin triggers early onset of experimental autoimmune encephalomyelitis due to reduced vascular remodeling and compromised vascular integrity. Acta. Neuropathol. Commun. 7, 11 (2019). [DOI] [PMC free article] [PubMed] [Google Scholar]
- 112.Boldajipour B et al. Control of chemokine-guided cell migration by ligand sequestration. Cell 132, 463–473 (2008). [DOI] [PubMed] [Google Scholar]
- 113.Williams JL, Holman DW & Klein RS Chemokines in the balance: maintenance of homeostasis and protection at CNS barriers. Front. Cell. Neurosci. 8, 154 (2014). [DOI] [PMC free article] [PubMed] [Google Scholar]
- 114.Abramsson A et al. Defective N-sulfation of heparan sulfate proteoglycans limits PDGF-BB binding and pericyte recruitment in vascular development. Genes Dev. 21, 316–331 (2007). [DOI] [PMC free article] [PubMed] [Google Scholar]
- 115.Gaengel K, Genove G, Armulik A & Betsholtz C Endothelial–mural cell signaling in vascular development and angiogenesis. Arterioscler. Thromb. Vasc. Biol. 29, 630–638 (2009). [DOI] [PubMed] [Google Scholar]
- 116.Pellowe AS et al. Endothelial cell-secreted MIF reduces pericyte contractility and enhances neutrophil extravasation. FASEB J. 33, 2171–2186 (2019). [DOI] [PMC free article] [PubMed] [Google Scholar]
- 117.Hao Y et al. Integrated analysis of multimodal single-cell data. Cell 184, 3573–3587.e29 (2021). [DOI] [PMC free article] [PubMed] [Google Scholar]
- 118.McInnes L, Healy J & Melville J UMAP: uniform manifold approximation and projection for dimension reduction. Preprint at https://arxiv.org/abs/1802.03426 (2020). [Google Scholar]
- 119.Amin MA et al. Migration inhibitory factor mediates angiogenesis via mitogen-activated protein kinase and phosphatidylinositol kinase. Circ. Res. 93, 321–329 (2003). [DOI] [PubMed] [Google Scholar]
- 120.Kondrychyn I et al. Marcksl1 modulates endothelial cell mechanoresponse to haemodynamic forces to control blood vessel shape and size. Nat. Commun. 11, 5476 (2020). [DOI] [PMC free article] [PubMed] [Google Scholar]
- 121.Benz F et al. Low wnt/beta-catenin signaling determines leaky vessels in the subfornical organ and affects water homeostasis in mice. eLife 8, e43818 (2019). [DOI] [PMC free article] [PubMed] [Google Scholar]
- 122.Guo L, Zhang H, Hou Y, Wei T & Liu J Plasmalemma vesicle-associated protein: a crucial component of vascular homeostasis. Exp. Ther. Med. 12, 1639–1644 (2016). [DOI] [PMC free article] [PubMed] [Google Scholar]
- 123.Wong BH & Silver DL in Lipid Transfer in Lipoprotein Metabolism and Cardiovascular Disease (ed. Jiang X-C.) 223–234 (Springer, 2020). [Google Scholar]
- 124.Akanuma S, Hirose S, Tachikawa M & Hosoya K Localization of organic anion transporting polypeptide (Oatp) 1a4 and Oatp1c1 at the rat blood-retinal barrier. Fluids Barriers CNS 10, 29 (2013). [DOI] [PMC free article] [PubMed] [Google Scholar]
- 125.Ose A et al. Functional characterization of mouse organic anion transporting peptide 1a4 in the uptake and efflux of drugs across the blood–brain barrier. Drug Metab. Dispos. 38, 168–176 (2010). [DOI] [PubMed] [Google Scholar]
- 126.Mae MA et al. Single-cell analysis of blood–brain barrier response to pericyte loss. Circ. Res. 128, e46–e62 (2021). [DOI] [PMC free article] [PubMed] [Google Scholar]
- 127.Aibar S et al. SCENIC: single-cell regulatory network inference and clustering. Nat. Methods 14, 1083–1086 (2017). [DOI] [PMC free article] [PubMed] [Google Scholar]
- 128.Schmitt CE, Woolls MJ & Jin SW Mutant-specific gene expression profiling identifies SRY-related HMG box 11b (SOX11b) as a novel regulator of vascular development in zebrafish. Mol. Cells 35, 166–172 (2013). [DOI] [PMC free article] [PubMed] [Google Scholar]
- 129.Palomero J et al. SOX11 promotes tumor angiogenesis through transcriptional regulation of PDGFA in mantle cell lymphoma. Blood 124, 2235–2247 (2014). [DOI] [PubMed] [Google Scholar]
- 130.Starks RR et al. Transcription factor PLAGL1 is associated with angiogenic gene expression in the placenta. Int. J. Mol. Sci. 21, 8317 (2020). [DOI] [PMC free article] [PubMed] [Google Scholar]
- 131.Qin G et al. Cell cycle regulator E2F1 modulates angiogenesis via p53-dependent transcriptional control of VEGF. Proc. Natl Acad. Sci. USA 103, 11015–11020 (2006). [DOI] [PMC free article] [PubMed] [Google Scholar]
- 132.Yoshitomi Y, Ikeda T, Saito-Takatsuji H & Yonekura H Emerging role of AP-1 transcription factor JunB in angiogenesis and vascular development. Int. J. Mol. Sci. 22, 2804 (2021). [DOI] [PMC free article] [PubMed] [Google Scholar]
- 133.Licht AH et al. JunB is required for endothelial cell morphogenesis by regulating core-binding factor beta. J. Cell Biol. 175, 981–991 (2006). [DOI] [PMC free article] [PubMed] [Google Scholar]
- 134.Yanagida K et al. Sphingosine 1-phosphate receptor signaling establishes AP-1 gradients to allow for retinal endothelial cell specialization. Dev. Cell 52, 779–793.e7 (2020). [DOI] [PMC free article] [PubMed] [Google Scholar]
- 135.Cai Y et al. FOXF1 maintains endothelial barrier function and prevents edema after lung injury. Sci. Signal. 9, ra40 (2016). [DOI] [PubMed] [Google Scholar]
- 136.Cho C, Smallwood PM & Nathans J Reck and Gpr124 are essential receptor cofactors for Wnt7a/Wnt7b-specific signaling in mammalian CNS angiogenesis and blood–brain barrier regulation. Neuron 95, 1221–1225 (2017). [DOI] [PubMed] [Google Scholar]
- 137.Cho C, Wang Y, Smallwood PM, Williams J & Nathans J Dlg1 activates beta-catenin signaling to regulate retinal angiogenesis and the blood–retina and blood–brain barriers. eLife 8, e45542 (2019). [DOI] [PMC free article] [PubMed] [Google Scholar]
- 138.Hussain B et al. Endothelial β-catenin deficiency causes blood–brain barrier breakdown via enhancing the paracellular and transcellular permeability. Front. Mol. Neurosci. 15, 895429 (2022). [DOI] [PMC free article] [PubMed] [Google Scholar]
- 139.Tran KA et al. Endothelial β-catenin signaling is required for maintaining adult blood–brain barrier integrity and central nervous system homeostasis. Circulation 133, 177–186 (2016). [DOI] [PMC free article] [PubMed] [Google Scholar]
- 140.Wang Y et al. Interplay of the Norrin and Wnt7a/Wnt7b signaling systems in blood–brain barrier and blood–retina barrier development and maintenance. Proc. Natl Acad. Sci. USA 115, E11827–E11836 (2018). [DOI] [PMC free article] [PubMed] [Google Scholar]
- 141.Wang Y et al. Beta-catenin signaling regulates barrier-specific gene expression in circumventricular organ and ocular vasculatures. eLife 8, e43257 (2019). [DOI] [PMC free article] [PubMed] [Google Scholar]
- 142.Zhou Y et al. Canonical WNT signaling components in vascular development and barrier formation. J. Clin. Invest. 124, 3825–3846 (2014). [DOI] [PMC free article] [PubMed] [Google Scholar]
- 143.Liu B et al. Loss of endothelial glucocorticoid receptor promotes angiogenesis via upregulation of Wnt/beta-catenin pathway. Angiogenesis 24, 631–645 (2021). [DOI] [PMC free article] [PubMed] [Google Scholar]
- 144.Franken P, Lopez-Molina L, Marcacci L, Schibler U & Tafti M The transcription factor DBP affects circadian sleep consolidation and rhythmic EEG activity. J. Neurosci. 20, 617–625 (2000). [DOI] [PMC free article] [PubMed] [Google Scholar]
- 145.Pulido RS et al. Neuronal activity regulates blood–brain barrier efflux transport through endothelial circadian genes. Neuron 108, 937–952.e7 (2020). [DOI] [PMC free article] [PubMed] [Google Scholar]
- 146.Cao J et al. The single-cell transcriptional landscape of mammalian organogenesis. Nature 566, 496–502 (2019). [DOI] [PMC free article] [PubMed] [Google Scholar]
- 147.Herrnberger L et al. Lack of endothelial diaphragms in fenestrae and caveolae of mutant Plvap-deficient mice. Histochem. Cell Biol. 138, 709–724 (2012). [DOI] [PubMed] [Google Scholar]
- 148.Chen MB et al. Brain endothelial cells are exquisite sensors of age-related circulatory cues. Cell Rep. 30, 4418–4432.e4 (2020). [DOI] [PMC free article] [PubMed] [Google Scholar]
- 149.Orsenigo F et al. Mapping endothelial-cell diversity in cerebral cavernous malformations at single-cell resolution. eLife 9, e61413 (2020). [DOI] [PMC free article] [PubMed] [Google Scholar]
- 150.Liu Q et al. Genetic targeting of sprouting angiogenesis using Apln-CreER. Nat. Commun. 6, 6020 (2015). [DOI] [PMC free article] [PubMed] [Google Scholar]
- 151.Saelens W, Cannoodt R & Saeys Y A comprehensive evaluation of module detection methods for gene expression data. Nat. Commun. 9, 1090 (2018). [DOI] [PMC free article] [PubMed] [Google Scholar]
- 152.Palikuqi B et al. Adaptable haemodynamic endothelial cells for organogenesis and tumorigenesis. Nature 585, 426–432 (2020). [DOI] [PMC free article] [PubMed] [Google Scholar]
- 153.de Pater E et al. Gata2 is required for HSC generation and survival. J. Exp. Med. 210, 2843–2850 (2013). [DOI] [PMC free article] [PubMed] [Google Scholar]
- 154.Kang H et al. GATA2 is dispensable for specification of hemogenic endothelium but promotes endothelial-to-hematopoietic transition. Stem Cell Reports 11, 197–211 (2018). [DOI] [PMC free article] [PubMed] [Google Scholar]
- 155.De Val S & Black BL Transcriptional control of endothelial cell development. Dev. Cell 16, 180–195 (2009). [DOI] [PMC free article] [PubMed] [Google Scholar]
- 156.Obermeier B, Daneman R & Ransohoff RM Development, maintenance and disruption of the blood–brain barrier. Nat. Med. 19, 1584–1596 (2013). [DOI] [PMC free article] [PubMed] [Google Scholar]
- 157.Roudnicky F et al. Identification of a combination of transcription factors that synergistically increases endothelial cell barrier resistance. Sci. Rep. 10, 3886 (2020). [DOI] [PMC free article] [PubMed] [Google Scholar]
- 158.Hupe M et al. Gene expression profiles of brain endothelial cells during embryonic development at bulk and single cell levels. Sci. Signal. 10, eaag2476 (2017). [DOI] [PubMed] [Google Scholar]
- 159.Lopez-Molina L, Conquet F, Dubois-Dauphin M & Schibler U The DBP gene is expressed according to a circadian rhythm in the suprachiasmatic nucleus and influences circadian behavior. EMBO J. 16, 6762–6771 (1997). [DOI] [PMC free article] [PubMed] [Google Scholar]
- 160.Goodwin JE et al. Endothelial glucocorticoid receptor suppresses atherogenesis—brief report. Arterioscler. Thromb. Vasc. Biol. 35, 779–782 (2015). [DOI] [PMC free article] [PubMed] [Google Scholar]
- 161.Al Argan R, Saskin A, Yang JW, D’Agostino MD & Rivera J Glucocorticoid resistance syndrome caused by a novel NR3C1 point mutation. Endocr. J. 65, 1139–1146 (2018). [DOI] [PubMed] [Google Scholar]
- 162.Cadigan KM & Waterman ML TCF/LEFs and Wnt signaling in the nucleus. Cold Spring Harb. Perspect. Biol. 4, a007906 (2012). [DOI] [PMC free article] [PubMed] [Google Scholar]
- 163.Gerner-Mauro KN, Akiyama H & Chen J Redundant and additive functions of the four Lef/Tcf transcription factors in lung epithelial progenitors. Proc. Natl Acad. Sci. USA 117, 12182–12191 (2020). [DOI] [PMC free article] [PubMed] [Google Scholar]
- 164.Guo Q et al. A β-catenin-driven switch in TCF/LEF transcription factor binding to DNA target sites promotes commitment of mammalian nephron progenitor cells. eLife 10, e64444 (2021). [DOI] [PMC free article] [PubMed] [Google Scholar]
- 165.Moreira S et al. A single TCF transcription factor, regardless of its activation capacity, is sufficient for effective trilineage differentiation of ESCs. Cell Rep. 20, 2424–2438 (2017). [DOI] [PubMed] [Google Scholar]
- 166.Narita T et al. Enhancers are activated by p300/CBP activity-dependent PIC assembly, RNAPII recruitment, and pause release. Mol. Cell 81, 2166–2182.e6 (2021). [DOI] [PubMed] [Google Scholar]
- 167.Jonkers I & Lis JT Getting up to speed with transcription elongation by RNA polymerase II. Nat. Rev. Mol. Cell Biol. 16, 167–177 (2015). [DOI] [PMC free article] [PubMed] [Google Scholar]
- 168.Adelman K & Lis JT Promoter-proximal pausing of RNA polymerase II: emerging roles in metazoans. Nat. Rev. Genet. 13, 720–731 (2012). [DOI] [PMC free article] [PubMed] [Google Scholar]
- 169.Buenrostro JD, Wu B, Chang HY & Greenleaf WJ ATAC-seq: a method for assaying chromatin accessibility genome-wide. Curr. Protoc. Mol. Biol. 109, 21.29.21–21.29.29 (2015). [DOI] [PMC free article] [PubMed] [Google Scholar]
- 170.Langmead B & Salzberg SL Fast gapped-read alignment with Bowtie 2. Nat. Methods 9, 357–359 (2012). [DOI] [PMC free article] [PubMed] [Google Scholar]
- 171.Danecek P et al. Twelve years of SAMtools and BCFtools. Gigascience 10, giab008 (2021). [DOI] [PMC free article] [PubMed] [Google Scholar]
- 172.Broad Institute Picard Toolkit. GitHub; https://github.com/broadinstitute/picard (2019). [Google Scholar]
- 173.Zhang Y et al. Model-based analysis of ChIP-Seq (MACS). Genome Biol. 9, R137 (2008). [DOI] [PMC free article] [PubMed] [Google Scholar]
- 174.Stark R & Brown G DiffBind: differential binding analysis of ChIP-seq peak data. http://bioconductor.org/packages/release/bioc/vignettes/DiffBind/inst/doc/DiffBind.pdf (2011). [Google Scholar]
- 175.Ross-Innes CS et al. Differential oestrogen receptor binding is associated with clinical outcome in breast cancer. Nature 481, 389–393 (2012). [DOI] [PMC free article] [PubMed] [Google Scholar]
- 176.R Core Team. R: a language and environment for statistical computing. R Foundation for Statistical Computing https://www.R-project.org/ (2025). [Google Scholar]
- 177.Love MI, Huber W & Anders S Moderated estimation of fold change and dispersion for RNA-seq data with DESeq2. Genome Biol. 15, 550 (2014). [DOI] [PMC free article] [PubMed] [Google Scholar]
- 178.Liu C et al. An ATAC-seq atlas of chromatin accessibility in mouse tissues. Sci. Data 6, 65 (2019). [DOI] [PMC free article] [PubMed] [Google Scholar]
- 179.Patro R, Duggal G, Love MI, Irizarry RA & Kingsford C Salmon provides fast and bias-aware quantification of transcript expression. Nat. Methods 14, 417–419 (2017). [DOI] [PMC free article] [PubMed] [Google Scholar]
- 180.Soneson C, Love MI & Robinson MD Differential analyses for RNA-seq: transcript-level estimates improve gene-level inferences. F1000Res. 4, 1521 (2015). [DOI] [PMC free article] [PubMed] [Google Scholar]
- 181.Blighe K, Rana S & Lewis M EnhancedVolcano: publication-ready volcano plots with enhanced colouring and labeling. R package version 1.10.0. GitHub; https://github.com/kevinblighe/EnhancedVolcano (2021). [Google Scholar]
- 182.McGinnis CS, Murrow LM & Gartner ZJ DoubletFinder: doublet detection in single-cell RNA sequencing data using artificial nearest neighbors. Cell Syst. 8, 329–337.e4 (2019). [DOI] [PMC free article] [PubMed] [Google Scholar]
- 183.Hafemeister C & Satija R Normalization and variance stabilization of single-cell RNA-seq data using regularized negative binomial regression. Genome Biol. 20, 296 (2019). [DOI] [PMC free article] [PubMed] [Google Scholar]
- 184.Korsunsky I et al. Fast, sensitive and accurate integration of single-cell data with Harmony. Nat. Methods 16, 1289–1296 (2019). [DOI] [PMC free article] [PubMed] [Google Scholar]
- 185.Tepe B et al. Single-cell RNA-seq of mouse olfactory bulb reveals cellular heterogeneity and activity-dependent molecular census of adult-born neurons. Cell Rep. 25, 2689–2703.e3 (2018). [DOI] [PMC free article] [PubMed] [Google Scholar]
- 186.Patil A & Patil A CellKb Immune: a manually curated database of mammalian hematopoietic marker gene sets for rapid cell type identification. Preprint at bioRxiv 10.1101/2020.12.01.389890 (2022). [DOI] [Google Scholar]
- 187.Batiuk MY et al. Identification of region-specific astrocyte subtypes at single cell resolution. Nat. Commun. 11, 1220 (2020). [DOI] [PMC free article] [PubMed] [Google Scholar]
- 188.Baek SH et al. Single cell transcriptomic analysis reveals organ specific pericyte markers and identities. Front. Cardiovasc. Med. 9, 876591 (2022). [DOI] [PMC free article] [PubMed] [Google Scholar]
- 189.Hammond TR et al. Single-cell RNA sequencing of microglia throughout the mouse lifespan and in the injured brain reveals complex cell-state changes. Immunity 50, 253–271.e6 (2019). [DOI] [PMC free article] [PubMed] [Google Scholar]
- 190.Zhou Y et al. Metascape provides a biologist-oriented resource for the analysis of systems-level datasets. Nat. Commun. 10, 1523 (2019). [DOI] [PMC free article] [PubMed] [Google Scholar]
- 191.Corces MR et al. An improved ATAC-seq protocol reduces background and enables interrogation of frozen tissues. Nat. Methods 14, 959–962 (2017). [DOI] [PMC free article] [PubMed] [Google Scholar]
- 192.Ovcharenko I, Nobrega MA, Loots GG & Stubbs L ECR Browser: a tool for visualizing and accessing data from comparisons of multiple vertebrate genomes. Nucleic Acids Res. 32, W280–W286 (2004). [DOI] [PMC free article] [PubMed] [Google Scholar]
- 193.Loots GG & Ovcharenko I rVISTA 2.0: evolutionary analysis of transcription factor binding sites. Nucleic Acids Res. 32, W217–W221 (2004). [DOI] [PMC free article] [PubMed] [Google Scholar]
- 194.Gillespie W et al. Multisite Assembly of Gateway Induced Clones (MAGIC): a flexible cloning toolbox with diverse applications in vertebrate model systems. Preprint at bioRxiv 10.1101/2024.07.13.603267 (2024). [DOI] [Google Scholar]
- 195.Livak KJ & Schmittgen TD Analysis of relative gene expression data using real-time quantitative PCR and the 2−ΔΔCT method. Methods 25, 402–408 (2001). [DOI] [PubMed] [Google Scholar]
- 196.Wythe J & Martin JF Single cell RNA-seq data from Cantu Gutierrez, M.E. and Hill, M.C. et al. , Nature Cardiovascular Research, 2025. figshare 10.6084/m9.figshare.28266635 (2025). [DOI] [PMC free article] [PubMed] [Google Scholar]
Associated Data
This section collects any data citations, data availability statements, or supplementary materials included in this article.
Supplementary Materials
Data Availability Statement
Data within this paper were mapped to the mouse (mm10, https://genome.ucsc.edu/cgi-bin/hgTracks?db=mm10&chromInfoPage=&pix=1821) or human (hg38, https://genome.ucsc.edu/cgi-bin/hgGateway) genome. Datasets generated in this study were deposited at the Gene Expression Omnibus: mouse bulk ATAC-seq and RNA-seq data, accession GSE185345, and human dataset, accession GSE187565. Mouse ATAC-seq data can be visualized at https://genome.ucsc.edu/s/mguiterr/ATAC_Summary_Final_CyVerse. For human ATAC-seq data, tracks can be visualized at https://genome.ucsc.edu/s/mguiterr/hg38_hCMEC_ATAC. The scRNA-seq data can be explored directly using the following web-based resources: https://wythelab.shinyapps.io/ScRNA_Brain_EC_Development/ or https://singlecell.broadinstitute.org/single_cell/reviewer_access/a4af66e3-f699-4ace-995a-60e56e3bdf7f, code: MFQN6BNPDU. The R studio object for single-cell data is available via figshare at https://doi.org/10.6084/m9.figshare.28266635 (ref. 196). All plasmids described in this study are available via Addgene at https://www.addgene.org/Joshua_Wythe/. Source data are provided with this paper.