

Abstract
Purpose
Rural hospital closures since 2005 reached 194 this year, raising concerns for rural health care access. Little is known about the effects of facility closures on the local long‐term care sector. This analysis models the relationship between rural hospital closure and nursing homes in the same county. We explore nursing home‐level outcomes related to utilization and resident health.
Methods
Centers for Medicare & Medicaid Services Healthcare Cost Report Information System, LTCFocus, and NC Rural Health Research Program hospital closure datasets are used to conduct a difference‐in‐differences study of closures from 2012 to 2019.
Findings
We do not find evidence that hospital closure impacted non‐hospital‐based nursing home occupancy rate, proportion of Medicare paying residents, or average resident ADL score. However, hospitalizations per resident year declined by 0.13 following closure (95% CI: –0.24, –0.02), representing a change of 0.33 standard deviations from the grand mean. It is unclear if reduced nursing home hospitalizations reflect a reduction in emergent, urgent, or elective admissions.
Conclusions
Our results build on the existing body of hospital closure literature by highlighting the understudied role of hospitals in rural postacute and long‐term care. To our knowledge, this was the first study examining the impacts of hospital closure on nursing homes. These findings are particularly relevant in the wake of COVID‐19 as rural long‐term care facilities and hospitals alike navigate exacerbated workforce and funding challenges.
Keywords: hospital closure, hospitalizations, long‐term services and supports, nursing homes, rural health
INTRODUCTION
A rising trend in rural acute hospital closures has triggered concern for rural economies and access to essential services for disadvantaged groups. 1 According to the University of North Carolina Sheps Center for Health Services Research, 194 facilities have closed since 2005, with 151 occurring after 2010. 2 Rural hospitals can play a large role in health care provision within their communities due to a paucity of local providers and longer travel distances to alternative care. 3 , 4 Rural residents are older, lower income, and more chronically ill than urban 5 , 6 and some evidence suggests that rural hospital closures disproportionately affect older adults, 1 , 7 , 8 with a large number having occurred in Medicare Dependent Hospitals. 8 , 9 Although older adults have high health services use and may face more transportation barriers to access care, 1 , 10 few studies have explored the effects of hospital closure on health services most important to older adults. Nursing homes are a prominent source of post‐acute and long‐term care for the over‐65 population and may interact with local hospitals in a variety of ways. The repercussions for nursing homes after hospital closure are unknown. We estimate the relationship between rural hospital closures occurring from 2012 to 2019 and nursing home outcomes in the same county, using a dynamic difference‐in‐differences study design. Our specific research questions are as follows: Did closure of rural hospitals change utilization of nursing homes in the same counties? Did closure of rural hospitals impact the health of residents in nursing homes in the same counties?
Recent literature and conceptual framework
Previous research found that rural hospital closures were associated with decreased labor force, 11 , 12 reduced population size, 12 and increased unemployment in their localities. 13 Studies have identified potential effects on health care access such as decreased supply of general practitioners and specialists, 14 increased travel distances, 7 , 10 and increased emergency response times. 15 These findings inform our understanding of how a nursing home in the same area as a closure may be impacted. 16 To our knowledge, no study has explored the relationship between rural hospital closure and nursing homes. We therefore outline two potential pathways by which a rural hospital closure may affect nursing homes and use them to form corresponding hypotheses. Pathways are summarized in Figure 1.
FIGURE 1.
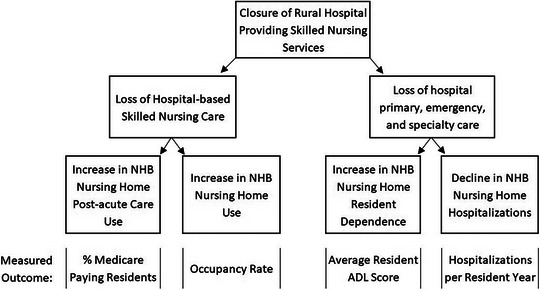
Authors' visualization of conceptual framework relating hospital closure to non‐hospital‐based nursing home outcomes. ADL, activities of daily living; NHB, non‐hospital based.
First, a hospital closure can result in the loss of nursing services it provides, often in the form of skilled nursing facilities or inpatient skilled nursing beds. In terms of skilled nursing services, hospitals tend to focus on rehabilitative and shorter term post‐acute care, while non‐hospital‐based nursing homes care for a larger proportion of residents receiving care indefinitely. 17 , 18 Immediately upon closure, hospital‐based post‐acute residents could move to local non‐hospital‐based nursing homes, increasing utilization and altering the resident mix of those facilities. Our first hypothesis is thus that the closure of a hospital providing post‐acute care results in an increased occupancy rate and proportion of post‐acute residents in local non‐hospital‐based nursing homes.
Second, decreased access to emergency, primary, and inpatient care provided by the hospital may negatively impact local nursing home resident health. Nursing homes may interact with local hospitals for resident routine care as well as hospitalizations, discharge, and rehabilitation. 19 , 20 , 21 For non‐hospital‐based nursing homes, the local hospital may be the only easily accessible provider when residents require more advanced care. 1 If the distance from a nursing home to medical providers increases following a hospital closure, the effect on the decision‐making procedures and resident outcomes is unclear. We posit that hospital closure may lead to decreased utilization of hospital services and reduced health among nonh‐ospital‐based nursing home residents. Given this, our second hypothesis states that closure of a hospital providing postacute care results in decreased hospitalizations and increased dependence on care among local nursing home residents.
METHODS
Data sources
All nursing home‐level outcome variables and nursing home characteristics were pulled from LTCFocus unless otherwise specified. 22 LTCFocus is an open‐source dataset sponsored by the National Institute on Aging through a cooperative agreement with the Brown University School of Public Health. The dataset includes facility‐level data on all nursing homes certified by Medicaid and Medicare in the United States (excluding Alaska and the District of Columbia). It pulls from the Minimum Data Set (MDS), Certification and Survey Provider Enhanced Reports (CASPER), and the Residential History File. MDS is a federally mandated clinical assessment of Centers for Medicare & Medicaid Services (CMS) certified nursing home residents, completed upon nursing home admission and periodically thereafter. 23 CASPER are survey data from nursing facility annual certification inspections, consolidated in the CASPER database. 24 The Residential History File was developed at the Brown University Center for Gerontology and Healthcare Research and uses Medicare enrollment data, Medicare claims, and MDS data to track per‐person history of health service utilization in the long‐term care system. 24
We combined LTCFocus datasets from 2011 to 2019 with Medicare Provider of Service Files from the fourth quarter of each study year to determine nursing home CMS certification as Medicare only, Medicaid only, or dually certified. 25 Hospital characteristics were pulled from Medicare Costs Reports via the Healthcare Cost Report Information System for hospitals with greater than 360 days in their cost report period (Worksheet S‐2 P1; S‐3 P1). 26 We identified closed hospitals and closure characteristics using the Rural Hospital Closures dataset curated by the NC Rural Health Research Program since 2005 (downloads from October 2022 and January 2024). 2 All analyses were conducted using Stata Statistical Software Version 17.0 BE.
Study sample
Our sample included nursing homes in rural counties within the contiguous United States as defined by the National Center for Health Statistics (NCHS) 2013 rural‐urban classification scheme. 27 The NCHS scheme uses the 2010 Office of Management and Budget metropolitan statistical areas (MSAs) and micropolitan statistical areas to define six county categories by: (1) their status under the OMB delineation of MSA and micropolitan statistical areas, (2) the population size of their MSA, and (3) the location of city populations within the largest MSAs. From most urban to least, the categories are large central metro, large fringe metro, medium metro, small metro, micropolitan, and noncore. We include micropolitan and noncore counties, where micropolitan counties are those with an urbanized area between 10,000 and 49,999 people and noncore counties do not have an urban cluster of 10,000 or greater. We narrowed our sample to a balanced panel of facilities and focused on non‐hospital‐based 28 nursing homes, as they make up the vast majority of rural nursing homes and are most directly impacted by closure via our conceptual framework. We explored the inclusion of hospital‐based nursing homes and an unbalanced panel in the Appendix (Appendix Tables 3, 4, and 5). We required nursing homes to be dually certified by Medicare and Medicaid and to have the same CMS Certification Number and facility address for all study years.
Our sample of rural non‐hospital‐based nursing homes was then limited to those that shared a county with one or more hospitals providing post‐acute care. We categorized a hospital as having post‐acute care in a given study year if it reported greater than zero Medicare skilled nursing days either via swing beds, hospital‐based nursing facilities, hospice, or home health in its cost report. We required a hospital to provide post‐acute care in all 9 study years, or, if a closure county, 2 years before closure and every study year prior. We allowed 2012 closure hospitals to provide postacute care in 2011, 2012, or both, given limited study years with which to determine service history. Finally, we excluded nursing homes in counties with a hospital closure outside the study period (2005–2011 or 2020–2022) or with a hospital reopening between 2011 and 2019.
Key variables
We used four nursing home‐level outcome variables provided in LTCFocus to test our hypotheses. These included occupancy rate, percent of Medicare paying residents, hospitalizations per resident year, and average resident Activities of Daily Living (ADL) score. Occupancy rate equals the number of residents divided by the total number of beds as reported in CASPER and serves as an indication of facility capacity and need for services. 29 The percentage of Medicare paying residents was derived from CASPER data and calculated by dividing the number of residents whose primary support was Medicare by the total number of residents. Residents paying for services with Medicare were those receiving postacute care. 30
Information for hospitalizations per resident year was pulled from the Residential History Files. Resident years were calculated by taking the total number of nursing home days in a year for a given facility and dividing it by 365. The annual count of hospitalizations from the nursing home was then divided by the number of resident years. Average resident ADL score was derived from MDS assessments and takes the average score of all residents present on the first Thursday in April. The ADL score measures an individual's level of independence in seven activities of daily living (bed mobility, transfer, locomotion on unit, dressing, eating, personal hygiene, and toilet use). Total ADL scores range from 0 to 28, with 28 being most dependent on care.
Analysis
We used a difference‐in‐differences study design with staggered treatment timing to relate hospital closure to nursing home‐level outcomes in the same county, with a comparison group of rural nursing homes that did not experience closure. We ran our model using the Callaway and Sant'Anna estimator, which addresses potential bias introduced by treatment effect heterogeneity over time and across treatment timing cohorts in the classic two‐way fixed effect model. 31 , 32 To do so, the estimator calculates individual group‐time average treatment effects separately, avoiding problematic comparisons between later treated and newly treated units. These group‐time estimates of average treatment effect on the treated (ATTs) can then be aggregated into a variety of summary measures. We aggregated pre‐ and post‐event estimates (Table 2) and provided plots of the dynamic time‐to‐event estimates (Figure 2). The Callaway and Sant'Anna estimator allows the reference group to include never‐treated units and/or not‐yet‐treated units. We ran base models with never‐treated and not‐yet‐treated units as the comparator, meaning nursing homes in counties without a hospital closure and closure county nursing homes that have not yet experienced closure (see adjustments to the comparison group in Appendix Table 6).
TABLE 2.
Aggregated pre‐ and posteffects of rural hospital closures and nonhospital‐based nursing home outcomes.
| Preclosure event study aggregate | Postclosure event study aggregate | |||
|---|---|---|---|---|
| 95% CI | 95% CI | |||
| β | [SE] | β | [SE] | |
| Occupancy rate | −0.457 | [0.268] | 0.078 | [1.051] |
| N = 16,991 | −0.982 | 0.067 | −1.982 | 2.138 |
| % Medicare paying | −0.110 | [0.338] | 0.115 | [0.460] |
| N = 17,001 | −0.772 | 0.552 | −0.787 | 1.017 |
| Hospitalizations per resident year | −0.016 | [0.010] | −0.130 | [0.058] * |
| N = 16,474 | −0.036 | 0.005 | −0.243 | −0.017 |
| Average resident ADL score | 0.107 | [0.070] | −0.230 | [0.251] |
| N = 16,982 | −0.030 | 0.244 | −0.723 | 0.263 |
Note: average resident ADL score for facility residents increases with the level of resident dependence
Abbreviations: ADL, activities of daily living
p < 0.05.
FIGURE 2.
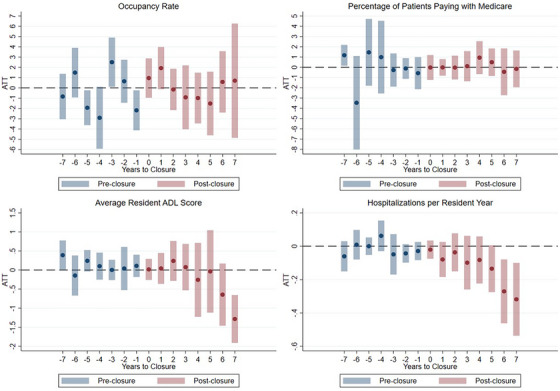
Figure includes results of authors' analysis relating hospital closure to nursing home level outcomes. ADL, Activities of daily living.
The validity of our model requires that the parallel trends assumptions holds, meaning that the comparison group represents the counterfactual trend in outcomes that would have occurred among the treatment group in the absence of treatment (i.e., if all closed hospitals remained open). 31 Although the parallel trends assumption cannot be directly evaluated, if the pre‐period ATTs show no obvious patterns and are not statistically significant, there is evidence for its validity. Given the inclusion of covariates, parallel trends can be interpreted as conditional on covariates. We included a time‐invariant state‐level indicator for 2014 Medicaid expansion status and a covariate for county‐level number of nursing homes in the base period to account for differences in local services. Results relying on alternative covariates related to county level health services are provided in Appendix Tables 3 and 8. We clustered standard errors at the treatment (county) level. All outcome variables were coded as continuous and effects estimated from complete cases.
RESULTS
We identified 4688 rural nursing homes present from 2011 to 2019; exclusions thereafter are summarized in Appendix Figure 1. Of those 4688 nursing homes, 3541 were dually certified and non‐hospital‐based. 1889 met treated or never‐treated group criteria, with 119 nursing homes experiencing hospital closure in the same county of residence and 1770 never‐treated. This equated to 1071 and 15,930 total observations across nine study years in each group, respectively. The distribution of closures was relatively even across study years (Table 1). Fifty‐eight nursing homes were in counties with complete closures (a facility no longer provides health services) and 61 were in counties with converted closures (i.e., conversions to another type of health care facility without inpatient services), with no documented conversions to skilled nursing facilities (SNFs).
TABLE 1.
Not‐yet and never treated group characteristics in 2011 baseline year.
| Not‐yet‐treated * group | Never‐treated group | ||
|---|---|---|---|
| Total observations | 1071 | 15,930 | |
| Distinct facilities (unit of observation) | 119 | 1770 | |
| Distinct counties | 43 | 746 |
| Mean (SD) | Mean (SD) | p Value | |
|---|---|---|---|
| Average # NHs per county ** | 6.37 (4.32) | 4.17 (2.68) | <0.001 |
| Average # hospitals per county | 2.29 (1.09) | 1.44 (0.73) | <0.001 |
| Occupancy rate | 82.98 (1.38) | 79.72 (0.35) | 0.064 |
| Average resident ADL score | 16.08 (2.50) | 15.24 (2.58) | <0.001 |
| Hospitalizations *** | 1.02 (0.40) | 0.85 (0.41) | <0.001 |
| Percent Medicare | 12.20 (6.78) | 11.04 (6.91) | 0.060 |
| Percent Medicaid | 65.97 (15.01) | 62.09 (15.83) | 0.009 |
| N (%) | N (%) | p Value | |
|---|---|---|---|
| State expanded Medicaid in 2014 | 56 (47.10) | 1108 (62.60) | <0.001 |
| Total beds | |||
| <50 | 13 (10.92) | 229 (12.94) | |
| 50–100 | 43 (36.13) | 963 (54.41) | |
| 100+ | 63 (52.94) | 578 (32.66) | <0.001 |
| Chain affiliated | 74 (62.18) | 1014 (57.29) | 0.30 |
| For‐profit | 86 (72.27) | 1199 (67.74) | 0.310 |
| Hospital closures in county | |||
| Closure type | |||
| Complete | 58 (49.74) | ||
| Converted | 61 (51.26) | ||
| Year of closure | |||
| 2012 | 15 (12.61) | ||
| 2013 | 10 (8.40) | ||
| 2014 | 25 (21.01) | ||
| 2015 | 9 (7.56) | ||
| 2016 | 10 (8.40) | ||
| 2017 | 16 (13.45) | ||
| 2018 | 8 (6.72) | ||
| 2019 | 26 (21.85) |
The comparison group in the base analysis included not‐yet‐treated and never‐treated nursing homes. Not‐yet‐treated nursing homes observations are from the pretreatment period of treated nursing homes. For example, a nursing home treated in 2015 contributes not‐yet‐treated observations from 2011 to 2014. Because we consider hospital closures from 2012 onwards, all treated nursing homes are not‐yet‐treated in 2011.
Average number of nursing homes is based on count of facilities in the county before excluding nursing homes present for less than 9 years and hospital‐based facilities.
Hospitalizations are expressed as hospitalizations per resident year. (NH = Nursing Home; ADL = activities of daily living, average resident ADL score for facility residents increases with the level of resident dependence). p Values are associated with t‐tests and Chi‐square tests (for categorical variables) comparing not‐yet‐treated and never‐treated groups.
The distribution of treated and never‐treated nursing homes varied across states due to the smaller number of treatment nursing homes (counts by state in Appendix Table 1). Treated nursing homes were located in counties with a higher average number of nursing homes, averaging 6.37 nursing homes per county compared to 4.17 in the never‐treated group. Outcome variable distributions were generally similar across groups, but occupancy rate variation was higher among not‐yet‐treated nursing homes, which averaged an occupancy of 82.98% occupancy (SD = 1.38), than never‐treated averaging 79.72% (SD = 0.35). Medicare paying residents made up 12.2% of not‐yet‐treated nursing home residents and 11.0% of never‐treated nursing home residents. Not‐yet‐treated nursing home residents were more dependent on care, with an average ADL score of 16.08 (SD = 2.50) compared to 15.24 (SD = 2.58) among residents in never‐treated nursing homes. Finally, not‐yet‐treated nursing home residents had slightly more hospitalizations per resident year (Mean = 1.02, SD = 0.40) than residents in never‐treated nursing homes (Mean = 0.85, SD = 0.41). Level differences are only a concern in this study design if they are indicative of differences in trends over time: that would suggest a violation of the parallel trends assumption, so we discuss the validity of this assumption for each outcome below.
Nursing home outcomes
We present the results of running a difference‐in‐differences model with staggered treatment timing to relate the closure of a rural hospital providing post‐acute care to non‐hospital‐based nursing home outcomes in the same county. Aggregated pre‐ and post‐period estimates represent this impact on nursing home‐level occupancy rate, proportion of Medicare paying residents, hospitalizations per resident year, and average resident ADL score (Table 2). Dynamic point estimates for each outcome variable are plotted with 95% confidence intervals (Figure 2).
We find that the pretreatment effect estimates related to nursing home occupancy rate were statistically significant, suggesting that the parallel trends assumption did not hold for this outcome. These findings and the lack of clear post‐treatment effects suggest no firm conclusions related to hospital closures’ effects on nursing home occupancy rate. Dynamic effects of hospital closure on percentage of Medicare paying residents showed no clear pattern and were statistically nonsignificant in all but one pre‐closure year, supporting the parallel trends assumption. The dynamic effects of hospital closure on the proportion of Medicare residents were consistently close to zero post‐closure. In aggregate, hospital closure was associated with a nonsignificant 0.12 percentage point increase in the percent of Medicare paying residents (95% CI: –0.79, 1.02). Occupancy rate was missing for 0.06% of observations; no Medicare payment observations were missing.
Preclosure dynamic effects on nursing home level hospitalizations per resident year showed no clear pattern and were statistically nonsignificant, supporting the parallel trends assumption. Missing observations made up 3.08% of the sample, with 3.26% and 0.47% of observations missing hospitalization data in the comparison group and treated group, respectively. Post‐closure dynamic effects were consistently negative in direction. The largest dynamic effects were seen in years furthest from the year of closure. In aggregate, hospital closure was significantly associated with 0.13 fewer hospitalizations per resident year (95% CI: –0.24, –0.02), equivalent to 0.33 total sample standard deviations from the grand mean. Based on the not‐yet‐treated nursing home average number of hospitalizations per resident year of 1.02 in 2011, a change of –0.13 amounts to a 13% decrease in hospitalizations per resident year.
Pre‐closure year estimates for average resident ADL score generally supported the parallel trends assumption, as the dynamic preclosure effects were statistically nonsignificant and not uniformly directional. Missing observations for average ADL score per resident amounted to 0.11% of the comparison group, with no missingness in the treatment group. The aggregated postclosure effect was a 0.23 unit decrease in the average resident ADL score; however, this effect was statistically nonsignificant (95% CI: –0.72, 0.26). Dynamic effects demonstrate that meaningful negative estimates are in years furthest from closure only; these estimates should be interpreted with caution given the smaller number of observations available for periods further from the treatment year.
Robustness checks and subanalyses
The Appendix includes the results and our discussion of adjustments to the main analysis (Appendix Tables 2–8 and Appendix Figure 2). Overall, our sensitivity and follow‐up analyses yielded similar results to those in Table 2 with some exceptions. A sub‐analysis of complete closures alone substantially increased post‐period estimate magnitudes across all four outcomes while converted closures resulted in smaller effects, though estimates were less precise and nonsignificant (Appendix Table 7). Relaxing the postacute care provision requirement on hospitals reduced the estimate on hospitalizations per resident year dramatically (from 0.130 to 0.051), suggesting that the relationship between closures and nursing homes may be more relevant where hospitals are participating in the SNF market. Finally, aggregating treatment up to the level of Commuting Zones (aggregated clusters of economically related counties created by the Economic Research Service) 33 reduced the effect estimates on all outcomes, supporting the idea that distance from nursing home to hospital closure is inversely proportional to treatment effect (Appendix Table 7).
DISCUSSION
The purpose of this study was to increase understanding of how rural hospital closures may impact the older adult population and services relevant to them. Specifically, we analyzed the closure of hospitals providing skilled nursing care and the resulting impacts on local, non‐hospital‐based nursing home outcomes (e.g., nursing home utilization and resident health). We identified no meaningful impacts on nursing home utilization. There was no compelling evidence to support our hypothesis that occupancy rate increased post‐closure, though caution should be used in drawing conclusions for this outcome given potential violations of model assumptions. Further, we find no evidence that closure influences the percentage of Medicare paying residents in non‐hospital‐based nursing homes.
We modeled effects of closure on resident health as measured by average resident ADL score and hospitalizations per resident year. Our findings did not align with our initial hypothesis that resident dependence would increase post‐closure. Average resident ADL score declined, but the small effect size and inconsistent dynamic effects suggest hospital closure was not meaningfully associated. Lastly, we found hospital closure was significantly and negatively associated with nursing home resident hospitalizations per resident year. The aggregated effect size was moderate and dynamic effects grew more negative with years after closure.
One reason that closures might result in fewer hospitalizations is due to decreased access to care. Studies have identified that hospital closures increase travel distances to health services for rural residents. 1 , 10 , 15 , 34 Newly increased distance to services may have made transportation less convenient or accessible and resulted in reduced utilization of hospital services by nursing homes. Our findings cannot describe whether reduced hospitalizations reflect a decline in emergent, urgent, and/or elective admissions, but regardless, the impact on nursing home residents could be substantial. Consider the following:
Emergent admissions: If nursing home residents must travel longer distances to reach the nearest emergency department, the additional time can be critical in life‐threatening situations. This delay can lead to worse health outcomes and increased mortality rates.
Urgent admissions: For urgent but nonlife‐threatening conditions, the closure of rural hospitals means that nursing home residents might face delays in receiving timely care. This can result in conditions worsening and potentially becoming emergencies.
Elective admissions: Nursing home residents may need to travel to urban centers for elective surgeries and other planned treatments, which can be inconvenient and costly.
This study explores hospitalization among nursing home residents and accounts for hospitalizations regardless of where they took place. Previous literature has demonstrated that admissions may increase in surrounding hospitals after the closure of a nearby facility, but there is little existing literature on nursing home resident interaction with hospitals post‐closure. 16 Study of additional health outcomes could contextualize our findings and clarify their practical significance. ADL score is one measure for understanding resident health, but the root of hospitalization changes may be reflected in other metrics.
Limitations
This study has several limitations. First, rural hospital closures are rare, and we focus on acute hospitals that also provide post‐acute care, restricting our ability to stratify further along dimensions of rurality or nursing home characteristics while maintaining statistical power. Estimates produced when stratifying by closure type demonstrate noise associated with running sub analyses. Second, our treatment is at the county level; county size and geographic layout vary in ways that may influence the strength of treatment or introduce heterogeneity across regions. Third, we rely on publicly available data, limiting the outcomes we can analyze due to high levels of cell size suppression across certain measures. Sensitivity analyses included in the Appendix explore the relevance of treatment assignment and stratifications with unchanged results, overall. When considering these limitations, we believe our findings provide a compelling starting point to understand the relationship between hospital closures and nursing homes.
CONCLUSIONS
To our knowledge, this was the first study examining the impacts of hospital closure on nursing homes. We found little evidence to suggest hospital closure impacted non‐hospital‐based nursing home occupancy rate, percent of Medicare paying residents, or average resident ADL score. However, we find a modest, negative association between rural hospital closures and non‐hospital‐based nursing home hospitalizations per resident year. Our results build on an existing body of literature on hospital closures by highlighting the understudied role of hospitals in rural post‐acute and long‐term care.
CONFLICT OF INTEREST STATEMENT
The authors report funding from the Federal Office of Rural Health Policy (FORHP), Health Resources and Services Administration (HRSA), US Department of Health and Human Services (HHS) under cooperative agreement # U1CRH03714‐10‐00. The information, conclusions, and opinions expressed in this manuscript are those of the authors and no endorsement by FORHP, HRSA, HHS, or The University of North Carolina is intended or should be inferred. Susie Gurzenda was supported by the NICHD of the National Institutes of Health under award number T32 HD091058.
FUNDING INFORMATION
The authors received no financial support for the research, authorship, and/or publication of this article.
Supporting information
Supporting Information
ACKNOWLEDGMENTS
The authors wish to thank: (1) The NC Rural Health Research Program for providing Hospital Cost Report Information System and rural hospital closure data; (2) Julie Perry for providing guidance on the closure data; and (3) Dr. Erin Kent for guidance and support in the early stages of this analysis.
Keesee E, Malone T, Gurzenda S, Pink G. Rural hospital closures and nursing home outcomes. J Rural Health. 2025;41:e70026. 10.1111/jrh.70026
REFERENCES
- 1. Rural Hospital Closures: Affected Residents Had Reduced Access to Health Care Services. Report to the Ranking Member, Committee on Homeland Security and Governmental Affairs, United States Senate. 2021:1‐40. GAO‐21‐93. https://www.gao.gov/products/gao‐21‐93
- 2. Rural Hospital Closures. Cecil G. Sheps Center for Health Services Research. Accessed April 16, 2025, https://www.shepscenter.unc.edu/programs‐projects/rural‐health/rural‐hospital‐closures/
- 3. Croll Z, Gale J. community impact and benefit activities of critical access, other rural, and urban hospitals. University of Southern Maine, Flex Monitoring Team. 2020;2022:1‐6. [Google Scholar]
- 4. Rural Hospitals. Rural Health Information Hub . Updated 2/10/2022. https://www.ruralhealthinfo.org/topics/hospitals
- 5. Health Care Capsule: Accessing Health Care in Rural America 2023 GAO‐23‐106651. Accessed November 26, 2024, https://www.gao.gov/products/gao‐23‐106651 [Google Scholar]
- 6. Randolph R, Thomas S, Holmes M, et al. Rural population health in the United States: a chartbook. NC Rural Health Research Program, Cecil G Sheps Center for Health Services Research, The University of North Carolina at Chapel Hill. Accessed November 26, 2024. 2023:1‐230. [Google Scholar]
- 7. McCarthy S, Moore D, Smedley WA, et al. Impact of rural hospital closures on health‐care access. J Surg Res. 2021;258:170‐178. doi: 10.1016/j.jss.2020.08.055 [DOI] [PubMed] [Google Scholar]
- 8. Rural Hospital Closures: Number and Characteristics of Affected Hospitals and Contributing Factors. Report to Congressional Requesters. 2018. Accessed December 8, 2024. https://www.gao.gov/products/gao‐18‐634 [Google Scholar]
- 9. Medicare Dependent hospitals serve over 60% inpatient days or discharges from Medicare patients, have 100 or fewer beds, and are located in rural areas. Accessed December 8, 2024.
- 10. Wishner J, Solleveld P, Rudowitz R, Paradise J, Antonisse L. A look at rural hospital closures and implications for access to care: three case studies. The Kaiser Family Foundation. 2016. https://www.kff.org/report‐section/a‐look‐at‐rural‐hospital‐closures‐and‐implications‐for‐access‐to‐care‐three‐case‐studies‐issue‐brief/ [Google Scholar]
- 11. Chatterjee P, Lin Y, Venkataramani A. Changes in economic outcomes before and after rural hospital closures in the United States: a difference‐in‐differences study. Health Serv Res. 2022;57(5):1020‐1028. doi: 10.1111/1475-6773.13988 [DOI] [PMC free article] [PubMed] [Google Scholar]
- 12. Malone TL, Planey AM, Bozovich LB, Thompson KW, Holmes GM. The economic effects of rural hospital closures. Health Serv Res. 2022;57(3):614‐623. doi: 10.1111/1475-6773.13965 [DOI] [PMC free article] [PubMed] [Google Scholar]
- 13. Holmes GM, Slifkin RT, Randolph RK, Poley S. The effect of rural hospital closures on community economic health. Health Serv Res. 2006;41(2):467‐485. doi: 10.1111/j.1475-6773.2005.00497.x [DOI] [PMC free article] [PubMed] [Google Scholar]
- 14. Germack HD, Kandrack R, Martsolf GR. When rural hospitals close, the physican workforce goes. Health Affairs. 2019;38(12):2086‐2094. doi: 10.1377/hlthaff.2019.00916 [DOI] [PubMed] [Google Scholar]
- 15. Miller KEM, James HJ, Holmes GM, Houtven CHV. The effect of rural hospital closures on emergency medical service response and transport times. Health Serv Res. 2020;55(2):288‐300. doi: 10.1111/1475-6773.13254 [DOI] [PMC free article] [PubMed] [Google Scholar]
- 16. Planey AM, Thomas SR, Friedman H, Hecht HK, Kent E, Holmes GM. Rural hospital closures: a scoping review of studies published between 1990 and 2020. J Health Care Poor Underserved;35(2):439‐464. [PubMed] [Google Scholar]
- 17. Rahman M, Norton EC, Grabowski DC. Do hospital‐owned skilled nursing facilities provider better post‐acute care quality? J Health Econ. 2016;50:36‐46. doi: 10.1016/j.jhealeco.2016.08.004 [DOI] [PMC free article] [PubMed] [Google Scholar]
- 18. Sulvetta MB, Holahan J. Cost and case‐mix differences between hospital‐based and freestanding nursing homes. Medic Medic Res Rev. 1986;7(3):75‐84. [PMC free article] [PubMed] [Google Scholar]
- 19. Xu H, Bowblis JR, Caprio TV, Li Y, Intrator O. Nursing home and market factors and risk‐adjusted hospitalization rates among urban, micropolitan, and rural nursing homes. J Am Med Dir Assoc. 2021;22(5):1101‐1106. doi: 10.1016/j.jamda.2020.08.029 [DOI] [PubMed] [Google Scholar]
- 20. Coburn AF, Keith RG, Bolda EJ. The impact of rural residence on multiple hospitalizations in nursing facility residents. Gerontologist. 2002;42(5):661‐666. doi: 10.1093/geront/42.5.661 [DOI] [PubMed] [Google Scholar]
- 21. Clement JP, Khushalani J, Baernholdt M. Urban‐rural differences in skilled nursing facility rehospitalization rates. J Am Med Dir Assoc. 2018;19(10):902‐906. doi: 10.1016/j.jamda.2018.03.001 [DOI] [PubMed] [Google Scholar]
- 22. LTCFocus Public Use Data is sponsored by the National Institute on Aging (P01AG027296) through a cooperative agreement with the Brown University School of Public Health. www.ltcfocus.org. Accessed January 3, 2023. doi: 10.26300/h9a2-2c26 [DOI]
- 23. Nursing Home Quality Initiative. Centers for Medicare & Medicaid Services. Accessed November 26, 2024. https://www.cms.gov/medicare/quality/nursing‐home‐improvement
- 24. Who We Are. LTCFocus, Brown University. Accessed January 20, 2024. https://ltcfocus.org/about [Google Scholar]
- 25. Provider of Services File—Hospital & Non‐Hospital Facilities Centers for Medicare and Medicaid Services. Accessed July 18, 2024. https://data.cms.gov/provider‐characteristics/hospitals‐and‐other‐facilities/provider‐of‐services‐file‐hospital‐non‐hospital‐facilities [Google Scholar]
- 26. Cost Reports. Centers for Medicare and Medicaid Services. Updated 07/11/2024. https://www.cms.gov/data‐research/statistics‐trends‐and‐reports/cost‐reports
- 27. NCHS Urban‐Rural Classification Scheme for Counties. U.S. Department of Health and Human Services. Accessed June 01, 2017. https://www.cdc.gov/nchs/data_access/urban_rural.htm#2013_Urban‐Rural_Classification_Scheme_for_Counties
- 28. LTCFocus contains a hospital‐based indicator variable . CMS defines a hospital‐based facility as one created or acquired by a hospital and that is under its ownership, administrative, and financial control.
- 29. Harrington C, Carrillo H, Garfield R, Squires E, Nursing facilities, staffing, residents and facility deficiencies, 2009 through 2016. The Kaiser Family Foundation; 2018. Accessed April 3, 2018. https://www.kff.org/report‐section/nursing‐facilities‐staffing‐residents‐and‐facility‐deficiencies‐2009‐through‐2016‐facility‐characteristics/
- 30. Skilled nursing facility care Centers for Medicare and Medicaid Services. Accessed April 16, 2025. https://www.medicare.gov/coverage/skilled‐nursing‐facility‐snf‐care [Google Scholar]
- 31. Freedman SM, Hollingsworth A, Simon KL, Wing C, Yozwiak M. Designing difference in difference studies with staggered treatment adoption: key concepts and practical guidelines. Annu Rev Public Health. 2024; 45:485‐505. Accessed April 16, 2025. doi: 10.1146/annurev-publhealth-061022-050825 [DOI] [PubMed] [Google Scholar]
- 32. Callaway B, Sant'Anna PHC. Difference‐in‐differences with multiple time periods. Journal of Econometrics. 2020;225(2):200‐230. doi: 10.1016/j.jeconom.2020.12.001 [DOI] [Google Scholar]
- 33. Commuting Zones and Labor Market Areas. Economic Research Service. Accessed March 26, 2019. https://www.ers.usda.gov/data‐products/commuting‐zones‐and‐labor‐market‐areas/ [Google Scholar]
- 34. Reif SS, DesHarnais S, Bernard S. Community perceptions of the effects of rural hospital closure on access to care. J Rural Health. 1999;15(2):202‐209. doi: 10.1111/j.1748-0361.1999.tb00740.x [DOI] [PubMed] [Google Scholar]
Associated Data
This section collects any data citations, data availability statements, or supplementary materials included in this article.
Supplementary Materials
Supporting Information