

Abstract
Physiological systems are inherently complex, driven by non-linear interactions among various subsystems that govern their function across diverse spatiotemporal scales. Understanding this interconnectedness is crucial; in this sense, the structure function enables us to dissect the dynamic intricacies of biological responses. By examining amplitude fluctuations across different timescales, we can gain valuable insights into the variability and adaptability of these vital systems. A structure function serves as an essential tool for uncovering long-term correlations that highlight self-organizing behavior. Additionally, it effectively examines the fractal characteristics of short-term signals influenced by the measurement noise often present in biological data. This paper presents a novel investigation into how various parameters of the structure function of the PhotoPlethysmoGraphic (PPG) signal can serve as reliable physiological biomarkers indicative of an individual’s cardiorespiratory activity level. Preliminary tests on 40 students from the Universidad Politécnica de Madrid (UPM), all young and healthy individuals aged between 19 and 30, yielded promising results. These findings enhance our understanding of PPG signal dynamics from a physiological standpoint and provide a procedural framework for real-time patient monitoring and health assessment in clinical environments.
Keywords: Structure function, PPG signal, Complexity, Physiological biomarkers
Subject terms: Diagnosis, Statistical methods, Health care, Physiology, Blood flow
Introduction
A PhotoPlethysmoGraphic (PPG) signal indicates changes in blood volume within microvasculature over time. This non-invasive method, which uses optical techniques for precise measurement, has allowed monitoring of arterial oxygen saturation since its first clinical application in the 1970s1. In recent years, the PPG signal has attracted the attention of many clinical researchers2–6. The introduction of non-linear analysis tools to the study of the PPG signal7 has made it possible to easily acquire markers that have contributed to an increasingly better characterization, at least statistically, of the state of the cardiorespiratory system8. The different proposals for mathematical models that reproduce the morphology of the PPG signal are proof of this9–13. However, all of these are parametric models14, indicating the inability to establish a physical correspondence between the parameters of the model and the actual physical system that generates the PPG signal.
Models based on structural connectivity give way to models based on information transfer and processing15. A complete description of the functional dynamics of the physiological system that produces the PPG signal is necessary to formulate more realistic mathematical models. Models that focus less on the morphological effects of the physiological system’s functional dynamics and more on the operational causes that are ultimately reflected directly or indirectly in the signal’s morphology16. Therefore, it is necessary to unravel the physiological complexity from the theory of dynamic systems and the non-linear analysis of time series. This complexity is disguised as a seemingly innocent pulse wave with a “quasi-regular” pattern and has traditionally been used to measure heart rate and blood oxygen saturation17. We have only started to grasp the full complexity underlying this seemingly straightforward measurement.
The detectable regularity of physiological functions is manifested in the instantaneous frequency, serving as an indicator of small-scale, microscopic, high-resolution observation. The observed frequency displays nuanced changes as a subtle modulation shaped by the coordinated functioning of the entire physiological system at diverse scales, responding to the body’s specific physiological requirements. Most biological systems exhibit highly complex behavior due to the intricate non-linear coupling between multiple subsystems that cooperate, gear-like, in a given physiological function18. A disturbance can upset the delicate balance present, whether temporary or due to organic dysfunction. On numerous occasions, absorption occurs, and the normal operating mode will be restored after a reasonable time (remember that the response capacity of physiological systems is slow). Still, in other more severe circumstances, the “functional damage” can become irreversible to the point of causing organic death19.
Hence, it is essential to utilize analytical tools to assess complexity across various temporal and spatial scales and determine whether it exhibits functional correlations at these scales or behaves stochastically20. The investigation of long-term correlations originated from Hurst’s analysis of the variations in Nile River flows21. The Hurst exponent, represented as  , differentiates the types of correlation observed within a time series, as outlined in Subsection Method: structure function, which details the selected methodology: the structure function. Numerous techniques exist for calculating the Hurst exponent (refer to Section Theory/calculation). However, the structure function offers a localized examination of the variations a signal undergoes across different scales. It is an effective instrument for identifying transitions between states while incurring a computational cost significantly lower than alternative methods.
As far as we know, the structure function has been applied in some physiological systems22,23 but not in the PPG signal case. The results derived from its application are promising in the presence of time series contaminated by measurement noise and of short length (highly appreciated in real-time systems)24. Stochastic behavior can be distinguished by its robustness to noise, indicating that random fluctuations less influence its dynamics. In this context, the precision of the dynamics is shaped not primarily by specific central tendencies, such as statistical averages, but rather by a more nuanced understanding of how various factors interrelate within the system. This perspective emphasizes the intricate details and variations that underlie the dynamics, offering a richer insight into the processes at play.
A non-linear analysis helps identify patterns in the variability of irregularities in the temporal evolution of physiological responses. Studying fluctuations on different timescales helps identify these patterns of variability and their degree of correlation. The development of the transition between small and large scales is still unknown. In contrast, a linear analysis only enables statistical averages to be evaluated without considering the temporal order of the data (the contribution is estimated rather than the temporal organization of said contribution). The linear strategy can make random and non-linear behavior indistinguishable from a complex temporal organization of patterns.
Long-term memory has physiological implications that are of great importance in the correct homeostatic dynamics of an organism25. The automatisms of the control of the central autonomic system constantly modulate the regular rhythm of many physiological activities vital for organic and functional survival. The physiological oscillations of the cardiorespiratory system are a faithful reflection of the complex non-linear interactions of a whole network of control loops. Hence, it is essential to understand how the regulatory subtleties are interwoven in this quasi-regular rhythm when physiological conditions require it18. The modulation system of cardiorespiratory activity is still largely unknown. However, the inherent complexity of the process presupposes a non-linear dynamic operating in a coordinated manner at different timescales.
This paper presents an approach using the structure function to analyze the evolution of diverse dynamics within a time series, considering the varying timescales under investigation. For the first time, as far as we know, the analysis focuses on PPG signals obtained from young and healthy individuals. The paper delves into the capabilities of the method to evaluate PPG signals. It discusses the possible applications of this method to obtain information from such signals, proposing three parameters as biomarkers that can help study an individual’s physiological state.
This paper is organized as follows. Section "Material and method" provides an overview of the analyzed physiological database, the PPG signal acquisition procedure with a morphological signal characterization, and the structure function-based data analysis method, focusing on interpreting parameters associated with dynamic complexity, such as long-term correlations or fractal spectrum. In Section "Theory/calculation", the time series structure function is calculated and represented in detail. Examples of series derived from various measurements or signals are included, highlighting the characteristic parameters of the structure function graphs that may have potential discriminatory power at the physiological level. Section "PPG signal study case" discusses the information the structure function provides from a PPG signal. Next, the section "Biomarkers of the structure function in the PPG signal database" shows the parameter values obtained by applying the structure function analysis methodology to the PPG signals of healthy young individuals at rest (basal state) under our existing physiological database. Finally, the section “Conclusion” presents some brief conclusions.
Material and method
When studying biological signals, it is essential to understand the origins of the databases used and their relevance to obtaining generalizable information. This section presents a brief overview of the data sources used in this study. The following outlines the established key features of the analyzed PPG signal. Finally, the fundamental concepts of the structure function are summarized. The steps to apply the structure function method that analyzes PPG signals for the first time are outlined in the next section.
Material: biological signal database
The database supporting this research involved 40 UPM (Universidad Politécnica de Madrid) students and healthy young people between 19 and 30. The volunteers declared they were not habitual consumers of psychotropic substances and confirmed the absence of a diagnostic history of chronic illness, psychopathologies, or both. Through quota sampling, compliance with gender parity was satisfied, 50% men and 50% women26.The comprehensive statistical analysis of the PPG dataset reveals notable variability among individuals, a finding thoroughly expounded upon in27.
These signals were collected according to the protocol established in a study to assess stress26. Two sessions, each lasting approximately 60 minutes, were conducted with a two-week temporal separation between them27. The biological signals examined in this study were recorded during the initial session and referred to as the basal level. In our case, the interest is focused exclusively on the PPG signal under uninterrupted relaxation conditions. During the basal level session, participants were positioned in a supine posture conducive to relaxation, allowing for the establishment of individual baseline physiological values in the absence of stressors. Figure 1 shows a basal PPG signal from a single individual in the database.
Fig. 1.
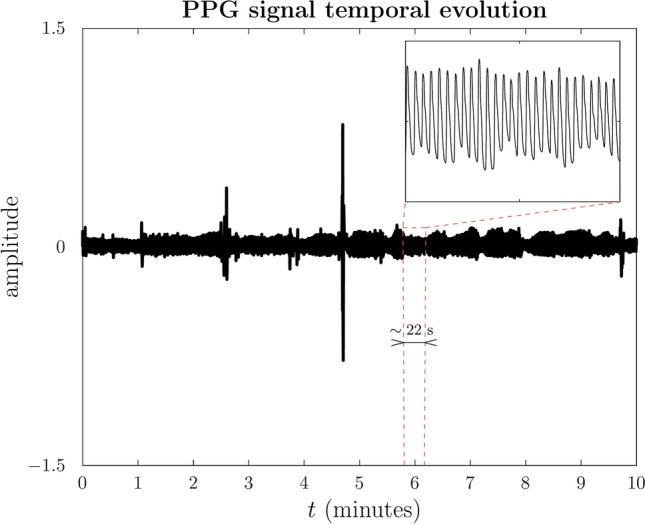
Segment of a PPG signal sample as acquired instrumentally. The ten minutes are taken from the center of the basal session, which has a data acquisition time of 60 minutes. Non-stationary is evident over both long and short timescales. Different parts of the signal differ in amplitude and frequency variations. The observed peaks likely indicate sudden and involuntary movements of the finger upon which the sensor is positioned. Finger misalignment is anticipated to exacerbate the noise level in the observation.
All PPG signals were captured from the middle finger of the left hand and sampled at a frequency of 250 Hz26, so the sampling time is  ms with the psychophysiological telemetric system “Rehacor-T” version “Mini” from Medicom MTD Ltd26. The study captured different biological signals. In this work, we present an analysis method that is valid, in principle, for any biological signal, but we only present the results for the PPG signal.
PPG signal
Despite its apparent simplicity, the PPG signal contains dynamic subtleties, making it extraordinarily complex. It contains relevant physiological information not limited to heart rate or blood oxygen saturation, indicators that are very representative of clinical environments28. Figure 2 indicates that the raw PPG signal has two primary components: the pulsatile or AC component and the non-pulsatile or DC component.
Fig. 2.
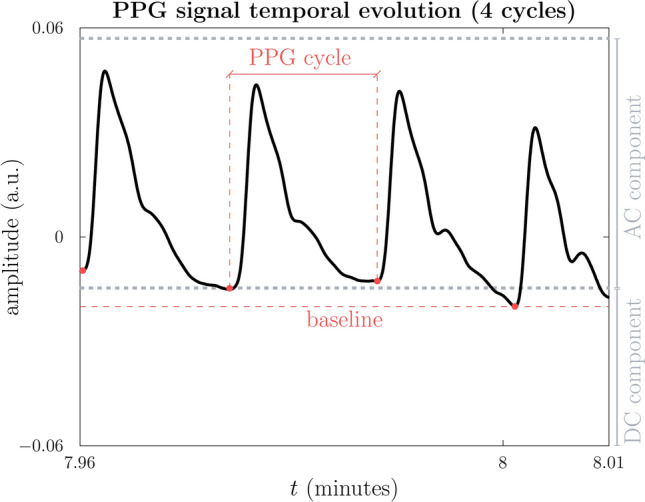
Segment of a PPG signal sample as acquired instrumentally. The three seconds represented are taken from Figure 1. Different parts of the signal exhibit variations in DC, AC amplitude, and frequency. The non-pulsatile or direct current (DC) component is determined by calculating the mean of the minimum values from each photoplethysmography (PPG) cycle, as represented by the formula  . In this context, i denotes the index of the i-th PPG cycle. The AC component, or pulsatile component, is calculated as the mean of the maximum value from each PPG cycle, subtracting the DC component. Thus,
  . The baseline is the minimum value among all cycles. The values depicted in the graph are a short section of the 10-minute signal shown in Figure 1.
The pulsatile component denotes the variations in blood volume in each cardiac cycle. The pulsatile component is very small compared to the non-pulsatile component, which depends on the structure of the tissue and the average volume of blood flow circulating through arterioles and venules29. The pulsatile component is superimposed upon the non-pulsatile component. The non-pulsatile component is related to respiration, and its slow variation is inversely proportional to volumetric flow. Variations in the AC and DC components are associated with vasomotor tone, which regulates the arterial pressure of blood vessels within established physiological limits30. The respiratory rate modulates the PPG signal waveform in three possible ways. An autonomic response to breathing induces changes in heart rate (frequency modulation, increases during inspiration and decreases during expiration) to synchronize heart and respiratory rates. A variation in intrathoracic pressure causes blood exchange between the pulmonary circulation and the general circulation of the system (bloodstream), inducing a variation in the perfusion baseline (amplitude modulation). Respiration also causes a decrease in cardiac flow due to poor ventricular filling, reflected in a change in peripheral pulse amplitude (amplitude modulation)31.
Conventional pulse oximeters measure volumetric changes in the peripheral blood flow of a finger (distal phalanx). In its most basic conception, they use a transmission mode configuration: the light transmitted by an LED, tuned to a specific wavelength (usually green light due to its greater resolution in discriminating the systolic and diastolic phases of the cardiac cycle), passes through the finger and is captured by a photodetector. The photodetector generates a voltage proportional to the light received, commonly called the PPG signal. The greater the blood volume that circulates through the vasculature of the finger, the less light is absorbed by the photodetector. During the systolic phase, the amount of light captured by the photodetector is less than during the diastolic phase.
The morphology of the resulting PPG signal forms a mirror image of blood pressure; hence, to facilitate its reading by clinical specialists, who are more familiar with blood pressure readings, many pulse oximeter manufacturers have chosen to invert the monitored signal32. This inverted signal is usually handled in clinical and research environments as the PPG signal. With the technological evolution of pulse oximeters, the accuracy of measurements has improved, extending their field of application to environments where measurement conditions are not so favorable. Furthermore, the gradual incorporation of multichannel wavelength technologies has allowed the evaluation of more physiological parameters and, therefore, the formation of an entire clinical picture of the patient that summarizes their physiological state non-invasively and in real-time29.
Most commercial pulse oximeters preprocess the PPG signal before displaying it on the screen, so potential information in the AC and DC components may be lost. However, today, some pulse oximeters postpone preprocessing to later stages and incorporate among their functions the perfusion index (PI), defined as the ratio between the AC and DC components expressed in percentage values. The perfusion index determines the peripheral vasomotor tone. A small PI value suggests a vasoconstriction phenomenon. On the contrary, a large PI value identifies a stage of vasodilation28.
According to the preceding information, various physiological data, such as blood oxygen levels, stress indicators, and vasomotor tone, can be inferred from the PPG waveform’s distinct components5,33. An analysis method enabling the assessment of non-linear dynamics within the PPG signal and its progression offers an additional metric for evaluating various physiological behaviors. Our proposed approach utilizes the structure function to facilitate meaningful results. Future work will explore the relationship between the structure function parameters highlighted in this paper and the physiological data mentioned above.
Material: biological signal database
The term structure function, coined by Obukhov and Yaglom34, was first considered in the works carried out by Kolmogorov in 1941 to study the phenomenon of turbulence35,36. Since then, its application has aroused the interest of multiple scientific disciplines, such as astronomy37, radio interferometry in the lower layers of the atmosphere38, plasma physics39, and even neuronal activity40.
For a scalar non-stationary signal x(t) of length N, with sampling period  , the order q of the structure function is defined as the q-th moment of the absolute increments of x(t), that is,
 |
1 |
where t denotes the running time,  the time in which the increase experienced by the signal is evaluated, and
  the sample average.
According to Eq. 1, the structure function allows evaluation of the statistical properties of the fluctuation patterns (increments) experienced by a signal over time39, regardless of its degree of stationarity, at least as regards the possible systemic and moderate drifts present in the signal24.
If the fluctuation patterns are non-stationary, self-similar, and scale-invariant over a range of values of  , as is the case for the PPG signal, the structure function will follow a power law such as
 |
2 |
where  represents the real-valued exponential function of the structure function. From
  , the generalized Hurst exponent,
  , can be defined as
 |
3 |
A whole hierarchy of exponents is closely related to the complexity of the signal. On the one hand, the Hurst exponent makes it possible to detect long-term correlations indicative of the memory of the underlying process. On the other hand, the Hurst exponent characterizes the stationarity and fractal nature of the data39. So that:
If
 , the fluctuations are governed by an anti-persistent dynamic evolution, namely, a long-term anti-correlation.
On the other hand, if
 , the fluctuations present a persistent dynamic, a long-term correlation.
In the case of
 , the fluctuations’ variability adjusts to the typical behavior of an uncorrelated random signal.
Stationary signals exhibit scale-independent fluctuations, that is,
 , due to translation invariance.
Signals with  constant, or
  linear, are non-stationary and monofractal. In any other case, the signals are non-stationary and multifractal. However, the larger the concavity of
  , the more pronounced the intermittency effect41. If the scaling exponent varies (non-linear curve), it implies that different monofractals operate at different scales. Therefore, a dynamic transition (variation of fluctuations) between monofractals confers greater complexity in the system. The larger the radius of curvature, the more abrupt the dynamic change is, leading to discontinuities in the transitions between dynamics.
Monofractal signals are homogeneous and exhibit linear properties due to a linear relationship between the moments of the statistic being considered. A single index characterizes the signal at all timescales. On the other hand, multifractal signals are heterogeneous, suggesting that different parts of the signal are attributed to different scaling properties. In some ways, multifractal objects form an infinite subset of intricately intertwined or overlapping monofractals with various dimensions. The fractal structure deviates due to the morphological profile of signal fluctuations at different timescales. Therefore, multifractal signals are intrinsically more complex since more indices are required to characterize the scaling properties of the signal. In many cases, the non-linearities of physiological systems with multifractal structures are reflected in the phases of the power spectrum, especially in the correlations present.
Long-term correlations
The differentiable dynamics that describe every dissipative system within a strange attractor form a fractal pattern due to the recurrence of trajectories. The basic principle underlying the phenomenon of recurrence, already proposed by Henri Poincaré in 1890 in the context of planetary motion, is that the typical trajectory of a system in which the dynamics develop in a finite volume, as is the case of an attractor, returns infinitely often to any neighborhood of its initial point. Recurrence is an essential property of many dynamic systems since it is closely linked to the system’s memory to remember similar situations from the past (experience or lessons learned) and thus respond more effectively to the usual vicissitudes of a constantly changing environment or transformation (adaptability)42. A probability distribution characterizes the times between recurrences.
Past extreme events impact future events, extending over long periods of time. These extreme events tend to repeat or persist over time; they are not isolated random events, which denotes the presence of memory or long-term temporal correlations in the system43. Strange attractors and recurrence plots are useful for analyzing the complexity of physiological processes44,45 but primarily focus on deterministic chaos, overlooking stochastic elements. State space reconstruction is needed for strange attractors, and recurrence matrices are sensitive to noise. In contrast, the structure function effectively measures variability across different time scales in both stochastic and chaotic systems, demonstrating robustness to noise through its reliance on statistical moments of velocity.
Long-term correlations carry long-term memory. Long-term memory has physiological implications of great importance in the correct homeostatic dynamics of an organism. The automatisms inherent to the control of the central autonomic system constantly modulate the regular cadence of many physiological activities vital for organic and functional survival18. The system’s dynamics are maintained in an unstable equilibrium, regulated by a control mechanism that stabilizes physiological functions dynamically. The relationship between disturbances and control actions reveals biological signal fluctuations and oscillation patterns. The cardiorespiratory system’s physiological oscillations reflect complex interactions within control loops.46. The dynamics of this system can be described as a balance between a stable activity pattern and random behaviors that disrupt the equilibrium typically observed under normal physiological conditions47. Thus, the system would operate in a critical state, with its dynamics influenced by principles of self-organization, a simple and highly adaptive mechanism for collective response.48.
In simpler terms, complex systems organize themselves through local interactions. These non-linear interactions among the individual reactions of various subsystems lead the system to a critical state. Long-term spatiotemporal correlations, unmistakable indicators of fractal physiology, mark this state. In these situations, local interaction rules shape dynamics at various scales, making it impossible to establish a characteristic scale.49. From a theoretical point of view, a critical state involves an optimal state to adapt to new situations quickly. Fractal physiology, which is characterized by long-term correlations, supports the notion of system adaptability. It acts as a regulatory mechanism for complex processes and is a major inhibitor of periodic behaviors; this is especially noticeable when specific scales arise due to the breakdown of fractal correlations, which ultimately restricts the system’s ability to respond effectively25.
The hypothesis posits that random fluctuations in a signal can be characterized by a time-invariant mechanism using key parameters, such as scaling exponents that follow a power law. These are statistically evaluated based on population distributions, highlighting the high variability across timescales as a hallmark of multifractals, illustrated by a patchy pattern of intermittency50. The generalized Hurst exponent,  , acts as the self-similar scaling exponent, remaining constant for monofractals while exhibiting a non-linear relationship for multifractals due to phase interactions among frequency components51. Calculating
  allows for quick identification of persistence, data nature (stationary or non-stationary), and whether the data is monofractal or multifractal. Stationary processes have
  , while processes with constant
  are non-stationary and monofractal; otherwise, they are non-stationary and multifractal52.
Domain
The structure function supports two domains, temporal and spatial. Since we are analyzing changes in a measurement over time, the domain is temporal. This paper focuses on the temporal structure function study of a biological signal.
Theory/calculation
The first step is to check the signal’s fractal nature and calculate the generalized Hurst exponent in the regions where it is non-zero (up to the breaking point, see Figure 5). The usual method involves plotting  versus
  on a log-log plot and determining the generalized Hurst exponent,
  , from the slope within
  values where the structure function fits a straight line.
The singular instance  refers to the Hurst exponent
  21. If the signal x(t) closely resembles a monofractal or is only weakly multifractal, then any
  , where q is not equal to 2, can be utilized to estimate
  . Another more plausible alternative in the study of processes with memory involves the estimation of the Hurst exponent. For this, different methods have usually been used: Rescaled range or R/S Analysis53, Aggregated Variance Method54, Differenced Variance Method55, Detrended Fluctuation Analysis56, Periodogram Regression57, Delayed (log-) returns58, scaled windowed variance59, dispersion analysis60, among others.
The structure function for different orders evaluates the scaling exponent function’s non-linearity to verify the multifractal nature of the dynamics underlying the fluctuations of a signal. With the order of the structure function, the incidence of lower-order polynomials on the dynamics is removed. As the order of the structure function increases, the fluctuations in dynamic complexity within the signal become increasingly well-defined.
This section introduces a theory that will be applied in the upcoming section. Three specific markers are extracted from the  temporal structure function, and their analysis is discussed in a PPG signal database framework. An interesting aspect is to identify if these specific markers define a range of values within which normal physiological functioning is considered appropriate for an individual. Examining these markers in scenarios such as illness or mild stress will be the focus of a separate publication.
Fractal nature
The analysis will start by examining whether the PPG signal of a subject in a basal state shows monofractal and multifractal behavior. The behavior study will calculate different moments of the structure function, i.e., the structure function for different q values, to determine if the generalized Hurst exponent is constant. Further, it will determine if the real-valued exponential function is linear with q. The result of this calculation is shown in Figure 3. The PPG signal is non-stationary, and its fractal nature is monofractal.
Fig. 3.
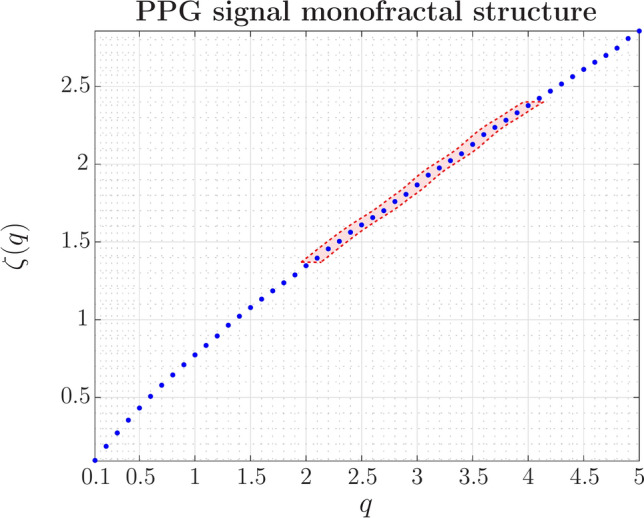
In relaxation conditions (basal level),  is nearly linear for moments greater than 1, a signature of a monofractal process. The exponent,
  , is calculated for a range of q values identifying the moment of the statistic, which, in this case, refers to the temporal structure function. Each data point derives from Eq. 3, where the value of
  represents the average scaling exponent of
  in Eq. 1, across the 40 subjects. A slight oscillatory modulation is seen for
  (highlighted in light red). With a more in-depth investigation, periodic modulation could unveil a phase transition in anomalous diffusion processes.
Reference temporal structure function
To analyze the second-order structure function,  , is the most commonly used and well-known, we first calculate it for other dissimilar data series and then qualitatively compare the graphs with those obtained for the case of the PPG signals of two individuals. The findings depicted in Figure 4 indicate that all signals exhibit a second-order structure function with a consistent pattern. Initially, there is a steep or abbreviated slope, followed by a plateau once a specific correlation time has elapsed. During this plateau phase, the evolution of fluctuations is governed by a distinct dynamic that persists over extended periods. In Figure 4(a), the preprocessed data shows the temperature anomalies recorded daily between 1982 and 2021 in a degree resolution grid. The averages were calculated from the area near the coast of Peru. Due to the relatively subtle day-to-day variations, we calculated the median temperature anomaly over ten consecutive days. Therefore, each point in the temporal succession represents the median anomaly over ten days. This time series is employed to calculate the second-order structure function. Figure 4(a) was represented using 1461 points.
Fig. 4.

Examples of temporal structure function,  (Eq. 1) versus
  with
with  on a log-log plot, from different types of signals: (a) The purple box represents Region 12 of El Nino, as indicated by the Copernicus program (Copernicus Earth Observation Programme), precisely the values of the SST (Sea Surface Temperature) variable included in OSTIA (Operational Sea Surface Temperature and Ice Analysis) global sea surface temperature product61; the sea surface temperature data used are from a variant of El Nino Region 12 limited to an area near the coast of Peru, highlighted in emerald. (b) and (c) are from the MUSAN music, speech, and noise corpus62; (b) is a tone whose frequency increases, and (c) noise-free-sound 0005. (d) PPG signals from two subjects in basal state, in a 0.5–15 Hz frequency range26. The three signals presenting complexity (a), (c), and (d) initially slope upward (correlated signal) before reaching a plateau on large timescales (apparently uncorrelated). The dynamic fluctuation on this plateau is consistent with stochastic behavior as it is (b) signal.
Figure 4(b) and (c) depict two distinct acoustic signals, each comprising 30,000 data points. The first signal, see Figure 4(b), exhibits a precise, fluctuating tone frequency, resulting in a short correlation time subject to frequency variations without manifesting any long-term time correlation. In contrast, as seen in Figure 4(c), the second signal is noiseless and clearly shows a long-term time correlation.
Figure 4(d) illustrates the structure function of the PPG signal of two subjects from the database under analysis. Despite each individual’s physiological uniqueness, their PPG signals show a characteristic pattern. The section Biomarkers of the structure function in the PPG signal database presents the average values of the markers specified below after the computation of the second-order structure function for all individuals within the database. Each individual contributed a total of 25,000 data points for analysis.
Biomarker definition
Based on the previous findings, the structure function of non-linear systems showcases two discernible regions.
In the first region, a time window or timescale with a non-zero slope is distinguished up to an inflection point
 . So, the corresponding markers to study in the signal group are the scaling exponent (scaling area) and breaking point
 , as shown in Figure 5. This region identifies the time range in which a deterministic complex geometric configuration occurs, with some type of time correlation present. The inflection point, where the slope undergoes a change in curvature, defines a dynamic transition. The
  value at this point identifies the characteristic correlation time of the physiological system under study. The inflection point then entails a change in deterministic dynamic control (temporal correlation) from small timescales (local control) to large timescales where global dynamic variability prevails (global control). We believe that the varying levels of
  are connected to the activation of the sympathetic system. In subsequent research endeavours, we will provide additional clarification of this concept through confirmation and validation.
Random behavior prevails in a second region beyond the inflection point that separates the two areas. In this region, the structure function takes on a flat geometric arrangement (plateau area), indicating low variability in stochastic dynamics. The plateau height, shown in Figure 5, is the third marker to characterize a similar signal group. However, the seemingly erratic volatility contains an interesting dynamic in which an amplitude modulation that obeys a power law characteristic of flicker noise is clearly evident (see Figure 6 and inner inset). It would be particularly interesting to explore the functional implications of this behavior for the control mechanism of the cardiorespiratory system. Flicker noise is characterized by a 1/f frequency pattern, where low frequencies dominate power spectral density. In the time domain, flicker noise exhibits a characteristic pattern with successive increases in frequency over time. The presence of amplitude modulation (the envelope of the fluctuations) interrupts the monotonicity of canonical flicker noise and confers a more erratic character to the variability of the fluctuations. From a physiological point of view, a hypothesis to be studied would be to determine whether the modulation of the variability of the data on a large timescale responds to the mechanism used by the autonomic nervous system to balance the sympathetic and parasympathetic activation that regulates the cardiorespiratory system.
Fig. 5.

A characteristic outline of the temporal structure function observed in PPG signals. At large timescales, an upward initial slope up to the breaking point  is followed by a flat region. The inflection point, memory limit
  , to the point at which the structure function experiences a change in its concavity for the first time. The scaling exponent is determined by the slope of the straight line connecting the structure function’s initial point and inflection point. The plateau height relates to the average variation in the structure function, from the inflection point to the end of the dataset used for estimation. The dynamic fluctuation in this plateau is consistent with stochastic behavior.
Fig. 6.
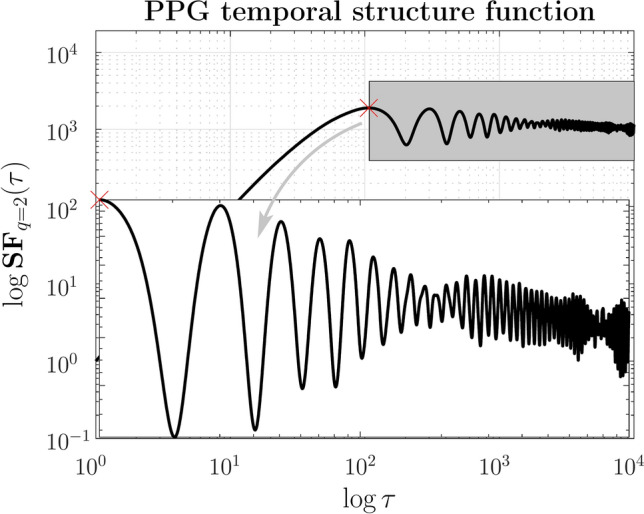
Zoom from Figure 5. At large timescales, the temporal structure function of PPG signals displays a slope of roughly zero. However, the seemingly erratic fluctuation hides a dynamical response function with a characteristic power-law 1/f-like behavior, as illustrated in the inset.
To our knowledge, no prior study has defined these markers as related to the PPG signal. When applied to a biological signal, we refer to them as biomarkers. A study has used the inflection point and the plateau height in the field of neuronal activity22. An article related to fluid dynamics, particularly turbulent flows, discusses the scaling exponent. In this context, the scaling exponent is estimated at different orders to assess the multifractal nature of the temperature gradient that arises in turbulence63.
PPG signal study case
The dynamic activity within the peripheral volumetric flow, as captured by a pulse oximeter, is not readily discernible in the PPG signal waveform64. Peripheral volumetric flow dynamics activity refers to blood circulation at the microvascular level, including microcirculation in the extremities, such as the finger where the pulse oximeter is placed. As a result, the inherent complexity of the PPG signal could be more conspicuous. Although specific morphological characteristics of the PPG signal reveal the cardiorespiratory system’s physiological state65, a complete characterization of the underlying processes that govern the volumetric dynamics and how they couple to regulate peripheral blood flow according to physiological needs still needs to be completed66.
The ostensible quasi-deterministic behavior of the cardiorespiratory rhythm disguises a dynamic network that modulates its cadence while operating at different timescales67. Its nature still needs to be determined if the dynamic framework is conceptualized as a complex regulatory process. It could be stochastic, deterministic, or combined. In any case, the process singularities can have relevant physiological implications regarding homeostatic suitability68. The physiological adaptive capacity of an individual is a true reflection of their health status. Changes in this capacity could be associated with age or temporary disorder, such as a stressful situation or more severe abnormalities25.
For the analysis of the PPG signal, the temporal structure function is chosen for reasons put forward in successive lines. Somehow, the structure function involves generalizing the q-order autocorrelation function with a faster convergence rate and more robust to low-frequency noise. The latter is especially remarkable in biological signals since their most salient dynamic richness usually becomes apparent in the low-frequency range.
The scaling properties of the structure function come out with the monofractal or multifractal character of the signal’s time evolution or its random or stochastic nature. In the latter case, the structure function slope is approximately zero at all timescales. Figure 7 shows how simple randomization of the PPG signal breaks the possible time correlations, which is reflected in a practically flat structure function over all timescales. Monofractal signals have a strong homogeneous character, presenting similar scaling properties throughout the entire signal. So, it has a single singularity exponent that characterizes the whole signal’s dynamic variability. Multifractal signals are inherently more complex than monofractal signals. A simple visual inspection of the PPG signals shows (see Figure 2) not only a non-linear dynamic evolution. Subtle but complex fluctuations are noticeable, and signal traces (patchiness) with different scaling properties urge a more exhaustive analysis of higher-order correlations.
Fig. 7.

PPG signal sample with a temporal structure function showing a non-zero slope at small timescales. Fluctuation variability has a non-linear behavior. At large timescales, the random behavior (with a temporal structure function showing an average zero-slope) is superimposed on an oscillatory behavior that resembles an amplitude and frequency modulation. Differentiating observations, see Eq. 1, at a specific time interval  helps reduce low-frequency noise, while averaging cancels high-frequency noise. The initial region of the temporal structure function with a non-zero slope disappears in the scrambled data, in which case the whole function shows a zero slope (random behavior).
Deterministic and stochastic processes operate together but on different timescales. Both dynamics could coexist simultaneously but at different timescales. The psychosomatic and pathophysiological conditions of the cardiorespiratory system determine the degree of coupling between its dynamics and their prevalence, enabling a homeostatic self-regulation mechanism to function as efficiently as possible. In this sense, the contribution of a certain level of randomness on a large timescale guarantees the system’s stability.
With fewer data than the correlation function, the structure function accurately captures (unbiased statistic) both the high-frequency information and the low-frequency variability (the envelope of the structure function). Computationally, with fewer terms of the summation, the information contained in the signal variability or fluctuation is extracted when input signal quality—for an estimate of the quality indices of the PPG signal, the reader is referred to69 and references therein—is acceptable.
In some cases, it is almost imperative to filter biological signals to remove noise or undesirable artifacts at low and high frequencies5. In any case, it must assume the irreversible partial loss of information. In this sense, an interesting point of the structure function is that it does not lose information, retaining the spectral details of the variability even though the signal has been filtered using a bandpass filter, as seen in Figure 8. Of course, the relatively low frequencies in the structure function are subject to the time horizon of analysis established by the value of  .
.
Fig. 8.

The temporal structure function of a raw PPG signal (solid blue line) and the same PPG signal but filtered using a bandpass filter array with different lower cutoff frequencies (see legends on the right side of the Figure). At small timescales, the initial slope is almost identical for all signals, but not the breaking point (memory limit), which only is held until the non-linear coupling between respiration and heart rate (lower cutoff frequencies  1 Hz) is broken and only the proper correlation of heart rate harmonics is preserved. In this work, we use the filtered PPG signal within the range of 0.5 to 15 Hz (solid red line) because, as you can see, the envelope qualitatively captures the low-frequency variations.
Assuming that the criteria of self-organization govern the regulatory mechanisms of the cardiorespiratory activity modulation system, it is essential to recognize the presence of avalanche transport. Avalanche transport refers to the process by which small disturbances can trigger a chain reaction, resulting in bursts or cascades that spread over multiple time scales. This phenomenon creates patterns of variability that allow a system to dynamically and effectively readjust its responses. It leads to long-term correlations due to a simple yet highly adaptive mechanism of collective response, which includes non-linear interactions among the individual reactions of various subsystems48,49. Physiological and functional plasticity requires an integrated response that operates across multiple timescales70. Fractal physiology, characterized by long-term correlations, supports the idea that systems can adapt. It is a regulatory mechanism for highly complex processes, generating fluctuations and exhibiting multifractal multiplicative cascades and various non-linear interactions. This occurs over a wide range of timescales. However, fractal physiology can also inhibit strongly periodic behaviors. The dominance of a specific scale, resulting from the breakdown of fractal correlations, limits the system’s capacity to respond effectively25.
The autocorrelation function’s algebraic decay for long time intervals71 shows the long-term correlation. However, its detection in the context of the PPG signal is sometimes not feasible since it requires enormous amounts of high-precision data, which, unfortunately, are not always available.
Implementing the structure function provides a more efficient way to analyze the PPG signal with reduced data requirements. This concept will be explored further in the next section and subsequent research efforts.
Biomarkers of the structure function in the PPG signal database
After analyzing the intrinsic complexity of the PPG signal and the different working hypotheses that the structure function could explore, in this first work, we estimate three structure function markers for the case of the PPG signal acquired in the basal state of 40 healthy individuals aged between 19 and 30 years. The three markers, which we call biomarkers because they are obtained from the structure function of a biological signal, in our case, the PPG signal, are the scaling exponent (SE), the inflection point (IP) and the plateau height (PH).
Figure 1 illustrates a 10-minute segment of the PPG signal collected from a single participant. A filter with a frequency range of 0.5 to 15 Hz has been applied to the signals obtained from the data acquisition equipment. It has been determined that only 20 seconds of data is necessary to calculate the structure function for an individual, thereby enabling the extraction of biomarkers within this brief time frame. We have presented values derived from structure functions computed with larger datasets to ascertain that these biomarkers remain consistent with extended data acquisition durations. The applied scale is 20 seconds, which indicates that, given the acquisition equipment samples at a rate of 250 Hz, an additional 5,000 data points are incorporated into the structure function calculation at each ordinate point depicted in the subsequent figures. Each point on the graphs corresponds to the mean values obtained for each of the 40 participants. Furthermore, the graphs denote the standard error of the mean (SEM), demonstrating the robustness of the parameters, as minimal variation is observed among healthy individuals aged 19 to 30.
Figure 9 illustrates that the basal level PPG signals maintain a nearly constant scaling exponent (SE) of 0.67 throughout the entire observation period of 10 minutes. Up to the inflection point, this SE helps us characterize fluctuations’ non-linear organization and correlation structure at small timescales. Under relaxation conditions, the PPG signals demonstrate a linear  function, as depicted in Figure 3. In other words, a monofractal process-a key feature of complex behavior-underlies the fluctuations of PPG signals in these relaxation conditions.
Fig. 9.

In the study involving 40 healthy young individuals under relaxed conditions, the mean value of the scaling exponent (SE) exhibited minimal variation. The standard error of the mean (SEM) remained consistently low and stable throughout the 10-minute analysis period, showing no fluctuations. The graph shows the baseline level for random behavior ( ).
).
The inflection point (IP) delineates the time horizon of the system’s memory. Before the inflection point, the variability within the system becomes increasingly regular and, consequently, more predictable, facilitating a longer prediction time horizon. In contrast, the system exhibits random behavior beyond the IP, characterized by a flat region in the structure function at extended timescales. As shown in Figure 10, the IP of PPG signals under relaxation conditions demonstrates remarkable stability throughout the entire observation period, consistently maintaining a value of 108. This observation reflects a prevailing state of homeostatic equilibrium.
Fig. 10.
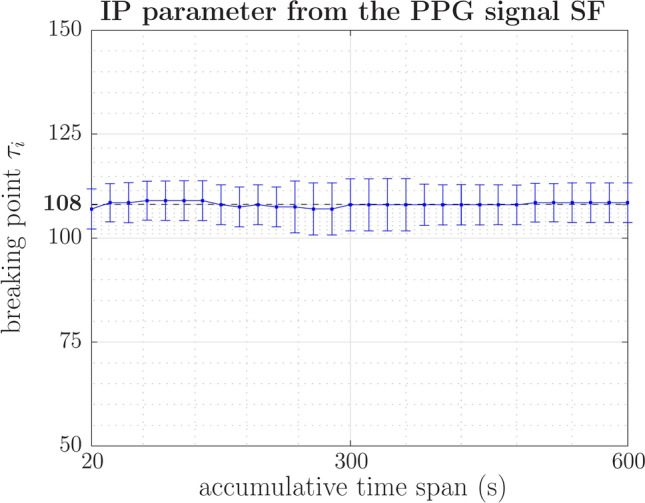
In the study involving 40 healthy young individuals under relaxed conditions (basal level), the mean value of the inflection point (IP) and, therefore, the prediction horizon remained nearly constant. The standard error of the mean (SEM) remained consistently low throughout the 10-minute analysis period.
The plateau height (PH) of the structure function is associated with the energy level at which variability in small timescale signals occurs, in conjunction with potential noise present in the signal, modified by low-frequency variations. Figure 11 illustrates the fluctuations in the plateau height of photoplethysmography (PPG) signals under relaxation conditions, demonstrating varying intensities. This observation suggests that the interplay between sympathetic and parasympathetic nervous system responses significantly influences energy variability.
Fig. 11.
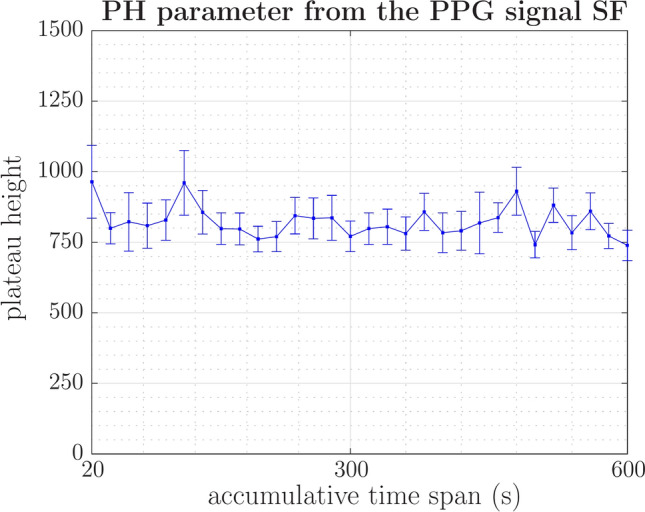
In the study involving 40 healthy young individuals under relaxed conditions, the mean value of the plateau height (PH) and the standard error of the mean (SEM) varied but remained within a consistent range during the 10-minute analysis period. The characteristic outline of temporal structure function on this plateau is consistent with stochastic behavior.
Preliminary studies with the same 40 individuals subjected to acute stress events support the viability of these biomarkers. A future article will report the results and the physiological interpretation supporting the discriminative power of the extracted structure-function markers. Consequently, it is reasonable to suggest that these indicators may serve as valuable diagnostic biomarkers for the timely detection of stress episodes and cardiorespiratory conditions.
Finally, on a preliminary trial basis, we expand analyses to a more diverse group of healthy individuals regarding age, not just young people between 19 and 30.
A comprehensive review of publicly available databases was conducted among relevant published literature on PPG signals. A database covering the age range from 20 to 89 was selected72. Six healthy individuals were chosen at random based on gender and age group. Subsequently, the three previously discussed markers of structure function were calculated using their PPG signals. The results obtained are shown in Table 1. These results are not statistically valid, but they stimulate us to look into whether, for example, it is true that a higher plateau height than men characterizes women, with all the physiological implications that derive from it. In summary, it seems that various markers of the structure function of the PPG signal can offer valuable physiological insights into individuals’ age and gender.
Table 1.
Values of the three markers of the structure function seen above classified by gender and age range. PPG signals are from publicly available databases72.
| Markers | Men | Women | ||||
|---|---|---|---|---|---|---|
| Young | Adult | Senior | Young | Adult | Senior | |
| Scaling Exponent (SE) | 0.56 | 0.56 | 0.54 | 0.55 | 0.58 | 0.55 |
| Inflection Point (IP) | 161 | 150 | 165 | 176 | 167 | 163 |
| Plateau Height (PH) | 303.36 | 267.04 | 291.34 | 300.5 | 570.73 | 348.88 |
Conclusion
The structure function enables us to analyze the dynamic behavior of the signal’s variability of fluctuations at different timescales. The morphology of the structure function allows us to determine not only the dynamic complexity of a signal under a fractal perspective but also its stationarity spectrum. In a relaxed state, PPG signals acquired from young and healthy individuals show monofractal behavior. Although slight oscillations indicate additional information, a more detailed analysis is necessary to understand these nuances fully.
When plotted graphically, the second-order structure function estimates the filtering ranges of a measured signal, making it easy to remove noise without loss of information. Within the context of PPG signal analysis, it proves that the 0.5–15 Hz filter effectively holds low-frequency information, assuming no temperature variations.
The second-order structure function includes three key parameters that serve as biomarkers: the scaling exponent (SE), the inflection point (IP), and the plateau height (PH). These parameters exhibit notable temporal consistency in basal-level photoplethysmography (PPG) signals, except the plateau height, demonstrating a significant oscillating behavior. The plateau height is associated with stochastic variability, indicating the need for more comprehensive analysis to derive physiological insights related to the homeostatic mechanisms that govern the cardiorespiratory system. By correlating these parameters with specific physiological states or diseases, we can create a simple computational tool that requires minimal computational time to diagnose and prevent various health conditions.
Acknowledgements
The authors thank the Life Supporting Technologies Group (LST-UPM) for participating in project FIS-PI12/00514, from MINECO. Furthermore, the authors gratefully acknowledge the Universidad Politécnica de Madrid (www.upm.es) for providing computing resources on the Magerit Supercomputer.
Author contributions
Conceptualization, J.d.P.-C. and A.P.G.-M.; methodology, J.d.P.-C., D.F.-J. and A.P.G.-M.; software, J.d.P.-C. and D.F.-J.; validation, J.d.P.-C., A.P.G.-M. and D.F.-J.; formal analysis, J.d.P.-C. and A.P.G.-M.; data curation, J.d.P.-C. and A.P.G.-M.; investing, J.d.P.-C., A.P.G.-M. and M.F.C.-U.; resources, J.d.P.-C., A.P.G.-M. and M.F.C.-U.; writing, original draft preparation, J.d.P.-C. and A.P.G.-M.; writing, review and editing, J.d.P.-C., D.F.-J. and A.P.G.-M.; visualization, J.d.P.-C. and A.P.G.-M.; supervision, M.F.C.-U. and A.P.G.-M.; project administration, M.F.C.-U. and A.P.G.-M.; funding acquisition, M.F.C.-U. and A.P.G.-M. All authors have read and agreed to the published version of the manuscript.
Data availability
Access to the real-world PPG signals (biological dataset) is restricted by a third-party agreement with Life Supporting Technologies (LifeSTech). Please contact the corresponding author for further information.
Declarations
Competing interests
The authors declare no competing interests.
Ethics approval and consent to participate
The data used in this study come from the FIS-PI12/00514 project at the Universidad Politécnica de Madrid (UPM). It was conducted according to the guidelines of the Declaration of Helsinki and approved by the Institutional Review Board (or Ethics Committee) of the UPM (protocol code 2014-16-06 and date of approval 16 July 2014). The study includes 40 students from the UPM between 18 and 30 years old. All signals are captured from the middle finger of the left hand and sampled at a frequency of 250 Hz, say, sampling time  ms. The UPM Ethics Committee approved the study protocol. Participants gave their written informed consent. They were instructed to avoid using any psychotropic substance, alcohol or tobacco, avoid physical exercise 24 hours before each session, get up two hours before starting the sessions and consume a light breakfast without coffee or tea.
Footnotes
Publisher’s note
Springer Nature remains neutral with regard to jurisdictional claims in published maps and institutional affiliations.
References
- 1.Webster, J. G. (ed.) Design of pulse oximeters. Medical science series (Inst. of Physics Publ., 1997), 1st edn.
- 2.Allen, J. Photoplethysmography and its application in clinical physiological measurement. Physiol. Meas.28, R1–R39. 10.1088/0967-3334/28/3/r01 (2007). [DOI] [PubMed] [Google Scholar]
- 3.Noah, B. et al. Impact of remote patient monitoring on clinical outcomes: an updated meta-analysis of randomized controlled trials. NPJ Digit. Med.1, 20172. 10.1038/s41746-017-0002-4 (2018). [DOI] [PMC free article] [PubMed] [Google Scholar]
- 4.Moraes, J. et al. Advances in photopletysmography signal analysis for biomedical applications. Sensors.18, 1894. 10.3390/s18061894 (2018). [DOI] [PMC free article] [PubMed] [Google Scholar]
- 5.Park, J., Seok, H. S., Kim, S.-S. & Shin, H. Photoplethysmogram analysis and applications: An integrative review. Front. Physiol.12, 10.3389/fphys.2021.808451 (2022). [DOI] [PMC free article] [PubMed]
- 6.Pal, P. & Mahadevappa, M. Meta-learning based cardiopathy detection from ppg signals using gan and 1d cnn. Circuits, Systems, and Signal Processing10.1007/s00034-024-02941-6 (2024).
- 7.Sviridova, N. Study on chaotic behavior of human photoplethysmogram by comprehensive nonlinear time series analysis. Ph.D. thesis, Tokyo University of Agriculture and Technology (2015).
- 8.Elgendi, M., Liang, Y. & Ward, R. Toward generating more diagnostic features from photoplethysmogram waveforms. Diseases.6, 20. 10.3390/diseases6010020 (2018). [DOI] [PMC free article] [PubMed] [Google Scholar]
- 9.Martin-Martinez, D., de-la Higuera, P. C., Martin-Fernandez, M. & Alberola-Lopez, C. Stochastic modeling of the PPG signal: A synthesis-by-analysis approach with applications. IEEE Trans. Biomed. Eng.60, 2432–2441. 10.1109/tbme.2013.2257770 (2013). [DOI] [PubMed] [Google Scholar]
- 10.Wang, L., Xu, L., Feng, S., Meng, M.Q.-H. & Wang, K. Multi-gaussian fitting for pulse waveform using weighted least squares and multi-criteria decision making method. Comput. Biol. Med.43, 1661–1672. 10.1016/j.compbiomed.2013.08.004 (2013). [DOI] [PubMed] [Google Scholar]
- 11.Sološenko, A., Petrėnas, A., Marozas, V. & Sörnmo, L. Modeling of the photoplethysmogram during atrial fibrillation. Comput. Biol. Med.81, 130–138. 10.1016/j.compbiomed.2016.12.016 (2017). [DOI] [PubMed] [Google Scholar]
- 12.Tang, Q. et al. PPGSynth: An innovative toolbox for synthesizing regular and irregular photoplethysmography waveforms. Front. Med.7, 10.3389/fmed.2020.597774 (2020). [DOI] [PMC free article] [PubMed]
- 13.Tang, Q., Chen, Z., Ward, R. & Elgendi, M. Synthetic photoplethysmogram generation using two gaussian functions. Sci. Rep.10, 10.1038/s41598-020-69076-x (2020). [DOI] [PMC free article] [PubMed]
- 14.Kantz, H. & Schreiber, T. Nonlinear Time Series Analysis. Cambridge nonlinear science series (Cambridge University Press, 2004), 2 edn.
- 15.Peng, C.-K., Yang, A. C.-C. & Goldberger, A. L. Statistical physics approach to categorize biologic signals: From heart rate dynamics to dna sequences. Chaos: An Interdisciplinary Journal of Nonlinear Science17, 10.1063/1.2716147 (2007). [DOI] [PubMed]
- 16.Stefanovska, A. Physics of the human cardiovascular system. Contemp. Phys.40, 31–55. 10.1080/001075199181693 (1999). [Google Scholar]
- 17.Shelley, K. H. Photoplethysmography: Beyond the calculation of arterial oxygen saturation and heart rate. Anesth. Analg.105, S31–S36. 10.1213/01.ane.0000269512.82836.c9 (2007). [DOI] [PubMed] [Google Scholar]
- 18.Wessel, N., Riedl, M. & Kurths, J. Is the normal heart rate “chaotic’’ due to respiration?. Chaos: An Interdisciplinary Journal of Nonlinear Science19, 028508. 10.1063/1.3133128 (2009). [DOI] [PubMed] [Google Scholar]
- 19.Glass, L. Multistable spatiotemporal patterns of cardiac activity. Proc. Natl. Acad. Sci.102, 10409–10410. 10.1073/pnas.0504511102 (2005). [DOI] [PMC free article] [PubMed] [Google Scholar]
- 20.Glass, L. Introduction to controversial topics in nonlinear science: Is the normal heart rate chaotic?. Chaos: An Interdisciplinary Journal of Nonlinear Science19, 028501. 10.1063/1.3156832 (2009). [DOI] [PubMed] [Google Scholar]
- 21.Hurst, H. E. Long-term storage capacity of reservoirs. Trans. Am. Soc. Civil Eng.116, 770–799. 10.1061/taceat.0006518 (1951). [Google Scholar]
- 22.Nanni, F. & Andres, D. S. Structure function revisited: A simple tool for complex analysis of neuronal activity. Front. Hum. Neurosci.11, Paper No. 409, 10, 10.3389/fnhum.2017.00409 (2017). [DOI] [PMC free article] [PubMed]
- 23.Andres, D. On the motion of spikes: Turbulent-like neuronal activity in the human basal ganglia. Front. Hum. Neurosci.12, Paper No. 429, 7, 10.3389/fnhum.2018.00429 (2018). [DOI] [PMC free article] [PubMed]
- 24.Schulz-DuBois, E. O. & Rehberg, I. Structure function in lieu of correlation function. Applied Physics A24, 323–329. 10.1007/bf00899730 (1981). [Google Scholar]
- 25.Goldberger, A. L. et al. Fractal dynamics in physiology: Alterations with disease and aging. Proc. Natl. Acad. Sci.99, 2466–2472. 10.1073/pnas.012579499 (2002). [DOI] [PMC free article] [PubMed] [Google Scholar]
- 26.Aguiló, J. et al. Project es3: attempting to quantify and measure the level of stress. Revista de Neurología61, 405–415 (2015). [PubMed] [Google Scholar]
- 27.Arza, A. et al. Measuring acute stress response through physiological signals: towards a quantitative assessment of stress. Med. Biol. Eng. Comput.57, 271–287. 10.1007/s11517-018-1879-z (2018). [DOI] [PubMed] [Google Scholar]
- 28.Cannesson, M. & Talke, P. Recent advances in pulse oximetry. F1000 Medicine Reports1, 10.3410/m1-66 (2009). [DOI] [PMC free article] [PubMed]
- 29.Tamura, T. Current progress of photoplethysmography and SPO2 for health monitoring. Biomed. Eng. Lett.9, 21–36. 10.1007/s13534-019-00097-w (2019). [DOI] [PMC free article] [PubMed] [Google Scholar]
- 30.Wang, G., Atef, M. & Lian, Y. Towards a continuous non-invasive cuffless blood pressure monitoring system using ppg: Systems and circuits review. IEEE Circuits and Systems Magazine18, 6–26. 10.1109/mcas.2018.2849261 (2018). [Google Scholar]
- 31.Xing, X. & Sun, M. Optical blood pressure estimation with photoplethysmography and FFT-based neural networks. Biomed. Opt. Express.7, 3007. 10.1364/boe.7.003007 (2016). [DOI] [PMC free article] [PubMed] [Google Scholar]
- 32.Ginosar, Y. et al. Pulse oximeter perfusion index as an early indicator of sympathectomy after epidural anesthesia. Acta Anaesthesiol. Scand.53, 1018–1026. 10.1111/j.1399-6576.2009.01968.x (2009). [DOI] [PubMed] [Google Scholar]
- 33.Rostami, A., Tarvirdizadeh, B., Alipour, K. & Ghamari, M. Real-time stress detection from raw noisy ppg signals using lstm model leveraging tinyml. Arab. J. Sci. Eng.10.1007/s13369-024-09095-2 (2024). [Google Scholar]
- 34.Obukhov, A. M. & Yaglom, A. M. Microstructure of a turbulent flow. Prikl. Mat. Mekh13, 3–26 (1951). [Google Scholar]
- 35.Kolmogorov, A. N. The local structure of turbulence in incompressible viscous fluid for very large reynolds numbers. C. R. Acad. Sci. URSS30, 301–305 (1941). [Google Scholar]
- 36.Kolmogorov, A. N. Dissipation of energy in the locally isotropic turbulence. Dokl. Akad. Nauk SSSR A32, 16–18 (1941). [Google Scholar]
- 37.Simonetti, J. H., Cordes, J. M. & Heeschen, D. S. Flicker of extragalactic radio sources at two frequencies. Astrophys J.296, 46. 10.1086/163418 (1985). [Google Scholar]
- 38.Stotskii, A., Elgered, K. G. & Stotskaya, I. M. Structure analysis of path delay variations in the neutralatmosphere. Astron. Astrophys. Trans.17, 59–68. 10.1080/10556799808235425 (1998). [Google Scholar]
- 39.Yu, C. X., Gilmore, M., Peebles, W. A. & Rhodes, T. L. Structure function analysis of long-range correlations in plasma turbulence. Phys. Plasmas.10, 2772–2779. 10.1063/1.1583711 (2003). [Google Scholar]
- 40.Andres, D. S. et al. Multiple-time-scale framework for understanding the progression of parkinson’s disease. Physical Review E.90, Paper No. 062709, 8, 10.1103/physreve.90.062709 (2014). [DOI] [PubMed]
- 41.Schertzer, D., Lovejoy, S., Schmitt, F., Chigirinskaya, Y. & Marsan, D. Multifractal cascade dynamics and turbulent intermittency. Fractals.05, 427–471. 10.1142/s0218348x97000371 (1997). [Google Scholar]
- 42.Marwan, N., Carmenromano, M., Thiel, M. & Kurths, J. Recurrence plots for the analysis of complex systems. Phys. Rep.438, 237–329. 10.1016/j.physrep.2006.11.001 (2007). [Google Scholar]
- 43.Altmann, E. G. & Kantz, H. Recurrence time analysis, long-term correlations, and extreme events. Physical Review E.71, 056106. 10.1103/physreve.71.056106 (2005). [DOI] [PubMed] [Google Scholar]
- 44.Ivanov, P. C., Goldberger, A. L. & Stanley, H. E. Fractal and Multifractal Approaches in Physiology, 218–257 (Springer, Berlin Heidelberg, 2002). [Google Scholar]
- 45.Sasidharan, D., Sowmya, V. & Gopalakrishnan, E. A. Significance of gender, brain region and eeg band complexity analysis for parkinson’s disease classification using recurrence plots and machine learning algorithms. Phys. Eng. Sci. Med.10.1007/s13246-025-01521-5 (2025). [DOI] [PubMed] [Google Scholar]
- 46.Nakata, A. et al. Assessment of long-range cross-correlations in cardiorespiratory and cardiovascular interactions. Philosophical Transactions of the Royal Society A: Mathematical, Physical and Engineering Sciences379, 10.1098/rsta.2020.0249 (2021). [DOI] [PMC free article] [PubMed]
- 47.Ivanov, P. C., Amaral, L. A. N., Goldberger, A. L. & Stanley, H. E. Stochastic feedback and the regulation of biological rhythms. Europhysics Letters (EPL)43, 363–368. 10.1209/epl/i1998-00366-3 (1998). [DOI] [PubMed] [Google Scholar]
- 48.Isaeva, V. V. Self-organization in biological systems. Biol. Bull.39, 110–118. 10.1134/s1062359012020069 (2012). [Google Scholar]
- 49.Newman, D. E., Carreras, B. A., Diamond, P. H. & Hahm, T. S. The dynamics of marginality and self-organized criticality as a paradigm for turbulent transport. Phys. Plasmas.3, 1858–1866. 10.1063/1.871681 (1996). [Google Scholar]
- 50.Stanley, H. et al. Statistical physics and physiology: Monofractal and multifractal approaches. Physica A: Statistical Mechanics and its Applications.270, 309–324. 10.1016/s0378-4371(99)00230-7 (1999). [DOI] [PubMed] [Google Scholar]
- 51.Ivanov, P. C. et al. Scaling behaviour of heartbeat intervals obtained by wavelet-based time-series analysis. Nature.383, 323–327. 10.1038/383323a0 (1996). [DOI] [PubMed] [Google Scholar]
- 52.Castellanos, M., Morató, M., Aguado, P., del Monte, J. & Tarquis, A. Detrended fluctuation analysis for spatial characterisation of landscapes. Biosyst. Eng.168, 14–25. 10.1016/j.biosystemseng.2017.09.016 (2018). [Google Scholar]
- 53.Mandelbrot, B. B. & Wallis, J. R. Robustness of the rescaled range r/s in the measurement of noncyclic long run statistical dependence. Water Resour. Res.5, 967–988. 10.1029/wr005i005p00967 (1969). [Google Scholar]
- 54.Beran, J. A test of location for data with slowly decaying serial correlations. Biometrika.76, 261–269. 10.1093/biomet/76.2.261 (1989). [Google Scholar]
- 55.Teverovsky, V. & Taqqu, M. Testing for long-range dependence in the presence of shifting means or a slowly declining trend, using a variance-type estimator. J. Time Ser. Anal.18, 279–304. 10.1111/1467-9892.00050 (1997). [Google Scholar]
- 56.Peng, C.-K. et al. Mosaic organization of DNA nucleotides. Physical Review E.49, 1685–1689. 10.1103/physreve.49.1685 (1994). [DOI] [PubMed] [Google Scholar]
- 57.Geweke, J. & Porter-Hudak, S. The estimation and application of long memory time series models. J. Time Ser. Anal.4, 221–238. 10.1111/j.1467-9892.1983.tb00371.x (1983). [Google Scholar]
- 58.Stan, C., Cristescu, C. & Cristescu, C. Computation of hurst exponent of time series using delayed (log-) returns. application to estimating the financial volatility. UPB Scientific Bulletin, Series A: Applied Mathematics and Physics76, 235–244 (2014). [Google Scholar]
- 59.Cannon, M. J., Percival, D. B., Caccia, D. C., Raymond, G. M. & Bassingthwaighte, J. B. Evaluating scaled windowed variance methods for estimating the hurst coefficient of time series. Physica A: Statistical Mechanics and its Applications241, 606–626. 10.1016/s0378-4371(97)00252-5 (1997). [DOI] [PMC free article] [PubMed] [Google Scholar]
- 60.Bassingthwaighte, J. B. & Raymond, G. M. Evaluation of the dispersional analysis method for fractal time series. Ann. Biomed. Eng.23, 491–505. 10.1007/bf02584449 (1995). [DOI] [PMC free article] [PubMed] [Google Scholar]
- 61.Good, S. et al. The current configuration of the OSTIA system for operational production of foundation sea surface temperature and ice concentration analyses. Remote Sensing.12, 720. 10.3390/rs12040720 (2020). [Google Scholar]
- 62.Snyder, D., Chen, G. & Povey, D. MUSAN: A Music, Speech, and Noise Corpus (2015). ArXiv:1510.08484v1, ArXiv:1510.08484.
- 63.Gylfason, A. & Warhaft, Z. On higher order passive scalar structure functions in grid turbulence. Physics of Fluids.16, 4012–4019. 10.1063/1.1790472 (2004). [Google Scholar]
- 64.Charlton, P. H. et al. Wearable photoplethysmography for cardiovascular monitoring. Proceedings of the IEEE.110, 355–381. 10.1109/jproc.2022.3149785 (2022). [DOI] [PMC free article] [PubMed] [Google Scholar]
- 65.Almarshad, M. A., Islam, M. S., Al-Ahmadi, S. & BaHammam, A. S. Diagnostic features and potential applications of ppg signal in healthcare: A systematic review. Healthcare.10, 547. 10.3390/healthcare10030547 (2022). [DOI] [PMC free article] [PubMed] [Google Scholar]
- 66.Wolff, C. B., Green, D. W., Paton, J. F. R. & Collier, D. J. New understanding of circulatory blood flow and arterial blood pressure mechanisms. Cardiovasc. Res.118, e29–e31. 10.1093/cvr/cvab363 (2022). [DOI] [PMC free article] [PubMed] [Google Scholar]
- 67.Bartsch, R. P., Schumann, A. Y., Kantelhardt, J. W., Penzel, T. & Ivanov, P. C. Phase transitions in physiologic coupling. Proc. Natl. Acad. Sci.109, 10181–10186. 10.1073/pnas.1204568109 (2012). [DOI] [PMC free article] [PubMed] [Google Scholar]
- 68.Dudkowska, A. & Makowiec, D. Seidel-herzel model of human baroreflex in cardiorespiratory system with stochastic delays. J. Math. Biol.57, 111–137. 10.1007/s00285-007-0148-9 (2008). [DOI] [PubMed] [Google Scholar]
- 69.Le, V.-K. D. et al. vital_sqi: A python package for physiological signal quality control. Front. Physiol.13, 10.3389/fphys.2022.1020458 (2022). [DOI] [PMC free article] [PubMed]
- 70.Goldberger, A. L. Giles f. filley lecture. complex systems. Proc Am Thorac Soc3, 467–471. 10.1513/pats.200603-028ms (2006). [DOI] [PMC free article] [PubMed] [Google Scholar]
- 71.Carreras, B. A., Newman, D. E., van Milligen, B. P. & Hidalgo, C. Long-range time dependence in the cross-correlation function. Phys. Plasmas.6, 485–494. 10.1063/1.873192 (1999). [Google Scholar]
- 72.Liang, Y., Chen, Z., Liu, G. & Elgendi, M. A new, short-recorded photoplethysmogram dataset for blood pressure monitoring in china. Sci. Data.5, 10.1038/sdata.2018.20 (2018). [DOI] [PMC free article] [PubMed]
Associated Data
This section collects any data citations, data availability statements, or supplementary materials included in this article.
Data Availability Statement
Access to the real-world PPG signals (biological dataset) is restricted by a third-party agreement with Life Supporting Technologies (LifeSTech). Please contact the corresponding author for further information.