

ABSTRACT
Data about pulmonary arterial hypertension (PAH) patients living in low‐ and middle‐income countries remain scarce. This study assessed prognostic factors associated with time to clinical worsening (CW) or death of a cohort of PAH patients in Minas Gerais, Brazil. This retrospective cohort study describes baseline clinical variables by PAH etiology and estimates time from diagnosis to CW [all‐cause death, any‐cause hospitalization, or disease progression (decrease of ≥ 15% in 6MWD and need for additional PAH therapy or worsening of functional class (FC)] and time to death. 79 out of 102 participants developed CW and 38 died while under follow‐up. The most prevalent etiologies were PAH associated with schistosomiasis (PAH‐Sch), idiopathic (IPAH), with congenital heart disease (PAH‐CHD), and with connective tissue disease (PAH‐CTD). The overall median event‐free time to CW was 3.3 (95% CI, 2.3–4.6) years, which was similar across etiologies (log‐rank test: p = 0.12). WHO FC III‐IV, DLCO < 70%, heart rate recovery in 1 min after the 6‐min walk test (HRR1) < 18 beats/minute, and baseline mPAP ≥ 50 mmHg were predictive of CW‐free time. The median time to all‐cause mortality was 10.2 (95% CI, 6.8 – > 10) years and varied among etiologies (log‐rank test: p < 0.001). Time to CW was statistically independent of PAH etiology but depended on baseline WHO FC, DLCO, HRR, and mPAP. After CW events, PAH‐Sch and PAH‐CTD survived less on average than IPAH and PAH‐CHD participants.
Keywords: pulmonary arterial hypertension, risk factors, schistosomiasis, survival
1.
1.1. Introduction
Knowledge about epidemiology, pathophysiology, and therapeutic targets for pulmonary arterial hypertension (PAH) has evolved considerably over the past three decades [1, 2, 3]. PAH prevalence is estimated to be 15–50 persons per million in the USA and Europe [1, 2, 3, 4], but the diagnosis is still delayed [2, 5], the prognosis has improved but remains poor, and the disease leads to high rates of disability and premature death from right heart failure [1, 3].
The first USA registry of primary pulmonary hypertension showed a median survival of 2.8 years [6, 7] and enabled the development of the first predictive equation for PAH based on clinical and hemodynamic variables [6, 7]. The huge advance in the therapy—with the launching of target pulmonary vasodilators—together with publication of national registries has led to the development of morbidity and mortality risk prediction scores that has been supporting the current PAH management [8, 9, 10, 11, 12]. Therefore, a median survival of 7–9 years [2, 3, 4, 12, 13, 14] has been reported in the last decades. For example, in France, 1‐ and 3‐year survival rates of 87% and 67%, respectively, were reported [13, 14]. The large North American REVEAL registry showed 1‐, 3‐, 5‐ and 7‐year survival of 85%, 68%, 57% and 49%, respectively [15, 16, 17].
Little is known about outcomes of PAH patients in Brazil and other low‐to‐middle‐income countries. A study of Brazilian cohort of 178 PAH patients with predominantly idiopathic PAH (IPAH; 28.7%) and PAH associated with schistosomiasis (PAH‐Sch; 19.7%) reported the survival was 92.7% and 73.9% at 1‐ and 3 years, respectively [18]. It should be mentioned that these registries differ from each other by the duration of follow‐up, study design, the inclusion of incident as well as prevalent patients, the etiology of PAH and demographic characteristics, all of which may explain differences other than geographic scenarios [2, 3, 4, 19, 20, 21].
In the current study, we aimed to assess the event‐free time to PAH clinical worsening (CW) or death from the PAH diagnosis of a Brazilian cohort of patients. Secondarily, we sought to determine the potential factors associated with CW‐free survival and the interval from CW event to mortality.
1. Methods
1.1. Study Design and Population
This is a retrospective longitudinal cohort study of newly diagnosed PAH patients recruited from the Pulmonary Vascular Disease Unit of Hospital das Clínicas of the Federal University of Minas Gerais (HC/UFMG), in Belo Horizonte/MG—a city located in a region where Schistosoma mansoni is endemic in Brazil—consecutively admitted between September 2004 to April 2020 and followed up until April 2021 when the study was closed. Patients who were admitted during the study period were invited to participate. The date of diagnosis was at the first right heart catheterization (RHC) at HC/UFMG, that is, patients were enrolled before the beginning of any PAH‐target therapy, and they were managed according to the guidelines available at the time of diagnosis [1, 22]. PAH medications were provided by the Ministry of Health of Brazil. Adjuvant PAH therapies followed the local protocol for all patients, i.e., use of diuretics, supplementary oxygen, and treatment of comorbidities. Typically, participants were followed up every 3–6 months, according to individual classification of risk, and had their medical status recorded in a standardized form used in the clinic. There was no loss to follow up. The study was approved by the UFMG Ethics Committee (ETIC Nr. 1.057.219/2015), and all patients signed an individual informed consent form.
Participants had to have PAH confirmed by RHC, a follow‐up visit at least 1 year after the diagnosis, start of target medication, and had to be aged 18 years or more. Patients were not eligible if they had used PAH‐specific therapy before diagnostic RHC, had other causes of PH, or were pregnant. PAH was defined by RHC metrics as the presence of a mean pulmonary artery pressure (mPAP) ≥ 25 mmHg, pulmonary capillary wedge (PCWP) or left atrial or an end‐diastolic left ventricle of ≤ 15 mmHg, and pulmonary vascular resistance (PVR) ≥ 3 WU, according to the ESC/ERS PAH guidelines [1]. Based on clinical, laboratory and imaging tests [1, 2], eligible patients were classified into PAH etiologic groups.
1.2. Variables and Outcomes Measures
Clinical variables collected upon diagnosis were age, sex, body mass index (BMI), comorbidities, initial PAH‐targeted medications and adjuvant therapies, time elapsed between the beginning of symptoms and PAH diagnosis, World Health Organization functional class (WHO FC), and laboratory tests such as arterial blood gases, N‐terminal cerebral natriuretic peptide (NT‐proBNP), when available, and glomerular filtration rate estimated by the Chronic Kidney Disease Epidemiology Collaboration (CKD‐EPI) formula. Additionally, variables from pulmonary function tests [spirometry, absolute lung volumes and carbon monoxide diffusion (DLCO)], 6‐min walk test (6MWT) variables including distance (6MWD) and heart rate recovery in 1 min after the end of the 6MWT (HRR1), were recorded as well as echocardiographic and hemodynamic parameters at baseline. The COMPERA 3‐level risk score was calculated at admission [11], adapted from the risk assessment instrument from the 2015 ESC/ERS guidelines [1].
During follow‐up, PAH‐specific treatment adjustments and outcomes were recorded. The time from diagnosis to the first CW event was recorded. This composite outcome was defined as an occurrence of death due to any cause; the first any‐cause hospitalization; or disease progression (defined as a decrease of ≥ 15% in 6MWD from baseline AND need to add a new PAH medication OR worsening of WHO FC). According to this definition no participant who died was classified as CW‐free. These data were recorded by the associated health assistants at the PAH Clinic at HC/UFMG in parallel with the follow‐up of the participants during the study period. The vital status of the participants was ascertained by telephone calls (CFR) at the time of closure of data collection.
1.3. Statistical Analysis
Shapiro–Wilk test was used to classify the nature of data distribution. Accordingly, data were reported as frequency and percentage, mean (standard deviation) or median (interquartile range). ANOVA or Kruskal–Wallis and Pearson's chi‐squared test or Fisher's exact test were used as appropriate to compare continuous and categorical variables, respectively. The categories of associated variables were identified by the adjusted residual value > 1.96.
We used the Kaplan–Meier method to estimate the median event‐free time to CW and probability of remaining CW‐free for 5 years after diagnosis, overall and by PAH etiologic group, and we used the log‐rank test to compare event‐free times among the groups. Overall survival times were analyzed analogously. We also used Kaplan–Meier to estimate the median times from CW to death among participants who had follow‐up time after a CW event.
Univariate Cox's proportional hazards analysis was used to identify potential association between time to clinical worsening following PAH diagnosis and clinical and laboratory variables, using cut‐off points as stated by the 2015 ESC/ERS [1] and COMPERA [11] risk stratification or a median value of some of them as it was found in the analyses. Variables that had a p‐value of < 0.20 in the univariate analysis were included in a forward stepwise multivariable Cox's proportional hazards model to identify independent predictors of clinical worsening in the cohort. The software packages SPSS V.23.0 and SAS v9.4 were used for statistical analysis. Values of p < 0.05 were considered significant.
2. Results
2.1. Relative Frequency of PAH Etiologic Groups
One‐hundred and nine (109) PAH patients were admitted during the study period, and 102 eligible participants were diagnosed with PAH using RHC criteria and consecutively enrolled in the cohort. The most prevalent subgroups were PAH associated with schistosomiasis (PAH‐Sch; 29.4%), IPAH (23.5%), and PAH associated with congenital heart disease (PAH‐CHD; 20.6%), connective tissue disease (PAH‐CTD; 15.7%), portal hypertension (PoPH; 6.9%), and HIV infection (PAH‐HIV; 3.9%) (Figure 1). Below, data from PoPH and PAH‐HIV participants are not included in group‐specific analyses due to their small sizes. Among the diagnostic hemodynamic variables, the PAH‐CTD subgroup had lower than average mean sPAP (70 vs. 91 mmHg; p = 0.005 and mPAP levels (45.5 vs. 53 mmHg; p = 0.004; Table 1). Of 16 patients with PAH‐CTD, eight had systemic sclerosis, six had systemic lupus erythematosus and two had mixed‐connective tissue disease.
Figure 1.

Flowchart of the study. IPAH: Idiopathic pulmonary arterial hypertension; PAH‐CHD: Pulmonary arterial hypertension associated with congenital heart disease; PAH‐CTD: Pulmonary arterial hypertension associated with connective tissue disease; PAH‐HIV: Pulmonary arterial hypertension associated with human immunodeficiency virus; PoPH: Pulmonary arterial hypertension associated with portal hypertension; PAH‐Sch: Pulmonary arterial hypertension associated with schistosomiasis.
Table 1.
Hemodynamic data of the cohort at diagnosis.
| Variables at diagnosis | Overall (n = 102) | PAH‐Sch (n = 30) | IPAH (n = 24) | PAH‐CHD (n = 21) | PAH‐CTD (n = 16) |
|---|---|---|---|---|---|
| RHC ‐ sPAP, mmHg, median (IQR) | 86 | 93.5 | 91 | 97 | 70 |
| (70–105) | (72.8–119.8) | (72.8–112.5) | (73–111) | (54.8–81.5)a | |
| mPAP, mmHg, median (IQR) | 51 | 53 | 54 | 58 | 45.5 |
| (42–62.5) | (44–70.3) | (46.3–70.5) | (42.5–80.0) | (31.8–48.0)a | |
| RAP, mmHg, median (IQR) | 8.5 | 7.5 | 10.0 | 9.0 | 10.0 |
| (5–12) | (4.0–10.0) | (5.3–12.0) | (5.0–12.0) | (6.0–11.75) | |
| PCWP, mmHg. median (IQR) | 10 | 10.5 | 9.0 | 10.0 | 8.5 |
| (7.8–12) | (8.0–15.0) | (7.0–13.8) | (7.5–12.0) | (5.8–12.0) | |
| CI, L min−1 m−2, median, (IQR) | 2.4 | 2.34 | 2.21 | 2.60 | 2.04 |
| (1.8–3.1) | (1.69–3.16) | (1.71–2.80) | (2.13–3.29) | (1.55–2.98) | |
| PVR, dynes/sec/cm−5, median (IQR) | 980 | 930 | 1235 | 980 | 1091.5 |
| (630–1394) | (540–1817.5) | (780–1952.5) | (750–1192) | (449.8–1320) | |
| SvO2, %, mean (SD) | 64.9 | 65.6 | 62.4 | 65.2 | 64.4 |
| (7.4) | (6.8) | (8.2) | (5.9) | (8.5) |
Note: Data are presented as mean (SD: standard deviation) or median (IQR: interquartile range).
Abbreviations: CI, cardiac index; mPAP, mean pulmonary arterial pressure; PCWP, pulmonary capillary wedge pressure; PVR, pulmonary vascular resistance; RHC, right heart catheterization; RAP, right atrial pressure; sPAP, systolic pulmonary arterial pressure; SvO2, mixed venous oxygen saturation.
Kruskal–Wallis p < 0.05 for comparison among PAH‐Sch, IPAH, PAH‐CHD and PAH‐CTD.
2.2. Patient Characteristics at the Time PAH Diagnosis
Among clinical, laboratory, functional, and echocardiographic features measured at PAH diagnosis, the overall mean age was 46 ± 12 years (range, 18 to 79 years), most participants were women (68.6%), and most had WHO FC II (41.2%) and III (44.1%). Mean age, WHO FC and risk stratification at admission were similar across etiologic subgroups (Table 2; Figure 2). However, IPAH participants had a shorter duration of symptoms before diagnosis (1.3 vs. 2 years; p = 0.012), shorter 6MWD (358 vs. 446 m; p = 0.012), and 41.6% had a high risk‐score for mortality. PAH‐CTD etiology had an absolute female predominance (100% vs. 75%), was associated with lower %DLCO (58 vs. 70%; p = 0.01), and 56.2% had a high risk‐score for mortality.
Table 2.
Baseline demographics, clinical, functional and laboratory characteristics of the cohort. a
| Variables at diagnosis | Overall (n = 102) | PAH‐Sch (n = 30) | IPAH (n = 24) | PAH‐CHD (n = 21) | PAH‐CTD (n = 16) |
|---|---|---|---|---|---|
| Age, yr ‐ mean(SD) | 46 (12) | 46 (13) | 46 (16) | 42 (18) | 50 (15) |
| Female sex ‐ n (%) | 70 (68.6) | 18 (60) | 18 (75) | 15 (71.4) | 16 (100)a |
| WHO FC ‐ n (%) | |||||
| I | 7 (6.9) | 2 (6.7) | 2 (8.3) | 0 | 1 (6.3) |
| II | 42(41.2) | 13 (43.3) | 8 (33.3) | 8 (38.1) | 7 (43.8) |
| III | 45 (44.1) | 11 (36.7) | 14 (58.8) | 11 (52.4) | 6 (37.5) |
| IV | 8 (7.8) | 4 (13.3) | 0 | 2 (9.5) | 2 (12.4) |
| Time from symptoms to diagnosis, yr – median (IQR) | 2 | 3 | 1.3 | 3 | 2.5 |
| (1–4.3) | (2–6) | (1–3.8)b | (2–6) | (1.5–3.8) | |
| PaO2, mmHg – mean (SD) | 71.8 | 75.5 | 69.3 | 64.7 | 75.3 |
| (12.1) | (12.5) | (11.9) | (9.3)a | (12.9) | |
| PaCO2, mmHg – mean (SD) | 32.5 | 31.4 | 32.3 | 34.5 | 32.6 |
| 4.1) | (4.4) | (4.1) | (4.3) | (3.1) | |
| eGFR by CKD‐EPI – mean (SD) | 91.4 | 92.7 | 84.2 | 95.2 | 93.6 |
| (18.7) | (15.03) | (21.4) | (22.8) | (18.3) | |
| PAH risk stratification at diagnosis ‐ n (%) | |||||
| Low risk | 32 (31.3) | 8 (26.7) | 7 (29.2) | 6 (28.6) | 4 (25) |
| Intermediate risk | 37 (36.3) | 14 (46.6) | 7 (29.2) | 10 (47.6) | 3 (18.8) |
| High risk | 33 (32.4) | 8 (26.7) | 10 (41.6) | 5 (23.8) | 9 (56.2) |
| Prior medications ‐n (%) | |||||
| Oxygen | 10 (9.8) | 2 (6.6) | 4 (16.7) | 2 (9.5) | 2 (12.5) |
| Diuretic | 40 (39.2) | 11 (36.7) | 10 (41.7) | 12 (57.1) | 5 (31.3) |
| Comorbidities ‐n (%) | |||||
| Ischemic heart disease | 6 (5.8) | 1 (3.3) | 2 (8.3) | 1 (4.8) | 2(12.5) |
| Hypertension | 22 (21.6) | 3 (10) | 9 (37.6) | 4 (19.1) | 3 (18.8) |
| Obesity | 21 (20.6) | 4 (13.3) | 8 (33.3) | 4 (19.1) | 4 (25) |
| Atrial fibrillation | 8 (7.8) | 2 (6.7) | 2 (8.3) | 3 (14.3) | 1 (6.3) |
| Diabetes | 8 (7.8) | 1 (3.3) | 2 (8.3) | 2 (9.5) | 1 (6.3) |
| Hypothyroidism | 11 (10.8) | 3 (10) | 5 (20.8) | 2 (9.5) | 1 (6.3) |
| First‐line treatment ‐n(%) | |||||
| Mono + sequential | 99 (97) | 30 (100) | 21 (87.5) | 21 (100) | 15 (93.8) |
| combination therapyc | |||||
| Upfront combination therapy | 1 (1) | 0 | 1 (4.2) | 0 | 1 (6.2) |
| CCB | 2 (2) | 0 | 2 (8.3) | 0 | 0 |
| NT‐proBNP (n = 92), ng L−1 ‐ median, (IQR) | 597 | 600 | 890 | 520 | 955 |
| (280–1566) | (265–1728) | (275–2198) | (285–1210) | (330–1740) | |
| Pulmonary function | |||||
| % FVC (n = 96) ‐ mean (SD) | 81.5 | 88.0 | 83.8 | 75.4 | 71.1 |
| (16.4) | (11.6) | (15.3) | (18.8) | (18.7)a | |
| % FEV1 (n = 96) ‐ mean (SD) | 74.7 | 79.3 | 78,2 | 66.4 | 67.9 |
| (15.0) | (9.4) | (16.1) | (17.0)a | (16.2) | |
| %TLC (n = 47) ‐ mean (SD) | 90.8 | 98.3 | 90.9 | 88.4 | 63.8 |
| (16.4) | (12.8) | (10.2) | (14.6) | (10.7)a | |
| %DLCO (n = 84) ‐ median (IQR) | 70 | 70 | 72 | 78 | 58 |
| (57.7–80) | (62–82) | (59–82) | (60–81) | (52–61)a | |
| 6MWT (m), median (IQR) | 428.9 | 478.1 | 358.4 | 445.5 | 450.2 |
| (316.8–510.7) | (409.6–546.9) | (213–475.2)a | (317.1–474.6) | (310–474.6) | |
| HRR1, beats per minute, median (IQR) | 18 | 18 | 17 | 18 | 14 |
| (10–22) | (11–24) | (10–21) | (13–20.0) | (9–22) | |
| TTE | |||||
| sPAP, mmHg ‐ median (IQR) | 75 | 72.5 | 83.5 | 89.0 | 71.5 |
| (60–94) | (60.0–102.0) | (71.8–96.3) | (64.5–103.0) | (52.5–83.5) | |
| RAP, mmHg ‐ median (IQR) | 10 | 10.0 | 10.0 | 10.0 | 10.0 |
| (10–15) | (10.0–14.3) | (10.0–15.0) | (6.5–15.0) | (10.0–15.0) | |
| TRV, m/s ‐ mean (SD) | 4.04 (0.70) | 4.1 (0.77) | 4.22 (0.57) | 4.22 (0.71) | 3.65 (0.56)a |
| TAPSE (n = 96), mm, median (IQR) | 14 | 14 | 14 | 14 | 14 |
| (12.8–19.0) | (12.3–18.3) | (12–18) | (12.5–16.5) | (12.5–16.5) | |
| Pericardial effusion(%) | 14 (13.9%) | 3 (10%) | 4 (16.6%) | 3 (14.3%) | 4 (25%)a |
Note: Data are presented as mean (SD: standard deviation) or median (IQR: interquartile range).
Abbreviations: 6MWD, 6‐min walk distance; 6MWT, 6‐min walk test; eGFR, estimated glomerular filtration rate; FC, functional class; %FEV1, forced expiratory volume in 1 s; %FVC, % predicted forced vital capacity; %DLCO, % predicted diffusion capacity of carbon monoxide; HRR1, heart rate recovery at 1 min after 6MWT; NT‐proBNP, N‐terminal pro‐brain‐type natriuretic peptide; PaCO2, arterial carbon dioxide pressure; PaO2, arterial oxygen pressure; SvO2, mixed venous oxygen saturation; TAPSE, tricuspid annular plane systolic excursion; %TLC, % predicted total lung capacity; TRV, tricuspid regurgitation velocity; TTE, transthoracic echocardiogram; WHO, World Health Organization.
The four most prevalent subgroups were compared.
As in Reference No. 1.
Followed by combination therapy as indicated.
Kruskal–Wallis p‐value of < 0.05 for the comparison among PAH subgroups.
Figure 2.
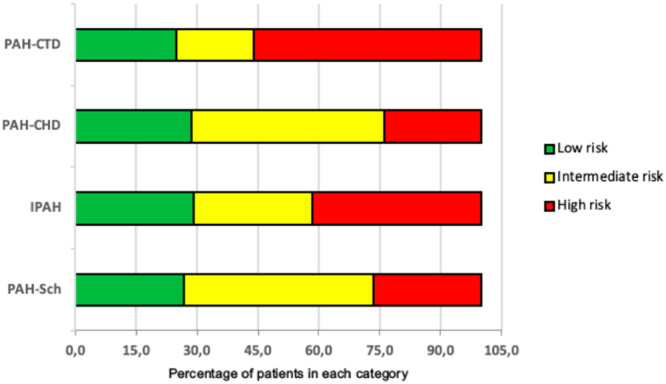
Risk stratification of the four most prevalent PAH etiologic groups upon diagnosis*. *According to the ESC/ERS guidelines1. Numbers are percentages. IPAH: Idiopathic pulmonary arterial hypertension; PAH‐CHD: Pulmonary arterial hypertension associated with congenital heart disease; PAH‐CTD: Pulmonary arterial hypertension associated with connective tissue disease; PAH‐Sch: Pulmonary arterial hypertension associated with schistosomiasis.
2.3. Overall Event‐Free Times
During a median of 5.7 years' on‐study follow‐up, 38 of the 102 study participants died, 41 survived with CW, and 23 survived CW‐free. Disease progression and hospitalization accounted for 98.7% of the 79 clinical worsening events (Table 3). Complications associated with PAH and/or right heart failure were reported as the primary cause of the first hospitalization among 61.9% of 21 patients hospitalized and as the primary cause of death among 68.4% of 38 who died. The second most common cause of death was sepsis (15.8%).
Table 3.
Outcomes related to clinical worsening and death.
| Outcome | Participants with outcome n (% of 102) |
|---|---|
| Primary endpoint: clinical worseninga | |
| All events | 79 (77.5%) |
| All‐cause hospitalization | 21 (20.6%) |
| Hospitalization for worsening of PAH | 13 (61.9%)b |
| Disease progression | 57 (55.9%) |
| Death from any cause | 1 (1%) |
| Secondary endpoint: all‐cause death | |
| Death from any cause | 38 (37.2%) |
| Death due to PAH | 26 (68.4%)‡ |
Abbreviation: PAH, pulmonary arterial hypertension.
Clinical worsening was defined by first event of all‐cause death or hospitalization for any cause or disease progression (defined by decreased ≥ 15% in 6‐min walk distance from baseline AND worsening WHO functional class OR need for additional PAH therapy).
Of 21 hospitalizations; ‡ of 38 deaths.
The median clinical worsening‐free time was 3.3 (95% CI, 2.3–4.6) years, and the event‐free percentages at 1‐, 3‐, 5‐, 7‐ and 10 years after diagnosis were 78.4%, 51.9%, 35.5%, 26.8%, and 10.8%. The median overall survival time was 10.2 (95% CI, 6.8 ‐ > 10) years, and the event‐free percentages were 95.1%, 83.4%, 64.5%, 59.0% and 48.3% at 1‐, 3‐, 5, 7‐ and 10 years, respectively. Among 77 participants with follow‐up time after a CW event, the Kaplan‐Meier estimate of overall median time from CW to death was 3.3 years. There were two participants affected by COVID‐19, one of whom died, but there was no impact on the rate of clinical worsening events in the cohort when compared to the period before the pandemic.
2.4. Risk Factors Associated With the Clinical Worsening‐Free Time
In univariate analyses, 16 variables were associated with the composite primary endpoint, but in the multivariable analysis, only WHO FC III and IV (p = 0.013), DLCO < 70% (p = 0.026), HRR1 < 18 beats per minute (bpm; p = 0.001) and mPAP ≥ 50 mmHg (p = 0.007) were independently associated with clinical worsening‐free time (Table 4). In the univariate model, the ranking of etiologic groups by risk of CW was PAH‐CTD > IPAH > PAH‐Sch > PAH‐CHD, which is illustrated by median time to CW and 5‐year CW‐free estimates shown in Figure 3.
Table 4.
Univariate and multivariate Cox proportional hazards analysis in the pulmonary arterial hypertension cohort for the composite outcome of clinical worsening. a
| Variables | Univariate analysis | Multivariate analysis | ||
|---|---|---|---|---|
| HR (95% CI) | p‐value | HR (95% CI) | p‐value | |
| FC NYHA | ||||
| I and II (n = 49) | 1 (reference) | |||
| III and IV (n = 53) | 1.89 | 0.007 | 1.96 | 0.013 |
| (1.19–2.98) | (1.15‐3.34) | |||
| PAH subgroup | ||||
| IPAH (n = 24) | 1 (reference) | 1 | ||
| PAH‐Sch (n = 30) | 0.76 | 0.378 | ||
| (0.41–1.41) | ||||
| PAH‐CHD (n = 21) | 0.53 | 0.071 | — | — |
| (0.27–1.06) | ||||
| PAH‐CTD (n = 16) | 1.24 | 0.567 | ||
| (0.60–2.53) | ||||
| Heart rate at diagnosis | ||||
| < 96 bpm (n = 82) | 1 (reference) | — | — | |
| ≥ 96 bpm (n = 20) | 1.48 | 0.146 | ||
| (0.87–2.52) | ||||
| PaCO2 | ||||
| < 33 mmHg (n = 49) | 1 (reference) | — | — | |
| ≥ 33 bpm (n = 53) | 0.69 | 0.113 | ||
| (0.44–1.09) | ||||
| eGFR ‐ CKD‐EPI | ||||
| ≥ 60 mL min 1.73 m2 (n = 95) | 1 (reference) | — | — | |
| < 60 mL min 1.73 m2 (n = 5) | 0.37 | 0.053 | ||
| (0.15–0.93) | ||||
| PAH risk stratification | ||||
| Low risk (n = 32) | 1 (reference) | 1 | — | |
| Intermediate risk (n = 37) | 1.65 | 0.091 | ||
| (0.93–2.95) | ||||
| High risk (n = 33) | 2.51 | 0.003 | — | |
| (1.38–4.59) | ||||
| Therapy changes during follow‐up | ||||
| No change (n = 35) | 1 (reference) | 1 | — | — |
| Switch monotherapy (n = 5) | 0.79 | 0.706 | ||
| Combination therapy (n = 62) | (0.23–2.68) | |||
| 1.72 | 0.041 | |||
| (1.02–2.89) | ||||
| NT‐proBNP | ||||
| < 300 ng L−1 (n = 33) | 1 (reference) | 1 | — | — |
| 300 – 1400 ng L−1 (n = 40) | 1.75 | 0.057 | ||
| > 1400 ng L−1 (n = 29) | (0.98–3.09) | |||
| 2.37 | 0.005 | |||
| (1.28‐4.31) | ||||
| DLCO (%) | ||||
| ≥ 70% (n = 48) | 1 (reference) | |||
| < 70% (n = 46) | 1.55 | 0.001 | 1.43 | 0.026 |
| (1.28–1.72) | (1.06–1.66) | |||
| 6MWD | ||||
| > 440 m (n = 50) | 1 (reference) | 1 | ||
| 165–440 m (n = 44) | 1.53 | 0.077 | 1.59 | |
| (0.96–2.45) | (1.31–1.75) | |||
| < 165 m (n = 8) | 1.6 | 0.232 | ||
| (0.74–3.48) | ||||
| HRR1 | ||||
| ≥ 18 bpm (n = 52) | 1 (reference) | |||
| < 18 bpm (n = 50) | 1.61 | < 0.001 | 0.001 | |
| (1.36–1.75) | ||||
| Right heart catheterization | ||||
| mPAP | ||||
| < 50 mmHg (n = 52) | 1 (reference) | |||
| ≥ 50 mmHg (n = 50) | 1.32 | 0.099 | 1.51 | 0.007 |
| (0.93–1.57) | (1.18–1.71) | |||
| RAP | ||||
| < 8 mmHg (n = 51) | 1 (reference) | 1 | ||
| 9–14 mmHg (n = 41) | 0.75 | 0.237 | ||
| (0.46–0.1.21) | ||||
| > 14 mmHg (n = 10) | 1.8 | 0.136 | ||
| (0.82–3.86) | ||||
| CI | ||||
| ≥ 2.5 L min−1 m−2 (n = 52) | 1 (reference) | |||
| < 2.5 L min−1 m−2 (n = 50) | 0.72 | 0.156 | ||
| (0.46–1.13) | ||||
| PVR | ||||
| < 980 dynes sec cm−5 (n = 49) | 1 (reference) | |||
| ≥ 980 dynes sec cm−5(n = 53) | 1.31 | 0.1 | ||
| (0.92–1.56) | ||||
| SvO2 | ||||
| > 65% (n = 49) | 1 (reference) | 1 | ||
| 60%–65% (n = 31) | 1.33 | 0.366 | ||
| (0.72–2.45) | ||||
| < 60% (n = 22) | 0.66 | 0.164 | ||
| (0.37−1.19) | ||||
Abbreviations: 6MWD, 6‐min walk distance; 6MWT, 6‐min walk test; CHD, congenital heart disease; CI, cardiac index; CTD, connective tissue disease; eGFR CKD‐EPI, estimated glomerular filtration rate by Chronic Kidney Disease Epidemiology Collaboration; FC: WHO functional class for PAH; DLCO (%), % of predicted diffusion capacity of carbon monoxide; HR, hazard rate; HRR1, heart rate recovery at 1 min after 6MWT; IPAH, idiopathic pulmonary arterial hypertension; mPAP, mean pulmonary arterial pressure; NT‐proBNP, N‐terminal pro‐brain‐type natriuretic peptide PAH, pulmonary arterial hypertension; PaCO2, arterial carbon dioxide pressure; PVR, pulmonary vascular resistance; PAH‐CHD, PAH associated with congenital heart disease; PAH‐CTD, PAH associated with connective tissue disease; PAH‐Sch: PAH associated with schistosomiasis; RAP, right atrial pressure; SvO2, mixed venous oxygen saturation; WHO, World Health Organization.
Composite outcome refers to clinical worsening, defined by first event of hospitalization for any cause or disease progression (defined by decreased ≥ 15% in 6MWD from baseline AND worsening WHO functional class (FC) OR need for additional PAH therapy).
Figure 3.

Kaplan–Meier estimates of clinical worsening‐free time (blue) and survival time (red) in the four most common PAH subgroups: (A) PAH‐Sch, (B) IPAH, (C) PAH‐CHD, and (D) PAH‐CTD. *Risks of clinical worsening were equal to or slightly above average for PAH‐Sch and PAH‐CTD etiologies, and risks of mortality were above average for IPAH and PAH‐CTD etiologies.
2.5. Interval From Initial Clinical Worsening Event to Death
Although times to clinical worsening did not vary statistically significantly among the PAH subgroups (logrank: p = 0.116), IPAH and PAH‐CHD etiologies had longer median survival times on average than their PAH‐CTD and PAH‐Sch counterparts ( > 10 vs. 4.0–7.8 years; logrank test: p = 0.047; Figure 3). These survival findings were observed despite the IPAH cohort experiencing a relatively short time from diagnosis to CW, similar to PAH‐CTD, and despite PAH‐Sch experiencing a relatively long time to CW, similar to PAH‐CHD. However, after developing CW, IPAH and PAH‐CHD etiologies also survived longer on average than their PAH‐Sch and PAH‐CTD counterparts (Figure 3 summary table).
3. Discussion
The present study of consecutive patients with PAH diagnosed at a university‐affiliated PH‐reference center in Brazil demonstrated a low event‐free time (3.1 years) to occurrence of the composite outcome of hospitalization, disease progression and all‐cause death in a long‐term follow‐up. Furthermore, WHO FC III or IV, DLCO < 70%, HRR1 < 18 bpm after 6MWT, and one hemodynamic variable (mPAP ≥ 50 mmHg) were highly predictive of worse outcomes.
It is noteworthy that disease progression, instead of death, accounted for most of the first occurrences of the composite endpoint. Events such as disease progression and hospitalization have been reported as important predictors of mortality prognosis. McLaughlin et al [23] reported that patients from two large randomized clinical trials who experienced an event of morbidity before pre‐specified length of time after the inclusion had an increased risk of death as compared to those who had not (HR of 3.39 and 4.48), highlighting the importance of preventing disease progression in patients with PAH. Recent large PAH randomized controlled trials [24, 25, 26] have used time to clinical worsening as their primary outcome, defined as a composition of clinical variables [27, 28, 29, 30]. We recognize the quality‐of‐life burden to patients of living with a progressive disease. In this study, however, among the subset of participants who experienced clinical worsening on‐study, the median time from CW to death was longer in the IPAH cohort than in the PAH‐Sch cohort (7.4 vs. 2.2 years), despite that the IPAH and PAH‐Sch cohorts had similar median times from diagnosis to CW (3.4 vs. 3.0 years). We conjecture that specific disease mechanisms underlying etiologies of PAH, including co‐morbidities, differentially drive the risks of CW and death and could in the future be addressed by etiology‐specific case management.
In the current era of PAH therapy, international guidelines recommend the use of pre‐defined clinical and laboratory goals before the initiation of therapy and to adjust it in short period follow‐up according to the patient's risk of death. The main objective is to achieve and maintain a low‐risk status, defined by the presence of variables associated with better survival [8, 11, 12]. The current risk stratification scores are based on large PAH registries from the USA and Europe that have a prevalence of etiologies different from those in the southern hemisphere. As an example, schistosomiasis is a relatively common PAH etiology in Brazil [18]. Additionally, these scores have not been applied to Brazilian patients. Although the clinical profile of PAH patients varies throughout the world, the comparison of these risk scores among different populations may give insights for better management of PAH patients.
In the present sample, median time from diagnosis until all‐cause mortality was 10.2 years resulting in a progressive decline in the survival that was worse for PAH‐CTD and PAH‐Sch than for IPAH and PAH‐CHD. These results are somewhat like those reported for PAH‐CTD [15, 30, 31] and for PAH‐Sch [18], respectively. Overall, PAH survival was not different from the contemporary registries [14, 15, 31, 32, 33, 34, 35, 36, 37, 38, 39, 40]. It should be mentioned that, although the study took place over 2 years of the recent COVID‐19 pandemic, we did not observe an increase in the rate of CW events or deaths compared to the pre‐pandemic period.
The present report is the first Brazilian PAH cohort study with a follow‐up period longer than 3 years to our knowledge. The results confirm the existence of differences in the baseline prevalence and disease course of the subgroups of PAH, reflecting the local epidemiology and the larger period of follow‐up, and highlight the importance of national registries in identifying regional characteristics of the disease [21].
PAH‐Sch and IPAH were the most common etiologies in this cohort, in distinction from the registries of countries of the northern hemisphere, mainly due to the high prevalence of schistosomiasis in Brazil, where Schistosoma species are endemic, notably in the state of Minas Gerais [41, 42]. In a study conducted in 2008–2013 in São Paulo where Schistosoma is not endemic, IPAH and PAH‐CTD cohorts were more common than PAH‐Sch and the other three etiologies we studied, and the IPAH and PAH‐Sch cohorts had similar survival that was longer than in the PAH‐CTD cohort [18]. In contrast, a new finding of the present study was that PAH‐Sch patients had a worse survival rate after CW than IPAH and PAH‐CHD. A possible explanation for the similar survival of IPAH and PAH‐Sch in São Paulo could be that PAH‐Sch patients were infected early in life in the endemic areas and relocated to non‐endemic areas, allowing the right ventricle to adapt to the progressive and slow increase in pulmonary vascular resistance [43]. On the other hand, the relationship between the impact of CW and mortality afterwards was not evaluated there.
The average age and the female predominance were like previous reports from other countries [2, 4, 19, 44] suggesting that these variables are not dependent on geographics. The median time from symptoms until the diagnosis in the present series was 2.0 years, being similar across the PAH subgroups.
Patients were more severe at diagnosis (WHO FC III: 44.1%), with exception of PAH‐Sch and PAH‐CTD. Similarly to previous reports, there was a delayed PAH diagnosis that is a known contributor to worse prognosis [4, 5, 19, 20].
In the current study functional capacity and autonomic dysfunction of the patients were evaluated through the 6MWD and HRR1, respectively. This cohort performed better on 6MWD [median 428.9 m (IQR: 316.8–510.7 m)] as compared to other series [4], despite having similar clinical severity at admission, which again, demonstrates geographic heterogeneity in the physical capacity of Brazilian patients to perform routine activities [45, 46]. Patients with IPAH had a shorter median 6MWD [358.4 m (IQR: 213–475.2 m)], like other IPAH registries [19]. HRR1 has been recently reported as a valuable dynamic variable that reflects the impaired parasympathetic activity and cardiac adaptation to the high pulmonary vascular resistance presented in PH [47]. Regardless of 6MWD, HRR1 less than 18 beats at baseline was associated with a higher risk of occurrence of all composite endpoints. HRR1 correlates with autonomic dysfunction in various cardiovascular and respiratory conditions [48]. Additionally, HRR1 is a biomarker that is easily accessed and is associated with morbidity [49, 50] and mortality [51, 52, 53] in PAH and has a variable cut‐off discriminative value for prognosis variable ( < 16 beats [47, 48, 50, 52] and ≤ 18 beats [51, 53]).
Hemodynamic data were similar to previously reported international registries [16, 19]. Median CI (2.4 L min−1 m−2), RAP (8.5 mmHg) and SvO2 (64.9%) were compatible with the intermediate risk status [1, 11, 12]. Despite this, the only invasive data that was a significant predictor of clinical worsening was mPAP ≥ 50 mmHg [HR:1.51 (95% CI:1.18–1.71); p = 0.007]. High PVR in IPAH was not reflected by shorter times to death but may have hastened their CW.
Potential limitations of the present study should be taken into consideration. Firstly, its unicentric nature and relatively small sample size may be a source of bias that precludes generalization of the results, especially regarding subgroup analysis. Another issue to be taken into consideration is that access to medication in Brazil differs from US and Europe and varies from state‐to‐state and the current study reflects the reality of Minas Gerais. [8]. However, patients in this cohort were all submitted to the same diagnostic and treatment procedures. Otherwise, due to the need for the rational application of guideline recommendations, especially in rare diseases [21], local data are important because they express regional clinical, functional, echocardiographic, and hemodynamic characteristics, which may contribute to a better application of knowledge and practices about the PAH in Brazil.
Strengths of this study are that the cohort enrolled only incident cases, i.e., patients hemodynamically diagnosed in the reference center, and there was no loss to follow‐up or missing data regarding the occurrence of events or clinical status.
In conclusion, in addition to some clinical and demographic similarities and differences among PAH subgroups of the present cohort, the rate of clinical worsening was similar and independent of their etiology. WHO FC III or IV, DLCO < 70% and HRR1 < 18 beats in 6MWT, and mPAP ≥ 50 mmHg as well as a first event of clinical worsening were predictive of worse outcomes.
Author Contributions
Ricardo A. Correa: study design, data analysis, interpretation, and writing of the manuscript. Camila F. Rezende: study design, data acquisition and data analysis and interpretation of the manuscript. Eliane V. Mancuzo: study design, interpretation and review of the manuscript. Claudia Mickael: interpretation and review of the manuscript; Camila M. C. Loureiro: interpretation and review of the manuscript; Rudolf K. F. Oliveira: interpretation and review of the manuscript; Joan F. Hilton: data analysis, interpretation and proofreading of the manuscript: Graham, Brian B: interpretation of data and proofreading of the manuscript.
Ethics Statement
RAC states that the study was approved by the Research Ethics Committee of the Federal University of Minas Gerais Ethics Committee, Brazil (ETIC Nr. 1.057.219/2015), and all patients signed an individual informed consent form.
Conflicts of Interest
RAC has received a speaking honorarium from Bayer, GSK, Janssen‐Cilag Pharmaceuticals and has served as an advisory board member for Bayer, GSK, Janssen and MSD. EVM has received a speaking honorarium and support for attending meetings from Boehringer Ingelheim. CMCL has received a speaking honorarium from Bayer S.A and Janssen‐Cilag Pharmaceuticals. RKFO has received a speaking honorarium from Bayer SA and Janssen‐Cilag Pharmaceuticals. The other authors have no conflict of interest to declare.
Acknowledgments
This study was supported by grant funding provided by NIH/NHLBI Grant # R01HL135872 to RAC, CFR, CMCL and RKFO; 1K01HL161024‐01 to CM; 313284/2021‐0 from the National Council for Scientific and Technological Development (CNPq), Brazil to RKFO; R01HL135872 and R21AI171968(NIH/NIAID) to JFH; and R01HL135872, R21AI171968, and 1P01HL152961 to BBG. RAC is supported by NIH/NHLBI, payments are being made to his institution ‐ Grant # R01HL135872. CFR is supported by NIH/NHLBI, payments are being made to his institution ‐ Grant # R01HL135872. CM is supported by NIH/NHLBI, payments were made to his institution ‐ Grant # 1K01HL161024‐01. CMCL is supported by NIH/NHLBI, payments are being made to her institution ‐ Grant # R01HL135872.RKFO is supported by the National Council for Scientific and Technological Development (CNPq), Brazil ‐ Grant #s 313284/2021‐0 and NIH/NHLBI ‐ payments are being made to his institution ‐ Grant # R01HL135872. JFH is supported by NIH/NHLBI and NIH/NIAID, payments are being made to her institution – Grants R01HL135872 and R21AI171968. BBG is supported by NIH/NHLBI and NIH/NIAID, payments were made to his institution ‐ Grants R01HL135872, R21AI171968, and 1P01HL152961.
References
- 1. Galiè N., Humbert M., Vachiery J. L., et al., “2015 ESC/ERS Guidelines for the Diagnosis and Treatment of Pulmonary Hypertension: The Joint Task Force for the Diagnosis and Treatment of Pulmonary Hypertension of the European Society of Cardiology (ESC) and the European Respiratory Society (ERS): Endorsed by: Association for European Paediatric and Congenital Cardiology (AEPC), International Society for Heart and Lung Transplantation (ISHLT),” European Respiratory Journal 46 (2015): 903–975. [DOI] [PubMed] [Google Scholar]
- 2. Levine D. J., “Pulmonary Arterial Hypertension: Updates in Epidemiology and Evaluation of Patients,” American Journal of Managed Care 27 (2021): S35–S41. [DOI] [PubMed] [Google Scholar]
- 3. Prins K. W. and Thenappan T., “World Health Organization Group I Pulmonary Hypertension,” Cardiology Clinics 34 (2016): 363–374. [DOI] [PMC free article] [PubMed] [Google Scholar]
- 4. Awdish R. and Cajigas H., “Definition, Epidemiology, and Registries of Pulmonary Hypertension,” Heart Failure Reviews 21 (2016): 223–228. [DOI] [PubMed] [Google Scholar]
- 5. Brown L. M., Chen H., Halpern S., et al., “Delay in Recognition of Pulmonary Arterial Hypertension,” Chest 140 (2011): 19–26. [DOI] [PMC free article] [PubMed] [Google Scholar]
- 6. Rich S., Dantzker D. R., Ayres S. M., et al., “Primary Pulmonary Hypertension. A National Prospective Study,” Annals of Internal Medicine 107 (1987): 216–223. [DOI] [PubMed] [Google Scholar]
- 7. D'Alonzo G. E., Barst R. J., Ayres S. M., et al., “Survival in Patients With Primary Pulmonary Hypertension. Results From a National Prospective Registry,” Annals of Internal Medicine 115 (1991): 343–349. [DOI] [PubMed] [Google Scholar]
- 8. Galiè N., Channick R. N., Frantz R. P., et al., “Risk Stratification and Medical Therapy of Pulmonary Arterial Hypertension,” European Respiratory Journal 53 (2019): 1801889. [DOI] [PMC free article] [PubMed] [Google Scholar]
- 9. Benza R. L., Gomberg‐Maitland M., Miller D. P., et al., “The RRVEAL Registry Risk Score Calculator in Patients Newly Diagnosed With Pulmonary Arterial Hypertension,” Chest 141 (2012): 354–362. [DOI] [PubMed] [Google Scholar]
- 10. Benza R. L., Gomberg‐Maitland M., Elliott C. G., et al., “Predicting Survival in Patients With Pulmonary Arterial Hypertension,” Chest 156 (2019): 323–337. [DOI] [PubMed] [Google Scholar]
- 11. Hoeper M. M., Kramer T., Pan Z., et al., “Mortality in Pulmonary Arterial Hypertension: Prediction by the 2015 European Pulmonary Hypertension Guidelines Risk Stratification Model,” European Respiratory Journal 50 (2017): 1700740. [DOI] [PubMed] [Google Scholar]
- 12. Boucly A., Weatherald J., Savale L., et al., “Risk Assessment, Prognosis, and Guideline Implementation In Pulmonary Arterial Hypertension,” European Respiratory Journal 50 (2017): 1700889. [DOI] [PubMed] [Google Scholar]
- 13. Humbert M., Sitbon O., Chaouat A., et al., “Pulmonary Arterial Hypertension in France: Results From a National Registry,” American Journal of Respiratory and Critical Care Medicine 173 (2006): 1023–1030. [DOI] [PubMed] [Google Scholar]
- 14. Humbert M., Sitbon O., Yaïci A., et al., “Survival in Incident and Prevalent Cohorts of Patients With Pulmonary Arterial Hypertension,” European Respiratory Journal 36 (2010): 549–555. [DOI] [PubMed] [Google Scholar]
- 15. Benza R. L., Miller D. P., Barst R. J., Badesch D. B., Frost A. E., and McGoon M. D., “An Evaluation of Long‐Term Survival From Time of Diagnosis in Pulmonary Arterial Hypertension From the REVEAL Registry,” Chest 142 (2012): 448–456. [DOI] [PubMed] [Google Scholar]
- 16. Badesch D. B., Raskob G. E., Elliott C. G., et al., “Pulmonary Arterial Hypertension,” Chest 137 (2010): 376–387. [DOI] [PubMed] [Google Scholar]
- 17. Benza R. L., Miller D. P., Gomberg‐Maitland M., et al., “Predicting Survival in Pulmonary Arterial Hypertension: Insights From the Registry to Evaluate Early and Long‐Term Pulmonary Arterial Hypertension Disease Management (REVEAL),” Circulation 122 (2010): 164–172. [DOI] [PubMed] [Google Scholar]
- 18. Alves J. L., Gavilanes F., Jardim C., et al., “Pulmonary Arterial Hypertension in the Southern Hemisphere,” Chest 147 (2015): 495–501. [DOI] [PubMed] [Google Scholar]
- 19. McGoon M. D., Benza R. L., Escribano‐Subias P., et al., “Pulmonary Arterial Hypertension,” Journal of the American College of Cardiology 62 (2013): D51–D59. [DOI] [PubMed] [Google Scholar]
- 20. Frost A. E., Badesch D. B., Barst R. J., et al., “The Changing Picture of Patients With Pulmonary Arterial Hypertension in the United States,” Chest 139 (2011): 128–137. [DOI] [PubMed] [Google Scholar]
- 21. Souza R., Jardim C., and Carvalho C., “The Need for National Registries in Rare Diseases,” American Journal of Respiratory and Critical Care Medicine 174 (2006): 228. [DOI] [PubMed] [Google Scholar]
- 22. Badesch D. B., Champion H. C., Gomez Sanchez M. A., et al., “Diagnosis and Assessment of Pulmonary Arterial Hypertension,” Journal of the American College of Cardiology 54 (2009): S55–S66. [DOI] [PubMed] [Google Scholar]
- 23. McLaughlin V. V., Hoeper M. M., Channick R. N., et al., “Pulmonary Arterial Hypertension‐Related Morbidity Is Prognostic for Mortality,” Journal of the American College of Cardiology 71, no. 7 (2018): 752–763. [DOI] [PubMed] [Google Scholar]
- 24. Galiè N., Barberà J. A., Frost A. E., et al., “Initial Use of Ambrisentan Plus Tadalafil in Pulmonary Arterial Hypertension,” New England Journal of Medicine 373 (2015): 834–844. [DOI] [PubMed] [Google Scholar]
- 25. Pulido T., Adzerikho I., Channick R. N., et al., “Macitentan and Morbidity and Mortality in Pulmonary Arterial Hypertension,” New England Journal of Medicine 369 (2013): 809–818. [DOI] [PubMed] [Google Scholar]
- 26. Sitbon O., Channick R., Chin K. M., et al., “Selexipag for the Treatment of Pulmonary Arterial Hypertension,” New England Journal of Medicine 373 (2015): 2522–2533. [DOI] [PubMed] [Google Scholar]
- 27. McLaughlin V. V., Hoeper M. M., Channick R. N., et al., “Pulmonary Arterial Hypertension‐Related Morbidity Is Prognostic for Mortality,” Journal of the American College of Cardiology 71 (2018): 752–763. [DOI] [PubMed] [Google Scholar]
- 28. Frost A. E., Badesch D. B., Miller D. P., Benza R. L., Meltzer L. A., and McGoon M. D., “Evaluation of the Predictive Value of a Clinical Worsening Definition Using 2‐Year Outcomes in Patients With Pulmonary Arterial Hypertension,” Chest 144 (2013): 1521–1529. [DOI] [PubMed] [Google Scholar]
- 29. Burger C. D., Long P. K., Shah M. R., et al., “Characterization of First‐Time Hospitalizations in Patients With Newly Diagnosed Pulmonary Arterial Hypertension in the REVEAL Registry,” Chest 146 (2014): 1263–1273. [DOI] [PMC free article] [PubMed] [Google Scholar]
- 30. Fleming T. R. and Powers J. H., “Biomarkers and Surrogate Endpoints in Clinical Trials,” Statistics in Medicine 31 (2012): 2973–2984. [DOI] [PMC free article] [PubMed] [Google Scholar]
- 31. Hurdman J., Condliffe R., Elliot C. A., et al., “ASPIRE Registry: Assessing the Spectrum of Pulmonary Hypertension Identified at a Referral Centre,” European Respiratory Journal 39 (2012): 945–955. [DOI] [PubMed] [Google Scholar]
- 32. Herrera S., Gabrielli L., Paredes A., et al., “Survival of Patients With Pulmonary Arterial Hypertension After the Advent of Specific Pulmonary Vasodilator Therapies,” Revista Medica de Chile 144 (2016): 829–836. [DOI] [PubMed] [Google Scholar]
- 33. Ling Y., Johnson M. K., Kiely D. G., et al., “Changing Demographics, Epidemiology and Survival of Incident Pulmonary Arterial Hypertension: Results From the Pulmonary Hypertension Registry of the United Kingdom and Ireland,” American Journal of Respiratory and Critical Care Medicine 186 (2012): 790–796. [DOI] [PubMed] [Google Scholar]
- 34. Korsholm K., Andersen A., Kirkfeldt R. E., Hansen K. N., Mellemkjær S., and Nielsen‐Kudsk J. E., “Survival in an Incident Cohort of Patients With Pulmonary Arterial Hypertension in Denmark,” Pulmonary Circulation 5 (2015): 364–369. [DOI] [PMC free article] [PubMed] [Google Scholar]
- 35. Escribano‐Subias P., Blanco I., López‐Meseguer M., et al., “Survival in Pulmonary Hypertension in Spain: Insights From the Spanish Registry,” European Respiratory Journal 40 (2012): 596–603. [DOI] [PubMed] [Google Scholar]
- 36. Hoeper M. M., Huscher D., Ghofrani H. A., et al., “Elderly Patients Diagnosed With Idiopathic Pulmonary Arterial Hypertension: Results From the COMPERA Registry,” International Journal of Cardiology 168 (2013): 871–880. [DOI] [PubMed] [Google Scholar]
- 37. Zhang R., Dai L. Z., Xie W. P., et al., “Survival of Chinese Patients With Pulmonary Arterial Hypertension in the Modern Treatment Era,” Chest 140 (2011): 301–309. [DOI] [PubMed] [Google Scholar]
- 38. Sakao S., Tanabe N., Kasahara Y., and Tatsumi K., “Survival of Japanese Patients With Pulmonary Arterial Hypertension After the Introduction of Endothelin Receptor Antagonists And/Or Phosphodiesterase Type‐5 Inhibitors,” Internal Medicine 51 (2012): 2721–2726. [DOI] [PubMed] [Google Scholar]
- 39. Idrees M., Alnajashi K., Abdulhameed J., et al., “Saudi Experience in the Management of Pulmonary Arterial Hypertension; the Outcome of PAH Therapy With the Exclusion of Chronic Parenteral Prostacyclin,” Annals of Thoracic Medicine 10 (2015): 204–211. [DOI] [PMC free article] [PubMed] [Google Scholar]
- 40. Thenappan T., Shah S. J., Rich S., and Gomberg‐Maitland M., “A USA‐Based Registry for Pulmonary Arterial Hypertension: 1982–2006,” European Respiratory Journal 30 (2007): 1103–1110. [DOI] [PubMed] [Google Scholar]
- 41. Lapa M. S., Ferreira E. V. M., Jardim C., Martins B. C. S., Arakaki J. S. O., and Souza R., “Características Clínicas Dos Pacientes Com Hipertensão Pulmonar em Dois Centros de Referência em São Paulo,” Revista da Associação Médica Brasileira 52 (2006): 139–143. [DOI] [PubMed] [Google Scholar]
- 42. Gavilanes F., Fernandes C. J. C., and Souza R., “Pulmonary Arterial Hypertension in Schistosomiasis,” Current Opinion in Pulmonary Medicine 22 (2016): 408–414. [DOI] [PubMed] [Google Scholar]
- 43. Sibomana J. P., Campeche A., Carvalho‐Filho R. J., et al., “Schistosomiasis Pulmonary Arterial Hypertension,” Frontiers in Immunology 11 (2020): 608883. [DOI] [PMC free article] [PubMed] [Google Scholar]
- 44. Hoeper M. M., Humbert M., Souza R., et al., “A Global View of Pulmonary Hypertension,” Lancet Respiratory Medicine 4 (2016): 306–322. [DOI] [PubMed] [Google Scholar]
- 45. Casanova C., Celli B. R., Barria P., et al., “The 6 Min Walk Distance in Healthy Subjects: Reference Standards From Seven Countries,” European Respiratory Journal 37 (2011): 150–156. [DOI] [PubMed] [Google Scholar]
- 46. Costa G. O. S., Ramos R. P., Oliveira R. K. F., et al., “Prognostic Value of Six‐Minute Walk Distance at a South American Pulmonary Hypertension Referral Center,” Pulmonary Circulation 10 (2020): 1–6 2045894019888422. [DOI] [PMC free article] [PubMed] [Google Scholar]
- 47. da Silva Gonçalves Bós D., Van Der Bruggen C. E. E., Kurakula K., et al., “Contribution of Impaired Parasympathetic Activity to Right Ventricular Dysfunction and Pulmonary Vascular Remodeling in Pulmonary Arterial Hypertension,” Circulation 137 (2018): 910–924. [DOI] [PubMed] [Google Scholar]
- 48. Gibbons R. J., “Abnormal Heart Rate Recovery After Exercise,” Lancet 359 (2002): 1536–1537. [DOI] [PubMed] [Google Scholar]
- 49. Minai O. A., Gudavalli R., Mummadi S., Liu X., McCarthy K., and Dweik R. A., “Heart Rate Recovery Predicts Clinical Worsening in Patients With Pulmonary Arterial Hypertension,” American Journal of Respiratory and Critical Care Medicine 185 (2012): 400–408. [DOI] [PubMed] [Google Scholar]
- 50. Minai O. A., Nguyen Q., Mummadi S., Walker E., McCarthy K., and Dweik R. A., “Heart Rate Recovery Is an Important Predictor of Outcomes in Patients With Connective Tissue Disease‐Associated Pulmonary Hypertension,” Pulmonary Circulation 5 (2015): 565–576. [DOI] [PMC free article] [PubMed] [Google Scholar]
- 51. Ramos R. P., Arakaki J. S. O., Barbosa P., et al., “Heart Rate Recovery in Pulmonary Arterial Hypertension: Relationship With Exercise Capacity and Prognosis,” American Heart Journal 163 (2012): 580–588. [DOI] [PubMed] [Google Scholar]
- 52. Mackenzie A. and Johnson M., “Heart Rate Recovery in Response to Disease Targeted Therapy in Pre‐Capillary Pulmonary Hypertension,” European Respiratory Journal 48 (2016): PA2433. [Google Scholar]
- 53. Billings C. G., Hurdman J. A., Condliffe R., et al., “Incremental Shuttle Walk Test Distance and Autonomic Dysfunction Predict Survival in Pulmonary Arterial Hypertension,” Journal of Heart and Lung Transplantation 36 (2017): 871–879. [DOI] [PubMed] [Google Scholar]