

Abstract
Objective
Mouse models of Marfan syndrome (MFS) with Fibrillin 1 (Fbn1) variant C1041G exhibit cardiovascular abnormalities, including myxomatous valve disease (MVD) and aortic aneurism, with structural extracellular matrix (ECM) dysregulation. In this study, we examine the structure-function-mechanics relations of the mitral valve related to specific transitions in ECM composition and organization in progressive MVD in MFS mice from Postnatal day (P)7 to 1 year-of-age.
Approach and Results
Mechanistic links between mechanical forces and biological changes in MVD progression were examined in Fbn1C1041G/+ MFS mice. By echocardiography, mitral valve dysfunction is prevalent at 2 months with a decrease in cardiac function at 6 months, followed by a preserved cardiac function at 12 months. Mitral valve (MV) regurgitation occurs in a subset of mice at 2–6 months, while progressive dilatation of the aorta occurs from 2–12 months. Mitral valve tissue mechanical assessments using a uniaxial Permeabilizable Fiber System demonstrate decreased stiffness of MFS MVs at all stages. Histological and microscopic analysis of ECM content, structure, and fiber orientation demonstrate that alterations in ECM mechanics, composition, and organization precede functional abnormalities in Fbn1C1041G/+ MFS MVs. At 2 months, ECM abnormalities are detected with an increase in proteoglycans and decreased stiffness of the mitral valve. By 6–12 months, collagen fiber remodeling is increased with abnormal fiber organization in MFS mitral valve leaflets. At the same time, matrifibrocyte gene expression characteristic of collagen-rich connective tissue is increased, as detected by RNA in situ hybridization and qPCR. Together, these studies demonstrate early prevalence of proteoglycans at 2 months followed by upregulation of collagen structure and organization with age in MVs of MFS mice.
Conclusions
Altogether, our data indicate dynamic regulation of mitral valve structure, tissue mechanics, and function that reflect changes in ECM composition, organization, and gene expression in progressive MVD. Notably, increased collagen fiber organization and orientation, potentially dependent on increased matrifibrocyte cell activity, is apparent with altered mitral valve mechanics and function in aging MFS mice.
Keywords: myxomatous mitral valve, collagen organization and structure, proteoglycans, valve tissue stiffness, valve function
Graphical Abstract

Introduction
Normal heart valve structure and composition are established by valve remodeling, starting at late embryonic stages, and continuing postnatally [1]. Valve remodeling results in a stratified extracellular matrix (ECM), decreased cell density, and reduction in cell proliferation [1] that can be abnormal with congenital valve malformations characterized by ECM disruption and disorganization. Congenital heart valve abnormalities due to ECM gene mutations and defects often lead to myxomatous valve disease (MVD), affecting 10% of individuals over 75 [2, 3]. Marfan syndrome (MFS), usually caused by a heterozygous Fibrillin1 (Fbn1) variant, occurs in approximately 1 in 5,000 live births with more than 50% incidence of MVD [2–4]. Currently, the standard of care is valve repair or replacement, with no medical treatments available. Progressive MVD is characterized by collagen fiber fragmentation, replacement of mucopolysaccharides and proteoglycans, leaflet thickening, and insufficiency [2] mostly present in the mitral valve [5], yet the ECM mechanisms mediating progressive valve degeneration remain understudied. Moreover, it is not clear if ECM changes precede functional abnormalities or if functional abnormalities lead to altered ECM composition and valve structural defects in the context of congenital valve disease.
The heart valves are continuously exposed to changes in hemodynamic stresses due to pressure changes during systole and diastole [6]. A healthy heart valve can withstand these stresses owing to the highly organized ECM network, mainly composed of collagen, proteoglycans, and elastin [1, 6]. The ECM not only supports the structure-function relation of the valve but also interacts with multiple valve cell types and signaling molecules. In pathological conditions, such as MVD, the ECM organization is disrupted and may not be able to withstand the mechanical stresses or sustain the proper structure-function relationships over time. In addition, heart valve ECM organization and composition changes with age. However, specific ECM adaptations that occur with altered valve function are largely unknown. In addition, it is not known if the valves can compensate for ECM abnormalities and disrupted function during disease progression.
Mouse models of MFS with a Fibrillin-1 (Fbn1) variant C1041G allele exhibit cardiovascular abnormalities including MVD and aortic dilatation [7–9]. By one month of age, Fbn1C1041G/+ mice exhibit structural ECM dysregulation, apparent in MV leaflet thickening and increased glycosaminoglycans [8, 10]. The Fbn1C1041G/+ MVs also demonstrate abnormal collagen deposition interspersed with proteoglycans by 2 months-of-age at the tips of the valve [10]. However, the ECM content and structural organization has not been comprehensively studied longitudinally relative to valve mechanical and functional changes that underlie MVD progression. In this study, we assess the longitudinal structure-function-mechanics relationships relative to ECM composition and organization of mitral valve leaflets in Fbn1C1041G/+ MFS mice from postnatal to aged-adult stages.
Results
Mitral Valve Dimensions, Cardiac Function, and Aortic Dilation are Differentially Affected in Fbn1C1041G/+ MFS Mice
Cardiac, mitral valve, and aortic functional parameters were examined via echocardiography (ECHO) in the Fbn1C1041G/+ murine model of MFS [9] to determine patterns in disease progression at 2, 6 and 12 months-of-age (adolescence, adulthood, and aging, respectively) (Figure 1). The mitral valve E wave, which demonstrates the filling or passive blood flow from the left atrium to the left ventricle, was significantly lower in the MFS adult mice at 6 and 12 months-of-age (Figure 1A). The mitral valve A wave, which reflects blood flow generated by the active atrial contraction, was not significantly altered in MFS mice at all ages assessed (Figure 1B). These results demonstrate that the blood flow of the left side of the heart is reduced by 6 months, but contraction is not significantly affected, in MFS mice. The overall left ventricular function of the mice was determined by calculating the mitral E/A ratio, which is the mitral ratio of peak early to late diastolic filling velocity. The E/A ratio is similar between the MFS mice and WT young adult mice at 2 months. Interestingly, E/A ratios are significantly reduced at 6 months, but not at 12 months-of-age, in the MFS mice (Figure 1C). Mitral valve structure was evaluated by direct length measurements via ECHO to determine the mitral valve annulus and leaflet lengths (Figure 1D–F). Mitral valve annulus dimensions are similar between the MFS and WT mice at all timepoints (Figure 1D). However, both the anterior (Figure 1E) and posterior (Figure 1F) leaflets are significantly longer in the MFS mice at 2 months-of-age, but leaflet lengths resolve at 6 and 12 months-of-age. Thus, the mitral valve structure is most affected at 2 months, whereas function indicated by E/A ratio is most significantly affected at 6 months-of-age, supporting dynamic changes in mitral valve disease progression of MFS mice from 2–12 months-of-age.
Figure 1: Left sided heart valve dimensions and function are affected in Fbn1C1041G/+ MFS mice as determined by echocardiography measurements.
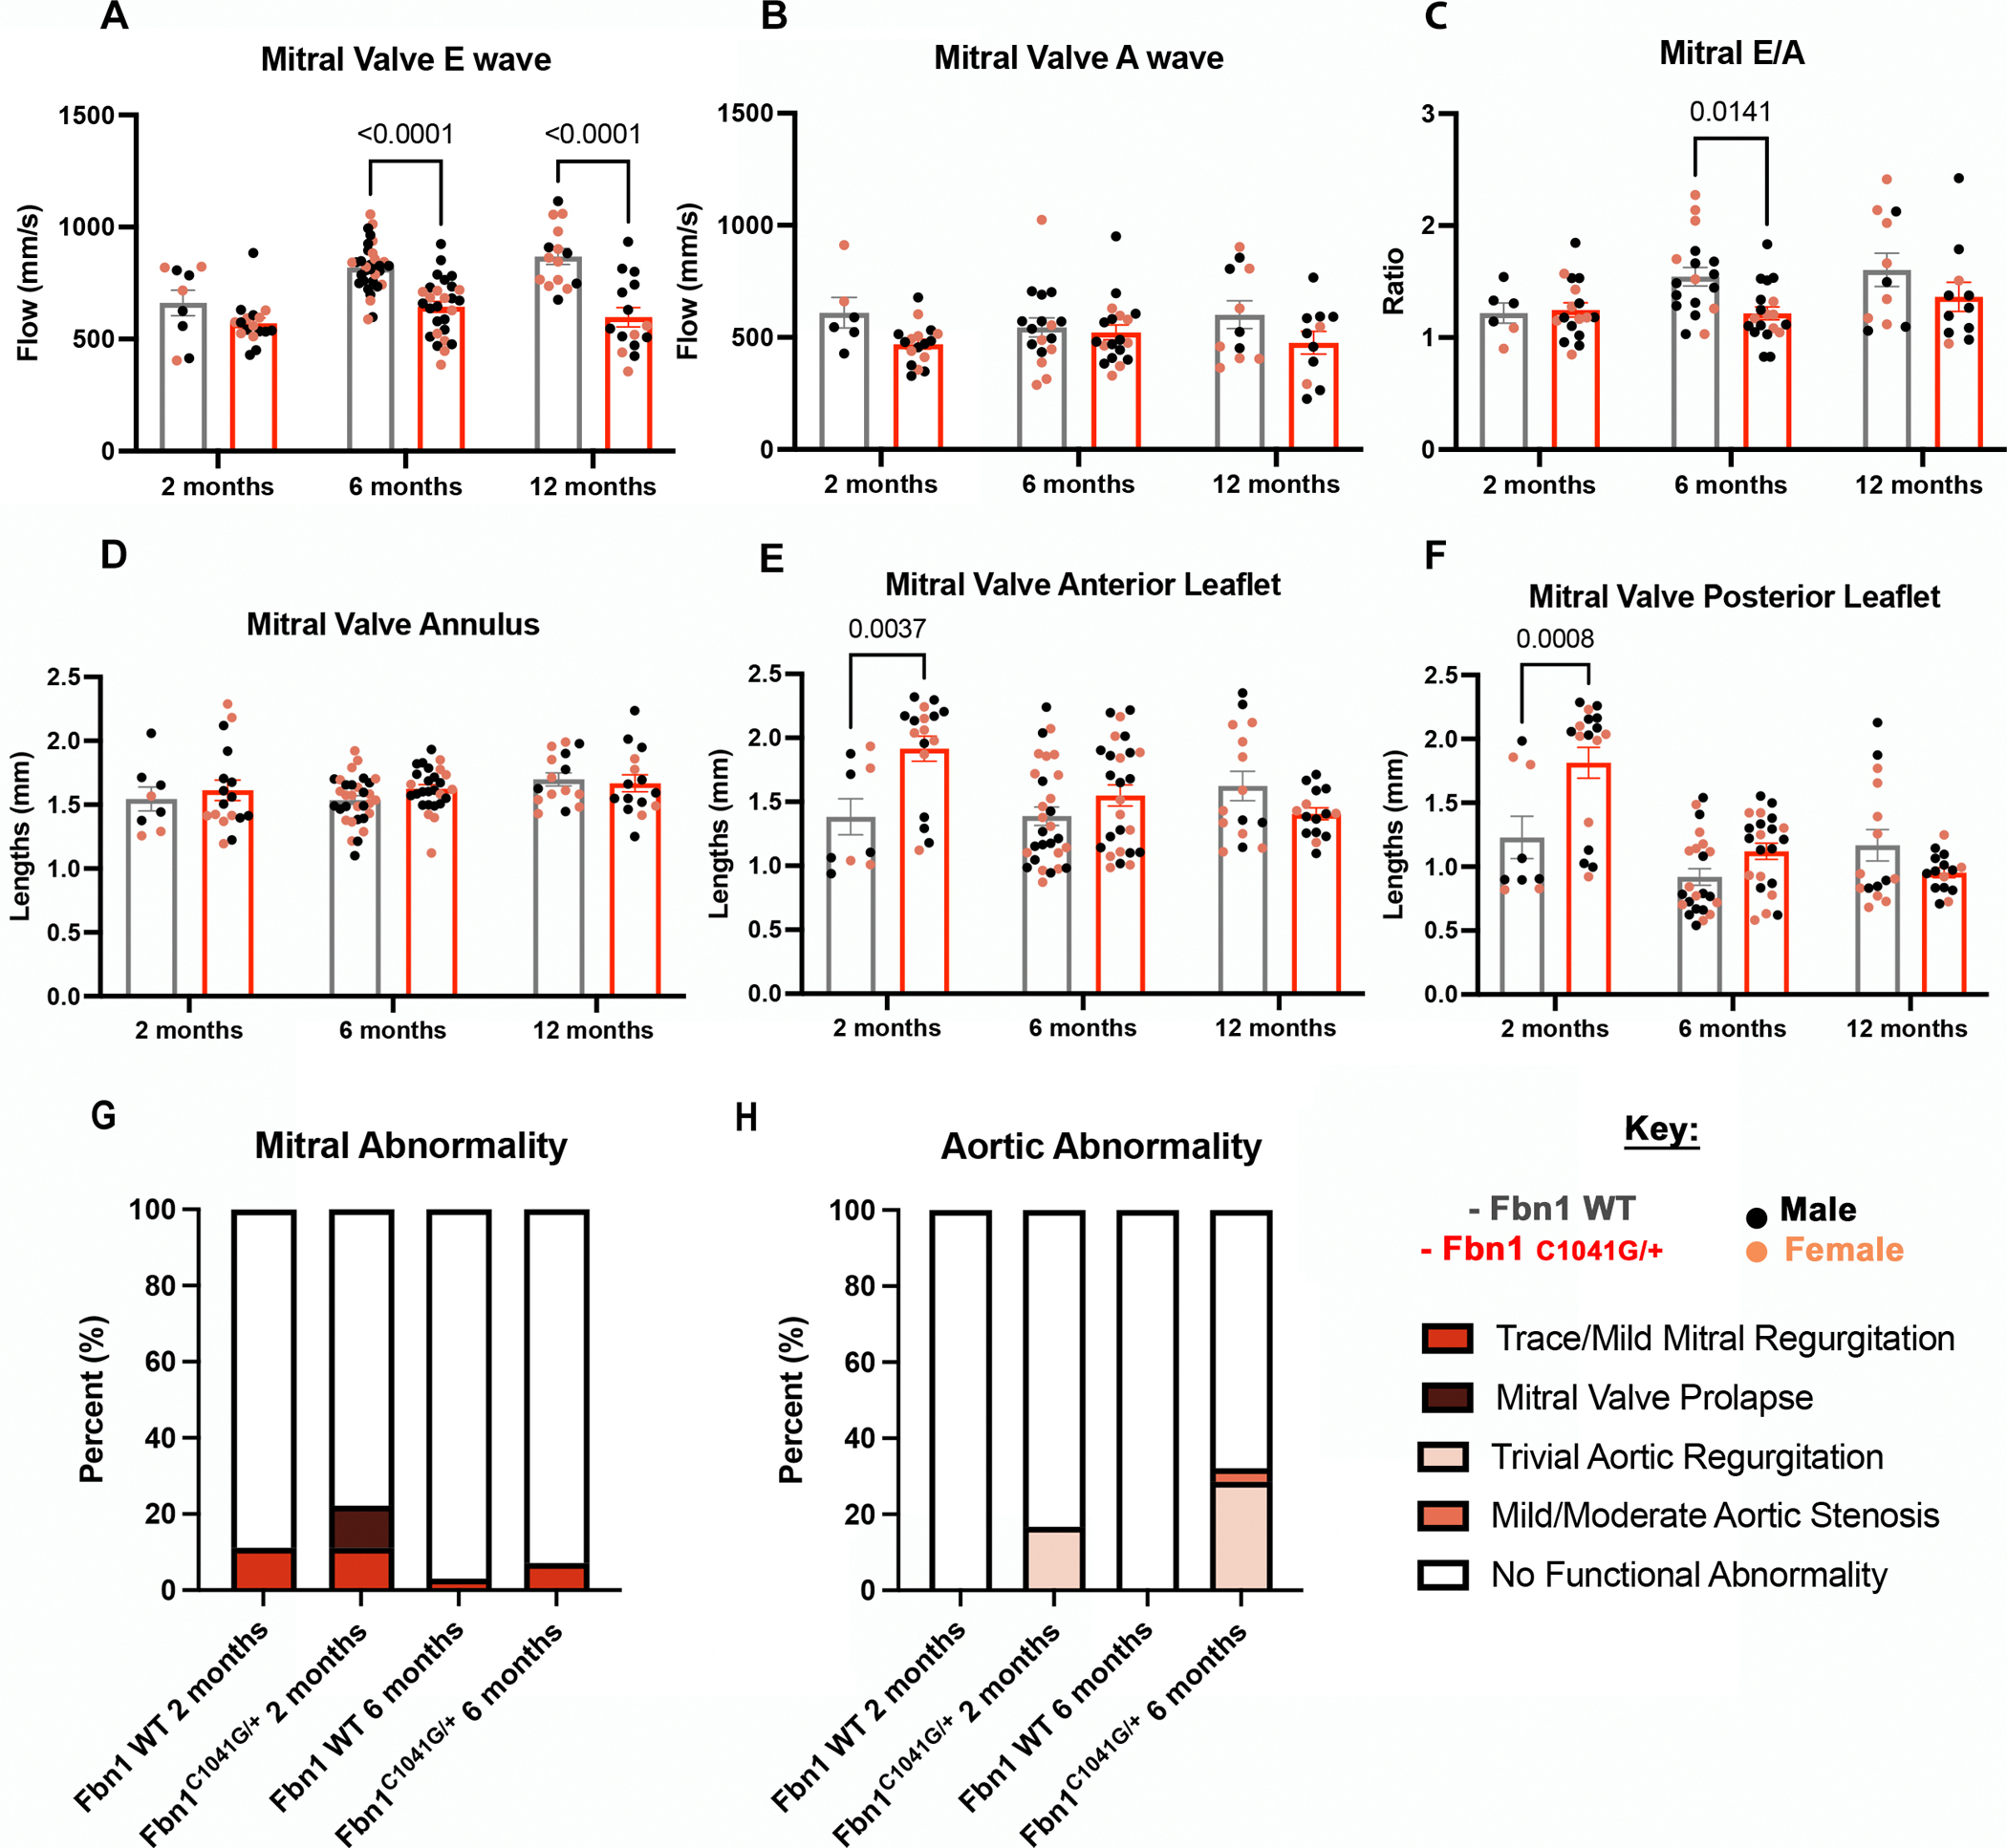
Echocardiography was done on MFS and WT mice (n=86 total). MFS mice have a significant decrease in (A) mitral valve E wave at later timepoints. The (B) mitral valve A wave is not significant. Even so, the overall left ventricular function, (C) the mitral valve E/A ratio, is significantly lower in the MFS mice at 6 months. The mitral valve (D) annulus, (E) anterior and (F) posterior leaflets dimensions were measured, with significant increase in MFS mice (E-F) leaflet lengths at 2 months. (G-H) Functional abnormalities were found at a higher percent in Fbn1C1041G/+ MFS (G) mitral and (H) aortic valves compared to WT controls. A two-way ANOVA was utilized, data are reported as mean ± SEM and a p-value < 0.05 was statistically significant.
Overall changes in heart size also were evaluated as heart weight-to-body weight ratios for all animals (Figure S1). No significant changes were seen except at 12 months-of-age, when the MFS mice have significantly higher heart-to-body weight ratios (Figure S1). In addition, no sex differences were seen between the two groups at any timepoint for mitral valve parameters and left ventricular function (Figure S2A–F) [11]. Other ECHO parameters and measurements were taken to evaluate overall cardiac chamber dimensions and output. Left atrium depth and left ventricle mass, which can be affected by mitral insufficiency, were assessed [12] (Figure S3A, B). The left atrium depth of the MFS mice hearts was trending slightly upward (Figure S3A), similar to the left ventricle mass, with a significant increase in left ventricle mass at 12 months-of-age in the MFS mice compared to the WT mice (Figure S3B). The isovolumetric relaxation and percent fractional shortening time was also assessed as a measurement of left atrium and ventricular function [12] (Figure S3C, D). No significant changes of the isovolumetric relaxation time occur between the WT and MFS mice (Figure S3C), while the percent fractional shortening is significantly increased at 6 months-of-age compared to the controls (Figure S3D).
Since mitral valve functional and length differences occurred at 2 and 6 months, functional abnormalities, such as regurgitation, stenosis and prolapse, were assessed at these timepoints. At both 2 and 6 months, the MFS mice had a higher incidence of functional abnormalities compared to the WT controls for both mitral (Figure 1G) and aortic valves (Figure 1H), with 33% versus 11% at 2 months and 39% versus 3% at 6 months for MFS versus WT mice for both valves. Specifically, 6/18 Fbn1C1041G/+ MFS mice at 2 months had an affected valve, with either regurgitation, stenosis or prolapse, including 11% trace/mild mitral insufficiency and 11% mitral valve prolapse (Figure 1G) and 16% trivial aortic insufficiency (Figure 1H). At 6 months, 11/28 Fbn1C1041G/+ MFS mice had an affected valve, as indicated by regurgitation, stenosis, or prolapse, with 7% trace/mild mitral insufficiency and 4% mild/moderate aortic stenosis (Figure 1G) and 28% having trivial aortic insufficiency (Figure 1H). One WT mouse per timepoint had trace/mild mitral insufficiency (Figure 1H; 1/9 mice at 2 months and 1/33 mice at 6 months). Therefore, at 2 months the mitral valves are abnormal, as indicated by mitral valve prolapse, which is not seen at 6 months suggesting a possible compensatory effect. These data show that the majority of cardiac functional abnormalities detected are in the aortic valves and that mitral valve abnormalities are less prevalent, similar to adult human MFS [13–15], but the mitral dysfunction still occurs before the aorta dysfunction.
MFS mortality is often due to aortic aneurysms, dissection and rupture [16, 17]. Thus, we investigated progressive changes in the structure of the aorta in the MFS mice at three different areas (Figure 2), including the aortic root (AR), the sinotubular junction (STJ) and the ascending aorta (AA) (Figure 2A). Significant increases in diameter length of all locations investigated, the AR, STJ and AA, were observed starting at 6 months and continuing to 12 months-of-age in the MFS mice (Figure 2B–D). As previously reported [11], increased incidence of aortic dilatation in males, relative to females, was seen at 12 months at the STJ (Figure S4B) and the ascending aorta (Figure S4C). Our findings demonstrate that aortic dilatation occurs in all three areas of the aorta in the MFS mice at 6 and 12 months. Thus, the mitral valve structural changes detected at 2 months, precede the aortic changes at later timepoints of 6 and 12 months-of-age. Together, these data demonstrate persistent aortic structural changes detected by ECHO in MFS mice characteristic of dilatation in the aorta of MFS mice at 6–12 months.
Figure 2: Aortic dilatation of Marfan syndrome mice are progressively increased at 2, 6 and 12 months.
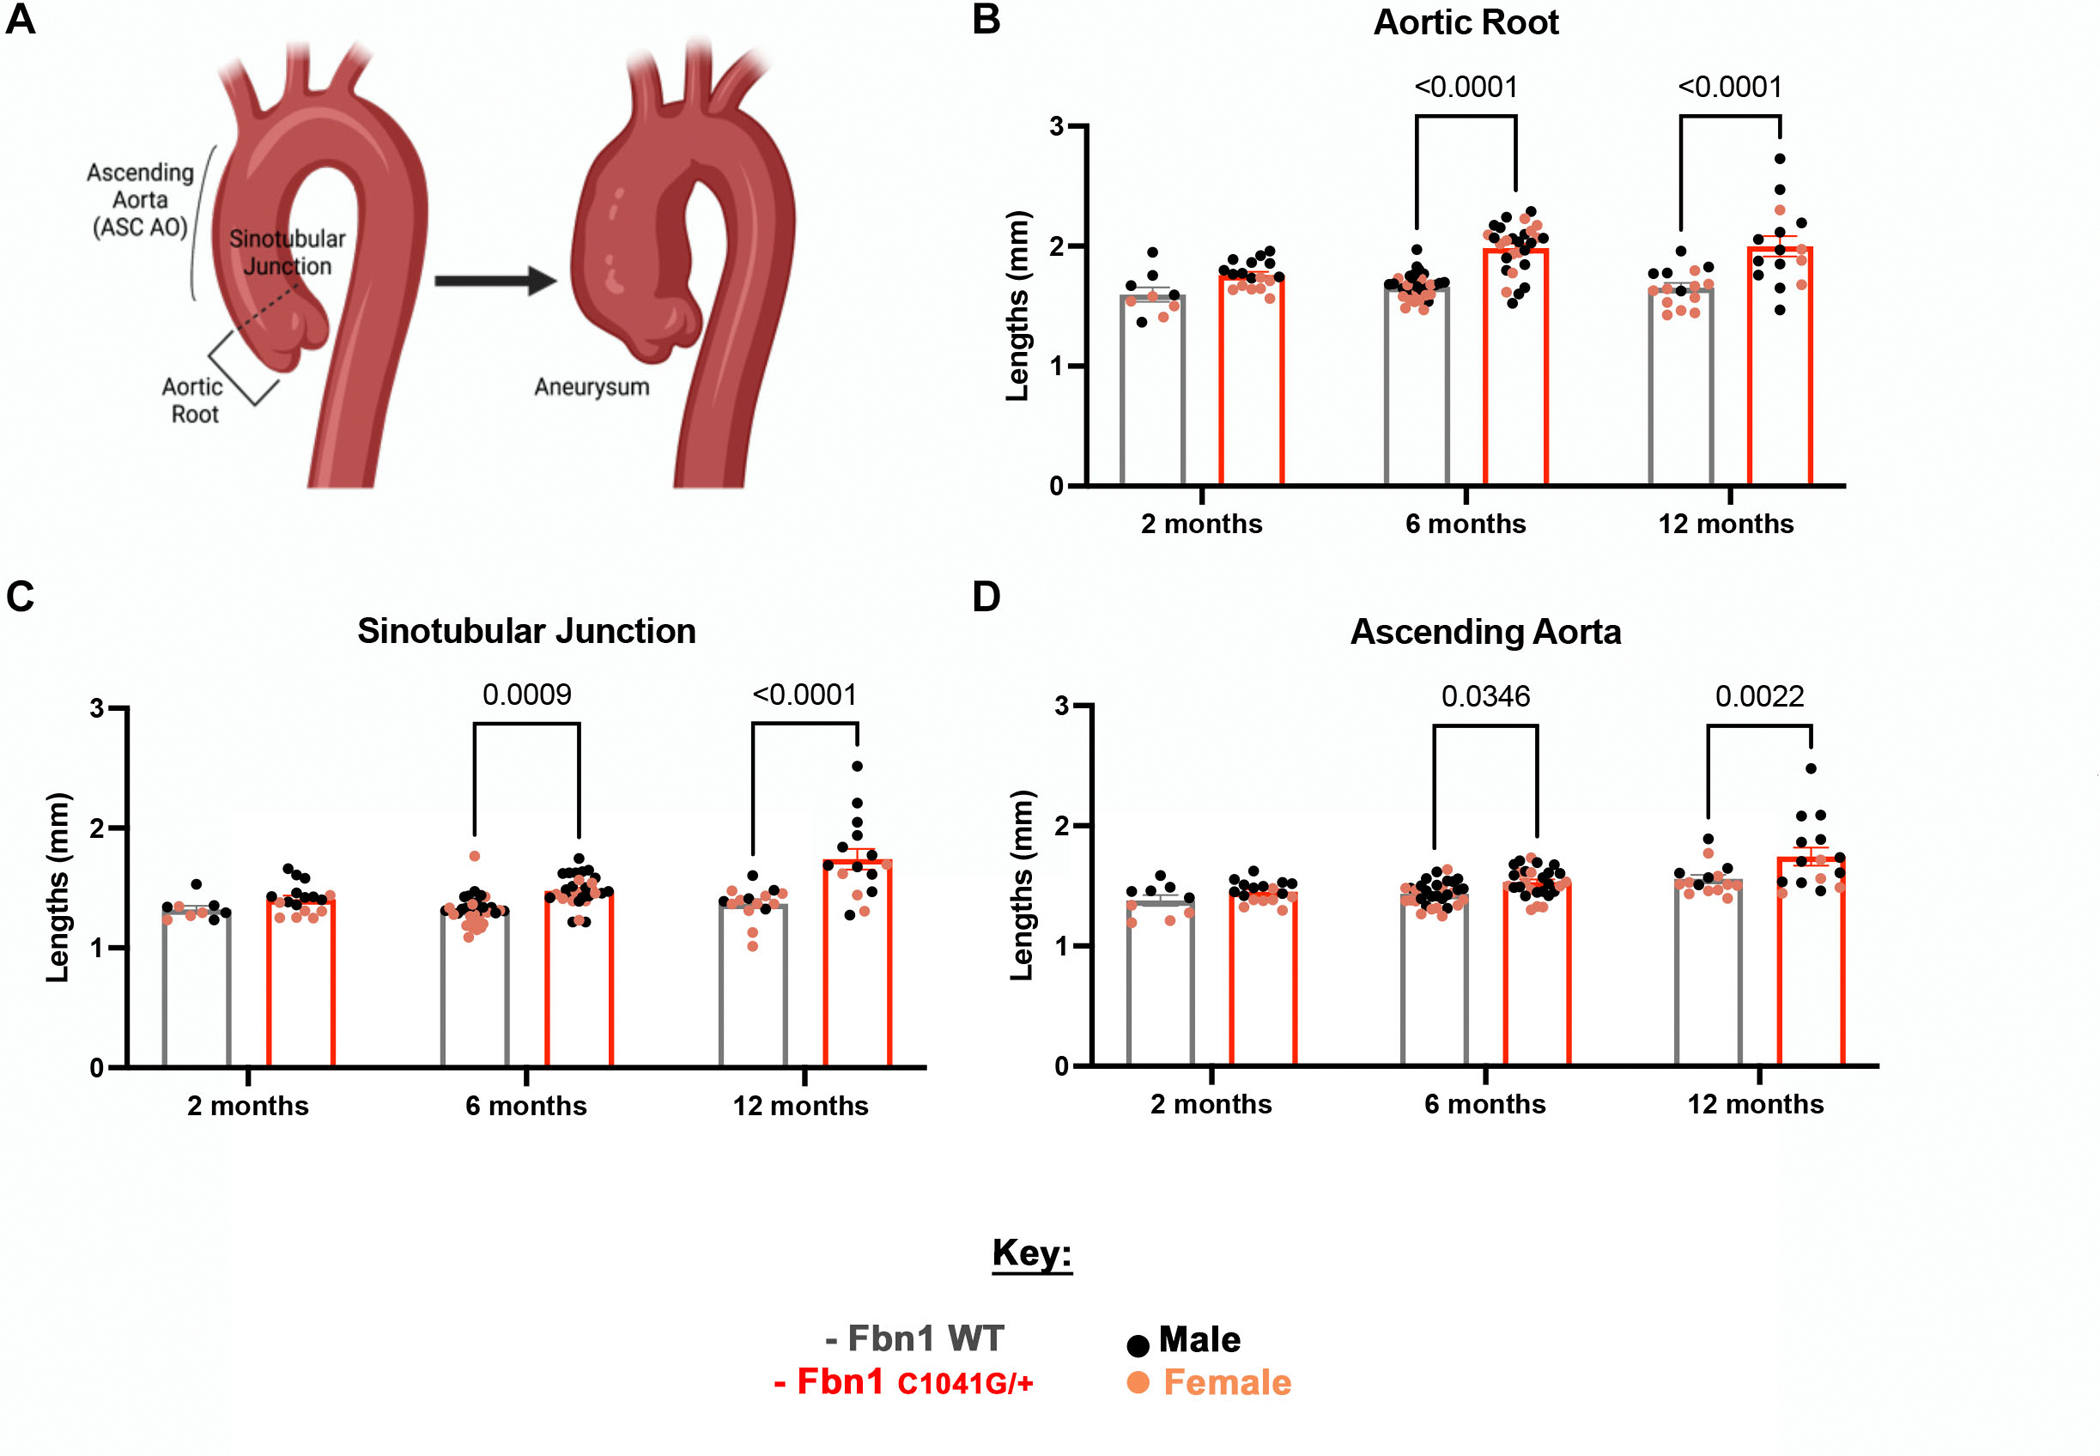
(A) A model demonstrating the three main areas, including the (B) aortic root, (C) sinotubular junction and (D) ascending aorta, affected in the aorta of MFS patients. As determined by echocardiography (n=86), aortic dimensions (B-D) are affected in MFS mice, with a significant increase seen at later timepoints of 6 and 12 months in MFS mice compared to WT littermate controls. A two-way ANOVA was utilized, data are reported as mean ± SEM and a p-value < 0.05 was statistically significant. (A) was created with BioRender.com.
Myxomatous Mitral Valves in MFS Mice Exhibit Reduced Stiffness
Previously, it was difficult to assess valve tissue mechanics in the context of an intact leaflet. Thus, valve mechanics remained understudied due to their small size and lack of proper equipment to assess their tissue properties. This is challenging in mice, but initial studies have demonstrated mechanical differences in small cohorts [16, 18]. Improved methods for assessment of tissue mechanics of the mitral valve leaflets are needed to determine the structural contributions of progressive MVD. A permeabilized fiber system was adapted to evaluate tissue stiffness in MFS and WT control MVs ex vivo (Figure 3A, B). The tissue stiffness (Young’s Modulus - E), was calculated by progressive stretching of isolated mitral valve leaflets with measurement of force and distance to calculate the stress versus strain (Figure 3C). The E demonstrates the tissue’s ability to withstand elastic deformation when a stress is applied to it. The MFS MVs exhibit reduced stiffness compared to the controls depending on age (Figure 3D, E). MV stiffness is significantly decreased in MFS mice MVs at 2.5 and 12 months-of-age, demonstrating altered tissue mechanics in early and late stages of disease (Figure 3D, E). The WT control mice have a higher E than MFS mice at 2.5 months, around the time that ECM stratification is fully established. Moreover, E in WT mice increases over time with an increase between 6 months and 12 months, possibly due to aging-related ECM changes (Figure 3E). Conversely, the MFS mice have a lower E at 2.5 months, which increases at 12 months, indicating an abnormal aging process (Figure 3E). Moreover, stress-strain curves show differential tissue stiffness between the WT and MFS mitral valve tissue with increasing stress and strain. The WT mice are stiffest and can withstand more force at 2 and 12 months compared to the MFS valves at 2 and 12 months. However, at 6 months the WT and MFS valves have similar trends in their mechanics (FigureS5). This suggests that 6 months may be a critical and necessary timepoint for ECM remodeling turnover, where collagen compensation starts to occur, potentially explaining the decrease in stiffness in the MFS mice at 12 months-of-age. These mechanical changes in the valve leaflets likely result in different loads of stress and deformation with development of mitral valve structural alterations and aging in MFS mice.
Figure 3: Tissue mechanical testing demonstrates reduced stiffness of Fbn1C1041G/+ MFS MVs.
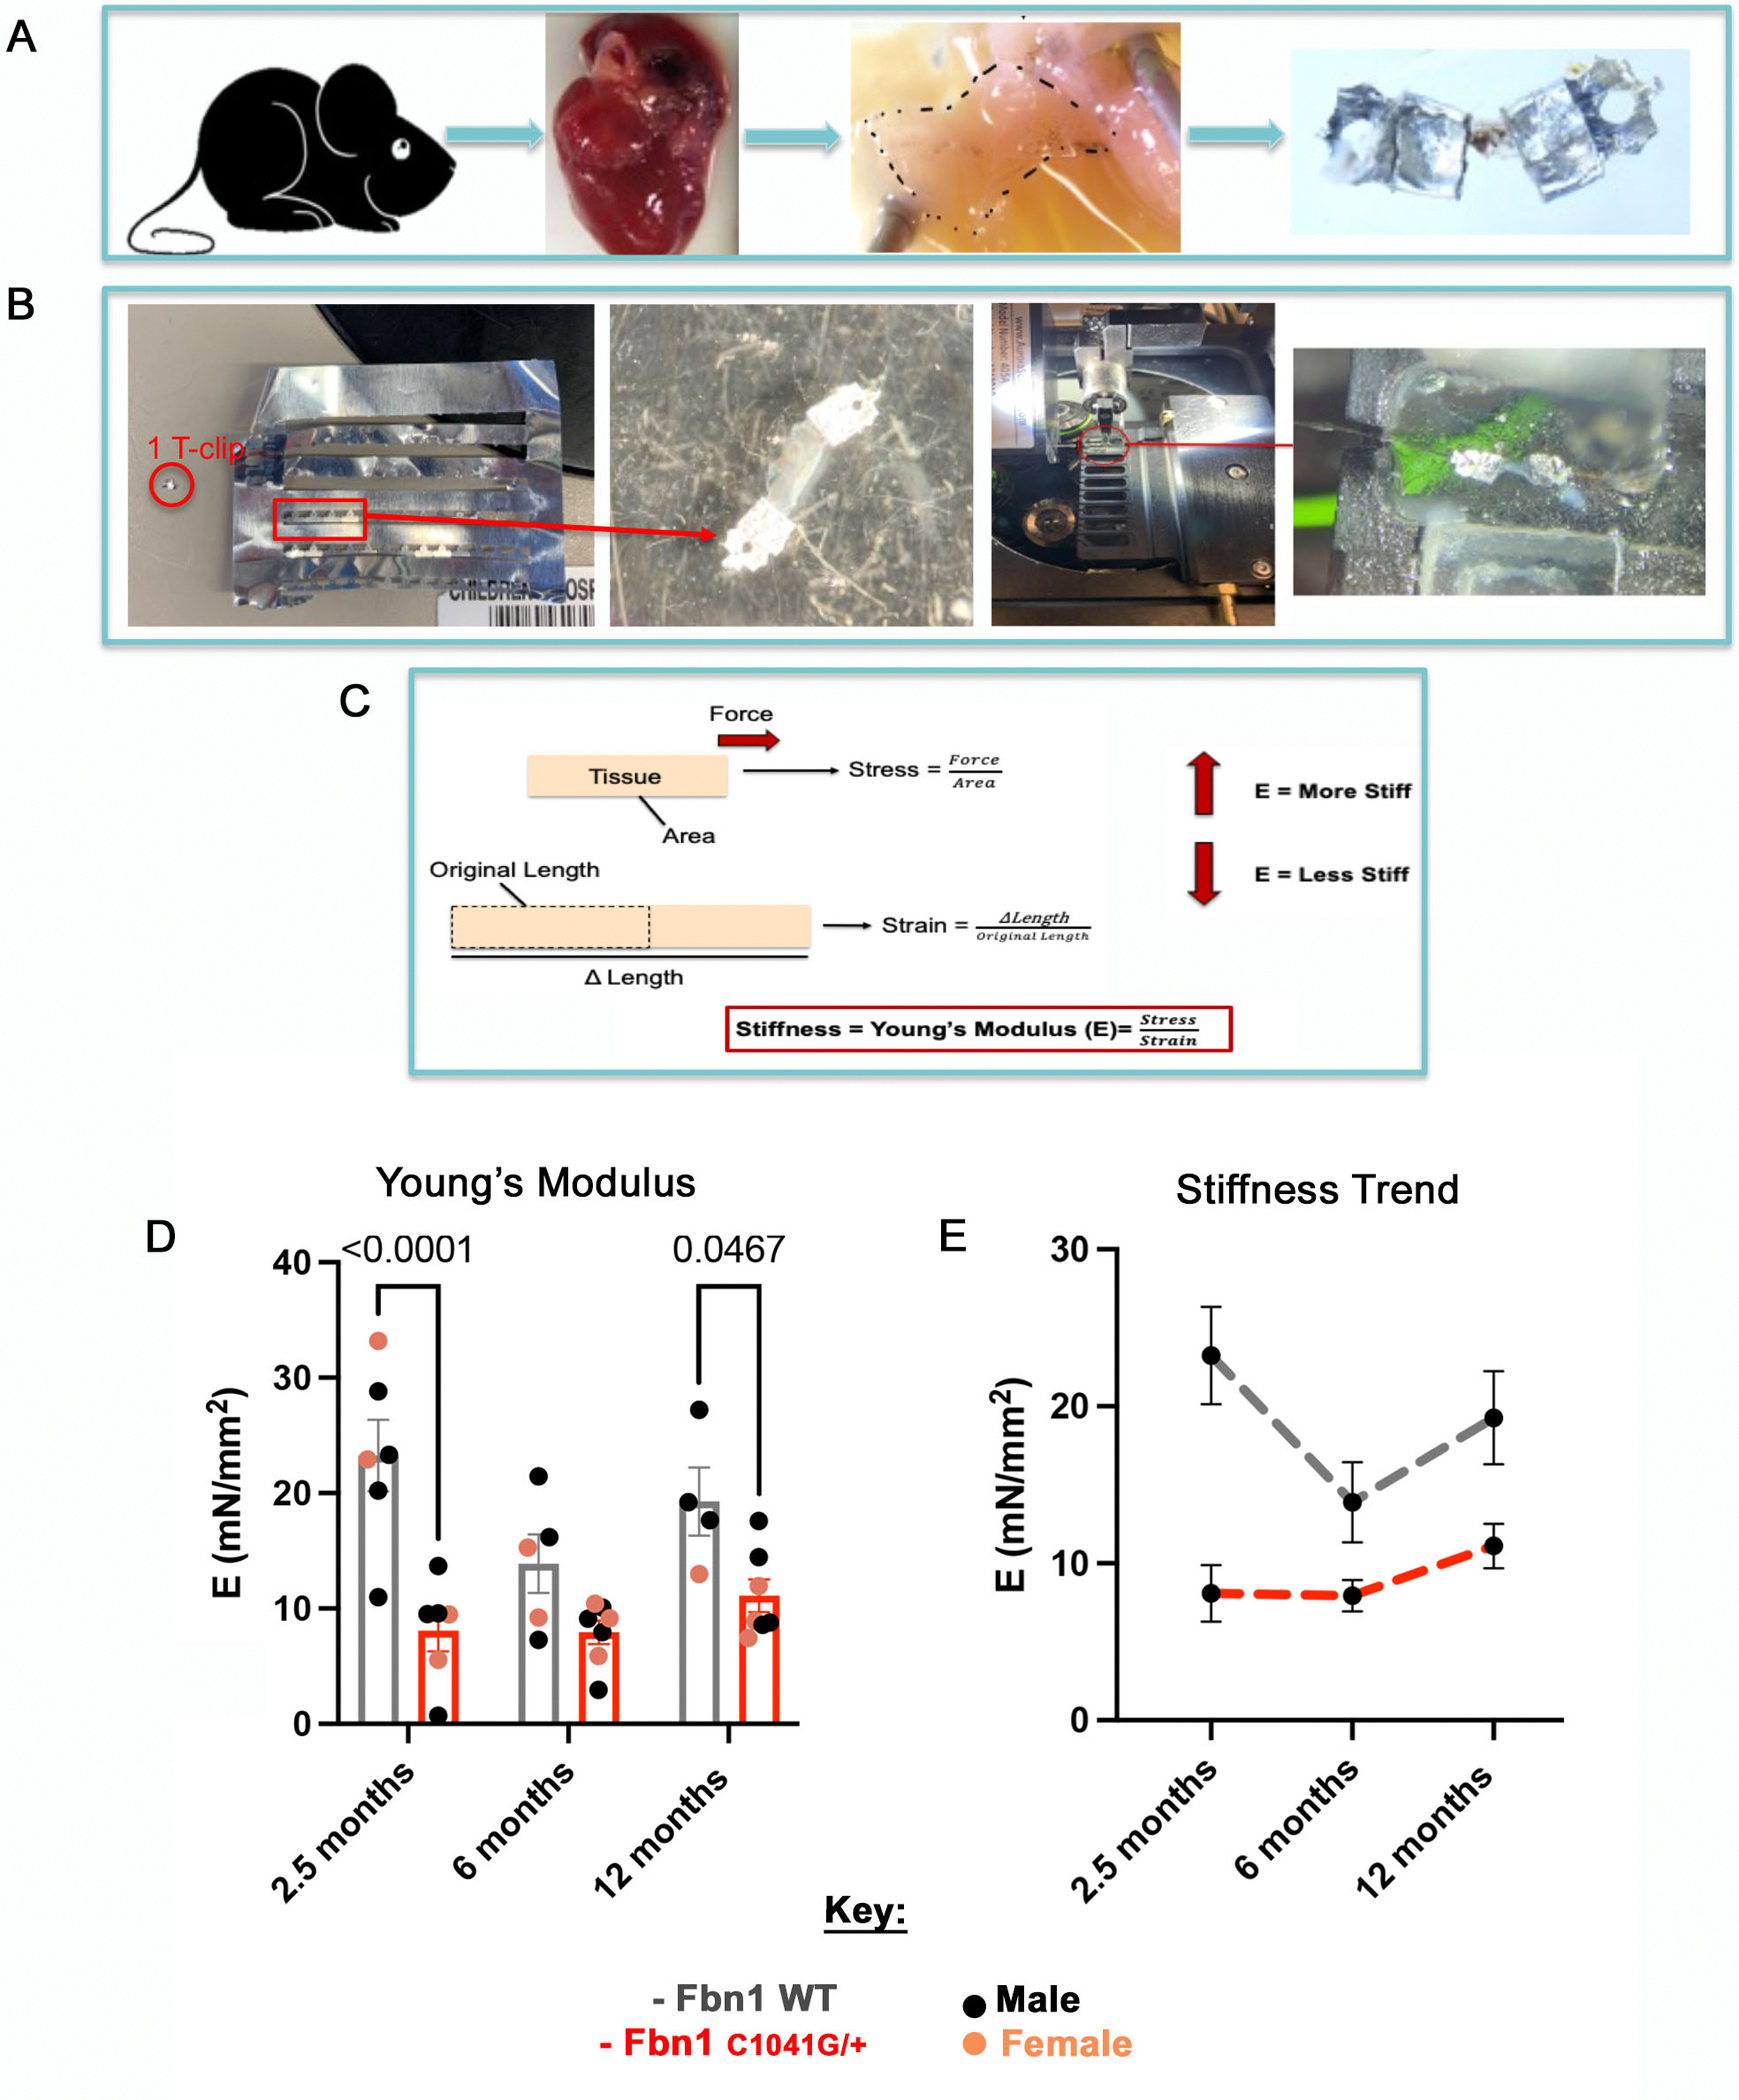
A permeabilized fiber system was applied to Fbn1 WT and Fbn1C1041G/+ MFS MVs to test mechanical properties ex vivo. (A) Schematic of the method used for mechanical testing, starting with harvesting mice, explanting the hearts, isolating the mitral valve (MV), and placing the MV leaflet onto T-clips. (B) One T-clip is placed circumferentially on each side of the MV leaflet and then mounted into the channel system to be stretched. The samples are stretched in small increments until the valve reaches 20% its length or the maximum force of 10mN is reached. Force and length measurements are obtained and calculated (C) as stress and strain to determine the Young’s modulus as an indicator of stiffness, of the mitral valve leaflets. The (D) stiffness of Fbn1C1041G/+ MFS mitral valve leaflets are significantly decreased at 2.5 and 12 months relative to WT controls. The overall trends (E) demonstrate that the Fbn1C1041G/+ MFS mice stiffness does not change much over time. A two-way ANOVA was utilized, data are reported as mean ± SEM and a p-value < 0.05 was statistically significant.
MFS Mitral Valves Undergo Abnormal Age-Dependent Extracellular Matrix Remodeling
Our previous findings demonstrated that MFS mice MVs undergo abnormal postnatal maturation, with mitral valve thickening, an increase in HABP and versican content, and visual collagen fragmentation starting at 1 month-of-age [10]. Detailed assessment of ECM organization and composition was performed for determination of age-dependent changes in ECM during MVD disease progression in MFS mice throughout adulthood. Movat’s Pentachrome staining was performed on MFS and WT control valves at 2.5, 6 and 12 months-of-age to assess structural collagen and proteoglycan organization and distribution (Figure 4A, B). Pixels of collagen and proteoglycans were quantified from Movat’s Pentachrome staining using an in-house MATLAB code (Figure S6). An ECM ratio of proteoglycan:collagen was calculated as a measure of overall ECM composition and structural changes. The collagen and proteoglycan pixels per section were quantified at the leaflet tips, which are the areas that exhibit abnormal thickening and myxomatous ECM changes in MFS mice (Figure 4C, D). This proteoglycan:collagen ratio is used as an overall indicator of ECM dysregulation in diseased valve leaflets.
Figure 4: ECM ratio is significantly increased at 2.5 months at the leaflet tips in Fbn1C1041G/+ MFS mice.
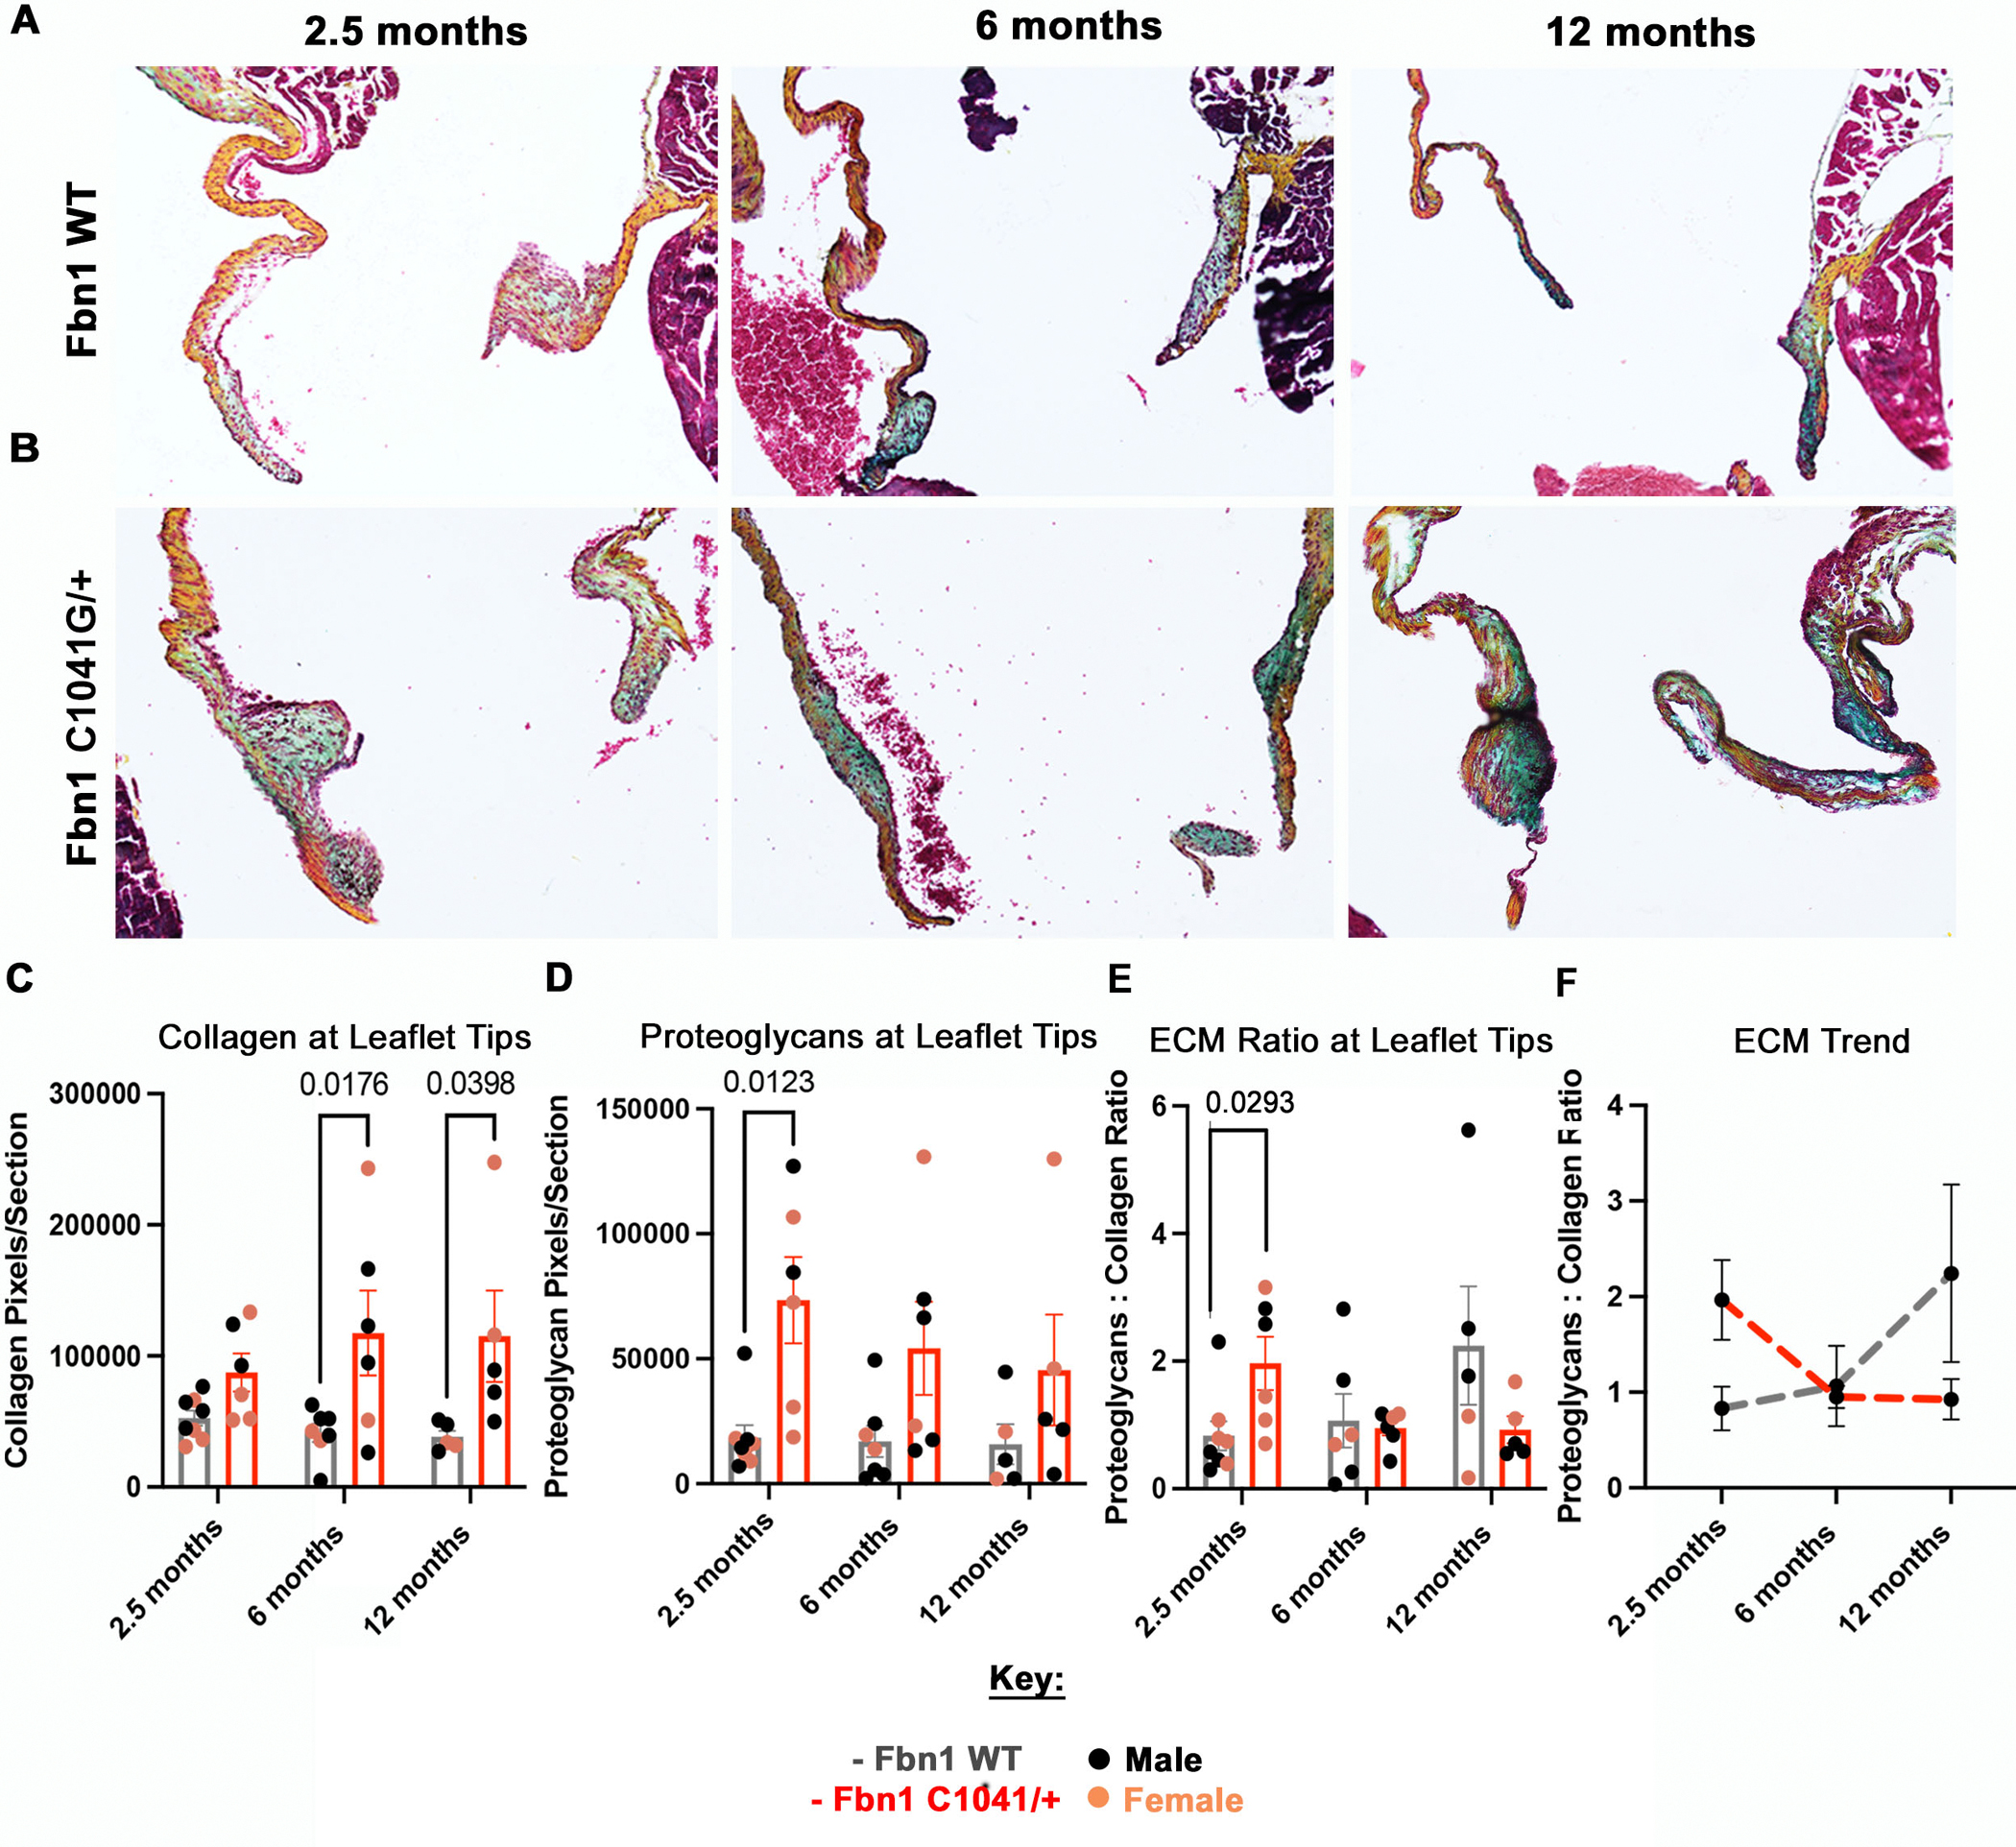
Representative histologic images of the mitral valve at 2.5, 6, and 12 months in WT (A) and MFS (B) mice using Movat’s Pentachrome staining, where blue stains proteoglycan and orange/yellow stains collagen. Red arrows point to the anterior (left leaflet) and posterior (right leaflet) leaflet tips. The (C) collagen and (D) proteoglycan pixels per section and (E) ECM ratio (proteoglycan:collagen) were calculated from the Movat’s Pentachrome images via an in-house MATLAB code. (C) Collagen pixels/section is significantly higher at 6 and 12 months, while the (D) proteoglycan pixels are significantly higher at 2.5 months in the Fbn1C1041G/+ MFS mice. The (E) ECM ratio (proteoglycan:collagen) is significantly higher in the Fbn1C1041G/+ MFS mice at 2.5 months. The overall trend of (F) ECM ratio is shown. A two-way ANOVA was utilized, data are reported as mean ± SEM and a p-value < 0.05 was statistically significant.
Initially, collagen and proteoglycan content were calculated separately. The collagen content per section was increased in MFS mice, with a significant increase seen at 6 and 12 months-of-age (Figure 4C). In contrast, the proteoglycan content per section was significantly increased at 2.5 months in MFS mice (Figure 4D). Notably, the WT controls had no significant changes in proteoglycan or collagen content (Figure 4C, D). The proteoglycan-to-collagen content, termed ECM ratio, was significantly increased in MFS relative to WT MV only at 2.5 months-of-age, which is during the initial thickening and lengthening of leaflets with disease (Figure 4E). At 6 and 12 months, the levels of collagen increase relative to proteoglycans in MFS mice, leading to no significant changes in ECM ratios, suggesting compensation for the earlier ECM abnormalities. The aging MFS mice demonstrate decreased proteoglycan:collagen ratios, whereas the WT mice have increased relative proteoglycan:collagen (Figure 4F). Thus, ECM ratio measurements suggest that at 2.5 months the MFS mice have more proteoglycans relative to collagen, compared to WT controls (Figure 4F). On the other hand, the ECM ratio at 12 months suggests that the MFS MV have less proteoglycans relative to collagen, compared to WT controls (Figure 4F). Together, our findings demonstrate abnormal ECM remodeling in MFS mice throughout the disease progression from 2.5- to 12 months of age, characterized by an initial increase in proteoglycans at 2.5 months, followed by increased relative collagen compensation in aging MFS mice at 6 and 12 months.
Collagen Fiber Dynamics are Altered in MFS Mice
Collagen fragmentation is a feature of myxomatous valve disease and aortic dilatation in MFS [11, 19, 20]. Mitral valve collagen fiber dynamics were assessed in WT controls and early-stage MFS mice at P7 and 2.5 months-of-age by Picrosirius Red staining using polarized light and brightfield imaging (Figure 5A, B) to determine if visual changes could be detected at initiation of valve abnormalities. The presence of collagens I and III, which are the two predominant collagens in the matrix that aggregate to form fibrils [21], was detected by differential birefringence visualized by polarized light. Positive pixels were quantified from photomicrographs using an in-house MATLAB code to separate the color channels of interest (Figure S7). At postnatal stage P7, no significant changes in either collagen were detected between the groups (Figure 5A, C, D). In contrast, at 2 months, both collagen I and III pixels per section increase in the MFS mice compared to the controls, with a significant increase in collagen I at the tip of the leaflet (Figure 5C, D). To determine relative collagen isoform gene expression levels throughout progression of the disease, qPCR of collagen1a1 (Col1a1) and collagen 3 (Col3) mRNA expression was assessed at 2, 6 and 12 months-of-age (Figure 5E, F). The MFS mice MVs exhibit an increase in both Col1a1 and Col3, with a significant increase specifically in Col1a1 gene expression at 6 and 12 months-of-age compared to the controls (Figure 5E, F).
Figure 5: Collagen fiber maturity and remodeling are altered in Fbn1C1041G/+ MFS mice.
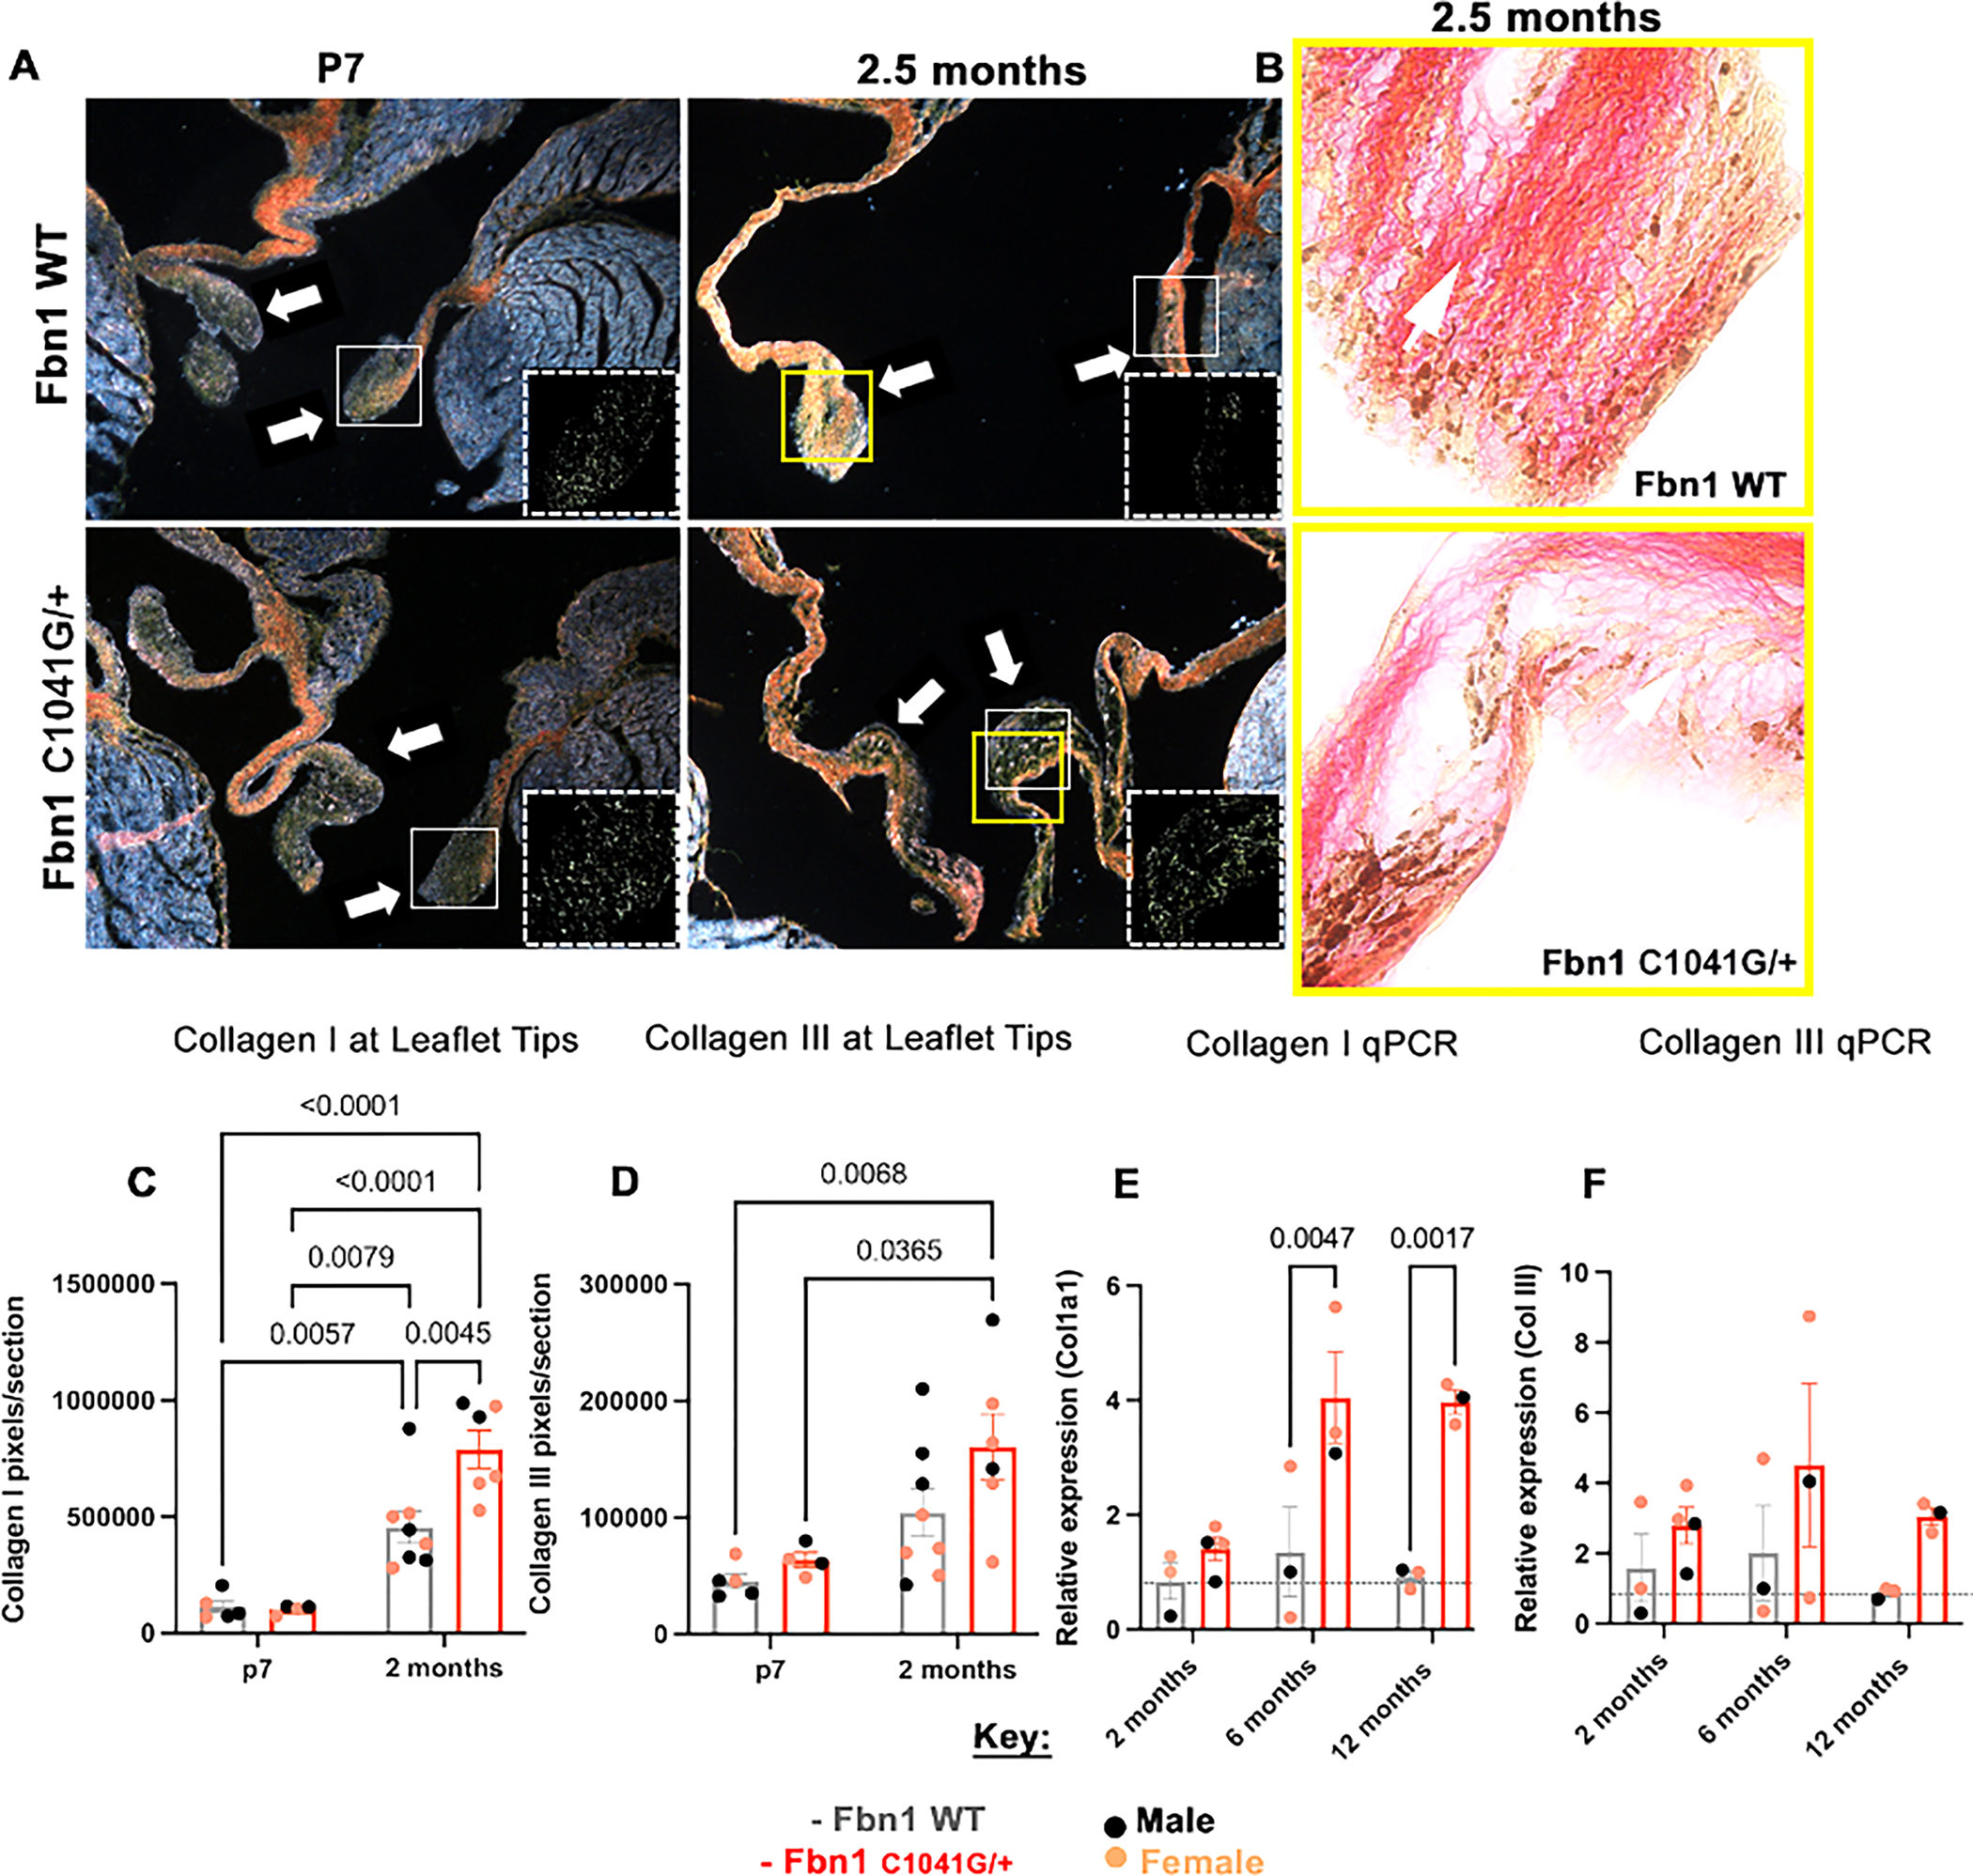
Picrosirius red images (A) at P7 and (A, B) 2.5 months, looking at differences in (A, C-F) collagen I (yellow-orange) and III (green) via (C, D) in-house MATLAB quantification of (A) birefringence and (E, F) qPCR. At (C, D) P7 collagen I and III levels are similar in Fbn1C1041G/+ MFS compared to the WTs, but at 2.5 months an increase (significantly for collagen I) is seen in the Fbn1C1041G/+ MFS mice, yet the collagen seems to be (B) less organized in (B) bright field. At later timepoints, (E, F) the gene expression of collagen for the WT mice remains unchanged from 2, 6 and 12 months, while the Fbn1C1041G/+ MFS mice increase (significantly for collagen I). All qPCR graphs are normalized to 18S (dotted gray lines). A two-way ANOVA was utilized, data are reported as mean ± SEM and a p-value < 0.05 was statistically significant. White arrows point to leaflet tips. Brown deposits in bright field (B) are melanocytes. White boxes signify the zoomed in areas (2 × 2) of the leaflet tips, demonstrating the isolated green (dotted white boxes) pixels.
Multiphoton microscopy with second harmonic generation (SHG) was used to further assess the structure and organization of the collagen fibers in MFS compared to WT MVs at P7 to 1 year-of-age (Figure 6). Collagen fibers at the distal tips of WT mitral valve leaflets appear more aligned and structured throughout the fibrosa side of the valve at all timepoints (Figure 6A, B, C, D). In contrast, the MFS mitral valves have increased overall collagen but less organized structure of collagen fiber bundles (Figure 6E, F, G, H). During early remodeling at P7, the collagen in WT mitral valve has dispersed loose fibers on the fibrosa side, while organized denser collagen fibers can be seen in MFS MVs (Figure 6A, E). At 2.5 months, wavy collagen fibers are aligned on the fibrosa side of the leaflet in WT MVs, while looser thin and dense collagen fibers are present throughout the leaflet tip in MFS MVs (Figure 6B, F). At later timepoints of 6 and 12 months, the WT mitral valve leaflet collagen fibers become less wavy but are still organized on the fibrosa side of the valve leaflet, while the MFS mitral valve leaflet collagen fibers start to become denser yet fragmented spanning the whole leaflet (Figure 6C–D, G–H). Together, these results demonstrate that, not only is content and accumulation of collagen dynamically regulated, but also the structural organization of collagen fibers is altered in the MFS MVs over time.
Figure 6: Collagen fiber structure and orientation are altered in Fbn1C1041G/+ MFS mice.
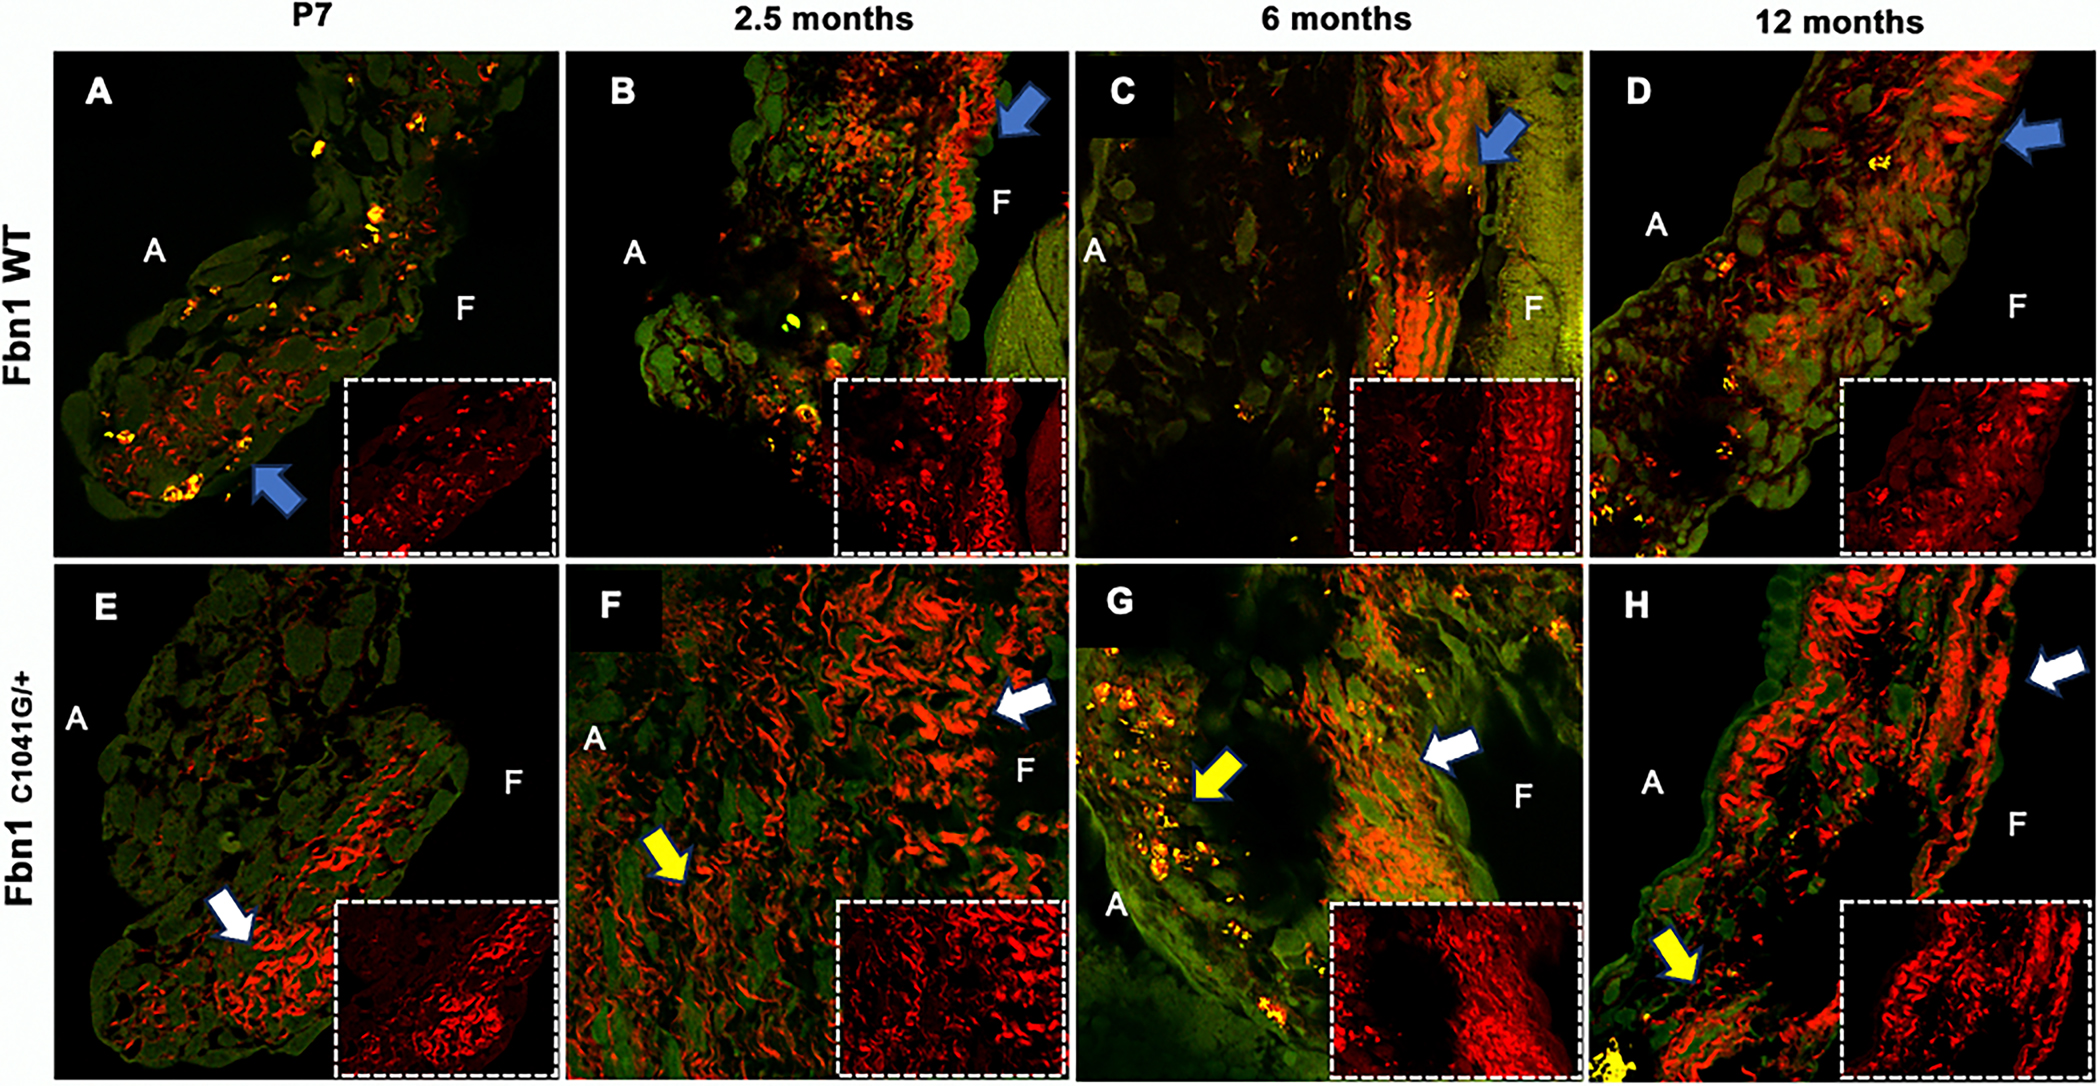
(A-H) Multi-photon confocal microscopy at 60x was performed at P7, 2-, 6- and 12 months of age. WT mice MVs have organized structure (A-D) of collagen throughout, while the MFS have disorganized structure (E-H) and abnormal fibers, progressing with age. Zoomed in areas (2.250 × 1.750) of the leaflet tips are shown in dotted white boxes. Red signal signifies second harmonic generation of collagen fiber bundles. A signifies atrialis side (laminar flow side) and F signifies the fibrosa side. Blue arrows indicate organized collagen, white arrows indicate denser collagen and yellow arrows indicate loose collagen areas.
Mitral Valves Exhibit Abnormal Collagen Remodeling with Expression of Matrifibrocyte Markers in MFS Mice
During heart valve remodeling, a subset of valvular interstitial cells (VICs) express markers characteristic of matrifibrocytes, such as chondroadherin (Chad), fibromodulin (Fmod) and cartilage intermediate layer protein 2 (Cilp2) by one month after birth [22]. Matrifibrocytes are contractile and are present in connective tissue with highly ordered collagen fibers, such as in a mature scar after cardiac injury or in valve leaflets [22, 23]. RNA scope in situ hybridization was performed at P7 and 2.5 months-of-age on MFS mice and WT controls to localize and quantify matrifibrocyte gene expression as positive pixels using an in-house MATLAB code to separate the color channel of interest (Figure 7A, Figure S8). During initial heart valve remodeling, the collagen interacting protein Chad is expressed in WT mitral valves with an increase in expression from P7 to 2.5 months of age (Figure 7B). However, there is not a significant increase in Chad expression in MFS mitral valves that exhibit defective ECM remodeling with prevalent proteoglycan expression at the leaflet tips from P7 to 2.5 months-of-age (Figure 7B). Comparing the two groups, the MFS mice have a lower expression of Chad than the WTs, with significantly decreased expression of Chad in proteoglycan-rich valve leaflets at 2.5 months-of-age (Figure 4D, Figure 7B). At 6 months when collagen expression and remodeling are increased (Figure 4C, 5C, 5E), the relative expression of Chad mRNA expression is significantly increased in the MFS mice MVs (Figure 7C). Similarly, two other markers of matrifibrocytes, Fmod and Cilp2, were quantified for mRNA expression at similar timepoints by qPCR (Figure 7D, E). Fmod mRNA expression followed the trend seen by Chad mRNA expression (Figure 7C, D), with a significant increase in Fmod expression at 6 months of age (Figure 7D). Interestingly, Cilp2 mRNA expression is increased at 2 months, but the expression is still higher than the WTs at 6 months-of-age (Figure 7E). Together, these results demonstrate that expression of matrifibrocyte markers is significantly higher in MFS mice when relative collagen expression and fibers are increasing, suggesting a role in pathologic ECM remodeling.
Figure 7: Matrifibrocyte marker genes Chad, Fmod and Cilp2 are dysregulated in Fbn1C1041G/+ MFS MVs.
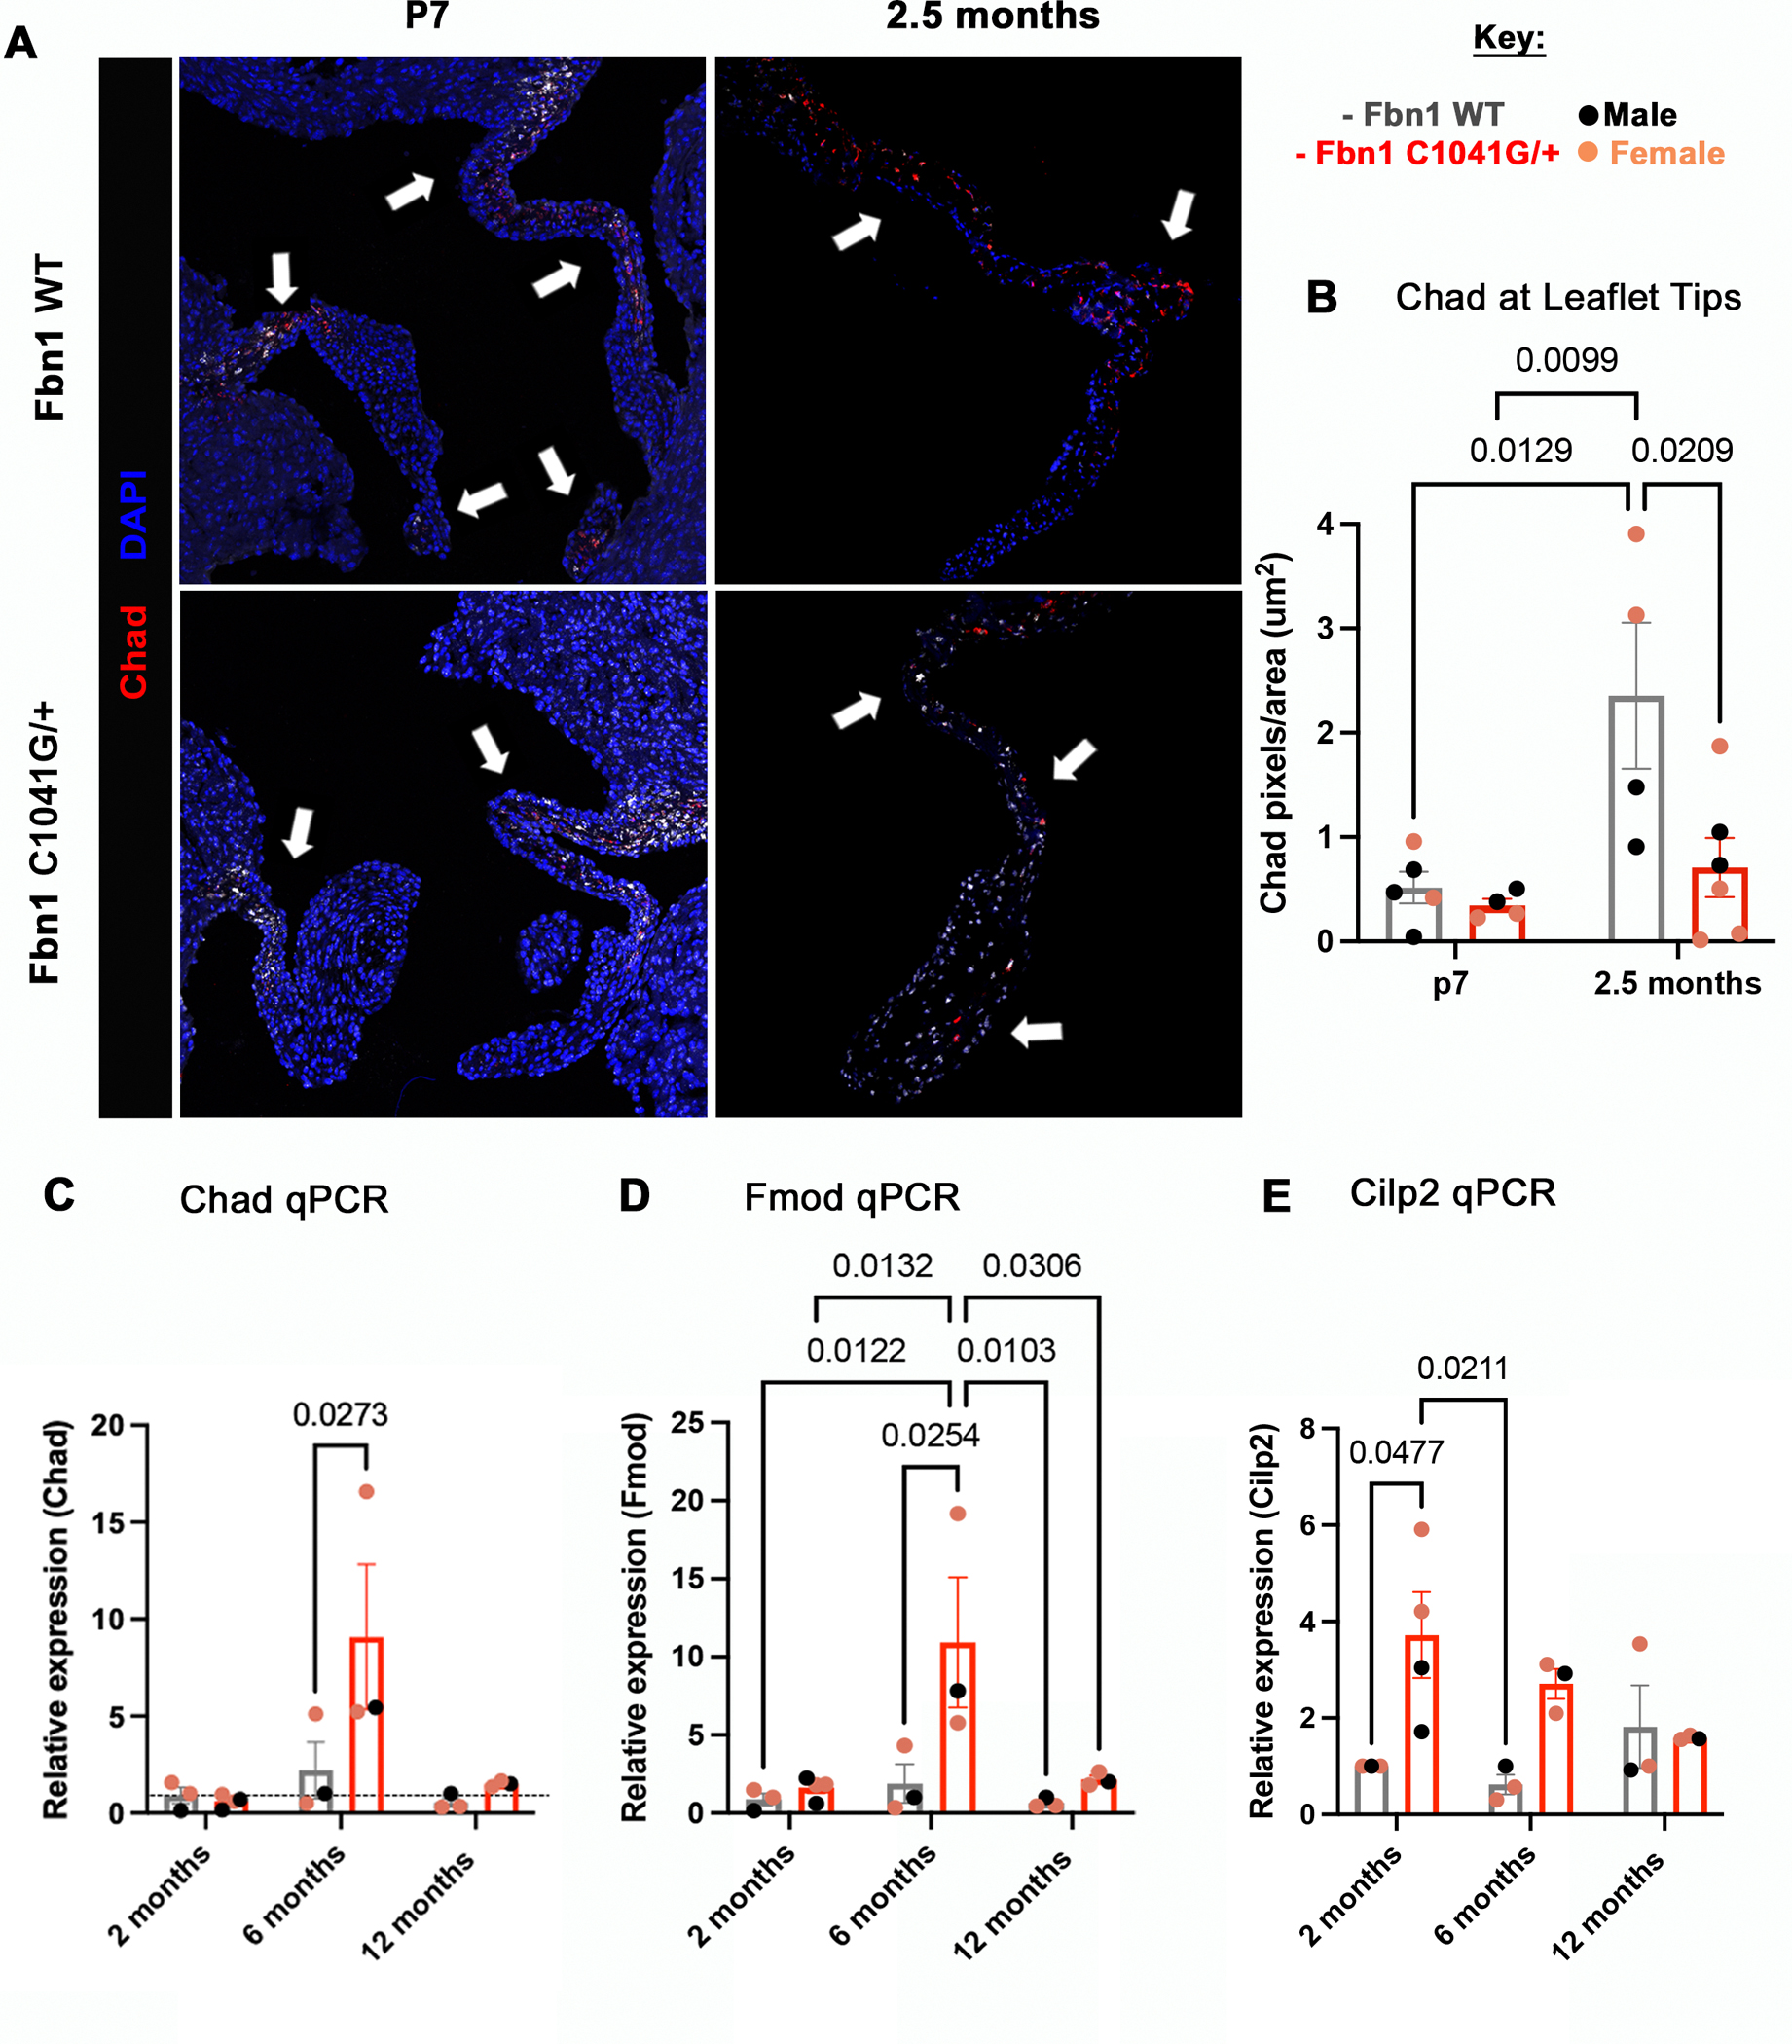
(A) RNA scope in-situ hybridization was performed for the matrifibrocyte marker (Chad-red) at P7 and 2.5 months mice, with quantification by (B) in-house MATLAB quantification, and (C) qPCR. (B, C) at P7 no changes are seen, but at 2.5 months (B) Chad expression is significantly decreased in Fbn1C1041G/+ MFS compared to WT mice at the leaflet tips. (C-E) The gene expression of matrifibrocyte markers significantly increases at 6 months and 2 months in Fbn1C1041G/+ MFS. All qPCR graphs are normalized to 18S. A two-way ANOVA was utilized; data are reported as mean ± SEM and a p-value < 0.05 was statistically significant. White arrows point to regions of positive staining of Chad in the leaflets.
Discussion
In this study, we show that ECM mechanics and morphological alterations of the mitral valve can be detected in MVD of MFS mice before functional abnormalities are seen. The initiation of MVD and abnormal ECM remodeling are apparent by 2 months as increased proteoglycan composition, decreased tissue stiffness, and leaflet elongation, indicative of increased deformation of the valve due to stress (Figure 8). By 6–12 months, collagen fiber remodeling is increased with abnormal fiber organization in MFS mitral valve leaflets (Figure 8). At the same time, matrifibrocyte gene expression characteristic of collagen-rich connective tissue is increased. Mitral valve regurgitation occurs in a subset of mice at 2–6 months, while progressive dilatation of the aorta occurs from 2–12 months. Interestingly, major differences in overall tissue stiffness of the MFS MVs were not observed at 2, 6 and 12 months, even though all these alterations are occurring (Figure 8). Altogether, our data indicate dynamic regulation of mitral valve structure, tissue mechanics, and function that reflect changes in ECM composition, organization, and gene expression in progressive MVD.
Figure 8: Model demonstrating mitral valve disease progression and ECM changes in Fbn1C1041G/+ MFS mice.
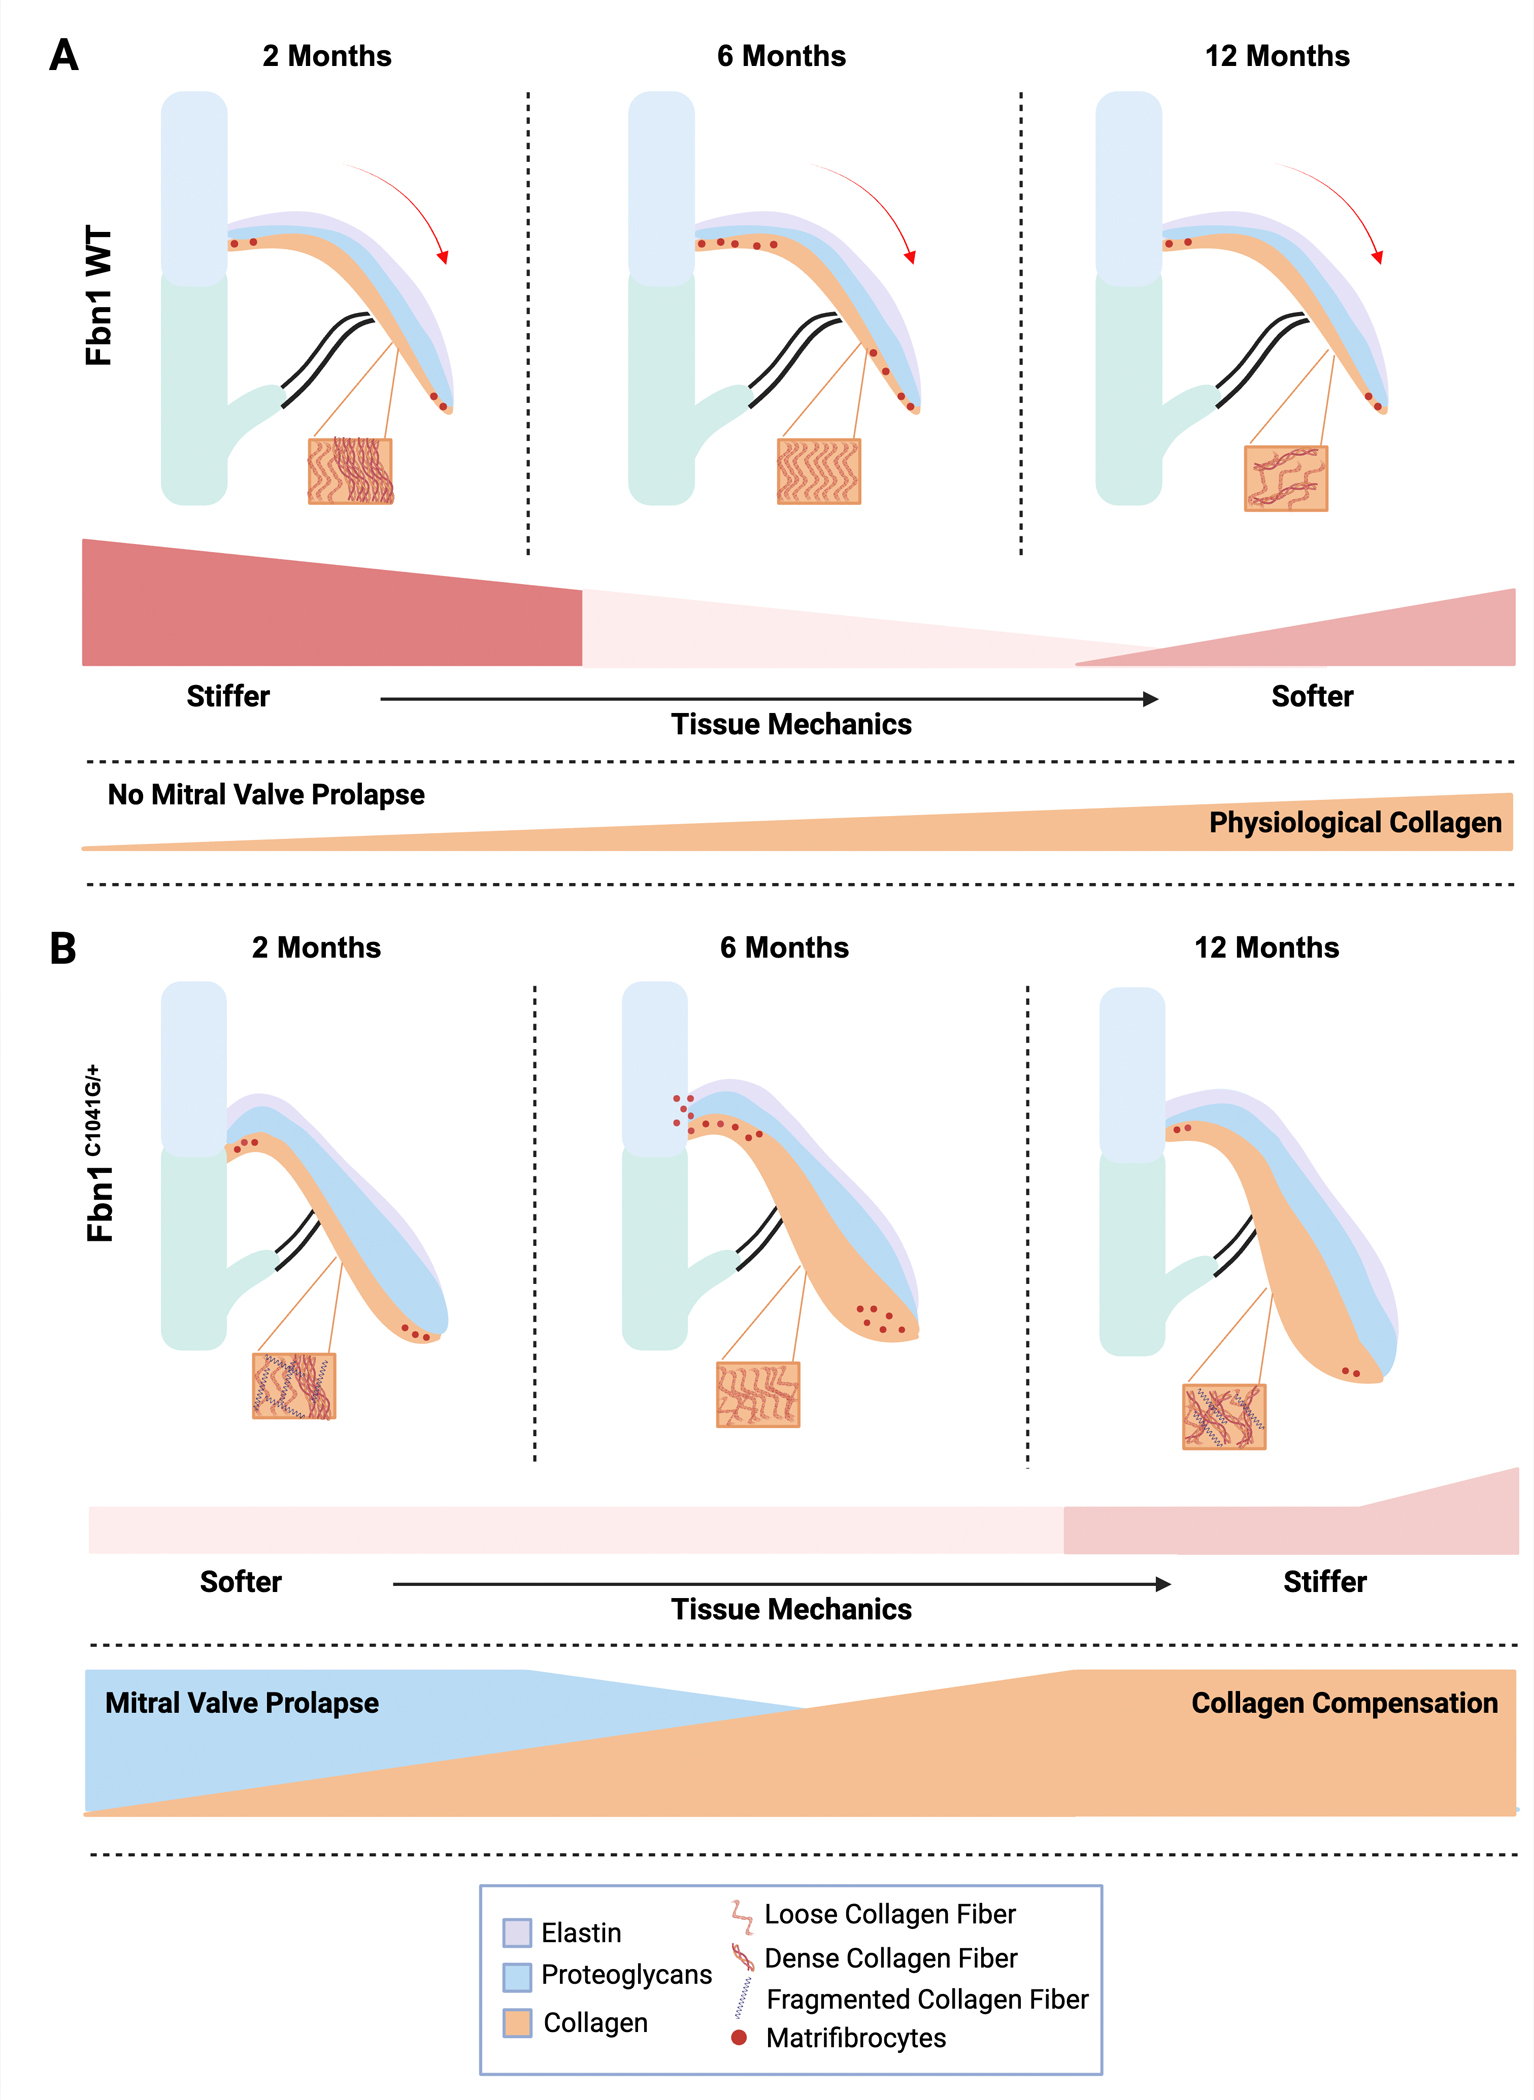
The extracellular matrix changes in (A) Fbn1 WT (WT) and (B) Fbn1C1041G/+ MFS mice are apparent by 2 months, when mitral valve thickening and increased proteoglycans (blue) are observed. (A) Demonstrates the normal extracellular remodeling and aging process, while (B) shows the defective extracellular matrix remodeling and abnormal aging in Fbn1C1041G/+ MFS mice. Major findings include increases in proteoglycans and MVP at 2 months, followed by collagen compensation, and matrifibrocyte gene expression, with a decrease in overall stiffness of the mitral valve leaflets at 6 and 12 months. Indicators of matrifibrocytes (red dots) are increased at 6 months, when collagen fiber structural abnormalities also occur. This figure was created with BioRender.com.
In the Fbn1C1041G/+ mice, we observed significant mitral valve functional changes and leaflet elongation by echocardiography, at 2.5 months-of-age. This valve leaflet deformation at 2 months could be attributed to a more “floppy” valve as indicated by the relatively increased proteoglycan:collagen ratio that resolves at later stages. This in turn affects the E/A ratio, or the left ventricular function overall at 2- and 6-months. It is possible that the mitral E/A ratio is improved at 12 months despite the continuation of the structural remodeling, due to the decrease in the A wave velocity and possibly the collagen compensation that occurs, with an increase in collagen seen at later stages of 6- and 12-months. A previous study of heart and aorta function of Fbn1C1041G/+ mice at 6- and 12-months (n=8) demonstrated similar mitral inflow velocities (mitral E wave), but previously reported mitral valve A wave and mitral E/A ratio were different from our findings, possibly due to our larger sample size (n=28–32) [16]. Other mouse models of myxomatous valve disease including Axin2 knockout and osteogenesis imperfecta (OIM) murine models [24, 25] demonstrate valve leaflet thickening and relatively increased proteoglycan composition beginning at 4–6 months-of-age. An increase in glycosaminoglycans GAGs and cardiac dysfunction, at 12 months was found in OIM aortic valves [26]. However, a relative increase in collagen was not seen, potentially supporting the observation that an increased proteoglycan:collagen ratio correlates with mitral valve prolapse as we observed in the Fbn1C1041G/+ model at 2 months, but not 6–12 months. This suggests that some properties of the structure-function alterations are conserved within models, such as GAG content increase, while others are specific to the animal model used, such as collagen content and valvular function overall. Interestingly, in the MFS mice mitral valve dysfunction is prevalent at 2 months with a decrease in cardiac function at 6 months followed by a preserved cardiac function at 12 months between WT and MFS, supporting a resolution of mitral valve function, potentially through an intrinsic reparative process with aging.
Progressive changes in aortic root structure and function, along with sex differences occur in MFS mice. We show significant changes at the sinotubular junction, as well as the aortic root and ascending aorta that increase with age, similar to human MFS in clinical studies [6, 8, 9]. Interestingly, the aortic dysfunction is progressive with increasing dilation and stenosis at 6 months suggesting a fundamental difference in the aortic versus mitral disease mechanisms. The reason for these temporal differences between the mitral valve and aorta changes are not known, but it could be due to the valves going through developmental ECM remodeling with infiltration of immune cells in abnormally remodeled valves beginning at 2 months-of-age in the MFS mice [10]. In contrast, we previously reported that aortic aneurysm progression and elastin fiber fragmentation does not involve immune cell infiltration and occurs relatively later at 4 months of age [10], possibly a factor contributing to the temporal changes we observed. While we observed prevalence of aortic dilatation in male MFS mice as previously reported [11], we did not detect any sex differences in mitral valve parameters. Together, these observations support distinct pathologic mechanisms, including sex differences, and potential therapeutic targets for MVD and aortic aneurism in MFS.
The mechanics of the mitral valve at a tissue level relate to ECM structural abnormalities and valve dysfunction. Our findings demonstrate that the MFS MVs remain compliant, with little change in the stiffness occurring over time from 2 to 12 months, while the WT mice have an increase in stiffness from 2 to 12 months of age. Likewise, a previous study demonstrated that the mechanics of the mitral valve of MFS mice at 4 months based on uniaxial stretch demonstrated a more compliant MV (significantly lower stiffness) [27]. While the tissue mechanics of MFS MVs are notably constant, healthy mouse MVs increase in stiffness similar to aortic valves over time from 2- to 17- months of age [28]. This increased stiffness in normal aging valves coincides with relatively increased collagen fibers that likely are important in the long term function and durability of heart valves [29]. In MFS mice, initial ECM remodeling in the postnatal period is abnormal, as indicated by increased proteoglycan:collagen ratios at 2.5 months, that resolve with relatively increased collagen content at 6–12 months. Similar ECM disturbances have been shown in the aortic valve as well, where GAGs increase around 2 months of age and collagen increases gradually from 2–12 months of age in MFS mice [10]. It has been previously shown that cyclic stretch increases both the collagen and proteoglycan content in the valves [29]. Thus, the age-dependent ECM alterations in MFS MVs may be related to the abnormalities in mechanical stretch that the thickened myxomatous mitral valve leaflets are subjected to over time. Moreover, improved methods for mechanical testing of valve tissue will be important in the future for determining the relationships between mechanics at the tissue level to heart valve structure and function.
Here, we show that collagen gene expression and fiber composition increased in aging MFS MVs [12, 13]. Moreover, collagen fiber orientation and structure are abnormal at all timepoints in MFS mice, suggesting that the quality as well as the quantity of collagen is important. Similarly, in the context of cardiac fibrosis, defective or deficient type I collagen leads to an overall increase in fibrillar collagen with reduced structural integrity and abnormal overall fibrotic ECM deposition [30]. In OIM mice homozygous for a dysfunctional collagen 1a2 allele, collagen fibers that form as collagen 1a1 homotrimers are substantially weaker [31, 32]. Thus, the type, structure, and orientation of fibrillar collagen is critical for the mechanics of the valve and if abnormal can lead to a compensatory response of increased defective collagen deposition. Our data also support a potential collagen fibrotic response as indicated by increased expression of matrifibrocyte [22] genes, including Chad, Fmod, and Cilp2, that are linked to collagen fiber assembly and maturation [33]. These matrifibrocytes may contribute to increased collagen fiber formation to compensate for increased proteoglycans and valve dysfunction seen at 2 months-of-age in the MFS mitral valves.
In human myxomatous MVs there is an increase in the production of collagen and glycosaminoglycan [34], but the pathogenic and potential reparative ECM responses have not been examined over time. Moreover, human myxomatous valves have been reported to have fractured and disorganized elastin and collagen fibers in the fibrosa [35]. Mechanical testing of human myxomatous mitral valve tissue obtained after replacement demonstrated increased extensibility and reduced stiffness compared to normal human leaflets, although the Marfan syndrome patients were excluded from the studies [36]. These mechanical and ECM findings are similar to what we observe in MFS mice with relatively increased proteoglycan:collagen ratios at 2 months. More recently, MV specimens from patients with myxomatous degeneration due to a variety of causes, were found to have myofibroblast-like phenotype with increase expression of α-SMA, SMemb and MMP-13 [37]. Likewise in mouse MFS mitral valves, myxomatous ECM changes are followed by an increase in collagen and matrifibrocytes, along with improvement in function, supporting a compensatory intrinsic reparative process. These observations support a potential intrinsic fibrotic-like repair process in MVD, but additional studies are needed to determine the valvular cell populations involved and if this is a feature of human congenital heart valve disease progression.
Experimental Procedures
Mouse Study Design
The in vivo study in mice was approved by the Institutional Animal Care and Use Committee (IACUC) at Cincinnati Children’s Research Foundation (IACUC2023–0048) and conformed to current NIH guidelines (Guide for the Care and Use of Laboratory Animals). The following mouse line was purchased from The Jackson Laboratory: Fbn1C1041G/+ (stock no. 012885) and maintained on a C57BL/6 background. Fbn1 wildtype (WT) and Fbn1C1041G/+ (MFS) mice were studied at 2.5 months (juvenile/young adult), 6 months (adult), and 12 months (aged adult), with some assessments at postnatal day (P)7 (newborn). All mice used in the study were sacrificed under isoflurane inhalation followed by cervical dislocation at the specific time point for each experiment. Both male and female mice were used for all analyses.
Echocardiography Assessments
Echocardiographic (ECHO) assessments using a Visual Sonics Vevo 3100 Imaging System (Toronto, Canada) were performed to evaluate heart and mitral valve dimensions and function of the mice at 2, 6 and 12 months of age (n=9–32 mice). The ECHOs were completed using the standard two-dimensional, cross-sectional, spectral, and color Doppler imaging techniques, which are routinely applied in humans, by experienced research sonographers[24, 38] (Cardiovascular Imaging Research Laboratory (CIRL) at Cincinnati Children’s Hospital Medical Center). The mice were anesthetized with 1% to 2% isoflurane and then topical hair remover was applied to reduce ultrasound attenuation. ECHOs were used to generate qualitative data on the function of the valves (regurgitation, stenosis), as well as quantitative mitral valve data, including the E and A waves (pulse width Doppler mode), leaflet lengths, and annulus diameter (B-Mode). Furthermore, the aortic parameters were assessed at three distinct locations, the aortic root, sinotubular junction, and ascending aorta (B-Mode). Other parameters calculated include left atrium depth (PSLAX M-Mode), isovolumetric relaxation time (pulse width Doppler mode), percent fraction shortening (PSLAX M-Mode), and left ventricular mass (PSLAX M-Mode). All images were stored in the ultrasound system hard drive and analyzed by two CIRL research sonographers. All measurements were obtained in triplicate and averaged. The mice were either immediately sacrificed for histological analysis or housed and monitored to assess at later time points.
Mechanical Properties of Mouse Mitral Valve Leaflets
Isolated hearts were placed in cold PBS after sacrifice, and MVs were micro-dissected. Mitral valve posterior leaflets were isolated (at 2.5, 6, and 12 months), the leaflet lengths and widths were measured, and placed in between two T-clips (Aurora Scientific), one on each side of the lateral leaflet. The prepared leaflets were then placed onto the Permeabilized Fiber System (Model 1410A, Aurora Scientific, Ontario, Canada), which was adapted for uniaxial mechanical testing of murine mitral valve leaflets. The samples were uniaxially stretched sequentially by 20% (until reaching maximum possible load of the equipment). Each mitral valve leaflet was tested 3–5 times and a force versus distance curve was produced for each run on the real-time muscle data acquisition and analysis system (ASI 600A digital controller, Aurora Scientific, Ontario, Canada). These datasets were then computed for stress, strain, and the elastic Young’s modulus (E) [39]. An average E was determined per animal based on each run (n=3–5 times/leaflet). An overall averaged E was then reported per group per time point. Stress-strain curves were plotted via a MATLAB code using interpolation of the maximum strain value of each sample over a span of 100 points. Since valve tissue has anisotropic behavior, where the mechanics are different on the valve depending on the orientation of the sample, all leaflets were tested in the direction of collagen alignment, or longitudinally (circumferential), due to size constraints of the apparatus.
Tissue Collection, Histochemical Assays
All mice were sacrificed using inhaled isoflurane (4–5%), followed by cervical dislocation and thoracotomy. Blood was drained from isolated hearts by injecting cold 1X PBS at the base of the left ventricle and then the heart and body weights were recorded. The apex was then resected and fixed in 4% paraformaldehyde (PFA) overnight at 4°C, dehydrated through a graded ethanol series, cleared in xylene and embedded in paraffin. The hearts were sectioned at 5μm (P7) or 7μm (2.5, 6 and 12 months) using a Leica RM2235 microtome.
For all histochemical and immunohistochemistry analyses, slides (2–4 slides per animal with 4–5 sections/slide) were baked for 1 hour at 60°C, cleared in xylene and rehydrated in a gradient of ethanol series. For extracellular matrix (ECM) assessment of the mitral valves (MVs) (n=3–8 mice), sections were stained with Russell-Movat Pentachrome kit according to the manufacturer’s protocol (StatLab Medical Products, American MasterTech, Ref# KTRMPPT). All Pentachrome stained images were captured at 10x and 20x using a brightfield Olympus BX51 microscope retro-fitted with the Nikon DS-Ri1 camera and DS-U3 controller, and the NIS-Elements BR (version 3.2) software. Picrosirius Red staining was used to determine the collagen content in the MVs according to the manufacture’s protocol (Abcam; catalog # ab150681). Images were taken with an Olympus BX60 microscope retro-fitted with the Nikon DS-Fi3 camera, for determination of bifringence of the collagen to reflect the different collagen types (collagen I vs III) in the MVs at 10x and 20x.
Multiphoton Microscopy
For second harmonic generation (SHG) analyses, slides (n=3/group/timepoint) with heart tissue slides (1 slide per animal with 4–5 sections/slide) were baked for 1 hour at 60°C, cleared in xylene and rehydrated in a gradient of ethanol series and then cover slipped with mounting media (VECTASHIELD, Vector Laboratories, Cat. # EW-93952–27) for imaging. To determine the collagen fiber bundle structure at a higher resolution, images were taken with a Nikon, FN1 Upright MP Multiphoton Confocal Microscope with SHG signal in red for collagen. All images were taken at the Bio-Imaging and Analysis Facility at Cincinnati Children’s Hospital Medical Center with an Olympus 60x oil immersion objective lens. All images were then processed on NIS-Elements (version 3.2) software with the 2D deconvolution tool to improve the image quality and resolution.
RNAscope in situ hybridization
All RNA in situ hybridization analyses were performed using an RNA in situ hybridization (ISH) assay (ACD, RNAscope® Multiplex Fluorescent Reagent Kit v2, Cat. # 323100) based on the manufacturer’s directions (RNAscope® Multiplex Fluorescent Reagent Kit v2 User Manual). In brief, after baking, clearing, and rehydrating the slides as above, sections were outlined with a hydrophobic barrier pen and treated with RNAscope Hydrogen Peroxide for 10 minutes. Thereafter, the slides were placed in the heated RNAscope Antigen Retrieval buffer for 15 minutes at 98–100°C. Sections were then treated with RNAscope Protease Plus for 30 minutes at 40°C, while each probe solution was prepared 1:50 (C2;C3 probe:C1 probe; Mm-Angptl7 cat no. 552821, Mm-Chad-C2 cat no. 484881-C2, Mm-Col1a1-C3 cat no. 319371-C3; Advanced Cell Diagnostics; Inc) and heated at 40°C for 10 minutes before usage. This probe solution was then added to each section and incubated for 2 hours at 40°C; the slides were washed in RNAscope Wash Buffer and stored in 5x Sodium Chloride-Sodium Citrate Buffer (SCC) overnight at room temperature. Each probe signal was increased, as described previously[40], where each channel was assigned either TSA Plus Fluorescein (Perkin Elmer, NEL741001KT), TSA Plus Cyanine 3 (Perkin Elmer, NEL744001KT), or TSA Plus Cyanine 5 (Perkin Elmer, NEL745001KT) at a 1:1000 dilution. The nuclei were then counterstained with DAPI (1:10,000) (4’, 6- Diamidino- 2-Phenylindole; Life Technologies) for 20 minutes at room temperature and covered with VECTASHIELD® HardSet™ Antifade Mounting Medium (Vector Laboratories, H-1400). RNA ISH images were captured using a Nikon A1-R confocal system with NIS-Elements D 3.2 software at 20x and 60x.
Quantification of Histochemical Analysis and RNA in situ hybridization
To quantify the histochemical and RNA in situ hybridization images, in-house MATLAB (version: 9.13. 0 (R2022b), Natick, Massachusetts: The MathWorks Inc., 2022) codes were created. For Movat’s Pentachrome stained sections, ECM components of collagen (orange/yellow) and proteoglycans (blue) were quantified using a code that segmented these colors. Each pixel is separated into its color and the total color pixels of each color are calculated per image used. For the Picrosirius Red and RNA scope in situ hybridization, a code was created using the Color Thresholder module in MATLAB to generate a mask function based on the images and the pixels that were counted based on the color pixels in the masked image. Orange/yellow and green masks were created for collagen I and collagen III, respectively, for Picrosirius Red staining, while red masks were created for the probe of interest in RNA scope in situ hybridization (Mm-Chad-C2 cat no. 484881-C2). The area of the leaflet tips for assessment of Chad pixels/area (μm2) was manually traced in ImageJ FIJI (Version: 2.9.0/1.53t) and the average area per section was calculated.
RNA Isolation and Real-Time Quantitative PCR
MVs (excluding chordae tendineae) of mice at 2, 6 and 12 months of age were micro-dissected, flash-frozen in liquid nitrogen, and individually stored at −80°C until RNA extraction. Mitral valve tissue from a single mouse was one biological replicate. Total RNA was then extracted from each mitral valve using the RNeasy Plus Micro Kit (Qiagen, Cat. # 74034) following the manufacturer’s instructions. Reverse transcription was performed using the SuperScriptIII First-Strand Synthesis Super Mix (ThermoFisher Scientific, Cat. # 11–752-050). Quantitative real-time PCR analyses were performed using PowerSYBR Green PCR Master Mix (ThermoFisher Scientific, Cat # 4368702) with the following primers (Table 1). Fold changes in gene expression were calculated using the ΔΔCT method normalized to 18S ribosomal RNA.
Table 1:
List of forward and reverse primer sets used for real-time quantitative PCR in mice.
| Primer Name | Sequences |
|---|---|
| Col1a1 | 5'-GCT CCT CTT AGG GGC CAC T-3' |
| 3'-CCA CGT CTC ACC ATT GGG G-5' | |
| Col3 | 5'-CCT GGC TCA AAT GGC TCA C-3' |
| 3'-GAC CTC GTG TTC CGG GTA T-5' | |
| Chad | 5'-CCT GAA GCA GCT TAT CTA CCT GT-3' |
| 3'-GGC AGT TCC GAC ACT TTG TTG-5' | |
| Fmod | 5'-AGC AGT CCA CCT ACT ACG ACC-3' |
| 3'-CAG TCG CAT TCT TGG GGA CA-5' | |
| Cilp2 | 5'-TTT TGG TGT CTC AAT CGT GAG C-3' |
| 3'-GAC CTA GCC CGC AAC TCT TG-5' | |
| 18S (ribosomal RNA) | 5'-TT CTC GAT TCC GTG GGT GG-3' |
| 3'-TCA ATC TCG GGT GGC TGA AC-5' |
Statistics
Unpaired nonparametric Mann-Whitney U-tests were used to determine the significance using PRISM9 software package (GraphPad Prism (Version 9.3.1)). For comparisons made between Fbn1 WT and Fbn1C1041G/+ mice across different time points, a two-way ANOVA was utilized. ECHO data were analyzed for males and females separately to determine sex differences. Data are reported as mean ± SEM (standard error of mean). A p-value < 0.05 was considered statistically significant.
Supplementary Material
Highlights:
Mitral valve function is decreased at 2 and 6, but not 12, months-of-age in MFS mice
Adult MFS mice have decreased mitral valve stiffness, with an initial increase in proteoglycan content, compared to controls
Collagen fiber structure and orientation are abnormal in aging MFS mice, accompanying the decrease in stiffness
Matrifibrocyte marker gene expression is upregulated with altered mitral valve mechanics and function in aging MFS mice
Acknowledgements:
We acknowledge J. Matthew Kofron and the Bio-Imaging and Analysis Facility at Cincinnati Children’s Hospital Medical Center for training and usage of the Multi-photon Confocal Microscope (Nikon, FN1 Upright MP). We also thank sonographers Victoria Moore and Chrissy Schulte from Cardiovascular Imaging Research Laboratory (CIRL) at Cincinnati Children’s Hospital Medical Center. The graphical abstract, parts of Figure 2 and Figure 8 were created with BioRender.com.
Sources of Funding:
This work was funded by the National Institutes of Health (NIH) Heart, Lung and Blood Institute (NHLBI) 5T32 HL125204 and 1F32HL168787-01 (B.A.G) and R01HL143881 and R01HL156270 (K.E.Y) as well as the American Heart Association (AHA) 23POST101913 (B.A.G).
Footnotes
Disclosures: None.
Data Availability:
Please contact the authors to obtain the in-house MATLAB codes used for data processing.
References
- 1.Hinton RB Jr., et al. , Extracellular matrix remodeling and organization in developing and diseased aortic valves. Circ Res, 2006. 98(11): p. 1431–8. [DOI] [PubMed] [Google Scholar]
- 2.Levine RA, et al. , Mitral valve disease--morphology and mechanisms. Nat Rev Cardiol, 2015. 12(12): p. 689–710. [DOI] [PMC free article] [PubMed] [Google Scholar]
- 3.Nishimura RA, Vahanian A, Eleid MF, and Mack MJ, Mitral valve disease--current management and future challenges. Lancet, 2016. 387(10025): p. 1324–34. [DOI] [PubMed] [Google Scholar]
- 4.Ramirez F, Caescu C, Wondimu E, and Galatioto J, Marfan syndrome; A connective tissue disease at the crossroads of mechanotransduction, TGFβ signaling and cell stemness. Matrix Biol, 2018. 71–72: p. 82–89. [DOI] [PMC free article] [PubMed] [Google Scholar]
- 5.Milewicz DM, et al. , Marfan syndrome. Nat Rev Dis Primers, 2021. 7(1): p. 64. [DOI] [PMC free article] [PubMed] [Google Scholar]
- 6.Kodigepalli KM, et al. , Biology and Biomechanics of the Heart Valve Extracellular Matrix. J Cardiovasc Dev Dis, 2020. 7(4). [DOI] [PMC free article] [PubMed] [Google Scholar]
- 7.Habashi JP, et al. , Losartan, an AT1 antagonist, prevents aortic aneurysm in a mouse model of Marfan syndrome. Science, 2006. 312(5770): p. 117–121. [DOI] [PMC free article] [PubMed] [Google Scholar]
- 8.Ng CM, et al. , TGF-beta-dependent pathogenesis of mitral valve prolapse in a mouse model of Marfan syndrome. J Clin Invest, 2004. 114(11): p. 1586–92. [DOI] [PMC free article] [PubMed] [Google Scholar]
- 9.Judge DP, et al. , Evidence for a critical contribution of haploinsufficiency in the complex pathogenesis of Marfan syndrome. J Clin Invest, 2004. 114(2): p. 172–81. [DOI] [PMC free article] [PubMed] [Google Scholar]
- 10.Kim AJ, et al. , Deficiency of Circulating Monocytes Ameliorates the Progression of Myxomatous Valve Degeneration in Marfan Syndrome. Circulation, 2020. 141(2): p. 132–146. [DOI] [PMC free article] [PubMed] [Google Scholar]
- 11.Weiss D, et al. , Effects of Age, Sex, and Extracellular Matrix Integrity on Aortic Dilatation and Rupture in a Mouse Model of Marfan Syndrome. Arterioscler Thromb Vasc Biol, 2023. 43(9): p. e358–e372. [DOI] [PMC free article] [PubMed] [Google Scholar]
- 12.Chih-Chieh Yu Y-NS, Lin Jiunn-Lee, Lai Ling-Ping, Marfan Syndrome—An Echocardiographer’s Perspective. Journal of Medical Ultrasound, 2011. 19(1): p. 1–6. [Google Scholar]
- 13.Rajamannan NM, Myxomatous mitral valve disease bench to bedside: LDL-density-pressure regulates Lrp5. Expert Rev Cardiovasc Ther, 2014. 12(3): p. 383–92. [DOI] [PMC free article] [PubMed] [Google Scholar]
- 14.He Y, et al. , Echocardiographic determination of the prevalence of primary myxomatous degeneration of the cardiac valves. J Am Soc Echocardiogr, 2011. 24(4): p. 399–404. [DOI] [PubMed] [Google Scholar]
- 15.Brandt Dr. Roland R.; Nishimura Prof. Rick A., Understanding the role of echocardiography in mitral valve disease: what is the added value of exercise and drugs on the various echocardiographic parameters? European Society of Cardiology, 2018. 16. [Google Scholar]
- 16.Lee L, et al. , Aortic and Cardiac Structure and Function Using High-Resolution Echocardiography and Optical Coherence Tomography in a Mouse Model of Marfan Syndrome. PLoS One, 2016. 11(11): p. e0164778. [DOI] [PMC free article] [PubMed] [Google Scholar]
- 17.Coelho SG and Almeida AG, Marfan syndrome revisited: From genetics to the clinic. Rev Port Cardiol (Engl Ed), 2020. 39(4): p. 215–226. [DOI] [PubMed] [Google Scholar]
- 18.Tae HJ, et al. , Cardiac remodeling in the mouse model of Marfan syndrome develops into two distinctive phenotypes. Am J Physiol Heart Circ Physiol, 2016. 310(2): p. H290–9. [DOI] [PMC free article] [PubMed] [Google Scholar]
- 19.Zilberberg L, et al. , Genetic analysis of the contribution of LTBP-3 to thoracic aneurysm in Marfan syndrome. Proc Natl Acad Sci U S A, 2015. 112(45): p. 14012–7. [DOI] [PMC free article] [PubMed] [Google Scholar]
- 20.Pedroza AJ, et al. , Single-Cell Transcriptomic Profiling of Vascular Smooth Muscle Cell Phenotype Modulation in Marfan Syndrome Aortic Aneurysm. Arterioscler Thromb Vasc Biol, 2020. 40(9): p. 2195–2211. [DOI] [PMC free article] [PubMed] [Google Scholar]
- 21.Eriksen HA, et al. , Type I and type III collagen synthesis and composition in the valve matrix in aortic valve stenosis. Atherosclerosis, 2006. 189(1): p. 91–8. [DOI] [PubMed] [Google Scholar]
- 22.Hulin A, et al. , Maturation of heart valve cell populations during postnatal remodeling. Development, 2019. 146(12). [DOI] [PMC free article] [PubMed] [Google Scholar]
- 23.Fu X, et al. , Specialized fibroblast differentiated states underlie scar formation in the infarcted mouse heart. J Clin Invest, 2018. 128(5): p. 2127–2143. [DOI] [PMC free article] [PubMed] [Google Scholar]
- 24.Hulin A, Moore V, James JM, and Yutzey KE, Loss of Axin2 results in impaired heart valve maturation and subsequent myxomatous valve disease. Cardiovasc Res, 2017. 113(1): p. 40–51. [DOI] [PMC free article] [PubMed] [Google Scholar]
- 25.Cheek JD, et al. , Differential activation of valvulogenic, chondrogenic, and osteogenic pathways in mouse models of myxomatous and calcific aortic valve disease. Journal of molecular and cellular cardiology, 2012. 52(3): p. 689–700. [DOI] [PMC free article] [PubMed] [Google Scholar]
- 26.Thatcher K, et al. , Temporal Progression of Aortic Valve Pathogenesis in a Mouse Model of Osteogenesis Imperfecta. Journal of Cardiovascular Development and Disease, 2023. 10(8): p. 355. [DOI] [PMC free article] [PubMed] [Google Scholar]
- 27.Gould RA, et al. , Multi-scale biomechanical remodeling in aging and genetic mutant murine mitral valve leaflets: insights into Marfan syndrome. PLoS One, 2012. 7(9): p. e44639. [DOI] [PMC free article] [PubMed] [Google Scholar]
- 28.Sewell-Loftin MK, Brown CB, Baldwin HS, and Merryman WD, A novel technique for quantifying mouse heart valve leaflet stiffness with atomic force microscopy. J Heart Valve Dis, 2012. 21(4): p. 513–20. [PMC free article] [PubMed] [Google Scholar]
- 29.Ayoub S, et al. , Heart Valve Biomechanics and Underlying Mechanobiology. Compr Physiol, 2016. 6(4): p. 1743–1780. [DOI] [PMC free article] [PubMed] [Google Scholar]
- 30.Bowers SL, et al. , Col1a2-Deleted Mice Have Defective Type I Collagen and Secondary Reactive Cardiac Fibrosis with Altered Hypertrophic Dynamics. Cells, 2023. 12(17): p. 2174. [DOI] [PMC free article] [PubMed] [Google Scholar]
- 31.Chipman SD, et al. , Defective pro alpha 2 (I) collagen synthesis in a recessive mutation in mice: a model of human osteogenesis imperfecta. Proceedings of the National Academy of Sciences, 1993. 90(5): p. 1701–1705. [DOI] [PMC free article] [PubMed] [Google Scholar]
- 32.Sharma U, et al. , Structural basis of homo-and heterotrimerization of collagen I. Nature communications, 2017. 8(1): p. 14671. [DOI] [PMC free article] [PubMed] [Google Scholar]
- 33.Hortells L, Johansen AKZ, and Yutzey KE, Cardiac Fibroblasts and the Extracellular Matrix in Regenerative and Nonregenerative Hearts. J Cardiovasc Dev Dis, 2019. 6(3). [DOI] [PMC free article] [PubMed] [Google Scholar]
- 34.Cole WG, Chan D, Hickey AJ, and Wilcken DE, Collagen composition of normal and myxomatous human mitral heart valves. Biochem J, 1984. 219(2): p. 451–60. [DOI] [PMC free article] [PubMed] [Google Scholar]
- 35.Oyama MA, et al. , Comparative pathology of human and canine myxomatous mitral valve degeneration: 5HT and TGF-β mechanisms. Cardiovasc Pathol, 2020. 46: p. 107196. [DOI] [PMC free article] [PubMed] [Google Scholar]
- 36.Barber JE, et al. , Mechanical properties of myxomatous mitral valves. J Thorac Cardiovasc Surg, 2001. 122(5): p. 955–62. [DOI] [PubMed] [Google Scholar]
- 37.Hu C, et al. , The pathomechanism of human myxomatous valvular degeneration at the mechanical and cellular level. Rev Cardiovasc Med, 2021. 22(2): p. 513–519. [DOI] [PubMed] [Google Scholar]
- 38.Hinton RB Jr., et al. , Mouse heart valve structure and function: echocardiographic and morphometric analyses from the fetus through the aged adult. Am J Physiol Heart Circ Physiol, 2008. 294(6): p. H2480–8. [DOI] [PubMed] [Google Scholar]
- 39.Young’s modulus., in Encyclopedia Britannica, E.o. Encyclopaedia, Editor. 2023. [Google Scholar]
- 40.O’Donnell A, et al. , Localized Prox1 Regulates Aortic Valve Endothelial Cell Diversity and Extracellular Matrix Stratification in Mice. Arterioscler Thromb Vasc Biol, 2023. 43(8): p. 1478–1493. [DOI] [PMC free article] [PubMed] [Google Scholar]
Associated Data
This section collects any data citations, data availability statements, or supplementary materials included in this article.
Supplementary Materials
Data Availability Statement
Please contact the authors to obtain the in-house MATLAB codes used for data processing.