

Abstract
Background
The ability to predict older people’s functional independence has implications for the development and provision of services to improve individual sense of self and wellbeing.
Methods
Using linear regression analyses we identified predictors of independence, measured using the Nottingham Extended Activities of Daily Living (NEADL) scale, at 12 and 24-months from baseline. Data were obtained from 1277 community-dwelling people aged ≥ 75. Multivariable models included predictors that were selected through review of existing literature, perspectives of older people, and univariable analyses. Multiple imputation was used to account for missing data.
Results
Participants’ mean age was 84.61 years (SD 4.95) and just over half were female (n = 655, 51.29%). At baseline, participants had a mean NEADL score of 53.82 (SD 13.19). Younger age, fewer hours of informal help received, no registered visual impairment, lower frailty, living alone, higher cognitive function, greater physical function, absence of depression, and higher baseline NEADL were significant predictors of greater independence at 12-months. Younger age, higher baseline NEADL score, living alone, less frailty, higher cognitive function, alcohol consumption, greater physical function, and absence of depression predicted greater independence at 24-months.
Conclusion
Depression and frailty are important predictors of an older person’s independence with other variables such as activities of daily living, age, cognitive function, alcohol consumption, and living status also having an impact over a prolonged period. Refining understanding of the mechanisms within frailty and depression is likely to improve targeting of support and interventions, which will have a lasting impact on older people’s independence.
Supplementary Information
The online version contains supplementary material available at 10.1186/s12877-025-05927-4.
Keywords: Activities of daily living, Independence, Older people, Predictors, Community-dwelling
Introduction
Being functionally independent contributes to greater self-esteem, wellbeing and quality of life, especially in the context of older age, and may mediate the impact of ill-health and physical impairment [1–4]. Independence is therefore an important concept in society where healthy life expectancy has not kept pace with total life expectancy leading to a greater number of people living for longer in poorer health [5]. In health and social care, independence is a common treatment goal both because it is valuable to the individual, and because independent self-management of health conditions and instrumental activities of daily living can reduce the resources required from strained services [6–9]. Identifying predictors of independence can inform the optimal use of resources to help older people improve, achieve, and maintain control and agency in later life.
Existing work identifying predictors of independence mainly focus on return to independence following an adverse event, such as when recovering from an acute illness and engaging in a rehabilitation program [10, 11]. Predictors (such as age, gender, morbidity, and level of physical activity) have predominantly been selected based on clinical and academic models of independence without input from older people [12, 13]. Further, there has been much inconsistency in the breadth and type of covariates included in existing statistical analyses of the predictors of independence making it difficult to interpret the independent impact of a given predictor [12, 13]. As part of an integrated mixed methods project, the authors of this study utilise the findings of a preceding qualitative study [14] in which a cohort of community-dwelling older people were asked about what they believed were the most important predictors of independence.
Identifying predictors that could indicate a threat to independence before an adverse event has taken place could inform strategies for more preventative care. Predictors rarely impact an outcome without influence from confounding variables. At all ages, but especially in old age, multiple and complex factors intersect to impact a person’s lived experience. A broader range of predictors that are informed by older people’s perspectives on what is important for independence is required to better represent and understand the complexity of influences on independence for community-dwelling older people aged 75+.
The aim of this study was to identify predictors of independence over time. The main analysis identified predictors at 12 months from baseline and a secondary analysis identified predictors at24 months from baseline to explore their ability to predict change over a longer time period.
Methods
Study setting and participants
Data for this study were obtained from an existing longitudinal cohort study, the Community Ageing Research 75+ (CARE75+) cohort [15]. The cohort study design collects data on individuals at regular intervals over a period of 4 years, enabling the exploration of changes over time and the generation of information that may help to predict change. CARE75 + is an open and ongoing cohort study (Trial Registration Number: ISRCTN16588124). Physical, psychosocial and cognitive assessments are conducted with participants by trained research staff at baseline, 6, 12, 24 and 48 months. The data analysed and reported in this paper were collected between January 2015 and April 2021, from 7 sites across England by research staff from the CARE75 + cohort study. CARE75 + study design and data collection procedures are reported in detail elsewhere [15].
CARE75 + inclusion criteria stipulate that participants are aged 75 or over and community-dwelling [15]. People with terminal cancer, life expectancy of 3 months or less and people in receipt of palliative care are excluded. Care or residential-home residents are not eligible to enrol onto the CARE75 + study. However, if a participant moves into one of these facilities after being enrolled, follow-up assessments are continued where possible. When recruited for the CARE75 + cohort participants gave informed consent for their data to be analysed by approved researchers. Approval for this study was granted by the CARE75 + Data Request Review Committee (DRRC) [12] in March 2021.
Variables
The Nottingham Extended Activities of Daily Living (NEADL) scale was the primary outcome for this study [16]. NEADL scores were obtained from participants’ assessments conducted at baseline and at 12 and 24 month follow-up. The NEADL asks about the activities the respondent has completed within the last four weeks. These include 22 activities covering four dimensions: mobility [1–6], kitchen [7–11], domestic [12–16], and leisure [17–22]. The NEADL is used as an indication of independence [11, 17, 18] based on assessment of an individual’s ability to complete IADLs without help. Activities within each dimension are scored 0,1,2, or 3 for being unable, able with help, able alone but with difficulty, or able alone to perform an activity, respectively [10]. Scores for each activity are summed to give a total NEADL score between 0 and 66. Higher scores demonstrate greater independence [16].
The NEADL outcome measure was chosen for this study as it is used in current practice [19–21] and is interpreted as a direct measure of independence [16]. The measure has not been validated for use as a categorical variable; existing uses of the NEADL as a binary measure suggest that a score of ≤ 43 indicates dependence but lack evidence to support its use in this way [20, 22]. As a continuous variable the NEADL has good face validity and internal consistency (Cronbach’s alpha: 0.9) [10].
The pool of potential predictor variables comprised measures collected through CARE75 + baseline assessments. The selection of predictor variables from this pool was informed by a review of existing literature and an exploratory qualitative study [14] in which participants were asked about the most important facilitators of independence from their perspective. Selected variables were identified by the lead author and discussed with a second member of the research team with any disagreements on inclusion considered and resolved. The following variables were identified: sex [23–25], ethnicity [26] Age [21, 23–25, 27], Living Circumstances [14, 28], House Type [14, 27]; IMD (Index of Multiple Deprivation) [29]; Highest Qualification [23–24, 27]; number of family connections (children, grandchildren) [14, 24, 30–31]; Informal (unpaid) support [23]; recent use of care services [14]; equipment [32]; smoking status [12, 27]; alcohol consumption [12, 27]; sensory impairment [12, 27]; quality of life (SF-36) [25]; cognitive function (MoCA) [12, 25, 27]; comorbidity [12, 24]; extent of polypharmacy [12, 24, 33]; falls status [27]; grip strength [34]; frailty status [24, 29], depression [25, 27], resilience [14, 35], self-efficacy [36, 37] and baseline ability to complete instrumental (NEADL) [12] and basic (Barthel) activities of daily living [12]. A diagram illustrating the selection process is provided in Fig. 1. and further details are available in Appendix 1.
Fig. 1.
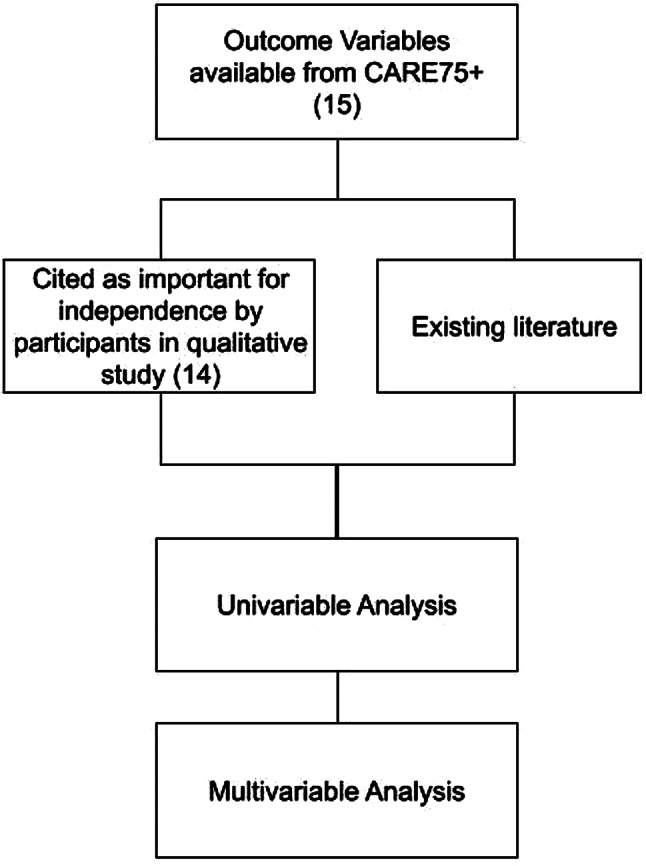
A diagram depicting the selection process for outcome variables
Statistical analysis
Baseline characteristics of participants were summarised using means and standard deviations (SDs) for continuous variables and numbers and percentages for categorical variables. To refine the selection of candidate predictor variables and reduce the potential for overfitting of the multivariable model, univariable models were run separately for each predictor variable against the outcome variable. In the univariable models a threshold p-value of < 0.1 was used to determine whether variables should be included in the multivariable model. This relatively high threshold value was used to reduce the risk of omitting important variables whose predictive value was masked by lack of controlling of covariates in univariable models [38]. We used a p-value of < 0.05 as the threshold to identify statistically significant predictors of independence in the multivariable model [39]. Estimated effects with 95% confidence intervals (CIs) and p-values are reported for the univariable and multivariable analyses.
We conducted multiple linear regression using Stata 17 [40] to assess the association between potential predictor variables and NEADL score (continuous measure) at 12 and 24 months from baseline.
Linear regression assumes the presence of homoskedasticity, or equal variance of observations, and independence of predictor variables. To avoid the risk of generating unreliable results due to their violation, visual checks (using residual versus continuous predictor plots and a residual versus fitted values plot) were used to confirm that the assumptions were warranted in this study [41].
Potential correlation between independent variables was examined using correlation statistics, to identify and prevent problematic changes in the value of the regression coefficient due to correlation between predictor variables. Symptoms of multi-collinearity were checked by inspecting correlation coefficients and Variance Inflation Factors (VIF). A correlation coefficient of 0.80 or higher is generally considered “too high”, but may not be sensitive enough and ultimately the decision is made by the researcher [42]. In this study, if the correlation coefficient between two potential predictors was greater than or equal to 0.70, then only one of the potential predictors would be included in the model. The decision on which predictor to keep was decided based on the researcher’s knowledge of the field and determination of which was most pertinent to the concept being studied within the model. VIF scores quantify the change in variance incurred by inclusion of the corresponding variable in the model [43]. Scores of > 10 indicate a potential multicollinearity problem and a need to exclude corresponding variables from this study.
Missing data
When large quantities of data are missing, complete case analysis is at increased risk of bias and reduced precision [44]. There is no established method for imputing missing values if individual items within the NEADL scale are missing and ad hoc solutions, such as ‘last observation carried forward’ or deletion methods are likely to incur bias [11, 45]. Multiple Imputation (MI) is an appropriate method for reducing this potential for bias and has been shown to improve the accuracy of results in similar studies [46]. MI using Predictive Mean Matching (PMM) with a k-nearest neighbour (knn) of 10 was used and 50 imputed datasets were generated [47]. PMM is an appropriate approach to MI when working with variables that are not normally distributed and when imputed values should not fall outside of the observed values, which is the case for our data [48]. Outcome variables at all time-points were included in the MI process, along with all of the potential predictor variables selected prior to refinement using univariable models. Variables with no missing data were included in the model as auxiliary variables to inform the imputation process [49].
Results
Sample characteristics
Data were obtained for all consenting participants in the CARE75 + study (N = 1277).
Table 1 shows the baseline characteristics for all 1277 participants and 674 complete cases. The mean age of participants was 84.61 years (SD 4.95). Just over half of the sample were female (n = 655, 51.29%) and most participants were from a White ethnic group (n = 1,198, 93.81%). Just over half of participants had no formal qualifications (n = 677, 53.01%) whilst 144 (11.28%) had a bachelor’s degree or higher. At baseline, participants had a mean NEADL score of 53.82 (SD 13.19).
Table 1.
Baseline characteristics of participants
| Baseline characteristic | Complete Cases N = 674 |
All Cases N = 1277 |
|
|---|---|---|---|
| Sex | Male, n (%) | 335 (49.70) | 622 (48.71) |
| Female, n (%) | 339 (50.30) | 655 (51.29) | |
| Missing, n (%) | 0 (0.00) | 0 (0.00) | |
| Age | Mean (SD) | 84.19 (4.55) | 84.61 (4.95) |
| Missing, n (%) | 0 (0.00) | 0 (0.00) | |
| Ethnicity | White, n (%) | 640 (94.96) | 1,198 (93.81) |
| Caribbean (Black or Mixed Black/White), n (%) | 4 (0.59) | 5 (0.39) | |
| Asian, n (%) | 30 (4.45) | 73 (5.72) | |
| Other, n (%) | 0 (0) | 1(0.08) | |
| Missing, n (%) | 0 (0.00) | 0 (0.00) | |
| Qualifications | GCSE, n (%) | 105 (15.58) | 190 (15.24) |
| HNC/HND, n (%) | 46 (6.82) | 89 (7.14) | |
| Diploma, n (%) | 57 (8.46) | 91 (7.30) | |
| AS and A Level, n (%) | 34 (5.04) | 56 (4.49) | |
| Bachelor’s degree, n (%) | 48 (7.12) | 100 (8.02) | |
| Postgraduate, n (%) | 20 (2.97) | 44 (3.53) | |
| No qualifications, n (%) | 364 (54.01) | 677 (54.29) | |
| Missing, n (%) | 0 (0.00) | 30 (2.35) | |
| House-Type | Semi-detached, n (%) | 192 (28.49) | 359 (28.13) |
| Bungalow, n (%) | 162 (24.04) | 303 (23.75) | |
| Detached house, n (%) | 154 (22.85) | 290 (22.73) | |
| Terraced house, n (%) | 96 (14.24) | 184 (14.42) | |
| Flat, n (%) | 51 (7.57) | 104 (8.15) | |
| Sheltered housing, n (%) | 17 (2.52) | 28 (2.19) | |
| Extra care housing, n (%) | 2 (0.30) | 8 (0.63) | |
| Missing, n (%) | 0 (0.00) | 1 (0.08) | |
| Living Circumstances | Living with partner/spouse, n (%) | 337(50.00) | 624 (49.02) |
| Living Alone, n (%) | 274 (40.65) | 507 (39.83) | |
| Living with Family, n (%) | 63 (9.35) | 142 (11.15) | |
| Missing, n (%) | 0 (0.00) | 4 (1.44) | |
| Frequency of alcoholic beverage in last year | 3–4 days a week or more, n (%) | 222 (32.94) | 383 (30.21) |
| 1–2 days a week, n (%) | 136 (20.18) | 254 (20.03) | |
| 1–2 times a month, n (%) | 60 (8.90) | 110 (8.68) | |
| Every other month or less, n (%) | 90 (13.35) | 168 (13.25) | |
| Not at all in the last 12 months, n (%) | 166 (24.63) | 353 (27.84) | |
| Missing, n (%) | 0 (0.00) | 9 (0.70) | |
| Current Smoker | Yes, n (%) | 36 (5.34) | 66 (5.19) |
| No, n (%) | 638 (94.66) | 1,205 (94.81) | |
| Missing, n (%) | 0 (0.00) | 6 (0.47) | |
| Difficulty hearing | No Difficulty, n (%) | 519 (77.00) | 904 (72.49) |
| Some difficulty, n (%) | 154 (22.85) | 340 (27.27) | |
| Unable to hear, n (%) | 1 (0.15) | 3 (0.24) | |
| Missing, n (%) | 0 (0.00) | 30 (2.35) | |
| Blind or Partially Sighted | Yes, n (%) | 16 (2.37) | 35 (2.89) |
| No, n (%) | 658 (97.63) | 1,177 (97.11) | |
| Missing, n (%) | 0 (0.00) | 65 (5.09) | |
| Total number of health conditions | Mean (SD) | 3.79 (2.30) | 3.87 (2.54) |
| Missing, n (%) | 0 (0.00) | 0 (0.00) | |
| Total number of prescribed medications | Mean (SD) | 6.05 (3.99) | 5.96 (4.16) |
| Missing, n (%) | 0 (0.00) | 0 (0.00) | |
| How many falls in last 12 months | Mean (SD) | 2.01 (2.52) | 0.62 (1.68) |
| Missing, n (%) | 0 (0.00) | 16 (1.25) | |
| Dominant Mean Grip Strength | Mean (SD) | 20.35 (9.49) | 20.04 (10.18) |
| Missing, n (%) | 0 (0.00) | 74 (5.79) | |
| Electronic Frailty Index | Mean (SD) | 0.21 (0.12) | 0.22 (0.12) |
| Missing, n (%) | 0 (0.00) | 171 | |
| MoCA | Mean (SD) | 24.97 (4.31) | 24.73 (4.43) |
| Missing, n (%) | 0 (0.00) | 72 (5.64) | |
| Barthel | Mean (SD) | 19.33 (1.51) | 19.10 (2.06) |
| Missing, n (%) | 0 (0.00) | 22 (13.39) | |
| Depression | Not depressed, n (%) | 592 (87.83) | 1,083 (86.16) |
| Depressed, n (%) | 82 (12.17) | 174 (13.84) | |
| Missing, n (%) | 0 (0.00) | 20 (1.57) | |
| Resilience | Mean (SD) | 3.84 (0.64) | 3.81(0.65) |
| Missing, n (%) | 0 (0.00) | 58 (4.54) | |
| General Self Efficacy | Mean (SD) | 3.31 (0.44) | 3.26 (0.49) |
| Missing, n (%) | 0 (0.00) | 29 (2.27) | |
| NEADL | Mean (SD) | 55.30 (11.09) | 53.82 (13.19) |
| Missing, n (%) | 0 (0.00) | 41 (3.21) |
SD = standard deviation; GCSE = General Certificate of Secondary Education; HND/C = Higher National Diploma/Certificate; NEADL = Nottingham Extended Activities of Daily Living
There were 674 complete cases (participants) within our dataset at 12 months follow-up. Through MI, data were generated for the missing data of 606 participants. Distributions of the observed (674 complete cases), and completed (1277 cases after MI) data were assessed graphically to check the fit of the imputation model [50].
Univariable models
The inclusion of predictors in the univariable models was predominantly based on what older people perceived to be important for their independence in an exploratory qualitative study [14]. The predictors: age, ethnicity, sex, and frailty, appeared to be taken for granted by participants in the qualitative study but were included as potential predictors of independence based on a review of existing literature [51]. The table in Appendix 1 provides a list of the selected variables and reasoning for their inclusion.
The estimated effects from separate univariable models and the main multivariable model, are shown in Table 2 for NEADL at 12 months from baseline. Table 3 shows the results from models fitted to NEADL at 24 months from baseline. Only three variables resulted in a p-value of ⋝0.1 in the univariable model and were therefore excluded from either the 12 or 24-month multivariable analyses or both. These were: the binary variable denoting whether a participant had received outpatient treatment in the last four weeks (excluded from both 12 (p = 0.221) and 24 (p = 0.473) month models), and the total number of people a participant could call on (excluded from the 12-month (p = 0.677) model but not the 24-month (p = 0.033) model). Smoking status was excluded from the 24-month (p = 0.303) but not the 12-month (p = 0.074) multivariable model. There was no indication that any of the identified variables should be excluded due to problematic levels of multi-collinearity.
Table 2.
Estimated effects of baseline predictor variables on NEADL score at 12 months
| Outcome Variable: NEADL at 12 months |
Univariable Analyses | Multivariable Analysis Adj. R-squared: 0.721 |
|||||
|---|---|---|---|---|---|---|---|
| Main Variable | Categories | Estimated effect | 95% CI | p-value | Estimated effect | 95% CI | p-value |
| Sex | Female | ref | 0.037 | ref | 0.864 | ||
| Male | 1.62 | 0.10 to 3.15 | -0.11 | -1.36 to 1.14 | |||
| Age | -0.98 | -1.13 to -0.83 | < 0.001 | -0.20 | -0.32 to -0.07 | 0.002 | |
| Ethnicity | |||||||
| White | ref | < 0.001 | ref | 0.053 | |||
| Black Caribbean and Mixed Black Caribbean/White | -11.71 | -22.67 to -0.75 | -1.96 | -8.32 to 4.41 | |||
| Asian | -22.89 | -25.94 to -19.83 | -4.09 | -6.93 to -1.26 | |||
| Other | -4.85 | -33.29 to 23.59 | 2.45 | -17.58 to 22.49 | |||
| House-Type | |||||||
| Semi-detached | ref | < 0.001 | ref | 0.174 | |||
| Bungalow | -0.54 | -2.66 to 1.58 | -0.51 | -1.80 to 0.79 | |||
| Detached house | 2.29 | 0.16 to 4.43 | -0.58 | -1.87 to 0.70 | |||
| Terraced house | -5.20 | -7.64 to -2.76 | 0.46 | -0.99 to 1.91 | |||
| Flat | -0.07 | -3.09 to 2.95 | 0.07 | -1.69 to 1.83 | |||
| Sheltered housing | -10.21 | -15.71 to -4.71 | -4.03 | -7.62 to -0.44 | |||
| Extra care housing | -12.46 | -21.99 to -2.94 | -2.98 | -8.43 to 2.47 | |||
| Living Circumstances | |||||||
| Living with partner/spouse | ref | < 0.001 | ref | 0.009 | |||
| Living Alone | -1.07 | -2.62 to 0.48 | 1.41 | 0.34 to 2.48 | |||
| Living with Family | -15.06 | -17.49 to -12.62 | -0.76 | -2.48 to 0.96 | |||
| Qualifications | |||||||
| No qualifications | ref | < 0.001 | ref | 0.851 | |||
| GCSE | 7.97 | 5.82 to 10.12 | 0.74 | -0.62 to 2.11 | |||
| HNC/HND | 7.46 | 4.50 to 10.43 | 0.78 | -1.03 to 2.58 | |||
| Diploma | 7.39 | 4.47 to 10.32 | 1.07 | -0.63 to 2.76 | |||
| AS and A Level | 7.48 | 3.86 to 11.11 | 0.13 | -2.00 to 2.26 | |||
| Bachelor’s Degree | 6.84 | 4.03 to 9.66 | 0.07 | -1.69 to 1.82 | |||
| Postgraduate | 6.26 | 2.11 to 10.41 | 0.20 | -2.30 to 2.70 | |||
| IMD | 1.48 | 1.21 to 1.75 | < 0.001 | 0.09 | -0.09 to 0.28 | 0.328 | |
| Total no. of children | -1.26 | -1.78 to -0.74 | < 0.001 | 0.02 | -0.42 to 0.45 | 0.943 | |
| Total no. of grandchildren | -0.28 | -0.53 to -0.04 | 0.022 | 0.07 | -0.13 to 0.27 | 0.512 | |
| Total Number of contacts to call on | 0.12 | -0.45 to 0.69 | 0.677 | ||||
| Hours of informal* support in the last 4 weeks | -0.12 | -0.13 to -0.10 | < 0.001 | -0.02 | -0.03 to -0.01 | 0.002 | |
| Hours of formal support in the last 4 weeks | -0.35 | -0.45 to -0.25 | < 0.001 | 0.05 | -0.02 to 0.12 | 0.162 | |
| GP visit in the last 4 weeks | No | ref | 0.005 | ref | 0.502 | ||
| Yes | -2.39 | -4.04 to -0.73 | 0.32 | -0.62 to 1.26 | |||
| Outpatient visit in the last 4 weeks | No | ref | 0.221 | ref | |||
| Yes | -1.18 | -3.06 to 0.71 | |||||
| Equipment** | -2.77 | -3.08 to -2.46 | < 0.001 | -0.06 | -0.35 to 0.23 | 0.674 | |
| Current Smoker | No | ref | 0.074 | ref | 0.112 | ||
| Yes | -3.25 | -6.82 to 0.32 | -1.78 | -3.98 to 0.42 | |||
| Alcohol Consumption over the last year | |||||||
| None | ref | < 0.001 | ref | 0.408 | |||
| ≥ 3–4 days a week | 10.65 | 8.73 to 12.56 | 1.14 | -0.16 to 2.44 | |||
| 1–2 days a week | 10.41 | 8.28 to 12.54 | 1.20 | -0.18 to 2.58 | |||
| 1–2 times a month | 8.90 | 6.05 to 11.75 | 0.52 | -1.26 to 2.31 | |||
| ≤ Once a month | 7.21 | 4.75 to 9.67 | 0.92 | -0.64 to 2.47 | |||
| Difficulty Hearing | |||||||
| No difficulty | ref | < 0.001 | ref | 0.982 | |||
| Some difficulty | -6.91 | -8.66 to -5.17 | 0.12 | -0.97 to 1.21 | |||
| Unable to hear | -7.94 | -27.52 to 11.65 | -0.55 | -15.16 to 14.06 | |||
| Registered Blind or Partially Sighted | No | ref | < 0.001 | ref | 0.009 | ||
| Yes | -15.33 | -20.25 to -10.42 | -4.05 | -7.08 to -1.02 | |||
| Total number of health conditions | -1.29 | -1.59 to -0.99 | < 0.001 | 0.03 | -0.19 to 0.25 | 0.800 | |
| Total number of prescribed medications | -0.74 | -0.93 to -0.56 | < 0.001 | 0.02 | -0.11 to 0.16 | 0.730 | |
| How many falls in last year | -1.10 | -1.56 to -0.65 | < 0.001 | 0.27 | -0.01 to 0.54 | 0.051 | |
| Dominant Mean Grip Strength | 0.48 | 0.41 to 0.55 | < 0.001 | 0.02 | -0.05 to 0.09 | 0.583 | |
| Electronic Frailty Index | -47.63 | -53.83 to -41.43 | < 0.001 | -9.57 | -15.21 to -3.93 | 0.001 | |
| MoCA | 1.62 | 1.47 to 1.76 | < 0.001 | 0.19 | 0.04 to 0.33 | 0.010 | |
| SF-36 MCS | 0.32 | 0.23 to 0.42 | < 0.001 | -0.02 | -0.09 to 0.05 | 0.607 | |
| SF-36 PCS | 0.61 | 0.55 to 0.67 | < 0.001 | 0.07 | 0.01 to 0.12 | 0.014 | |
| Barthel | 3.79 | 3.46 to 4.11 | < 0.001 | 0.61 | 0.26 to 0.96 | 0.001 | |
| Depression | Not depressed | ref | < 0.001 | ref | < 0.001 | ||
| Depressed | -16.75 | -18.86 to -14.64 | -3.17 | -4.87 to -1.48 | |||
| Resilience | 6.18 | 4.98 to 7.37 | < 0.001 | 0.16 | -0.74 to 1.07 | 0.721 | |
| General Self Efficacy | 9.41 | 7.89 to 10.92 | < 0.001 | 0.12 | -0.99 to 1.24 | 0.828 | |
| Baseline NEADL | 0.85 | 0.82 to 0.89 | < 0.001 | 0.54 | 0.47 to 0.60 | < 0.001 | |
ref = reference variable; CI = Confidence Interval; GCSE = General Certificate of Secondary Education; HND/C = Higher National Diploma/Certificate; NEADL = Nottingham Extended Activities of Daily Living; IMD = Index of Multiple Deprivation; MCS = Mental Component Scale; PCS = Physical Component Scale
*Informal support is defined as unpaid/voluntary support
**Equipment is determined by the number of pieces of equipment a person has in their home
Table 3.
Estimated effects of baseline predictor variables on NEADL score at 24 months
| Outcome Variable: NEADL at 24 months |
Univariable Analyses | Multivariable Analysis Adj. R-squared: 0.657 |
|||||
|---|---|---|---|---|---|---|---|
| Main Variable | Categories | Estimated effect | 95% CI | p-value | Estimated effect | 95% CI | p-value |
| Sex | Female | ref | 0.005 | ref | 0.753 | ||
| Male | 2.58 | 0.78 to 4.38 | 0.28 | -1.45 to 2.00 | |||
| Age | -1.15 | -1.32 to -0.97 | < 0.001 | -0.37 | -0.55 to -0.19 | < 0.001 | |
| Ethnicity | |||||||
| White | ref | < 0.001 | ref | 0.446 | |||
| Black Caribbean and Mixed Black Caribbean/White | -9.32 | -21.53 to 2.89 | -1.11 | -8.91 to 6.68 | |||
| Asian | -18.79 | -22.31 to -15.26 | 0.71 | -2.97 to 4.38 | |||
| Other | 9.08 | -18.17 to 36.34 | 14.86 | -2.53 to 32.24 | |||
| House-Type | |||||||
| Semi-detached | ref | < 0.001 | ref | 0.617 | |||
| Bungalow | -1.81 | -4.17 to 0.56 | -1.30 | -2.95 to 0.35 | |||
| Detached house | 1.99 | -0.39 to 4.38 | -0.73 | -2.42 o 0.95 | |||
| Terraced house | -5.06 | -7.88 to -2.25 | -0.47 | -2.48 to 1.54 | |||
| Flat | -2.07 | -5.55 to 1.40 | -1.25 | -3.71 to 1.21 | |||
| Sheltered housing | -8.99 | -15.32 to -2.67 | -1.85 | -6.36 to 2.67 | |||
| Extra care housing | -15.85 | -26.47 to -5.22 | -5.50 | -12.86 to 1.85 | |||
| Living Circumstances | |||||||
| Living with partner/spouse | ref | < 0.001 | ref | 0.028 | |||
| Living Alone | -1.87 | -3.73 to -0.02 | 1.98 | 0.46 to 3.49 | |||
| Living with Family | -13.26 | -16.07 to -10.46 | -0.003 | -2.49 to 2.48 | |||
| Qualifications | |||||||
| No qualifications | ref | < 0.001 | ref | 0.724 | |||
| GCSE | 7.77 | 5.35 to 10.19 | 0.42 | -1.35 to 2.18 | |||
| HNC/HND | 7.67 | 4.27 to 11.06 | 0.82 | -1.63 to 3.26 | |||
| Diploma | 6.88 | 3.54 to 10.23 | 1.00 | -1.36 to 3.36 | |||
| AS and A Level | 5.64 | 1.52 to 9.75 | -1.93 | -4.76 to 0.89 | |||
| Bachelor’s Degree | 6.71 | 3.45 to 9.96 | -0.38 | -2.74 to 1.99 | |||
| Postgraduate | 6.36 | 1.60 to 11.11 | 0.40 | -2.99 to 3.79 | |||
| IMD | 1.34 | 1.03 to 1.65 | < 0.001 | 0.09 | -0.16 to 0.33 | 0.482 | |
| Total no. of children | -0.86 | -1.48 to -0.23 | 0.007 | 0.37 | -0.28 to 1.01 | 0.261 | |
| Total no. of grandchildren | -0.25 | -0.53 to 0.04 | 0.090 | -0.01 | -0.28 to 0.26 | 0.931 | |
| Total Number of contacts to call on | 0.68 | 0.06 to 1.30 | 0.033 | 0.15 | -0.29 to 0.59 | 0.510 | |
| Hours of informal* support in the last 4 weeks | -0.11 | -0.13 to -0.09 | < 0.001 | -0.01 | -0.03 to < 0.01 | 0.080 | |
| Hours of formal support in the last 4 weeks | -0.36 | -0.47 to -0.24 | < 0.001 | 0.06 | -0.03 to 0.16 | 0.196 | |
| GP visit in the last 4 weeks | No | ref | 0.001 | ref | 0.444 | ||
| Yes | -3.43 | -5.39 to -1.48 | -0.54 | -1.92 to 0.85 | |||
| Outpatient visit in the last 4 weeks | No | ref | |||||
| Yes | -0.77 | -2.87 to 1.33 | 0.473 | ||||
| Equipment** | -3.10 | -3.47 to -2.73 | < 0.001 | -0.23 | -0.62 to 0.16 | 0.244 | |
| Current Smoker | No | ref | 0.303 | ||||
| Yes | -2.17 | -6.29 to 1.96 | |||||
| Alcohol Consumption over the last year | |||||||
| None | ref | < 0.001 | 0.002 | ||||
| ≥ 3–4 days a week | 11.21 | 9.01 to 13.41 | 2.21 | 0.49 to 3.94 | |||
| 1–2 days a week | 10.93 | 8.53 to 13.33 | 2.40 | 0.55 to 4.25 | |||
| 1–2 times a month | 11.70 | 8.52 to 14.87 | 4.20 | 1.89 to 6.52 | |||
| ≤ Once a month | 8.14 | 5.34 to 10.94 | 3.11 | 1.05 to 5.17 | |||
| Difficulty Hearing | |||||||
| No difficulty | ref | < 0.001 | ref | 0.170 | |||
| Some difficulty | -6.75 | -8.74 to -4.75 | 0.98 | -0.53 to 2.49 | |||
| Unable to hear | -18.77 | -39.49 to 1.96 | -11.12 | -27.83 to 5.58 | |||
| Registered Blind or Partially Sighted | No | ref | < 0.001 | ref | 0.135 | ||
| Yes | -15.26 | -20.75 to -9.77 | -2.90 | -6.71 to 0.91 | |||
| Total number of health conditions | -1.59 | -1.95 to -1.23 | < 0.001 | -0.18 | -0.51 to 0.15 | 0.274 | |
| Total number of prescribed medications | -0.81 | -1.03 to -0.60 | < 0.001 | 0.07 | -0.12 to 0.27 | 0.466 | |
| How many falls in last year | -1.53 | -2.03 to -1.02 | < 0.001 | -0.10 | -0.45 to 0.25 | 0.567 | |
| Dominant Mean Grip Strength | 0.54 | 0.45 to 0.62 | < 0.001 | 0.05 | -0.03 to 0.14 | 0.216 | |
| Electronic Frailty Index | -52.88 | -59.83 to -45.93 | < 0.001 | -9.09 | -17.16 to -1.03 | 0.027 | |
| MoCA | 1.65 | 1.48 to 1.82 | < 0.001 | 0.40 | 0.17 to 0.62 | 0.001 | |
| SF-36 MCS | 0.35 | 0.25 to 0.46 | < 0.001 | 0.00 | -0.09 to 0.10 | 0.965 | |
| SF-36 PCS | 0.66 | 0.60 to 0.73 | < 0.001 | 0.11 | 0.04 to 0.18 | 0.002 | |
| Barthel | 3.85 | 3.45 to 4.24 | < 0.001 | 0.65 | 0.16 to 1.14 | 0.010 | |
| Depression | Not depressed | ref | < 0.001 | ref | 0.003 | ||
| Depressed | -17.89 | -20.27 to -15.50 | -3.49 | -5.81 to -1.18 | |||
| Resilience | 6.62 | 5.30 to 7.93 | < 0.001 | 0.07 | -1.09 to 1.23 | 0.901 | |
| General Self Efficacy | 9.89 | 8.18 to 11.60 | < 0.001 | 0.51 | -0.98 to 2.00 | 0.501 | |
| Baseline NEADL | 0.83 | 0.78 to 0.88 | < 0.001 | 0.42 | 0.32 to 0.52 | < 0.001 | |
ref = reference variable; CI = Confidence Interval;; GCSE = General Certificate of Secondary Education; HND/C = Higher National Diploma/Certificate; NEADL = Nottingham Extended Activities of Daily Living; IMD = Index of Multiple Deprivation; MCS = Mental Component Scale; PCS = Physical Component Scale
*Informal support is defined as unpaid/voluntary support
**Equipment is determined by the number of pieces of equipment a person has in their home
Multivariable models
Predictors of NEADL at 12-months
In the multivariable model (see Table 2), being older, receiving higher levels of unpaid informal help, being registered blind or partially sighted, being frail and having depressive symptoms were associated (p-value < 0.05) with a lower NEADL score suggesting that participants with higher scores on these predictors at baseline would have lower independence at 12 months from baseline than those with lower baseline scores for these predictors. Living alone, having higher cognitive function (MoCA score), and greater physical function (SF-36 Physical Component Scale, Barthel index and baseline NEADL) were associated with higher independence at 12 months with p-value < 0.05.
Predictors at 24-months
In contrast to the results at 12-months, at 24-months (see Table 3), being registered as blind or partially sighted (p = 0.135), and level of informal support (p = 0.080) were not significant predictors of independence. Age, baseline NEADL score, living alone, frailty, cognitive function, physical function and depressive symptoms were significant, and the direction of prediction was the same as in the 12-month model. Alcohol consumption was a significant predictor of independence at 24-months but not at 12-months. Compared to not drinking alcohol at all, participants across all alcohol consumption groups were predicted to have higher independence at 24-months (p = 0.002).
Discussion
This study identified predictors of functional independence from a broad range of variables. The inclusion of older people’s views, in addition to reviewing the literature, to inform the inclusion of variables added a novel breadth to the research. This approach was augmented by the inclusion of models with NEADL as the outcome at 12- and 24-months post baseline, enabling exploration of variables’ stability as predictors over time. The relatively large number of variables with p-value < 0.1 in the univariable models demonstrates the wide range of influences on independence when it is measured by ability to perform activities of daily living. The breadth of variables contributed a key strength of this study as, by acting as covariates within the model, significant predictors were determined whilst accounting for the inherent complexity of independence.
The importance of frailty and depression in prediction of independence over time is consistent with existing literature. A systematic review by Kojima et al. demonstrated the relationship between frailty and disability, and a recent paper by Coventry et al. demonstrated, not only independent associations, but also a moderating relationship between depression and frailty on independence [52, 53]. Furthering the understanding provided in these, and other existing studies, this study demonstrates how the predictive value of frailty and depression persists when both extra-individual (e.g., medication use, social support, attendance at health services) and intra-individual (e.g., self-efficacy, resilience, perceived health) factors are accounted for [52, 54]. Notably, the results demonstrated that lower cognitive impairment predicted a significantly higher independence score independently of depression or frailty, a relationship that earlier studies suggested required further investigation [52].
Both depression and frailty encompass a multitude of symptoms and presentations, many of which overlap making it difficult to disentangle the unique mechanisms underpinning their impact on independence [55, 56]. Refining understanding of which dimensions of frailty and depression are most potent for the prediction of independence could increase the specificity of targeted interventions [55]. Shedding some light on the relationship between depression, frailty and their sub-dimensions we have shown that, though important to older people qualitatively, attributes such as resilience and self-efficacy were not significant predictors of independence when a wide range of covariates were accounted for in the multivariable model. The contrast between this finding and existing literature [57, 58] may indicate that resilience and self-efficacy impact independence only through their contribution to other predictors (e.g. depression) rather than independently. Another explanation for the difference in results of this study may be the efficacy of outcome measures used.
Our findings support the need for further work to focus on the specific dimensions of depression and frailty and the context in which they contribute to independence [55].
The estimated effects of assessments of basic (Barthel) and extended (baseline NEADL) functional abilities as well as physical components of quality of life were statistically significant but small. For every 1 point increase on these assessments at baseline an increase of independence of less than two points could be predicted at both 12-months and 24-months from baseline. Therefore, In comparison to the predictors depression (estimated effect:-3.17; CI: -4.87 to -1.48) and frailty (estimated effect: -9.57; CI: -15.21 to -3.93), baseline functional ability predicts relatively less change in functional ability over time than depression and frailty do. This result aligns with findings from studies showing that engagement in specific tasks or activities is determined by more than the physical capacity to do it. Psychosocial aspects, such as: the value attributed to a given task [59, 60], motivation [61] and confidence [62] to achieve it are all important contributors to function which would be hindered by the experience of depression. Assessments of functional ability are insensitive to individual efforts of adaptation [63]. Characterised by a reduced resistance to stress [64], increased frailty reduces the resources that a person has to make adaptation feasible which may explain the much starker predictions of decline associated with this variable. These results challenge the efficacy of interventions for independence and rehabilitation that focus on physical and functional aspects alone and support the need for more complex support that addresses the multi-faceted and inter-related predictors of frailty and mental health.
Living circumstances, determined by who a person lived with, were a significant predictor of independence in both analyses. Living alone predicted greater independence at 12- and 24-months compared with living with a spouse or family. The NEADL scale is scored based on what someone ‘does do’ rather than ‘can do’ on their own and without help [10]. Therefore regardless of a person’s ability, receiving help with a task is penalised in the scoring system [16]. Living with other people means that sources of help are more readily available whilst living alone places greater obligation on a person to complete tasks for themselves [65]. This may explain why participants who were categorised as ‘living alone’ had, on average, higher NEADL scores, demonstrating a greater semblance of independence.
Having no other option than to complete tasks themselves the difference in score for people living alone may reflect a decrease in deconditioning that can occur from lack of involvement in a given task [66]. However, although receiving help is presented as a deficit in the scoring system, it may be part of a reciprocal and mutually beneficial relationship of interdependence [67]. This may be preferable as it allows for the reservation of personal energy to be used for activities that hold greater value to the individual [1, 68].
Further, the benefit of social connection offered by an interdependent relationship may have other important health benefits such as reduced mortality and biological manifestations of ageing [30]. However, living circumstances may only be a crude indicator of social connection since it is not just the presence but the quality of a relationship that is important for health and wellbeing outcomes [24, 30, 31]. For example, someone living alone who regularly goes out to visit or share experiences with friends may in fact be more socially connected than someone whose only regular social contact is the spouse or family member they live with. The direction of the relationship between living circumstances and independence found in these results warrants further exploration to understand to what extent living alone impacts independence over and above the impact that a propensity for independence has on the determination of living circumstance. Further, the beneficial impact of living alone on independence identified in these results need to be evaluated in the wider social context in which living alone may have simultaneous negative impacts on wellbeing, loneliness and isolation [69].
The finding that alcohol consumption was a significant predictor of independence at 24-months but not at 12-months was unexpected and seems incongruent with the known impacts of alcohol consumption such as increased morbidity and falls [70].Whilst there is some evidence that characteristics associated with low-moderate drinkers may have protective effects for mortality [70, 71], there is little evidence of this association for more excessive patterns of drinking. The finding was not explained by participants’ responses in the preceding qualitative study. Further exploration of the interrelated relationships contributing to the impact of alcohol consumption over time warrants further exploration but was beyond the scope of this study.
Strengths and Limitations.
A key strength of this study was that we included a wide variety of variables that were important to older people as well as identified through existing literature. This reduced the risk of unreliability of the outcome due to unmeasured variables and generated novel understanding about the performance of predictors in the context of a wide range of covariates. A further strength of this study was the use of data from the CARE75 + cohort. Strategically designed to improve diversity and rate of recruitment the CARE75 + cohort provided access to high quality data from a large cohort of older people from varied urban and rural locations across the country [72, 73].
Missing data were accounted for using a method of MI selected based on its suitability to the data available. MI relies on estimation of missing results, which may not be as accurate as complete cases, but is a principled and robust method of accounting for missing data [50]. The risk that controlling for a wide range of variables had the potential to introduce bias into the results through over-fitting of the model was reduced by the large cohort sample and by ensuring that there were sufficient observations per predictor variable included in the model [74]. Despite work by the CARE75 + team to ensure a representative sample, the involvement of participants from ethnic groups that were not white was low and, as acknowledged, limited the conclusions that could be drawn from this aspect of the research [72].
There is a lack of robust evidence to justify what change in NEADL score would correspond with a clinically meaningful change for an individual older person [75]. In a study conducted with people affected by Parkinson’s, a change of 2.5 or more NEADL points was deemed to indicate a clinically meaningful difference in independence [76]. However, it is unclear how the value of 2.5 was determined and whether it would apply for older people not affected by Parkinson’s. This makes it difficult to draw conclusions about whether the changes seen are sufficient to have a meaningful impact for person-centred or clinical outcomes and highlights an area for future research. A change in NEADL of just 1–2 points, which could be the difference between relying on someone’s help to wash oneself and being able to complete this task alone [13] has the potential to make a meaningful difference to an individual.
The proportion of male to female participants in our sample differs from that of the general population. This may reflect the efficacy of Trial Within Cohort Studies [73] to be more inclusive in recruitment than traditional research studies. It is important that research findings are applicable to a broad range of the population experiencing the condition or phenomenon under study [77]. Although males represent a smaller proportion of the population of people aged 75+, they are also less likely to be involved in research than females of the same age [78] and therefore their perspectives and experiences tend to be under-represented in research. The high value placed on maintaining independence is evident for both males [79] and females [80] aged 75 + and therefore it is important that the predictors identified are likely to be relevant to both sexes.
This study relied on quantitative data collected within the CARE75 + cohort study. The use of secondary data had pragmatic and ethical benefits by reducing the researcher and participant burden that would have been incurred by additional data collection. However, a limitation of this approach was that the variables available did not always align with the purpose of this study. For example, for the variables ‘hours of informal/formal help received’ the type of support offered is not specified and may or may not include support with completion of I/ADLs.
Implications for Future Research, Practice or Policy.
The results of this study provide policy-makers and providers of evidence-based practice with important understanding of the conditions and characteristics that may make some older people more susceptible to changes in their functional independence. The negative impact of depression and frailty on function in daily activities suggests that policy and practice to promote independence should have a focus on improving mental as well as physical health. Refining understanding about the mechanisms underpinning their prediction of independence could help to better target services to improve independence in older age.
Electronic supplementary material
Below is the link to the electronic supplementary material.
Acknowledgements
The authors would like to thank all the CARE75+ research team and participants for their generous contributions of time and energy to data collection. Thank you also to the PPIE group members who gave their time to improve the design of this study.
Abbreviations
- NEADL
Nottingham Extended Activities of Daily Living
- ADLs
Activities of Daily Living
- SD
standard deviation
- CARE75 +
Community Ageing REsearch 75+
- DRRC
Data Request Review Committee
- CI
Confidence Interval
- MI
Multiple Imputation
- PMM
Predictive Mean Matching
- knn
k-nearest neighbour
- MoCA
Montreal Cognitive Assessment
- CI
Confidence Interval
- IMD
Index of Multiple Deprivation
- MCS
Mental Component Scale
- PCS
Physical Component Scale
Author contributions
The study was conceived collaboratively by E.T., V.G., S.B., J.F. and A.C. and all co-authors contributed to the interpretation of the results. L.B. coordinated the collection and provision of access to the CARE75+ data analysed in this study. E.T. and S.B. designed the approach to and E.T. conducted the statistical analysis of the data. The manuscript was drafted by E.T. and received intellectual contributions from all co-authors. All authors reviewed and approved the manuscript and agree to its submission.
Funding
This report is independent research funded by the National Institute for Health and Care Research Applied Research Collaboration South West Peninsula. The views expressed in this publication are those of the author and not necessarily those of the National Institute for Health and Care Research or the Department of Health and Social Care.
Data availability
The data that support the findings of this study were made available through Bradford Teaching Hospitals NHS Foundation Trust. CARE75+ is led by the Academic Unit for Ageing and Stroke Research, University of Leeds, based at the Bradford Institute for Health Research, Bradford Teaching Hospitals NHS Foundation Trust. The funding for CARE75+ is provided by the Yorkshire and Humber Applied Research Collaborations. Restrictions apply to the availability of these data, which were used under license for the current study, and so are not publicly available. Data are however available from the authors upon reasonable request and with permission of Bradford Teaching Hospitals NHS Foundation Trust.
Declarations
Ethics approval and consent to participate
Ethical approval was granted for this study by the University of Exeter Medical School Research Ethics Committee (RG/CB/20/03/243).The CARE75 + study was approved by the NRES Committee Yorkshire and Humber– Bradford Leeds 10 October 2014 (14/YH/1120) (Heaven, 2019).
Competing interests
The authors declare no competing interests.
Footnotes
Publisher’s note
Springer Nature remains neutral with regard to jurisdictional claims in published maps and institutional affiliations.
References
- 1.Haak M, Fänge A, Iwarsson S, Ivanoff SD. Home as a signification of independence and autonomy: experiences among old Swedish people. Scand J Occup Ther. 2007;14(1):16–24. [DOI] [PubMed] [Google Scholar]
- 2.White AM, Groves MA. Interdependence and the aged stereotype. Australian J Ageing. 1997;16(2):83–9. [Google Scholar]
- 3.Munnichs JMA, van den Heuvel WJA. Dependency or interdependency in old age. Dordrecht: Springer; 1976. [Google Scholar]
- 4.Bowling A, Gabriel Z, Banister D, Sutton S. Adding quality to quantity: older People’s views on their quality of life and its enhancement. Findings from the growing older programme. Sheffield: ESRC Growing Older Programme; 2002. [Google Scholar]
- 5.Public Health England. Chapter 1: population change and trends in life expectancy. In: Health P, editor. online: Gov.uk; 2018.
- 6.Abdi S, Spann A, Borilovic J, de Witte L, Hawley M. Understanding the care and support needs of older people: a scoping review and categorisation using the WHO international classification of functioning, disability and health framework (ICF). 2019. [DOI] [PMC free article] [PubMed]
- 7.Bradley G. Have they got rehab potential?– An ethnographic study exploring meaning and evaluations of rehabilitation potential for an older person following an acute admission. [Doctoral Thesis]: Northumbria University; 2018.
- 8.Gill TM, Robison JT, Tinetti ME. Difficulty and dependence: two components of the disability continuum among Community-Living older persons. Ann Intern Med. 1998;128(2):96–101. [DOI] [PubMed] [Google Scholar]
- 9.das Nair R, Moreton BJ, Lincoln NB. Rasch Analysis of the Nottingham Extended Activities of Daily Living Scale. 2011;43:944– 50. [DOI] [PubMed]
- 10.Harwood RH, Ebrahim S. The validity, reliability and responsiveness of the Nottingham extended activities of daily living scale in patients undergoing total hip replacement. Disabil Rehabil. 2002;24(7):371–7. [DOI] [PubMed] [Google Scholar]
- 11.Clarke CE, Furmston A, Morgan E, Patel S, Sackley C, Walker M, et al. Pilot randomised controlled trial of occupational therapy to optimise independence in Parkinson’s disease: the PD OT trial. J Neurol Neurosurg Psychiatry. 2009;80(9):976–8. [DOI] [PubMed] [Google Scholar]
- 12.Stuck AE, Walthert JM, Nikolaus T, Büla CJ, Hohmann C, Beck JC. Risk factors for functional status decline in community-living elderly people: a systematic literature review. Soc Sci Med. 1999;48(4):445–69. [DOI] [PubMed] [Google Scholar]
- 13.van der Vorst A, Zijlstra GAR, Witte ND, Duppen D, Stuck AE, Kempen GIJM, et al. Limitations in activities of daily living in Community-Dwelling people aged 75 and over: A systematic literature review of risk and protective factors. PLoS ONE. 2016;11(10):e0165127. [DOI] [PMC free article] [PubMed] [Google Scholar]
- 14.Taylor E, Frost J, Ball S, Clegg A, Brown L, Goodwin V. Participation, autonomy and control are shared concepts within older People’s interpretations of independence: a qualitative interview study. Ageing & Society; 2023.
- 15.Heaven A, Brown L, Young J, Teale E, Hawkins RJ, Spilsbury K et al. The community ageing research 75 + Study (CARE75+): an experimental ageing and frailty research cohort. BMJ Open. 2019:1–10. [DOI] [PMC free article] [PubMed]
- 16.University of Nottingham. Nottingham Extended Activities of Daily Living (NEADL) Scale: Guidance Notes. 2007 [Available from: https://www.nottingham.ac.uk/medicine/documents/published-assessments/neadl-notes.pdf
- 17.Green J, Young J, Forster A, Mallinder K, Bogle S, Lowson K, et al. Effects of locality based community hospital care on independence in older people needing rehabilitation: randomised controlled trial. BMJ. 2005;331(7512):317–22. [DOI] [PMC free article] [PubMed] [Google Scholar]
- 18.Gladman JR, Lincoln NB, Adams SA. Use of the extended ADL scale with stroke patients. Age Ageing. 1993;22(6):419–24. [DOI] [PubMed] [Google Scholar]
- 19.Palapar L, Kerse N, Wilkinson-Meyers L, Lumley T, Blom JW. Primary care variation in rates of unplanned hospitalizations, functional ability, and quality of life of older people. Ann Fam Med. 2021;19(4):318–31. [DOI] [PMC free article] [PubMed] [Google Scholar]
- 20.Skaar E, Øksnes A, Eide Leslie Sofia P, Norekvål TM, Ranhoff Anette H, Nordrehaug JE, et al. Baseline frailty status and outcomes important for shared decision-making in older adults receiving transcatheter aortic valve implantation, a prospective observational study. Aging Clin Exp Res. 2021;33(2):345–52. [DOI] [PMC free article] [PubMed] [Google Scholar]
- 21.Dakhil S, Saltvedt I, Benth JŠ, Thingstad P, Leiv Otto W, Torgeir Bruun W et al. Longitudinal trajectories of functional recovery after hip fracture. PLoS ONE. 2023;18(3). [DOI] [PMC free article] [PubMed]
- 22.Logan Philippa A, Coupland CAC, Gladman JRF, Sahota O, Stoner-Hobbs V, Robertson K, et al. Community falls prevention for people who call an emergency ambulance after a fall: randomised controlled trial. BMJ: Br Med J. 2010;340(7755):1070. [DOI] [PMC free article] [PubMed] [Google Scholar]
- 23.Beltz S, Gloystein S, Litschko T, Laag S, van den Berg N. Multivariate analysis of independent determinants of ADL/IADL and quality of life in the elderly. BMC Geriatr. 2022;22(1):894. [DOI] [PMC free article] [PubMed] [Google Scholar]
- 24.Portela D, Almada M, Midão L, Costa E. Instrumental activities of daily living (iADL) limitations in Europe: an assessment of SHARE data. Int J Environ Res Public Health [Internet]. 2020; 17(20). [DOI] [PMC free article] [PubMed]
- 25.Perrig-Chiello P, Perrig WJ, Uebelbacher A, Stähelin HB. Impact of physical and psychological resources on functional autonomy in old age. Psychol Health Med. 2006;11:4470–82. [DOI] [PubMed] [Google Scholar]
- 26.Cahill E, Lewis LM, Barg FK, Bogner HR. You don’t want to burden them: older adults’ views on family involvement in care. J Fam Nurs. 2009;15:3. [DOI] [PMC free article] [PubMed] [Google Scholar]
- 27.Liu H, Jiao J, Zhu C, Zhu M, Wen X, Jin J, et al. Potential associated factors of functional disability in Chinese older inpatients: a multicenter cross-sectional study. BMC Geriatr. 2020;20:1319. [DOI] [PMC free article] [PubMed] [Google Scholar]
- 28.Hsu T, Barrett AE. The association between marital status and psychological Well-being: variation across negative and positive dimensions. J Fam Issues. 2020;41(11):2179–202. [Google Scholar]
- 29.van der Vorst A, OHV LPM, De Witte N, Schols J, Kempen G, Zijlstra, GAGGS-O-djaEJP. The impact of multidimensional frailty on dependency in activities of daily living and the moderating effects of protective factors. Arch Gerontol Geriatr. 2018;78:255–60. [DOI] [PubMed] [Google Scholar]
- 30.Crowe CL, Domingue BW, Graf GH, Keyes KM, Kwon D, Belsky DW. Associations of loneliness and social isolation with health span and life span in the U.S. health and retirement study. J Gerontol Biol Sci Med Sci. 2021;76(11):1997–2006. [DOI] [PMC free article] [PubMed] [Google Scholar]
- 31.Mehrabi F, Béland F. Frailty as a Moderator of the Relationship Between Social Isolation and Health Outcomes: Innov Aging. 2020;4 Suppl 1:269– 70. 10.1093/geroni/igaa057.863. eCollection 2020.
- 32.De-Rosende-Celeiro I, Torres G, Seoane-Bouzas M, Ávila A. Exploring the use of assistive products to promote functional independence in self-care activities in the bathroom. PLoS ONE. 2019;14:4e0215002. [DOI] [PMC free article] [PubMed] [Google Scholar]
- 33.Davies LE, Todd A, Robinson L, Kingston A. Does polypharmacy shape dependency transitions in the very old? Findings from the Newcastle 85 + Study. Age Ageing. 2022;51:10afac227. [DOI] [PMC free article] [PubMed] [Google Scholar]
- 34.Wearing J, Konings P, Stokes M, de Bruin ED. Handgrip strength in old and oldest old Swiss adults– a cross-sectional study. BMC Geriatr. 2018;18:1. [DOI] [PMC free article] [PubMed] [Google Scholar]
- 35.Bolton KW, Praetorius RT, Smith-Osborne A. Resilience protective factors in an older adult population: A qualitative interpretive Meta-Synthesis. Social Work Res. 2016;40:3171–82. [Google Scholar]
- 36.Frost Y, Weingarden H, Zeilig G, Nota A, Rand D. Self-Care Self-Efficacy correlates with independence in basic activities of daily living in individuals with chronic stroke. J Stroke Cerebrovasc Dis. 2015;24(7):1649–55. [DOI] [PubMed] [Google Scholar]
- 37.Cumming RG, Salkeld G, Thomas M, Szonyi G. Prospective study of the impact of fear of falling on activities of daily living, SF-36 scores, and nursing home admission. Journals Gerontology: Ser A. 2000;55(5):M299–305. [DOI] [PubMed] [Google Scholar]
- 38.Sun G-W, Shook TL, Kay GL. Inappropriate use of bivariable analysis to screen risk factors for use in multivariable analysis. J Clin Epidemiol. 1996;49(8):907–16. [DOI] [PubMed] [Google Scholar]
- 39.Ranganathan P, Pramesh CS, Buyse M. Common pitfalls in statistical analysis: clinical versus statistical significance. Perspect Clin Res. 2015;6:169–70. [DOI] [PMC free article] [PubMed] [Google Scholar]
- 40.StataCorp. Stata 17. College station. TX.: StataCorp LLC; 2021.
- 41.Rosopa PJ, Schaffer MM, Schroeder AN. Managing heteroscedasticity in general linear models. Psychol Methods. 2013;18(3):335–51. [DOI] [PubMed] [Google Scholar]
- 42.Morrow-Howell N. The M word: multicollinearity in multiple regression. Social Work Res. 1994;18(4):247–51. [Google Scholar]
- 43.Pardoe I. Applied regression modeling. Newark, United States: John Wiley & Sons, Incorporated; 2020. [Google Scholar]
- 44.Huque MH, Simpson JBC, Lee JA. A comparison of multiple imputation methods for missing data in longitudinal studies. BMC Med Res Methodol. 2018;18(1):1–16. [DOI] [PMC free article] [PubMed] [Google Scholar]
- 45.Rombach I, Jenkinson C, Gray AM, Murray DW, Rivero-Arias O. Comparison of statistical approaches for analyzing incomplete longitudinal patient-reported outcome data in randomized controlled trials. Patient Relat Outcome Measures. 2018;9:197–209. [DOI] [PMC free article] [PubMed] [Google Scholar]
- 46.Biering K, Hjollund NH, Frydenberg M. Using multiple imputation to deal with missing data and attrition in longitudinal studies with repeated measures of patient-reported outcomes. Clin Epidemiol. 2015;7:91–106. [DOI] [PMC free article] [PubMed] [Google Scholar]
- 47.Morris TP, White IR, Royston P. Tuning multiple imputation by predictive mean matching and local residual draws. BMC Med Res Methodol. 2014;14(1):75. [DOI] [PMC free article] [PubMed] [Google Scholar]
- 48.Akmam EF, Siswantining T, Soemartojo SM, Sarwinda D. Multiple imputation with predictive mean matching method for numerical missing data. IEEE; 2019. pp. 1–6.
- 49.StataCorp. Stata Multiple-Imputation reference manual: release 17. Texas: Stata; 2021. [Google Scholar]
- 50.Eddings W, Marchenko Y. Diagnostics for multiple imputation in Stata. Stata J. 2012;12(3):353–67. [Google Scholar]
- 51.Kelle U. Sociological Explanations between Micro and Macro and the Integration of Qualitative and Quantitative Methods. Forum Qualitative Sozialforschung / Forum: Qualitative Social Research. 2001;2(1).
- 52.Coventry PA, McMillan D, Clegg A, Brown L, van der Feltz-Cornelis C, Gilbody S, et al. Frailty and depression predict instrumental activities of daily living in older adults: A population-based longitudinal study using the CARE75 + cohort. PLoS ONE. 2020;15(12):e0243972. [DOI] [PMC free article] [PubMed] [Google Scholar]
- 53.Kojima G. Frailty as a predictor of disabilities among community-dwelling older people: a systematic review and meta-analysis. Disabil Rehabilitation. 2017;39(18):1897–908. [DOI] [PubMed] [Google Scholar]
- 54.Storeng SH, Sund ER, Krokstad S. Factors associated with basic and instrumental activities of daily living in elderly participants of a population based survey: the Nord-Trøndelag health study, Norway. BMJ Open. 2018;8(3):1–10. [DOI] [PMC free article] [PubMed] [Google Scholar]
- 55.Brown PJ, Rutherford BR, Yaffe K, Tandler JM, Ray JL, Pott E, et al. The depressed frail phenotype: the clinical manifestation of increased biological aging. Am J Geriatric Psychiatry. 2016;24(11):1084–94. [DOI] [PMC free article] [PubMed] [Google Scholar]
- 56.Soysal P, Veronese N, Thompson T, Kahl KG, Fernandes BS, Prina AM, et al. Relationship between depression and frailty in older adults: A systematic review and meta-analysis. Ageing Res Rev. 2017;36:78–87. [DOI] [PubMed] [Google Scholar]
- 57.McAuley E, Szabo A, Gothe N, Olson EA. Self-Efficacy: implications for physical activity, function, and functional limitations in older adults. Am J Lifestyle Med. 2011;5(4):361–9. [DOI] [PMC free article] [PubMed] [Google Scholar]
- 58.Mendes de Leon CF, Seeman TE, Baker DI, Richardson ED, Tinetti ME. Self-efficacy, physical decline, and change in functioning in Community-Living elders: A prospective study. Journals Gerontol. 1996;51B(4):S183–90. [DOI] [PubMed] [Google Scholar]
- 59.Morrissey S. Resources and characteristics of elderly women who live alone. Health Care Women Int. 1998;19(5):411–21. [DOI] [PubMed] [Google Scholar]
- 60.Ravensbergen WM, Timmer IL, Gussekloo J, Blom JW, van Eijk M, Achterberg WP, et al. Self-perceived functioning and (instrumental) activities of daily living questionnaires after a hip fracture: do they tell the same story? Age Ageing. 2022;51(11):1–7. [DOI] [PMC free article] [PubMed] [Google Scholar]
- 61.Alamri Mmsnrn, Ashley Mmsmphrn, Doan-Schultz YNPBC, Harrison-Reid JRN, Pincu SMSNRN, Smith SRN, et al. Poster abstracts from the AAOHN 2011 National conference: May 2–5, 2011, Atlanta, Georgia. AAOHN J. 2011;59(7):281–91.
- 62.Clarke CL, Sniehotta FF, Vadiveloo T, Argo IS, Donnan PT, McMurdo MET, et al. Factors associated with change in objectively measured physical activity in older people - data from the physical activity cohort Scotland study. BMC Geriatr. 2017;17(1):180. [DOI] [PMC free article] [PubMed] [Google Scholar]
- 63.Freedman VA, Kasper JD, Spillman BC, Agree EM, Mor V, Wallace RB, et al. Behavioral adaptation and late-life disability: a new spectrum for assessing public health impacts. Am J Public Health. 2014;104(2):e88–94. [DOI] [PMC free article] [PubMed] [Google Scholar]
- 64.Clegg A, Young J, Iliffe S, Rikkert MO, Rockwood K. Frailty in elderly people. Lancet. 2013;381(9868):752–62. [DOI] [PMC free article] [PubMed] [Google Scholar]
- 65.Allam A. The meaning of independence for older people: A constructivist grounded theory study. University of York; 2015.
- 66.Public Health England. Wider impacts of COVID-19 on physical activity, deconditioning and falls in older adults. London: Public Health England; 2021. pp. GOV–9256. [Google Scholar]
- 67.Hillcoat-Nallétamby S. The meaning of independence for older people in different residential settings. Journals Gerontol Ser B Psychol Sci Social Sci. 2014;69(3):419–30. [DOI] [PubMed] [Google Scholar]
- 68.Meza J, Kushner B. An exploration of autonomy and independence among community dwelling people aged 85 and over. Nurs Praxis New Z. 2017;33(2):20–8. [Google Scholar]
- 69.Plath D. Independence in old age: the route to social exclusion? Br J Social Work. 2008;38(7):1353–69. [Google Scholar]
- 70.Muscari A, Bianchi G, Conte C, Forti P, Magalotti D, Pandolfi P, et al. No direct survival effect of light to moderate alcohol drinking in Community-Dwelling older adults. J Am Geriatr Soc. 2015;63(12):2526–33. [DOI] [PubMed] [Google Scholar]
- 71.Grønbæk M, Deis A, Becker U, Hein HO, Schnohr P, Jensen G, et al. Alcohol and mortality: is there a U-shaped relation in elderly people? Age Ageing. 1998;27:739–44. [DOI] [PubMed] [Google Scholar]
- 72.Jacob I, Mahmood F, Brown L, Heaven A, Mahmood S, Clegg A. Recruiting older people from the Pakistani community in community ageing research 75+. Br J Community Nurs. 2020;25(3):110–3. [DOI] [PubMed] [Google Scholar]
- 73.Clegg A, Relton C, Young J, Witham M. Improving recruitment of older people to clinical trials: use of the cohort multiple randomised controlled trial design. Age Ageing. 2015;44(4):547–50. [DOI] [PubMed] [Google Scholar]
- 74.Austin PC, Steyerberg EW. The number of subjects per variable required in linear regression analyses. J Clin Epidemiol. 2015;68(6):627–36. [DOI] [PubMed] [Google Scholar]
- 75.Wu C-y, Chuang L-l, Lin K-c, Lee S-d, Hong W-h, Responsiveness. Minimal detectable change, and minimal clinically important difference of the Nottingham extended activities of daily living scale in patients with improved performance after stroke rehabilitation. Archives Phys Med Rehabilitation. 2011;92(8):1281–7. [DOI] [PubMed] [Google Scholar]
- 76.Clarke CE, Patel S, Ives N, Rick CE, Dowling F, Woolley R, et al. Physiotherapy and occupational therapy vs no therapy in mild to moderate Parkinson disease: A randomized clinical trial. JAMA Neurol. 2016;73(3):291–9. [DOI] [PubMed] [Google Scholar]
- 77.Goodwin VA, Low MSA, Quinn TJ, Cockcroft EJ, Shepherd V, Evans PH, Henderson EJ, Mahmood F, Lochlainn MN, Needham C, Underwood BR, Arora A, Witham MD. Including older people in health and social care research: best practice recommendations based on the INCLUDE framework. Age Ageing. 2023;52:6. 10.1093/ageing/afad082. [DOI] [PMC free article] [PubMed] [Google Scholar]
- 78.van den Hoonaard DK. Aging and masculinity: A topic whose time has come. J Aging Stud. 2007;21(4):277–80. [Google Scholar]
- 79.Smith JA, Braunack-Mayer A, Wittert G, Warin M. I’ve been independent for so damn long! Independence, masculinity and aging in a help seeking context. J Aging Stud. 2007;21(4):325–35. [Google Scholar]
- 80.Narushima M, Kawabata M. Fiercely independent: experiences of aging in the right place of older women living alone with physical limitations. J Aging Stud. 2020;54:1–8. [DOI] [PMC free article] [PubMed] [Google Scholar]
Associated Data
This section collects any data citations, data availability statements, or supplementary materials included in this article.
Supplementary Materials
Data Availability Statement
The data that support the findings of this study were made available through Bradford Teaching Hospitals NHS Foundation Trust. CARE75+ is led by the Academic Unit for Ageing and Stroke Research, University of Leeds, based at the Bradford Institute for Health Research, Bradford Teaching Hospitals NHS Foundation Trust. The funding for CARE75+ is provided by the Yorkshire and Humber Applied Research Collaborations. Restrictions apply to the availability of these data, which were used under license for the current study, and so are not publicly available. Data are however available from the authors upon reasonable request and with permission of Bradford Teaching Hospitals NHS Foundation Trust.