

Abstract
Memory B cells (MBCs) are phenotypically and functionally diverse, but their developmental origins remain undefined. Murine MBCs can be divided into subsets by expression of CD80 and PDL2. Upon re-immunization, CD80/PDL2 double-negative (DN) MBCs spawn germinal center B cells (GCBCs) whereas CD80/PDL2 positive (DP) MBCs generate plasmablasts but not GCBCs. Using multiple approaches, including a novel GCBC-specific, inducible Cre allele, we demonstrate that in a T-dependent response DNs form independently of the GC, whereas DPs exhibit either extrafollicular (DPEX) or GCBC (DPGC) origins. Chromatin and transcriptional profiling reveal similarity of DNs with an early memory precursor (EMP). Reciprocally, GCBC-derived DPs share distinct genomic features with GCBCs, while DPEX have hybrid features. Upon restimulation, DPEX are more prone to divide while DPGC tend toward IgG1+ plasmablast differentiation. Thus, MBC functional diversity is generated through distinct developmental histories, which imprint characteristic epigenetic patterns onto their progeny, thereby programming them for divergent functional responses.
Introduction
MBCs are central components of humoral immunity. Arising after vaccination or infection, MBCs provide enhanced and more rapid effector functions upon recall. They also enable the secondary response to adapt to genetically altered pathogen variants if they undergo secondary rounds of proliferation and selection. The origins of MBCs, how they are intrinsically different from their naïve precursors, and how they provide both enhanced effector function and adapt to evolution of pathogen epitopes are all areas of active research that require further elucidation.
To this end, in mice, we previously defined three major subsets of MBCs based on expression of CD80 and PDL2: double-negative (DN) for both markers, single-positive, (PDL2SP) and double-positive (DP) for both markers1, 2. A CD80SP subset also exists, though its rarity has preluded further study. Controlling for isotype expression we found that IgM+ DNs could form GCs while IgM+ DPs made a robust and rapid IgG+ plasmablast response but lacked GC potential; PDL2SPs had an intermediate phenotype3. Thus, the dual properties of enhanced effector function and flexibility to adapt upon recall are represented in separate subsets of MBC defined by CD80 and PDL2 expression.
The origins of these MBC subsets and how their different functions are encoded remain uncertain, despite active work in this area4, 5, 6, 7, 8. One common thread is that IgM+, DN-like, MBCs arise early in the response4, 9, 10, likely from a CD38+GL7+ proliferating precursor5, 6, 8. This generative site may remain active even after the onset of the GC response, albeit at a relatively low level4, 6. Similarly, a subset of MBCs, variably termed GC-Bmem and in some ways resembling DPs, were inferred to derive from GCBCs based on timing of appearance and evidence of extensive proliferation4, 6. How proliferative precursors and their MBC progeny are linked is not fully understood.
Here, we developed several approaches to connect proliferative precursors to their respective MBC progeny. Through these studies we linked early memory precursors (EMPs) to DNs. We further used lineage tracing, exploiting a new GCBC-specific inducible Cre, to demonstrate that GCBCs almost exclusively generate DPs. This analysis, coupled with scRNA-seq, revealed further heterogeneity among DPs, with the unexpected finding that DPs contain at least two subsets that in turn differed in developmental origin and subsequent re-activation potential. We then developed additional experimental systems to better dissect out the roles of proliferation, CD40 signals, and GCBC differentiation state in the development of particular MBC types.
By carrying out transcriptomic and epigenetic profiling on MBC subsets derived under different conditions, as well as on their biologically linked precursor populations, we were able to define the intrinsic differences between these MBC subsets. Moreover, among the genes and open chromatin regions that are different among MBC subsets, many are first remodeled in respective precursors and remain remodeled in the resting MBC product. Hence, differential characteristics of memory are imprinted at the precursor state. Taken together, these data substantially advance our understanding of the MBC compartments, including how and when they are created, providing fundamental insight into the nature of cellular memory.
Results
Transcriptional and epigenetic analysis of follicular NBCs and MBC subsets
To determine the transcriptional and epigenetic relationships between naïve B cells (NBCs) and MBCs, MBC subsets and follicular NBCs (FO) were FACS sorted and subjected to RNA-seq and ATAC-seq (Fig. 1a,b, Supplementary Fig. 1a,b). Principal component analysis (PCA) of all expressed genes among FOs and MBCs segregated the cells mainly by memory status along PC1; DNs were closest to, and DPs the farthest from, FOs (Extended Data Fig. 1a), in agreement with previous microarray data from our lab3. There were 1,304 unique differentially expressed genes (DEGs) comparing FOs and any MBC subset, with more genes expressed highly in MBCs than FOs (Fig. 1c, Supplementary Table 1). DNs had the fewest DEGs compared to FOs, and DPs the most (Fig. 1d). Interestingly, all subsets expressed genes that distinguished them from the others, with DPs having the most uniquely-expressed genes (Fig. 1e). Many DEGs were shared among at least two MBC subsets, with a substantial number shared among all three subsets, thereby defining a MBC gene signature (Fig. 1e). Notably, there was a gradual progression in expression levels of shared DEGs from DN to PDL2SP to DP MBCs (Fig. 1f).
Fig 1. Distinct transcriptomic and epigenetic profiles of FO NBCs and MBC subsets.

a, Schematic of BALB/c transfer system to generate antigen-specific MBCs. b, Gating strategy for FO NBCs and MBCs, first gated on live singlet lymphocytes. c, RNA-seq heatmap (row z-scores, n=3 per sample type) of differentially expressed genes from FO and MBC subsets. Differential expression cutoff for each MBC subset compared to FOs was log2FC >= 1, FDR <= 0.05, and expression level of log2 expression >=0. d, Number of genes in c showing either higher or lower expression compared to FOs for each MBC subset. e, Venn diagrams showing overlap of DEGs from c. f, Boxplots of scaled expression in each MBC subset of genes differentially expressed compared to FOs shared among all three MBC subsets, as depicted in c. Boxplots display median values and quartile ranges. g-j, ATAC-seq analysis between MBC subsets and FOs using the same approach as in c-f, except differential accessibility cutoff was log2FC > =1, FDR <= 0.05, log2 expression >= 1 (n=2 for each cell type). k, xy-plot showing relative (z-scored) PageRank score of FOs and MBC subsets (y-axis, scaled) versus relative (z-scored) RNA expression (x-axis, scaled). Top 40 ranked TFs for each cell type were plotted, totaling 48 TFs. Red boxes indicate selected TFs with low relative PageRank score in FOs and high relative PageRank Score in DP. Blue boxes indicate TFs with high relative PageRank score in FOs and low relative PageRank Score in DP. P-values were calculated using two-tailed paired t-tests (***P < 0.001, ****P < 0.0001). Actual p-values are listed in source data.
In PCA analysis of all open chromatin regions (OCRs) among FOs and MBCs, MBCs clustered together, yet DNs showed more similarity to Fos than DPs (Extended Data Fig. 1b). There was a total of 14,926 differentially accessible regions (DARs), comparing all MBC types to FO, with more unique OCRs up in MBCs compared to Fos (Fig. 1g, Supplementary Table 2). DPs had the most DARs compared to FO, and DNs the fewest (Fig. 1h). DPs also had the most unique DARs, yet DNs and PDL2SPs had unique DARs, albeit relatively fewer of them (Fig. 1i). Also, similar to DEGs, there were shared DARs among all three MBC subsets (Fig. 1i), defining a global epigenetic MBC signature. Among the shared DARs, DPs on average showed the greatest differences from Fos, and DNs the least (Fig. 1j).
We used the PageRank algorithm11, 12, which integrates RNA-seq and ATAC-seq to rank influence of individual TFs on the global gene regulatory network (GRN), to infer the top 40 TFs from each cell type. This resulted in only 48 unique TFs (Fig. 1k, Supplementary Table 3), indicative of similar B cell-specific GRNs overall, although relative influence differs. For example, ETS1 showed a progressive decrease in network influence in order of FO, DN, PDL2SP, to DP (Figure 1k). A similar pattern was observed for BCL6. Given the roles of ETS1 and BCL6 in preventing plasmablast differentiation and the requirement of BCL6 for GCBC formation13, 14, 15, 16, the pattern of relative influence of these TFs matches the in vivo differentiation potential of FOs and MBC subsets. Generally, TFs with a higher rank score in FOs than all MBCs showed a progressive decline from DNs to DPs (Extended Data Fig. 1c). TFs with a higher rank in all MBCs compared to FOs showed an opposite pattern; they descended in ranking from DP, to PDL2SP, to DN, to FO (Extended Data Fig. 1d). These TFs include Nfkb, E2f, and AP-1 family members, raising the possibility that their relatively high network influence may explain the propensity of DPs to differentiate into plasmablasts upon re-activation17, 18, 19. Overall, the data highlight a progression of differentiation of MBC subsets from FO, with DNs as the most “naïve-like” and DPs as the most terminally differentiated subset.
DNs and EMPs share similar proliferation profiles
DNs form prior to DPs, with many DPs forming after the onset of a GC4. Therefore, we hypothesized that transcriptional and epigenetic differences between DNs and DPs may be imprinted in proliferating upstream precursors—namely, GCBCs for DPs and early, activated B cells for DNs. The identity of the precursors for DNs is unclear, but others have proposed a multipotent, CD38+GL7+, activated, yet undifferentiated B cell at day 2.5 post-immunization as the precursor to GC-independent MBCs5, 6, 8. To investigate this, we VPD-labeled donor NBCs prior to transfer and immunization and assessed cell phenotype and VPD-dilution at days 2.5 and 11.5 to identify both proliferating precursors and newly-formed MBCs (Extended Data Fig. 2a). At day 2.5 post-immunization, VPD-labeled, CD38+GL7+ donor B cells had divided 3 to 9 times (Extended Data Fig. 2b). At day 11.5, DNs had a bimodal distribution of VPD peaks: half of the cells divided 3–8 times and the other half 9+ times. The other MBC subsets had diluted all VPD (Extended Data Fig. 2c). The match in division profiles between CD38+GL7+ cells at day 2.5 and DNs at day 11.5, along with the fact that almost half of the DNs form in the first two days of the response4, support the selection of the day 2.5 CD38+GL7+ cell as our candidate EMP.
RNA-seq and ATAC-seq link DNs to EMPs and DPs to GCBCs
We purified day 2.5 EMPs and day 14 GCBCs (further separated by light-zone and dark-zone) and performed RNA-seq and ATAC-seq (Fig. 2a,b, Supplementary Fig. 2a,b). PCA analysis including all samples clustered MBCs with FOs with respect to transcriptome, but clustered MBCs separately from FOs with respect to OCRs; EMPs and GCBCs clustered separately in both cases (Extended Data Fig. 2d,e). To connect MBC subsets and their putative precursors, we identified 316 DEGs between DNs and DPs (Fig. 2c). k-means clustering of these DEGs resulted in 7 gene groups, distinguished by patterns of expression among MBCs and their precursors (Fig 2c, Supplementary Fig. 2c, Supplementary Table 4). DN-associated DEG groups (blue) separated into expression profiles shared by DNs and GC (DN/GC), DN only (DN high), or were shared by DNs and EMPs (DN/EMP), the largest group. Of DP-associated DEG groups (red), the largest had similar expression in DPs and GCBCs (DP/GC high). There was a highly skewed (p< 2.2*10−16) concentration of DEGs into the groups that linked DN and EMP (DN/EMP) and DP and GC (DP/GC). Notably, as the log2FC threshold was increased, DNs more closely resembled EMPs, while DPs increased their similarity to GCBCs, indicating that the largest transcriptional differences between DNs and DPs are most reflected in EMPs and GCBCs, respectively (Extended Data Fig. 2f,g).
Fig. 2. Transcriptomic and epigenetic comparison of proliferating precursors and MBCs.

a, Protocol for generating day 2.5 EMPs and day 14 LZ/DZ GCBCs. b, Representative flow cytometry gating examples of NIP+ EMPs and LZ/DZ GCs, first gated on live, CD45.1−CD138−NIP+ B cells, as in Supplementary Fig. 2a,b. c, Heatmap (row z-scores, n=3 per sample type) of expression of DEGs between DNs and DPs across all the indicated cell types, with log2 FC >= 1, FDR <= 0.05, and expression >= 0 log2 normalized reads in either cell type. d, Heatmap (row z-scores, n=2 per sample type except n=3 for EMPs) of DA OCRs (DARs) between DNs or DPs, defined as OCRs with log2 FC >= 1, FDR <= 0.05, and accessibility >= 1 log2 normalized reads in either cell type. For c and d, k-means clustering was used to generate DEG and DAR groups (Supplementary Fig. 2c,d). The resultant heatmap was then split by DEG and DAR group annotations and rows were clustered within each group. The average relative expression (c) and accessibility (d) of each cell type for each group was plotted to the left of the heatmaps. Examples of genes (c) or OCRs assigned to genes (d) corresponding to each group are listed. Parentheses next to listed genes in d indicate number of OCRs associated with the given gene. e, Genome track examples of ATAC-seq data from regions characterized in d as DN/EMP high (left panel) or DP/GC high (center and right panels). To the right of each track is the log2 normalized expression of the listed gene for each cell type, n=3. f, TF motif fold-change enrichment for each DAR group over background (all called peaks) was generated using HOMER. Examples of top TFs for each DAR group were chosen (FC > 1.2, FDR <= 0.01) and the mean normalized counts within 2 kb of the motif center are plotted. Columns represent each DAR group and associated OCRs, and lines represent the listed cell types.
There were 3,449 unique DARs between DNs and DPs (Fig. 2d). k-means clustering of the DARs resulted in 6 overall DAR groups based on accessibility patterns among all cell types (Fig. 2d, Supplementary Fig. 2d, Supplementary Table 5). DNs clustered closely with EMPs and DPs clustered closely with GCBCs (Fig. 2d). As with the transcriptome, the DN/EMP high group was the most prominent of the DN-associated DARs, and the most prominent DP-associated DAR group shared similar expression between DPs and GCBCs (DP/GC high). As with DEGs, there was a highly skewed (p< 2.2*10−16) concentration of DARs into the groups that linked DNs with EMPs (DN/EMP) and DPs with GCs (DP/GC). Examples of DN/EMPs DARs were found near the Foxp1 gene; expression of Foxp1 also matched accessibility (Fig. 2e). Examples of DP/GC DARs were found near the genes Basp1 and Tox (Fig. 2e). These genes were also some of the most differentially expressed between DNs and DPs. Thus, the largest groups of DARs and of DEGs link DNs to EMPs and DPs to GCBCs.
We used HOMER20 to identify TF motifs for each DAR group that were enriched above background and above all other DAR groups (Fig. 2f, Extended Data Fig. 2h,i, Supplementary Table 6). For DN/EMP DARs, members of the ETS TF family met these criteria. The DP/GC high DAR group was enriched for Oct TF family members, particularly a Pou2f2 (Oct2) motif (Extended Data Fig. 2i); additionally, it showed enrichment for an EBF motif. Some bHLH TF family members were enriched in DN/EMP/GC DARs (Extended Data Fig. 2i). The smaller DAR groups, DP high and DP/EMP high, showed enrichment of NF-κB, Rel, and AP-1 family motifs (Extended Data Fig. 2i). Notably, these TFs, especially AP-1 family members, were enriched among all DP-associated DAR groups compared to background and DN-associated groups (Extended Data Fig. 2i). The only TF motif specifically enriched for the DP/EMP/GC group was for Egr2. Together, these data support a role for ETS family members in influencing activity of DN/EMP DARs, while Oct and EBF members may influence activity of DP/GC DARs; AP-1 members may play a role in influencing activity of all DP-associated DARs.
CD40L blockade disproportionately reduces SP and DP MBCs
One prediction of the putative EMP->DN and GCBC->DP linkages is that suppression of GCBC formation should lead to selective reduction of DPs. To test this, we administered anti-CD40L starting at day 3 post-immunization (Fig. 3a, Supplementary Fig. 3a). As expected, this resulted in a dramatic reduction of GCBCs at 4 weeks post-immunization (Fig. 3b,c). Supporting the hypothesis, DPs (and PDL2SPs) were markedly reduced in both frequency and cell number, with a smaller, yet statistically significant effect on DN and CD80SP numbers (Fig. 3b,c). However, as CD40L blockade also shuts down the extrafollicular response, we could not exclude the role of this pathway in reducing MBC numbers.
Fig. 3. Germinal centers disproportionately produce DP MBCs.

a, Schematic for MBC generation with anti-CD40L blockade. b, Left: representative flow cytometry plots of NIP+ B cells (as gated in Supplementary Fig. 3a) produced in a, showing CD38hiFaslo MBC and CD38loFashi GCBC; Right: representative flow cytometry plots of MBCs gated from the Left panel. c, From left to right: number of GCs per spleen, percent of MBC subsets in total MBCs, and number of MBC subsets per spleen, based on flow cytometry gating in b. P-values were calculated using two-tailed Welch’s t-test. Bars display mean + s.d. Results are compiled from two-independent experiments (n=9 for each group). d, Mouse model for lineage tracing GC-derived memory cells. Mice were immunized with 100 ug NP-KLH in alum, and given 1 mg tamoxifen by oral gavage at days 9, 10, and 11 and euthanized at day 42. e, Representative spectral cytometry plots from splenocytes obtained from mice generated as in d, gated on NIP+ B cells (as in Supplementary Fig. 3c); arrows show cascading gating scheme.. f, from top to bottom: percent YFP+ cells among NIP+ GCBCs, percent of each MBC subset among YFP+ total MBCs, percent of each MBC subset among YFP− total MBCs, and percent YFP+ cells among NIP+ DP MBCs. Bars display mean + s.d. P-values were calculated using two-tailed paired t-tests. Results are compiled from two independent experiments (n=10 per group). g, Schematic of tamoxifen dosing window for 3 groups of mice given 1 mg of tamoxifen every other day from days 3–7, days 9–13, or days 3–13 and euthanized at day 42. h, top left: percent YFP+ cells among NIP+ GCBCs, top right: percent YFP+ cells among total NIP+ MBCs, bottom left: percentage of each MBC subset among NIP+ YFP+ total MBCs, bottom right: percent of YFP+ cells within each NIP+ MBC subset. Bars display mean + s.d. P-values were calculated using Mann-Whitney tests. Results are from one experiment for each time point (n=4 for days 3–7, n=4 for days 9–13, n=5 for days 3–13). *P <= 0.05, ***P < 0.001, ****P < 0.0001 for all plots. Actual p-values are listed in source data.
A novel GCBC lineage tracing mouse
Lineage tracing is another approach to test the types of MBC that arise from GCBC. To lineage-trace GCBCs into MBC progeny with higher fidelity than prior systems6, 7, 21, we generated a novel GCBC-specific, tamoxifen-inducible Cre mouse, named GCET-TamCre (Supplementary Fig. 3b). Germinal center-expressed transcript 2 (Gcet, Gcsam), is a highly expressed, GCBC-specific transcript, yet its deletion resulted in no phenotypic difference compared to WT controls22. By crossing the GCET-TamCre allele with a Rosa26-LSL-YFP mouse, we could administer tamoxifen and use YFP expression to identify cells that developed from GCBCs, allowing us to validate the specificity of the GCET-TamCre and lineage trace GCBC progeny. Tamoxifen administration on days 9, 10, and 11 after immunization resulted in ~71% YFP+ GCBCs at day 13, 3% of non-GCBCs of the B lineage (which include naïve cells, activated cells, and memory cells), and 3% of plasmablasts (Extended Data Fig. 3a–c). It is likely that the few YFP+ non-GCBC and plasmablast cells were derived from the GCBCs labeled during the period of tamoxifen administration. There were no YFP+ T cells, as expected, and there were virtually no YFP+ myeloid cells (~0.2% of total splenic cells, Extended Data Fig. 3d).
To confirm that the GCET-TamCre allele did not display any activity in naïve or activated B cells, we gave 3 doses of tamoxifen one day apart in naïve mice and checked YFP expression the following day or 12 weeks later; essentially no YFP expression was detected (Extended Data Fig. 3e–g). Additionally, no YFP expression was seen after administering tamoxifen half a day before immunization, followed by 2 doses 1 day apart, and assessing YFP expression within activated B cells at day 2.5 and week 12 (Extended Data Fig. 3e–g). These data demonstrate that the GCET-TamCre is an effective tool to lineage trace cells that are derived from GCBCs, but not from activated B cells.
GCBCs almost exclusively produce DP MBCs
For GCBC lineage-tracing, we administered tamoxifen on days 9, 10, and 11 after immunization and analyzed on day 42 (Fig. 3d, Supplementary Fig. 3c). Residual GCBCs were ~80% YFP+ (Fig. 3e,f), similar to labeling frequencies immediately after tamoxifen administration (Extended Data Fig 3b). Among Ag-specific cells at day 42, YFP− cells were mostly IgM+, while YFP+ cells were split evenly between IgM and IgG1 (Supplementary Fig. 3d). Strikingly, YFP+ MBCs were almost exclusively DPs, yet only about 50% of DPs were YFP+ (Fig. 3e,f). Labeling from days 3 to 13 post-immunization barely increased the proportion of YFP+ DPs compared to the day 9–11 labeling window, though earlier labeling slightly increased the proportion of PDL2SPs (Fig. 3g,h), in line with our prior finding that PDL2SPs form earlier than DPs4. The 80% labeling efficiency of GCBCs compared to 50% labeling of DPs implied a substantial contribution to the DP compartment from a non-GCBC, unlabeled precursor. V-region sequencing of Ag-specific sorted cells from YFP+ and YFP− DPs showed that YFP+ DPs had more mutations than their YFP− counterparts (Supplementary Fig. 3e). This suggests that at least some YFP− DPs derived from less mutated, potentially non-GCBC precursors; otherwise, the YFP− DP mutational content would have matched that of YFP+ DPs.
scRNA-seq identifies two subpopulations of DPs, reflective of origin
To further investigate the hypothesis that DPs were comprised of distinct cell types, we performed CITE-seq on purified MBC subsets, including the rare CD80SP population. Cells could be grouped into five clusters (Fig. 4a). A plurality of DPs was found in cluster 1 (Fig. 4b,c). Since the cell population analyzed was reconstructed from FACS-purified cells, the clusters do not represent natural distributions of MBC subsets; the typical distribution of MBC subsets in this system4 indicates that cluster 1 would be made up of predominantly DPs at normal MBC frequencies. CD80SPs were overrepresented in cluster 2, to the exclusion of other MBC subsets (Fig. 4b). Overlaying DN and DP scores generated from bulk RNA-seq DEGs (Fig. 2c) on the UMAP plot highlighted that cluster 1, which was greatly enriched with DPs, lacked a DN signature, but displayed a strong DP signature; conversely, the DPs that were not in cluster 1 showed a relatively strong DN score (Fig. 4b,d). We hypothesized that DPs with stronger DN scores may have derived from EMPs (perhaps at a later time point than day 2.5) rather than GCBCs. Supporting the hypothesized EMP->DN pathway, there was a strong association between the DN and EMP scores; conversely, DP and LZ GCBC scores were also correlated (Fig. 4d).
Fig. 4. scRNA-seq identifies heterogeneity among DP MBC, reflective of origin.

scRNA-seq with CITE-seq analysis of week 10 MBC subsets from BALB/c transfer system. a, left: UMAP clustering of all MBC subsets identifying 5 clusters; right: overlay of all MBC subsets on UMAP clusters based on hash-tagged oligo (HTO) assignments, b, Overlay of individual MBC subsets on UMAP clusters (n=1 for each cell type). c, Frequency of each MBC subset (determined by HTO assignments) in each cluster. d, left two plots: Gene set enrichment analysis (GSEA) scores were calculated for each cell using DEGs (defined as log2FC >=1, FDR <= 0.05, log2 expression >= 0) between DN and DP MBCs from bulk RNA-seq, and overlaid on the UMAP plot; right two plots: GSEA scores generated DEGs between EMPs and LZ GCBCs (log2FC >=4, FDR <= 0.05, log2 expression >= 0). Scores are plotted as scaled −log10(p-value), calculated by Wilcoxon’s test. e, UMAP clustering of DP MBCs only, determined by HTO assignment. GSEA scores were calculated and shown for each cell as in d. f, Expression of selected genes associated with panel e Cluster 0 or Cluster 1 (log2FC > 0.3, FDR <=0.01); darker red color indicates higher expression, gray indicates no expression. g-i, NIP+ Memory cells from BALB/c transfer system 10 weeks post-immunization. g, Flow cytometry gating strategy to determine GC-derived MBCs (PlexinB2hiLy6DloCD73+) frequencies within CD80/PDL2 MBC subsets. h, Flow cytometry gating strategy to determine frequencies of CD80/PDL2 MBC subsets within total GC-derived MBCs (PlexinB2hiLy6DloCD73+). i, top: percent of GC-derived cells within each CD80/PDL2 MBC subset; bottom: percent of each CD80/PDL2 subset within total GC-derived MBCs (n=7).
Re-clustering just the DPs revealed two similarly-sized clusters, with DP cluster 1 having high DN/EMP scores and DP cluster 0 having high DP/GC scores, further supporting 2 major ontogenies of DPs, distinguished by their relationship to GCBCs (Fig. 4e). Cells in cluster 0 (putative GCBC-origin) mostly expressed Ighg1 while cluster 1 cells (putative EMP origin) mostly expressed Ighm (Fig. 4e,f). Among some of the top differentially expressed genes in cluster 1 were Foxp1 (associated with DN/EMP DARs from Fig. 2), as well as S1pr3 and Ly6d (Fig. 4f). Basp1 and Tox were uniquely expressed in cluster 0 (Fig. 4f), matching the increased expression and accessibility we had previously demonstrated in bulk DPs and GCBCs.
scRNA-seq data suggested Ly6D as a surface marker to distinguish DPGC vs DPEX in our BALB/c transfer system (Fig. 4f). GCET-TamCre lineage tracing revealed that all GCBC-derived MBCs expressed CD73 and PlexinB2 (Extended Data Fig. 4a), two markers that were reported as more highly expressed on MBCs compared to NBCs2, 5, 23 (Fig. 1a, Fig. 2c). Applying these markers to our MBC subsets revealed a unique population of PlexinB2hiLy6DloCD73+ cells that was present in half of DPs; additionally, these cells overwhelmingly had a DP phenotype (Fig. 4g–i). The same pattern was found after direct immunization of BALB/c mice among polyclonal NIP+ MBC (Extended Data Fig. 4b–d). We thus conclude that DPs comprise at least two major cell types that differ by origin as well as by gene expression profiles and surface markers: GCBC-derived DPs (henceforth referred to as DPGC) and extrafollicular-derived DPs (DPEX).
DPGC are less proliferative and more prone to IgG1+ AFC differentiation than DPEX
To test for functional differences between DPEX and DPGC, we first used NB-21 feeder cells (3T3 cells expressing constitutive CD40L, BAFF, and IL-2124) to test in vitro function (Fig. 5a). Using expression of PlexinB2 and Ly6D (CD73 was excluded because all DPGC are CD73+, Fig. 4g) to sort the two (IgG1−) DP populations from our BALB/c transfer system, we found that DPGC proliferated less than DPEX, yet both proliferated less than DNs (Fig. 5b,c, Supplemental Fig. 4a,b). Additionally, IgG1− DPGC were more prone to generate IgG1+ antibody-forming cells (AFCs)/plasmablasts than IgG1− DPEX, though DPEX were still more prone to IgG1+ AFC differentiation than DNs. DPEX were also more likely to make IgM+ AFCs (Fig. 5c). We also used our GCET-TamCre lineage-tracing system to seed YFP+ and YFP− DPs into this in vitro culture system. As in our transfer system, YFP+ DPs proliferated less than YFP− DPs but were more likely to produce IgG1+ AFCs; YFP− DPs were more likely to make IgM+ AFCs in vitro (Fig. 5d,e, Supplemental Fig. 4c).
Fig. 5. GCBC-derived DPs are less proliferative and more prone to ASC differentiation than extra-GCBC-derived DPs in vitro.

a, Setup for sorting 400 IgG1− MBCs directly into 96-well plates coated with 1,000 NB-21 feeder cells. b, Gating strategy for sorting 10 weeks post-immunization (NP-CGG) NIP+ IgG1− DPEX and DPGC MBCs from the Balb/c transfer system. c, 4 days of in vitro culture of indicated subsets from b (n=10, 3 independent experiments, one dot connected by lines indicates cells sorted from same mouse); left: Cell counts; middle: NP-specific IgM+ ELISPOTs per 1000 counted cells; right: NP-specific IgG1+ spots per 1000 counted cells. d, Gating strategy for sorting 8 weeks post-immunization (NP-KLH) NIP+ IgG1− YFP− and YFP+ DP MBCs from directly immunized GCET-TamCre+/−R26-LSL-YFP+/− mice. e, 4 days of in vitro culture of indicated subsets from d (n=8, 2 independent experiments, one dot connected by lines indicates cells sorted from same mouse); left: Cell counts; middle: NP-specific IgM+ ELISPOTs per 1000 counted cells; right: NP-specific IgG1+ spots per 1000 counted cells. P-values were calculated using paired t-tests (*P<=0.05, **P<0.01, ***P<0.001, ****P<0.0001). Bars display mean values. Actual p-values are listed in source data.
We then used the BALB/c transfer system to test in vivo reactivation of DPEX and DPGC (Extended Data Fig. 5a). At day 4 post-immunization, there were fewer splenic antigen-specific cells emanating from DPGC vs. DPEX; reciprocally, DPGC were more likely to differentiate into IgG1+ AFCs than DPEX (Extended Data Fig. 5b). At day 14, with DN cells as a positive control, we found that neither DPEX or DPGC were capable of forming GCBCs and that DPEX and DPGC produced similar numbers of total MBCs (Extended Data Fig. 5c). These in vitro and in vivo results reveal baseline differences between DPGC and DPEX, illustrating that DPGC are less proliferative but more prone to IgG1+ AFC differentiation, yet neither DP subset is able to produce GCBCs.
NP-Ficoll produces DP MBCs independently of a GC
Notwithstanding the identification of DPs that derived from GCBC, whether GCBC-origin was required to establish the DPGC state was still unclear. DPGC have likely undergone significantly more proliferation and received more CD40/T cell signals over time than DPEX, so these factors alone may be sufficient to establish the transcriptomic and epigenetic state of DPGC, independent of GCBC differentiation. We had already established systems that would allow us to assay the transcriptome and epigenome of early, less proliferated, T-independent (TI) DPEX (Fig. 3a, CD40L blockade), as well as DPGC and DPEX made throughout the T-dependent (TD) immune response (Figure 3d, GCET-TamCre lineage tracing, Figs. 4,5, Ly6Dhigh/low). To further explore this, we next developed systems capable of generating TI-DPEX that experienced large amounts of proliferation and/or CD40 signals, as DPGC would also experience, but in a GC-independent fashion, in order to dissect the influence of GCBC differentiation vs proliferation on the type of DP generated.
NP-Ficoll is a TI-2 antigen thought to elicit a B cell response independently of T cells. Nonetheless, under some circumstances, NP-Ficoll elicits rapid, transient GC responses25, 26, 27. Recently, it was suggested that NP-Ficoll elicits TI-MBCs that are GC-dependent, in that they fail to form when B cells lack BCL627. We used the transfer system to investigate the nature of MBCs generated by NP-Ficoll, also simultaneously depleting CD4 T cells to assess true T-independence of the response (Fig. 6a, Supplementary Fig. 5a–d). At day 28, GCBCs were only present in NP-CGG immunized mice (Fig. 6b–d), as expected. At day 5, NP-Ficoll immunized mice had higher frequencies of GCBCs, and much higher total GCBC numbers (Fig. 6b–d) than did NP-CGG immunized-mice. Notably, CD4-depleted NP-Ficoll-immunized mice had 6-fold fewer GCBC-phenotype cells at day 5 than non-depleted NP-Ficoll-immunized mice. Hence, the great majority of the rapid GCBC response to NP-Ficoll in fact depends on CD4+ cells.
Fig. 6. NP-Ficoll immunization produces DP MBCs independently of a GC reaction.

a, Schematic for generation of MBCs by treatment with NP-CGG + PBS, NP-Ficoll + PBS, or NP-Ficoll + anti-CD4 (GK1.5) in BALB/c transfer system. Recipient mice were pretreated with PBS or 400/200 ug of GK1.5 at days −2, −1, and day 0. Donor cells were administered via tail vein injection on day −1, immunized with NP-CGG or NP-Ficoll on day 0, and euthanized on day 5 or day 28. b, Representative flow cytometry plots from day 5 (left) and day 28 (right) post-immunization. Left column for each day is pre-gated on NIP+ B cells as shown in Supplementary Fig. 5a,c. Right column for each day is gated on the non-GC (day 5) or MBC (day 28) populations as drawn in the left column. c, Frequency of GCBCs among total NIP+ B cells at days 5 and 28 for each treatment group. d, Number of NIP+ GCBCs per spleen at days 5 and 28. e, Frequency of each subset among total NIP+ non-GCs (day 5) or MBCs (day 28) for each treatment group. f, Number of NIP+ non-GC subsets (day 5) or MBC subsets (day 28) per spleen. Data represent two independent experiments for each day (NP-CGG day 5; n=4, NP-Ficoll + PBS day 5; n=6, NP-Ficoll + GK1.5 day 5; n=5, NP-CGG day 28; n=5, NP-Ficoll + PBS day 28; n=4, NP-Ficoll + GK1.5 day 28; n=7). Bars display mean ± s.d. P-values were calculated using two-tailed Welch’s t-test (*P<=0.05, **P<0.01, ***P<0.001, ****P<0.0001). Actual p-values are listed in source data.
The quality of TI-MBCs differed substantially from those elicited by NP-CGG. CD80SPs were the most prevalent MBC subset produced, with commensurately very few PDL2SPs formed (Fig. 6e,f). Despite the large difference in GCBC numbers at day 5 in NP-Ficoll-immunized mice compared to CD4-depleted NP-Ficoll-immunized mice (Extended Data Fig. 6a), there were similar numbers of DPs at day 28 in all groups (Fig. 6f). This indicates that DPs produced by NP-Ficoll were largely, if not completely, GCBC and T cell-independent, and thus DP differentiation in this case was driven by extensive proliferation alone. We further confirmed this using our GCET-TamCre system; even though NP-Ficoll-derived GCBCs expressed YFP, the resulting NP-Ficoll-derived DP MBCs did not express YFP (Extended Data Fig. 6b–d). Other MBC subsets also did not express YFP (not shown). The NP-Ficoll-derived DPs from our transfer system therefore offer proliferation-enhanced TI-DPEX as comparators to TD-DPEX and DPGC.
CD40 stimulation in the absence of GCBCs produces DP MBCs
To explore the role of CD40 signals and proliferation, independent of GCBC differentiation, we used the NP-CGG immunization transfer system but treated recipient mice with the mAbs GK1.5 to deplete CD4 T cells and FGK45 to enhance CD40 signaling (Fig. 7a, Supplementary Fig. 6a–e). As expected from effective T cell depletion, there were virtually no GCBCs at days 5, 14, and 28 (Fig. 7b–e, Supplemental Fig. 6a–e); However, anti-CD40 administration caused a sharp increase in the numbers of GL7+, EMP-like B cells at day 5 (Fig. 7b,f). At both days 5 and 28, compared to controls, anti-CD40 treatment resulted in a marked increase in the frequency and numbers of CD80SP non-GCBCs, with an almost complete loss of PDL2SPs; DPs were equivalent in frequency at both timepoints, though much higher in number at day 5, compatible with more precursor expansion (Fig. 7g,h). The numbers of total MBCs, DPs, and CD80SPs in anti-CD40-treated mice declined about 10-fold from day 5 to day 28, although CD80SP numbers still remained higher than controls (Fig. 6h, Extended Data Fig. 7a). NP-CGG immunization with T-depletion but without added anti-CD40 dramatically reduced numbers of CD80SP to NP-CGG-only levels (Extended Data Fig. 7b,c). Given the CD40 signal-driven massive burst of cells at day 5 in the absence of detectable GCBC formation, the resulting DPs at day 28 can be considered TI-DPEX that resulted from a higher degree of proliferation and CD40 signaling.
Fig. 7. CD40 stimulation in the absence of GCBCs produces DP MBCs.

a, Schematic for generation of MBCs by NP-CGG + PBS or NP-CGG + GK1.5 + FGK45 (anti-CD40 agonist) in BALB/c transfer system. Recipient mice were pretreated with PBS or 400/200 ug of GK1.5 (anti-CD4) at days −2, −1, and day 0 i.p. Donor cells were administered via teil vein injection on day −1, immunized with NP-CGG on day 0. Some mice were given 25 ug FGK i.p. at days 0.5, 1.5, 2.5, 3.5, and 4.5, and euthanized on day 5 or day 28. b, Representative flow cytometry plots from day 5 post-immunization. Left column is pre-gated on NIP+ B cells, as shown in Supplementary Fig. 6a. Middle column is gated on non-GCs, and right column is gated on GL7− non-GCs. c, Representative flow cytometry plots from day 28 post-immunization. Left column is pre-gated on NIP+ B cells, as shown in Supplementary Fig. 6d; right column is gated on MBCs. d, Frequency of GCBCs among total NIP+ B cells at days 5 and 28. e, Number of NIP+ GCBCs at days 5 and 28. f, left: Frequency of GL7+ cells among total non-GCs at day 5; right: Number of NIP+ GL7+ non-GCs per spleen at day 5. g, Frequency of each MBC subset among total NIP+ non-GC (day 5) or MBCs (day 28). h, Number of NIP+ non-GC subsets (day 5) or MBC subsets (day 28) per spleen. Data represent two independent experiments for each day (NP-CGG day 5; n=4, NP-CGG + GK1.5 + FGK45 day 5; n=6, NP-CGG + PBS day 28; n=6, NP-CGG + GK1.5 + FGK45 day 28; n=5). Bars display mean ± s.d. P-values were calculated using two-tailed Welch’s t-test (*P<=0.05, **P<0.01, ***P<0.001, ****P<0.0001). Actual p-values are listed in source data.
Importantly, MBC derived from these TI systems lacked any cells with a GCBC-derived phenotype using the PlexinB2/Ly6D/CD73 markers, further validating their use and the GCBC-independence of MBCs from these systems (Extended Data Fig. 7d,e).
CD80SP genomic analysis
The predominance of the CD80SP population in the TI systems warranted further investigation. We therefore collected ATAC-seq and RNA-seq data for the MBC subsets in the TI systems and the CD80SPs from the NP-CGG system. Within each system, there were OCRs at the Cd80 locus that shared higher accessibility between CD80SP and DP MBCs, but lacked accessibility in DNs; conversely, at the Pdcd1lg2 locus, CD80SP and DN MBCs lacked accessibility at certain OCRs compared to DPs within each system (Extended Data Fig. 7a). We searched for a shared CD80SP signature across all the systems using GSEA. Using DARs between CD80SPs and either DNs or DPs defined in each system as a reference “geneset”, we found that in nearly all cases, DARs that were up or down in CD80SP in one system were enriched in the same direction in the other systems (Extended Data 7b,c). This finding indicates the presence of CD80SP gene expression patterns common to all systems.
We focused on the CD80SPs derived from NP-CGG for deeper analysis, as these are a biologically relevant population that would arise in an adjuvant-based vaccination response. While CD80SPs had many OCRs with differential accessibility with DNs, DPs had more; on the other hand, CD80SPs had very few OCRs with differential accessibility with DPs (Extended Data Fig. 8a-d). Most notably, CD80SPs have a large group of OCRs that are not shared with other subsets (Extended Data Fig. 8b,d, indicated by non-overlapping blue). Closer examination revealed DARs at the S1pr5 and Tbx21 loci that were highly accessible only in NP-CGG-derived CD80SPs (Extended Data 8e); these CD80SP-specific DARs implied a Tbet/inflammatory signature often associated with age-associated B cells (ABCs)28. This notion was supported by the upregulation of select genes associated with T-bet/ABCs28, 29, 30, 31, 32, 33 in NP-CGG-derived CD80SPs compared to other cell types (Extended Data Fig. 8f). Further, T-bet also had the highest relative PageRank score among NP-CGG-derived MBCs (Extended Data Fig. 8g). These findings suggest a relationship to inflammation and the development of CD80SPs in T-dependent systems. In fact, CD80SPs are prevalent in systems with chronic inflammation, such as the MRL/lpr mouse model34. The relatively low inflammatory environment accompanying NP-CGG immunization with alum may underlie the rarity of CD80SPs in this setting.
Proliferation and CD40 signals do not replicate the epigenetic identity of GCBC-derived MBCs
NP-Ficoll and in vivo anti-CD40-stimulated DP MBCs represent proliferation-enhanced TI-MBCs. Anti-CD40 stimulated TI-MBCs also received extensive CD40 signals. These TI-DPEX, along with TD-DPEX and TD-DPGC, allow us to investigate the contributions of GCBC differentiation, proliferation, CD40 signals, and other T cell signals in establishing the DPGC state epigenetic state, which we did by collecting ATAC-seq data. The key comparisons among different types of DPs and their origins are outlined in Fig. 8a. Summary PCA analysis of these datasets is shown in Supplemental Fig. 9a. We looked at the differential accessibility of the DAR groups defined in Fig. 2d between DPGC and their comparator DPEX (“control” DPs are a mix of DPGC and DPEX); if proliferation, CD40 signals, and/or other T cell signals outside of the GC are sufficient at establishing the DPGC state, we would expect the fold-change differences between DPEX created under these conditions of proliferation and CD40/T cell signals and DPGC at these DAR groups to average zero; conversely, differences in accessibility would imply a potential requirement for GCBC-differentiation in establishing the DPGC state. As hypothesized, when looking at the 2 DN-associated DAR groups from Fig. 2d, we found that DPGC had lower accessibility at these regions than did DPEX in every case (each comparison shown on the x-axis, Fig. 8b). The largest DN-associated DAR group, DN/EMP DARs (red bars, Fig. 8b), had the most pronounced difference. Thus, in every system tested, DPEX are more “DN-like” than DPGC, and on average, regions that were closed in GCBCs and remain closed in DPGC may truly require GCBC differentiation for this closure, as opposed to simply having proliferation or CD40 signals accomplish this. Conversely, the 4 DP-associated DAR groups from Fig. 2d were more enriched in DPGC compared to DPEX, making DPGC more “DP-like” (Fig. 8c). The largest DP-associated DAR group, DP/GC DARs (yellow bars, Fig. 8c), showed the highest enrichment across the board in DPGC compared to the other DAR groups, especially when compared to TI-DPEX. Thus, DPEX, especially TI-DPEX, are least able to open regions that are open in GCBCs and remain open in DPGC; other DP-associated DARs show a similar pattern, albeit to a lesser extent.
Fig. 8. Proliferation and CD40 signals are not sufficient to establish the epigenetic identity of DPGC.

a, Table of different TI-DPEX, TD-DPEX, and TD-DPGC sources and their measured extents of GCBC origin, proliferation, CD40 signals received, and other T cell signals received. b, Boxplots depicting log2 FC in accessibility at DN-associated DARs between all DPs from a T-dependent NP-CGG response (containing DPGC) and DPEX generated in different systems, as indicated on the x-axis. Each bar depicts the distribution across all of the DARs from each DN-associated DAR groups (color coded in the boxed legend), as defined in Fig. 2d. Bars display median and quartile ranges. c, Boxplots depicting log2 FC in accessibility at DP-associated DARs between all DPs from a T-dependent NP-CGG response (containing DPGC) and DPEX generated in different systems, as indicated on the x-axis. Each bar depicts the distribution across all of the DARs from each DP-associated DAR groups (color coded in the boxed legend), as defined in Fig. 2d. Bars display median and quartile ranges. For d and e, heatmaps were first generated using k-means clustering via the pheatmap package in R. Clusters were then manually assigned as either insufficient or sufficient and re-plotted using the ComplexHeatmap package. EMP: NP-CGG-derived GL7+ early memory precursor (Day 2.5), LZ/DZ: NP-CGG-derived LZ and DZ GCBCs (Day 14). Ctrl.DN: NP-CGG-derived DN MBC from PBS-treated control mice (Week 4), Fic.DN: NP-Ficoll-derived DN MBC from GK1.5-treated mice (Week 4), aCD40L.DN: NP-CGG-derived DN MBC from MR1-treated mice (Week 4), FGK.DN: NP-CGG-derived DN MBC from GK1.5 and FGK45-treated mice (Week 4). Ctrl.DP: NP-CGG-derived DP MBC from PBS-treated control mice (Week 4), Fic.DP: NP-Ficoll-derived DP MBC from GK1.5-treated mice (Week 4), aCD40L.DP: NP-CGG-derived DP MBC from MR1-treated mice (Week 4), FGK.DP: NP-CGG-derived DP MBC from GK1.5 and FGK45-treated mice (Week 4), DP.YFP.neg: NP-KLH-derived YFP− DP MBC from GCET-TamCre lineage tracing (Week 6), DP.YFP.pos: NP-KLH-derived YFP+ DP MBC from GCET-TamCre lineage tracing (Week 6). DP.EX: NP-CGG-derived Ly6DhiPlexinB2hi/lo DP MBCs (Week 10). DP.GC: NP-CGG-derived Ly6DloPlexinB2hi DP MBCs (Week 10). These cell types are also summarized in Supplemental Fig. 7. d shows the heatmap of DN/EMP high DARs, and e shows the heatmap of DP/GC high DARs, with each showing whether proliferation and/or CD40 signals are sufficient to close (d) or open (e) the DARs in the absence of GCBC differentiation. For f and g, enrichment and p-values were computed using HOMER and all peaks were used as background. A log FC cutoff of <= 1.2 and p-value cutoff of <= 0.01 was used. f, xy-plot showing TF motifs enriched in DN/EMP DARs from d that were either closed or not closed by extensive proliferation/CD40 signals. If a given motif met the threshold criteria, it was colored light purple if only in the “not closed” DARs, teal if only in the “closed” DARs, or black if enriched in all DN/EMP DARs. g, xy-plot showing TF motifs enriched in DP/GC DARs from e that were either opened or not opened by extensive proliferation/CD40 signals. If a given motif met the threshold criteria, it was colored brown if only in the “not opened” DARs, pink if only in the “opened” DARs, or black if enriched in all DP/GC DARs.
We re-clustered the DN/EMP and DP/GC DARs groups to identify GC-dependent and independent OCRs more precisely (Fig. 8d,e, Supplementary Table 8). DN/EMP DARs segregated into two subgroups: a large group of regions that was not closed even in TI-DPEX with a history of extensive proliferation and/or CD40 signals, and a smaller group in which such a history did close the DARs, in this case similarly to the pattern found in DPGC (Fig. 8d). TD-DPEX were intermediate, but more closely resembled EMPs, TI-DPEX, and DNs. Reciprocally, within DP/GC DARs, proliferation and/or CD40 signals were insufficient to open most of these regions (as exemplified by TI-DPEX), but sufficient to open a smaller group, which therefore could be considered proliferation- but not GC-dependent OCRs (Fig. 8e). With respect to DP/GC DARs, TD-DPEX clustered with their DPGC counterparts and with GCs (Fig. 8e). We conclude that extensive proliferation and/or CD40 signals alone are not sufficient to establish the overall DPGC identity.
Finally, we examined the TF motifs enriched in regions that had differential requirements for proliferation and/or CD40 for their remodeling in MBC and confirmed expression of TFs of interest (Supplementary Table 9, Supplementary Fig. 8b). Among DN/EMP DARs, ETS family members were abundant and showed some of the highest enrichment regardless of whether DARs were affected by proliferation and/or CD40 signals (Fig. 8f). TF motif enrichment in DP/GC DARs was distinctly linked to the responsiveness of these DARs to signals. There was strong enrichment of an EBF motif in regions that did not open with proliferation alone (Fig. 8g). Conversely, MEF2 family member and some NF-kB motifs showed specific enrichment in DP/GC DARs that opened with extensive proliferation (Fig. 8g). Lastly, differentially enriched Oct family, AP-1 and other NFkB family TF motifs were found among all DP/GC DARs.
Discussion
Here, we defined the complex relationships between proliferating precursors and their MBC products, demonstrating that MBC lineage- and sublineage-defining chromatin remodeling and gene transcription can be traced to features in their respective proliferating precursors. Using systems that dissect the influences of GCBC state, proliferation, and T cell help, we discovered that differentiation state of precursors is an important determinant of chromatin in resultant MBC, but also that extent of proliferation and possibly T cell-derived signals in precursors can influence the nature of chromatin remodeling and hence the types of MBCs that result. In the process, we discovered that DP MBC are actually comprised of two subsets—DPEX and DPGC—which are distinguished by their origins. We further showed that they have distinct functional capacity both in vitro and in vivo. We further defined conditions that favor the development of CD80SP MBC, which previously were barely explored, and defined their epigenetic and gene expression signatures. Together these findings provide new insights into how and where B cell memory forms and into the qualitatively distinct types of MBCs that can result from various types of stimulation.
Several groups, including ourselves4, have shown that DN-type MBCs can arise early in the response. Taylor et. al showed that unswitched MBCs, which we now understand are enriched for DNs, can arise early5. Kaji et. al identified GC-independent MBCs and showed that they were formed earlier and had less SHM than MBCs that likely derived from the GC at later time points35. Recently Viant et al. used lineage tracing with a tamoxifen inducible S1pr2-ERT2-Cre, which has been described as a GCBC-specific Cre6. However, tamoxifen administration to S1pr2CreERT2/+ R26ZSGreen/+ mice permanently labeled GCBCs as well as extra-GCBCs and their progeny. They used lack of dilution of an H2B-mCherry reporter as a marker for a subset of MBCs they termed Act-memB (likely a mixture of DN and DPEX) and another termed GC-memB (likely DPGC equivalents), but did not link either of these memory subsets to their distinct proliferating precursors via shared genomic patterns. Most recently, on the other hand, Glaros et al. showed that EMPs can generate what they termed early MBC (eMBC), and that, when examined very shortly after formation, EMP and eMBC transcriptomes bore similarities; they did not follow out lineage-marked progeny to a later, memory time point, leaving open the question of whether such eMBC evolve into a more mature transcriptome8.
We advanced upon prior work in several ways. First, we provided a more definite, causal and specific linkage of EMPs to their MBC progeny; identifying some of these as DN MBC (as opposed to just “early” MBC) using a combination of VPD dilution analysis, targeted interruption of the response at very early time points, and transcriptomic and epigenetic analysis. We developed a new, high fidelity GCBC-specific Cre mouse, the GCET-TamCre. Unexpectedly, lineage tracing experiments using the GCET-TamCre allele revealed that DPs are comprised of two subpopulations: one of GCBC origin (DPGC), and the other formed outside of a GC (DPEX). This conclusion was also supported by scRNA-seq, which identified two distinct subsets of DPs that aligned with either EMP or GCBC transcriptional programs. Viant et al. focused on actB that formed at later times; consistent with this, but extending their findings, we found that EF responses accompanied by significant proliferation and/or CD40 signals can generate DPs, but also CD80SPs, neither of which had previously been recognized.
Price et al. recently characterized the epigenome and transcriptome of both IgM and IgG murine MBCs, suggesting that they were both primed to undergo PC differentiation36. We added a critical new dimension to the analysis by comparing epigenomes and transcriptomes across defined precursors and MBC subset progeny. The linkage of EMPs to DNs and DPEX, and GCBCs to DPGC in precursor-product relationships, along with the large swath of DEGs and OCRs that defined differences between MBC subsets and that are shared between these precursor/product pairs, argues mechanistically for a model in which some loci that are remodeled in a developing proliferating precursor retain the remodeled pattern (and in many cases the gene expression) in the resting MBC product. “Memory” is thus a memory in part of the state of the cell before it became a resting MBC. A perfect match of OCRs would not be expected, as in fact the precursors and products are fundamentally different cell types.
Our data also suggest that extent of proliferation can influence MBC quality. For example, OCR modules that are shared among both TI-DPEX and DPGC but absent in DN reflect a distinct vector of influence, which is likely linked to proliferation. Proliferation as an influence is also supported by the differences between DP that are formed early (aCD40L DP) vs late (Control DP). GCBC differentiation state is another likely determinant of the quality of DPs. In agreement with this hypothesis, extent of proliferation and CD40 signals received by TI-DPEX were mostly insufficient at remodeling chromatin to match that of DPGC. However, while TD-DPEX did not completely close OCRs that were closed in DPGC, they were able to open many OCRs that were opened in DPGC, albeit to a lesser extent. It is therefore possible that T cell signals received by TD-DPEX, but not TI-DPEX (for example, IL-21), are sufficient to open these OCRs independently of a GC; we also cannot rule out other epigenetic differences at these regions. These different vectors; proliferation, CD40 signals, GCBC differentiation, and other T cell signals, may even act together, such that a DPEX or DPGC that forms later in the response may differ from one that forms earlier, as a result of undergoing more divisions and perhaps getting different amounts and qualities of T cell signals.
Studies here represent salient demonstrations of precursor genetic states imprinting stable changes in resting progeny, of which there are relatively few other documented examples. In human B cells, DNA demethylation occurred in GCBC and was retained in both MBCs and PCs, with many of the demethylated regions located in heterochromatin37. During mouse development, enhancers that are open in developing precursors are demethylated and can remain in a demethylated yet transcriptionally silent state38, bearing some similarity to what we have seen, although in MBC some of the genes first turned on in precursors continue to be transcribed in MBC progeny. Using H3k27Ac ChIP-seq, Schauder et al. identified enhancers that opened in activated CD8 T cells and remained open in memory cells, short-lived effector cells, and memory precursor effector cells39; though not directly linking precursors and products, these data point to a similar phenomenon in memory CD8 cell development. Recently, adaptive NK cells induced by HCMV were shown to have epigenetic remodeling40. In vitro activation with HCMV peptides and cytokines could reproduce some of these epigenetic changes, reminiscent of our findings linking epigenetic changes in MBC precursors and MBC products. Elegant work found that some skin cell OCRs that are induced in inflammation stay relatively open—some as long as 130 days—after resolution of inflammation; these post-inflammation sites healed wounds more quickly41. Thus, skin stores epigenetic memory of inflammation that yields functional differences upon challenge, much like we have observed for MBCs.
We identified TF motifs in DARs that may differentially control DN vs DP development, regardless of origin. The TFs ETS1 and BCL6 have more network influence and expression in FOs, with a progressive decrease in DNs, to PDL2SPs, and then to DPs. This hierarchical influence is commensurate with known functions of these cells upon immunization. Less ETS1 and BCL6 influence may promote plasmablast differentiation in DPs while relatively preserving these functions in PDL2SPs and DNs, with FOs having the highest influence and functional capacity. Conversely, certain AP-1 factors, along with EGR1 and EGR2, have higher expression and network influence in DPs, with progressively lower influence in PDL2SPs, to DNs, to FOs. This may reflect the propensity of DP to become quickly activated and differentiate into plasmablasts. AP-1 factors have been implicated in development of CD8 and NK cell memory42. Additionally, E2F4 and E2F6, which have been associated with cell cycle arrest18, 43, have high influence in DP, which may serve to block proliferation in favor of differentiation as is seen in DP functionally. The OCRs shared by TD-DPs and GCBCs implicate Oct, AP-1, NFkB, and EBF1 TFs in establishing accessible regions. Although these factors are possibly needed to open many OCRs in all MBCs, they may function uniquely in a GCBC program to open regions associated with DPGC versus DPEX.
While here we have defined epigenetic and transcriptomic differences among known and newly revealed MBC subsets, the next challenge will be to determine how these epigenetic changes are imprinted in different biological settings. Additionally, another goal is to determine how epigenetic states influence the differences in DPEX and DPGC upon re-stimulation, thus more directly explaining how specific MBC subset functions are encoded. Further experimentation will also aim to uncover additional differences between DPEX and DPGC.
Methods
Tissue processing
Splenocyte single cell suspensions were generated by crushing spleens between glass microscope slides in 5 ml R10 (Gibco RPMI 1640, Thermo Fisher Scientific #21870076; 10% Fetalplex (Gemini Bio Products #100602/500); 1% ml Pen/Strep (Thermo Fisher Scientific #10378016); 1% ml L-glutamine (Thermo Fisher Scientific # A2916801); 1% ml HEPES (Thermo Fisher Scientific #15630080); 0.00035% 2-mercaptoethanol). Cells were filtered through 80 uM nylon mesh and washed at 1500 RPM, 4 °C, 5 minutes. Pellets were resuspended in 3 ml of RT ACK lysis buffer (Thermo Fisher Scientific #A1049201) per spleen and incubated RT for 2 minutes, followed by addition of 12 ml of R10 and washing at 1500 RPM, 4 °C, 5 minutes. For flow cytometry, cells were resuspended in staining buffer (PBS, 3% Fetalplex, 1 mM EDTA, 0.02% sodium azide). For bead enrichment followed by cell sorting, cells were resuspended in staining buffer without sodium azide.
Flow and spectral cytometry
Cells were blocked at a concentration of 100×106 cells/ml with anti-CD16/32 (Clone 2.4G2, made in our lab), rat serum (Equitech #SRT30–0100), and mouse serum (Equitech #SM30–0500, when mouse-derived antibodies were used) on ice for 10 minutes. If mouse-derived antibodies or mouse serum was required, anti-IgM or anti-IgG antibodies were stained first. For flow cytometry, cells were washed and stained with antibody cocktails for 20 minutes on ice, followed by washing and staining in a live/dead discriminator for 15 minutes on ice. For samples that required a streptavidin-conjugated fluorophore, it was also added with the live/dead stain. Cells were washed and fixed in 1% PFA for 30 minutes, washed again, and resuspended in staining buffer for analysis on BD LSR II, BD LSR Fortessa, or Cytek Aurora flow/spectral cytometers. Analysis of cytometry data was performed using FlowJo v10.
Bead purification and cell sorting
Cells were blocked as in flow cytometry. For sorting, bead purification was first performed by staining total splenocytes in a cocktail of anti-CD4-biotin (Clone GK1.5, produced and conjugated in our lab), anti-CD8-biotin (Clone 53–6.7, produced and conjugated in our lab), anti-GR1-biotin (clone RB6.8C5, Biolegend #108404), anti-CD49b-bio (Clone DX5, Biolegend #108908), and anti-TER119-biotin (Clone TER119, produced and conjugated in our lab). For naïve mouse spleens, anti-CD43-biotin (Clone S7, produced and conjugated in our lab), anti-CD11b-biotin (Clone M1/70, produced and conjugated in our lab), and anti-CD11c-biotin (Clone N418, produced and conjugated in our lab) were also added. Cells were stained on ice for 15 minutes, washed, and resuspended in magnetic streptavidin coated beads (BD iMag Streptavidin beads, 90 ul beads per ml of buffer) and incubated on ice for 5 minutes. If staining one spleen, the volume was brought up to 3 ml of sorting buffer and transferred to a 5 ml tube. If multiple spleens were pooled, the cell suspension was divided into ~2.5 spleens per 14 ml tube, and the volumes were brought to 6 ml. The tubes were then placed in a cold magnet and incubated for 3 minutes. To increase yield, the supernatant was decanted into a separate tube, and the original tube was resuspended in buffer and placed on the magnet again for 3 minutes. The second supernatant was then combined with the first and the cells were washed and resuspended in sorting buffer for counting. Cells were then stained for the sort at 100×106 cells/ml with 7AAD (Tonbo #13–6993) used as a live/dead discriminator. Sorting was performed by a 5-laser BD Aria II with the 70 um nozzle into 200 ul of R10.
Mouse husbandry
All mice were kept under specific-pathogen free conditions and all experiments were approved by the Institutional Animal Care and Use Committee at the University of Pittsburgh. Mice used for donor and recipient transfers and immunizations were between 6–12 weeks at the time of immunization.
Transfer system to generate memory mice
Memory mice were generated as previously described3, 4. Briefly, splenocytes from naïve B1–8i+/− Jk−/− CD45.2/2 mice, in which ~50% of naïve B cells are NP+, were isolated using anti-CD4 IgM, anti-CD8 IgM followed by complement depletion. An equivalent of 300k NP+ cells were transferred via teil vein injection into naïve AM14-Tg × Vk8R+/− CD45.1/2 recipients3 and immunized the following day. The resulting MBCs are > 90% NP+.
NP-CGG, NP-KLH, NP-Ficoll prep and immunization
In a 50 ml conical, 100 ul of 10mg/ml NP33CGG (BioSearch Technologies #N-1010–100, Rockland Immunochemicals # D602–0100, conjugated in-house) was added to 1.9 ml PBS, followed by 4 ml of 10% alum. 1M Potassium hydroxide was added dropwise while taking pH until a pH of 6.5 was reached. The tube was spun at 2500 rpm, RT, 10 minutes, followed by 2 subsequent washes in PBS at 2500 rpm, RT, 10 minutes. The supernatant was aspirated and the pellet was resuspended to a final volume of 4 ml in PBS. 50 ul (200 ug) were injected intraperitoneally (i.p.) into each mouse. For NP32-KLH (Bioresearch Technologies #N-5060–25), 600 ul of 1 mg/ml NP32-KLH was added directly to 1.2 ml of 10% alum, and the mixture was brought to pH 6.5 and washed as with NP-CGG. The pellet was resuspended to 1.2 ml PBS and 200 ul (100 ug) were injected i.p. into each mouse. 1 ml of 2 mg/ml NP55Ficoll (BioSearch Technologies #F-1420–100) was added to 7 ml of PBS. 200 ul (50 ug) were injected i.p. into each mouse.
RNA collection and sequencing
Cells were collected via FACS, washed twice in PBS + 1% Fetalplex, resuspended in 350 ul RLT Plus Buffer (Qiagen) with 1% 2-Me, and frozen at −80 °C. RNA purification was performed using the RNeasy Micro Plus Kit (Qiagen #70434). Libraries were generated using the SMART-Seq v4 Ultra Low Input RNA kit (Takara Bio) followed by Nextera FLEX using UDI set B indexes (Illumina). Samples were sequenced using NovaSeq 6000 or NextSeq 2000 flowcells to obtain 20M 2×75 bp reads. Some samples were sequenced as 2×101 bp reads.
ATAC-seq
The ATAC-seq protocol was adapted from Corces, et al44. Resuspension buffer (RSB) was made at a final concentration of 10 mM Tris-HCl pH 7.5 (Thermo Fisher #15567027), 3 mM MgCl2 (Thermo Fisher #AM9530G), and 2 mM NaCl (Thermo Fisher #AM9760G) in molecular grade H20. 10,000–50,000 viable cells were pelleted in lo-bind 1.5 ml microtcentrifuge tubes (Eppendorf #022431021), and washed once with PBS supplemented with 1% fetalplex and protease inhibitor (Sigma #P8340, stock at 100x). Supernatant was vacuum aspirated, and 50 ul of cold lysis buffer containing 0.1% IGEPAL CA-360 (Sigma #I8896, 0.01% Digitonin (Promega #G9441), and 0.1% Tween-20 (Sigma #11332465001) in RSB was added to each sample by gently pipetting. Samples were incubated on ice for 3 minutes to isolate nuclei, then washed with 950 ul of 0.1% Tween-20 in RSB and pelleted at 500 × g for 10 minutes at 4 °C. Supernatant was aspirated using p1000 and p200 pipets, followed by addition of 50 ul transposition mix containing 25 ul TD buffer, 2.5 ul TDE1 Tagment DNA Enzyme (Illumina #20034197), 16.5 ul PBS, 0.01% Digitonin, 1% Tween-20, brought to 50 ul with molecular grade H20. Samples were incubated at 37° C for 30 minutes, with mixing every 10 minutes by flicking the tube. Transposed DNA was then purified using the Qiagen MinElute PCR purification kit (Qiagen #28004). To generate libraries, adapters (IDT for Illumina Nextera DNA Unique Dual Indexes, Illumina, #20027215) were added during amplification using 2X Phusion High Fidelity Mastermix with HF Buffer (ThermoFisher #F531L). Libraries were cleaned up with Zymo DNA Clean & Concentrator-5 columns (Zymo Research #D4004) and assessed with a Qubit Flex Fluorometer (ThermoFisher #Q33327) and a TapeStation 4200 (Agilent #G2991BA). Samples were sequenced to obtain 20M 2×75 bp paired-end reads using an Illumina NextSeq 550 sequencer.
Bulk RNA-seq processing and analysis
Samples were aligned to the mm10 genome using the STAR aligner45. Gene-level counts were determined using featureCounts46 (v.2.0.1), and raw counts were quantile normalized to each other for differential expression using the voom method47 in the Limma R package48. For normalization of the datasets, the Quantile method was used.
Bulk ATAC-seq processing and analysis
All sequencing reads were trimmed with Trim Galore (v.0.6.5) and aligned with their reference genome (mm10) using Bowtie249 (v.2.3.3) aligner (using default parameter) to produce raw bam files. Further, mitochondrial reads, unmapped reads and low mappability (<30) reads were filtered out using the samtools view50. PCR duplicates were removed using picard (v. 2.18.12) to obtain final filtered bam files. Final bam files were converted to bigwig files using deeptools (v.3.3.0) bamCoverage tool (parameter -bs=1 --normalizeUsing RPKM -p=max) and bigwig files were used to view genome tracks in IGV (Broad Institute v. 2.3.97). Peaks and peaks summit were called using MACS2 (with parameter -q 0.05 -B --nomodel --shift −75 --extsize 150) after merging filtered reads from replicate 1 and replicate 2 from all samples into two files. The Irreproducible Discovery Rate (IDR v.2.0.3) analysis was used to evaluate the reproducibility between the two biological replicates from all samples. Peaks passing the soft IDR threshold (IDR <=0.1) and rank based on p-value were retained for further analysis. Blacklisted peaks were removed. Raw counts overlapping each peaks summit extended 100bp up and down (in such a way so that peaks are in the boundary of a called narrow peak region) were quantified using bwtool summary (v.1.0.0) and normalized using the voom method47 in the limma (v.3.52.2) R package48. Differential accessibility analysis was performed using “limma” R package. Transcription factor motif enrichment analysis for selected peaks were performed using HOMER20 (v.4.9.1). All gene-set enrichments were performed using the rankSumTestWithCorrelation function in limma, which explicitly corrects for correlation among genes (or OCRs) in the gene set being interrogated.
CITE-seq protocol
MBC subsets were sorted as described above and in Figure 1a,b. After sorting, cells were washed once in PBS with 0.04% BSA. TotalSeq anti-mouse Hashtag Antibodies recognizing CD45 and MHCI (Biolegend) were added at a 1:50 dilution to each of the sorted samples (DN MBC: TotalSeq-A0310, PDL2SP MBC: TotalSeq-A0311, DP MBC: TotalSeq-A0312, CD80SP MBC: TotalSeq-A0312). Cells were stained on ice in PBS with 0.04% BSA for 20 minutes and then washed once in PBS with 0.04% BSA. Cells were counted and 5,600 of each cell type were loaded into the 10x Genomics Chromium system per the manufacturer’s instructions, with a ~57% input recovery. Gene expression and antibody hashtag/feature barcode libraries were generated, their quality was assessed through the Agilent TapeStation High Sensitivity D5000 Screentape, and their amounts were quantified with the KAPA Library Quantification Kit for Illumina Platforms. We used the 3’ V2 library; the feature barcode library was generated according to the New York Genome Center protocol51. For hash-tagging, we followed the “feature barcode” instructions from the manufacturer. Libraries were pooled and sequenced by Medgenome on a NovaSeq 6000 (Illumina Biosciences) to get a total of 660M 2×150 bp reads.
Single cell RNA-seq data processing and analysis
FASTQ files were generated and aligned to the mouse reference genome mm10 with Cell Ranger 5.0.0 to produce the gene-cell count matrix and cell-antibody count matrix. The 10x raw data from each sample were demultiplexed and FASTQ files were generated using the “mkfastq” Cell Ranger pipeline (v5.0.0, 10X Genomics). Cell Ranger “count” was used to align reads to the mm10 reference genome, and mRNA transcript, and HTO unique molecular identifier (UMI) quantification tables were generated. The raw barcode matrix files generated from the Cell Ranger pipeline were further utilized for downstream analysis using the Seurat package (v.3.0.2)52 in R (v.3.4.3). Cells expressing less than 200 genes, or with greater than 10% of UMIs that mapped to mitochondrial DNA, were filtered out. The HTO tables were added to the dataset and normalized by a centered-log ratio (CLR) method using the “NormalizeData” function. The normalized HTO count was used to determine if each gel bead-in-emulsion contained a single cell using the Seurat “MULTIseqDemux” function and manual inspection of cells, where a cell was considered “singlet” if expression of a single HTO accounts more than 70% of the total HTO expression in that cell; otherwise, the cell was considered a “doublet” and removed. UMI, mitochondrial content, hemoglobulin gene and ribosomal gene content scores were “regressed-out” using Seurat’s “ScaleData” function. Variable genes were detected using the “mean.var.plot” method in “FindVariableFeatures” function with default cutoff. These variable genes were used for dimensionality reduction based on principal component analysis (PCA) using the “RunPCA” function. “ElbowPlot” was used to assess the first 50 principal components and the principal components that account for the largest variability in the data were selected for further Uniform Manifold Approximation and Projection (UMAP) dimensional reduction and clustering analysis. To identify distinct groups of cells, unsupervised clustering was performed using the “FindClusters” function, which calculates the k-nearest neighbors according to variable gene expression in all cells, thereby constructing a shared nearest neighbor graph using the Louvain algorithm. To avoid overclustering, we tested different resolution (“res”) parameters, ranging from 0.1 to 2 in increments of 0.1 and the clustering progression was assessed and visualized using “Clustree” (v 0.4.3). Optimal resolution was determined based on continued separation prior to “overclustering” as observed by the increasing crossover between clusters. Based on these observations we chose the resolutions “0.4” and “0.1”, respectively for MBC and DP cluster. Cell clusters were visualized using UMAP dimensional reduction plots. A small cluster expressing high levels of the Igkc transcript was removed; our cells were Jk−/− and therefore the Igkc-expressing cells were presumed to be recipient contamination. The “FindAllMarkers” function with default settings was utilized to find DEGs in each cluster, in comparison to all other clusters, using the Wilcoxon Rank Sum test with genes detected in a minimum of 10% of cells, a minimum of 0.25 average log-fold change, and a minimum of 0.01 Bonferroni-adjusted P-value. Scores for UMAP plots were generated using the AddModuleScore function in Seurat.
PageRank Analysis
Taiji PageRank pipeline (v 1.2.0)12 with default parameters were used to integrate Bulk RNAseq and ATAC-seq data for key transcription factor identification. Cis-BP database was used for mouse motifs.
GCET mouse generation
The region surrounding the ATG of Gcet was analyzed to identify Cas9 target sequences that overlap the start codon. The region chr16:45,610,511–45,610,563 was targeted (Mouse Dec. 2011 (GRCm38/mm10) Assembly). The CRISPR target sites were identified with predicted specificity (off-target effects) and predicted efficiency (on-target cleavage) by various algorithms through CRISPOR (http://crispor.tefor.net/). All target sequences were unique in the genome and had a limited number of potential off-targets. Two target sequences were selected based on a combination of considerations: proximity to the target codons, acceptable profile of potential off-targets and Moreno-Mateos-Score.
iCre-ERT2-T2A was knocked-in at the start codon of Gcet on a C57BL/6J background using the pBlu2KS-iCre-ERT2-T2A vector. This vector was amplified, linearized, and assembled with amplified 5’ and 3’ homology arms of the Gcet locus using the pbluscriptII KS by Gibson assembly, generating the pBlu2KS-Gcet-iCre-ERT2-T2A targeting vector. This targeting vector was successfully microinjected in the pronucleus of fertilized C57BL/6J zygotes which led to the production of potential founders. Fertilized embryos (C57BL/6J, The Jackson Laboratory) produced by natural mating, were microinjected in the pronuclei with a mixture of 0.33 μM EnGen Cas9 protein (New England Biolabs, Cat.No. M0646T), sgRNAs (sgRNA1: 5’-TAATACGACTCACTATAGGTCTGCAAACAGTTCCCCATG-GTTTTAGAGCTAGAAATAGCA-3’, sgRNA2: 5’-TAATACGACTCACTATAGGTGCTGAGGGGC-CTGCCTCATGTTTTAGAGCTAGAAATAGCA) (21.23 ng/μl ≈ 0.66 μM) and the pBlu2KS-Gcet-iCre-ERT2-T2A plasmid (10 ng/μl). The injected zygotes were cultured overnight, the next day the embryos that developed to the 2-cell stage were transferred to the oviducts of pseudopregnant CD1 female recipients.
Vh186.2 Ig amplification and sequencing
GCET-TamCre+/− R26-LSL-YFP+/− mice were immunized with NP-KLH and given 1 mg of tamoxifen on days 9, 10, and 11. On day 42, DN YFP, DP YFP, and DP YFP+ B cell populations were sorted, and mRNA was extracted in the same process as the RNA collection protocol listed above. Purified mRNA was converted to cDNA using the iScript 5x Supermix from BioRad (#1708840). 12 ul purified mRNA, 20 ul molecular grade H20, and 8 ul 5x Supermix were subjected to the following PCR protocol: 5 min at 25 °C, 20 min at 46 °C, and 1 min at 95 °C. 5 ul of cDNA was added to 25.5 ul MG H20, 10 ul Phusion HF buffer, 5 ul 2 uM dNTPs, 0.5 ul Phusion enzyme (Thermo Fisher Scientific #F-530XL), 2 ul of Primer 1 and 2 ul of Primer 2. Primer 1 was specific to Vh186.2 and taken from Rydyznski, et. al53 with sequence 5’-CTCTTCTTGGCAGCAACAGC-3’. For Primer 2, two primers were used in separate reactions to amplify either IgM or IgG1 sequences, both taken from Tiller, et al54. IgM: 5’-AGGGGGCTCTCGCAGGAGACGAGG-3’ and IgG: 5’-GGAAGGTGTGCACACCGCTGGAC-3’. Cycle conditions for Ig amplification were 30s at 98 °C for initial denaturation, then 34 cycles of 10s at 98 °C, 30s at 56 °C, and 15s at 72 °C, followed by 10 min at 72 °C. PCRs were run on a 1% agarose gel with Maestro dye and bands near ~500 bp were extracted using the Lambda Biotech DNA gel recovery kit. 4 ul of recovered DNA was TOPO cloned according to procotol (Invitrogen #450245), and then 1.5 ul of the TOPO reaction was added to NEB5a chemically competent E.coli (NEB #C2987H), incubated 30 minutes on ice, heat shocked for 30s at 42 °C, followed by adding 250 ul RT SOC media and shaking at 250 rpm, 37 °C for 1 hour. 150 ul was then plated on 50 ug/ml kanamycin plates and grown overnight at 37 °C. Colonies were picked and added to 20 ul MG H20 for 20 minutes, and 2 ul were added to 5 ul Phusion HF buffer, 4 ul 2uM dNTPs, 4 ul Betaine, 7.875 ul MG H20, 0.125 ul Phusion enzyme, 1 ul Primer 1 (previously used Vh186.2 primer), and 1 ul Primer 2 (previously used IgM or IgG1 primer). Cycle conditions for colony amplification were 30s at 95 °C for initial denaturation, then 34 cycles of 15s at 95 °C, 30s at 58 °C, and 60s at 72 °C, followed by 10 min at 72 °C. Resultant PCRs were purified using Zymo Research ZR-96 DNA clean up kit (Zymo Research #D4018). Approximately 10 ng of product was Sanger sequenced using the previous Vh186.2 primer.
Vh186.2 Ig SHM analysis
V(D)J genes for each sequence were aligned to the IMGT GENE-DB v3.1.3755 mouse immunoglobulin reference database using IgBlast v1.18.056. Sequences were processed using the Immcantation suite (immcantation.org) and R v4.2.1 (R Core Team 2017). Non-productive rearrangements were removed. Among the 97 sequences with productive rearrangements, 89 aligned to the IGHV1–72*01 (Vh186.2) IGHV gene used in the B1–8 sequence. Only these sequences were retained for further analysis. V-gene somatic hypermutation (SHM) was calculated as the nucleotide Hamming distance between each sequence and the B1–8 germline V gene sequence along IMGT positions 1–312 using shazam v1.1.257. Groups were compared using a Wilcoxon test implemented in ggpubr v0.4.0.
VPD labeling protocol
Cells were prepared as described under “Memory Mouse Generation”, counted and then washed in staining buffer. Supernatant was aspirated, cells were resuspended to 5×10⁶ cells/ml in pre-warmed PBS with 2 uM BD Horizon Violet Proliferation Dye 450 (VPD 450, BD Biosciences), and then incubated at 37 °C for 10 minutes. Cells were then washed with RT R10 and suspended in staining buffer.
Tamoxifen administration
10 mg tamoxifen powder (MP Biomedicals #156738) was solubilized in 1 ml corn oil by mixing at 37 °C overnight with shaking. The 10 mg/ml solution was then frozen at −20 °C. Freeze/thaw was avoided. Mice were given 100 ul (1mg) of tamoxifen via oral gavage at the times indicated.
In vivo antibody administration
anti-CD40L (Clone MR1, BioXcell #BE0017–1 and homemade) was injected i.p. at 350 ug per 200 ul. Anti-CD4 (Clone GK1.5, homemade), was diluted to either 2 mg/ml or 1 mg/ml and 200 ul (400 ug) and 200 ul (200 ug) were injected i.p., respectively. Anti-CD40 agonist (Clone FGK-45, BioXcell #BE0016–2) was injected i.p. at 25 ug per 200 ul.
Graphical and statistical software
Statistics outside of NGS data were performed using GraphPad Prism (v. 9.0.0) or R base statistical package (v. 4.1.0). Data distribution was assumed to be normal. The same software was also used for plotting figures. The VennEuler R package was used for plotting Venn diagrams, base R functions and Prism were used for boxplots and barplots, the pheatmap and ComplexHeatmap R packages were used for plotting heatmaps, and the ggplot2 R package was used to plot x-y plots. Binomial tests were used to determine p-values for group sizes in Figs. 2c,d.
In vitro NB-21 feeder cultures
NB-21 feeder cells were obtained from Harinder Singh. Cells were maintained in 175 mm3 cell culture flasks in DMEM with glucose (Thermo Fisher Scientific #11965092), supplemented with pen/strep and 10% FCS (HyClone #SH30396.03). One day prior to sorting B cells, feeders were detached from the plate using pre-warmed PBS with 5mM EDTA, and 1000 cells per well were plated in a flat-bottom 96-well plate in 200 ul R10 (10% Fetalplex replaced with 10% Hyclone FCS for in vitro cultures). On the day of the sort, 2 ul of 200 ng/ml (100x) IL-4 (Peprotech #214–14) was added to each well immediately prior to sorting. MBC populations were prepped for sorting as stated above, and 400 cells of each population from individual mice were sorted directly into each well. Cultures were incubated at 37 °C, 5% CO2 for 2 days. At day 2, the media was completely removed and replaced with fresh R10 without IL-4. On day 4, the media was completely removed, and 100 ul pre-warmed PBS with 5mM EDTA was added to detach cells. 150 ul of R10 was added after detachment, cells were spun at 1500 rpm, 5 min, RT, and resuspended in R10 for counting. Cells were counted using typran blue exclusion and size discrimination; B cells appeared much smaller and rounder than feeder cells and were not present in feeder-only controls.
ELISPOTs
4X HBX Immulon ELISPOT plates (VWR #62402–959) were coated with 50 5 ug/ml NIP17-BSA overnight in PBS at 4 °C. Liquid from plates was discarded, 50 ul of blocking buffer (PBS, 1% BSA, 0.03% sodium azide) was added, and plates were incubated at RT for at least 1 hour. Plates were washed 3x with ELISA wash buffer (PBS with 10% Tween-20, diluted 10x in H20) then 2x with H20, liquid was discarded, and 200 ul of RT R10 was placed in each well. Appropriate numbers of cells were added to the top well, and volume was brought to 300 ul in R10 if needed. 3x dilutions were then performed down the plate by taking 100 ul of top well and transferring to the well below it. Plates were spun at 1500 rpm, 3 minutes, RT, then incubated at 37 °C, 5% CO2 for 5 hours. After incubation plates were washed again with the 3x ELISA wash buffer, 2x H20 protocol, and then 50 ul of goat-ant-mouse IgM-AP or IgG1-AP (Southern Biotech #1021–04 and #1071–04) in PBS with 2% Fetalplex was added to appropriate wells. Plates were incubated 1 hour RT or 4 °C overnight. Plates were then washed with 3x ELISA wash buffer, 2x H20 protocol, and 50 ul of warmed (>= 37 °C) BCIP-agarose solution was added; 5 ml BCIP buffer (12.1g tris base, 5.8g NaCl, 1g MgCl2×6H20, pH to 9.5), 1 ml 3% liquid low-melt agarose (Fisher Bioreagents #BP-165–25), 33 ul 0.1 g/ml BCIP (Thermo Fisher #34040) in dimethylformamide. Plates were allowed to solidify and develop at RT for 1 hour, then placed at 4 °C and large, dark spots were counted the following day under a microscope.
Extended Data
Extended Data Fig. 1. Distinct transcriptomic and epigenetic profiles of FO NBCs and MBC subsets.

a, PCA plot of genes with expression of >= 0 log2 normalized reads in at least one cell type (n=3 per cell type). b, PCA plot of OCRs with accessibility of >= 1 log2 normalized reads in at least one cell type (n=2 per cell type). c,d, Boxplots showing relative PageRank score for TFs with higher (c) or lower (d) scores in all MBC subsets compared to FO naïve. Boxplots display median values and lower and upper quartiles, the ranges display min and maximum values. n= 2 per cell type.
Extended Data Fig. 2. DAR groups are enriched for distinct TF motifs.

a, Schematic of BALB/c transfer system using VPD-labeled donor cells. Mice were euthanized at days 2.5 and 11.5. b,c Representative flow plots depicting VPD-dilution of listed cell types compared to total transferred B cells in PBS control (unimmunized) at days 2.5 (b) and 11.5 (c). d, PCA plot of genes with expression of >= 0 log2 normalized reads in at least one cell type. e, PCA plot of OCRs with accessibility of >= 1 log2 normalized reads in at least one cell type. f, Ratio of Euclidean distance between DPs and EMPs to Euclidean distance between DNs and EMPs for given log2 FC RNA-seq differential expression thresholds, where Figure 2c is the reference at abs(log2 FC DP vs DN) >=1. For Euclidean distance, a higher number indicates less similarity; if Euclidean distance ratio is > 1, numerator is less similar than denominator. g, Ratio of Euclidean distance between DNs and LZ GCs to Euclidean distance between DPs and LZ GCs for given log2 FC RNA-seq differential expression thresholds, where Figure 2c is the reference at abs(log2 FC DP vs DN) >=1. h, Table of top TF motifs enriched in various DAR groups from Fig 2d compared to background (all called peaks), computed via HOMER. Examples were manually chosen. p = p.value (calculated using cumulative binomial distribution), Motif Score = motif enrichment score above background, Known Motif = motif taken from HOMER database, TF Motif Name = specific TF and/or TF family, along with source if provided, % Coverage in DAR group = % of OCRs in a DAR group that have at least one motif sequence, % Coverage in all OCRs = % of all called OCRs that have at least one motif sequence. i, Heatmap depicting log2 normalized RNA expression of select TFs from Fig. 2f. j, Heatmap depicting all TF motifs with enrichment scores of log2 FC >= 1.4 above background, p. value <= 0.001 for any DAR group. Values shown are motif enrichment scores above background.
Extended Data Fig. 3. The GCET-TamCre is GCBC-specific.

a, Schematic to assess efficiency of GCBC-labeling and non-specific labeling in GCET-TamCre lineage tracing mice. Mice were given 1 mg tamoxifen on days 9, 10, and 11, post-immunization with NP-KLH and euthanized on day 13. b, Representative flow plots depicting YFP expression in NIP+ GCBCs and NIP+ non-GCBCs of corn oil control and tamoxifen-treated mice at day 13. c, Representative flow plots depicting YFP expression in plasmablasts of corn oil control and tamoxifen-treated mice at day 13. d, Representative flow plots depicting YFP expression in non-B cells of corn oil control and tamoxifen-treated mice at day 13. Left two columns depict a total T cell stain, while right 3 columns depict a myeloid lineage stain. e, Schematic to assess efficiency of B cell labeling GCET-TamCre lineage tracing mice. Naïve mice were given 1 mg tamoxifen every day for 3 consecutive days, whereas NP-KLH immunized mice were given 1 mg tamoxifen on days −0.5, 0.5, and 1.5 post-immunization. Mice were euthanized 1 day after final tamoxifen dose or 12 weeks later. f, Representative flow plots depicting YFP expression in naïve mice after 3 tamoxifen doses (top row) and YFP expression in early activated B cells at day 2.5 after 3 tamoxifen doses (bottom row). g, Representative flow plots depicting YFP expression in B cells of naïve mice after 3 tamoxifen doses and chasing out to 12 weeks (top row), YFP expression at week 12 post-immunization in mice not given tamoxifen (middle row), and YFP expression at 12 weeks post-immunization in mice given tamoxifen at days -0.5, 0.5, and 1.5 post-immunization.
Extended Data Fig. 4. Ly6D, PlexinB2, and CD73 can be used to identify GCBC-derived MBCs in WT BALB/c mice.

a, Flow cytometry plots depicting markers expressed by YFP+ MBCs in week 6 KP-KLH-immunized GCET-TamCre+/−R26-LSL-YFP+/− mice (from Fig. 3g; tamoxifen given on days 3–13). b-d, NIP+ Memory cells from directly immunized WT BALB/c mice 8 weeks post-NP-CGG immunization. b, Flow cytometry gating strategy to determine GC-derived MBCs (PlexinB2hiLy6DloCD73+) frequencies within CD80/PD-L2 MBC subsets. c, Flow cytometry gating strategy to determine frequencies of CD80/PD-L2 MBC subsets within total GC-derived MBCs (PlexinB2hiLy6DloCD73+). d, top: percent of GC-derived cells within each CD80/PD-L2 MBC subset; bottom: percent of each CD80/PD-L2 subset within total GC-derived MBCs (n=5). Bars display mean ± s.d.
Extended Data Fig. 5. DPEX and DPGC have distinct functions in vivo.

a, Schematic for in vivo transfer and re-activation of 5,000 sorted IgG1− NIP+ MBC subsets. b, Day 4 in vivo data; left: NIP+CD19+CD45.1− cell counts per spleen, counted by flow cytometry (n=14 for DPEX, n=10 for DPGC, 4 independent experiments); right: Number of IgG1+ NIP+ spots per 1000 NIP+ cells (derived from left panel, (n=11 for DPEX, n=7 for DPGC, 3 independent experiments). c, Day 14 in vivo data; left: number of NIP+CD19+CD138−CD45.1−CD45.2+CD38−CD95+ GCBCs per spleen; right: number of NIP+CD19+CD138−CD45.1−CD45.2+CD38+ GCBCs per spleen. Both panels counted via flow cytometry (n=5 for DN, n=8 for DPEX, n=6 for DPGC, 3 independent experiments). Bars display mean ± s.d. P-values were calculated using two-tailed Welch’s t-test (*P<=0.05, **P<0.01, ***P<0.001). Actual p-values are listed in source data.
Extended Data Fig. 6. NP-Ficoll does not produce GCBC-derived MBCs.

a, Number of total MBCs at Day 5 (left) and Day 28 (right) between NP-CGG + PBS (day 5; n=4, day 28, n= 5), NP-Ficoll + PBS (day 5; n=6, day 28, n= 4), and NP-Ficoll + GK1.5 (day 5; n=5, day 28, n= 7) treated mice from Fig. 5. b, Left/middle: Representative flow plots of pre-gated NIP+ B cells from Day 5 post-immunization for NP-KLH + PBS, NP-Ficoll + PBS, NP-KLH + GK1.5, and NP-Ficoll + GK1.5 treated GCET-TamCre+/−R26-LSL-YFP+/− mice. Mice were given one dose of tamoxifen on Day 3; right: Representative flow plots of pre-gated NIP+ B cells from Day 28 post-immunization for NP-KLH + PBS, NP-Ficoll + PBS, NP-KLH + GK1.5, and NP-Ficoll + GK1.5 treated GCET-TamCre+/−R26-LSL-YFP+/− mice. Mice were given one dose of tamoxifen every other day from day 3–13. c, Number of YFP+ GCBCs (NIP+CD19+CD138−CD38−GL7+) per spleen at day 5 (n=3 per group). d, left: Percent YFP+ of DP MBCs (NIP+CD19+CD138−CD38+GL7−), middle: Number of total DP MBCs per spleen, and right: Number of YFP+ DPs per spleen at day 28 (n=3 per group). Bars display mean ± s.d. P-values were calculated using two-tailed Welch’s t-test (*P<=0.05, **P<0.01, ***P<0.001). Actual p-values are listed in source data.
Extended Data Fig. 7. TI-derived MBCs are not GCBC-derived.
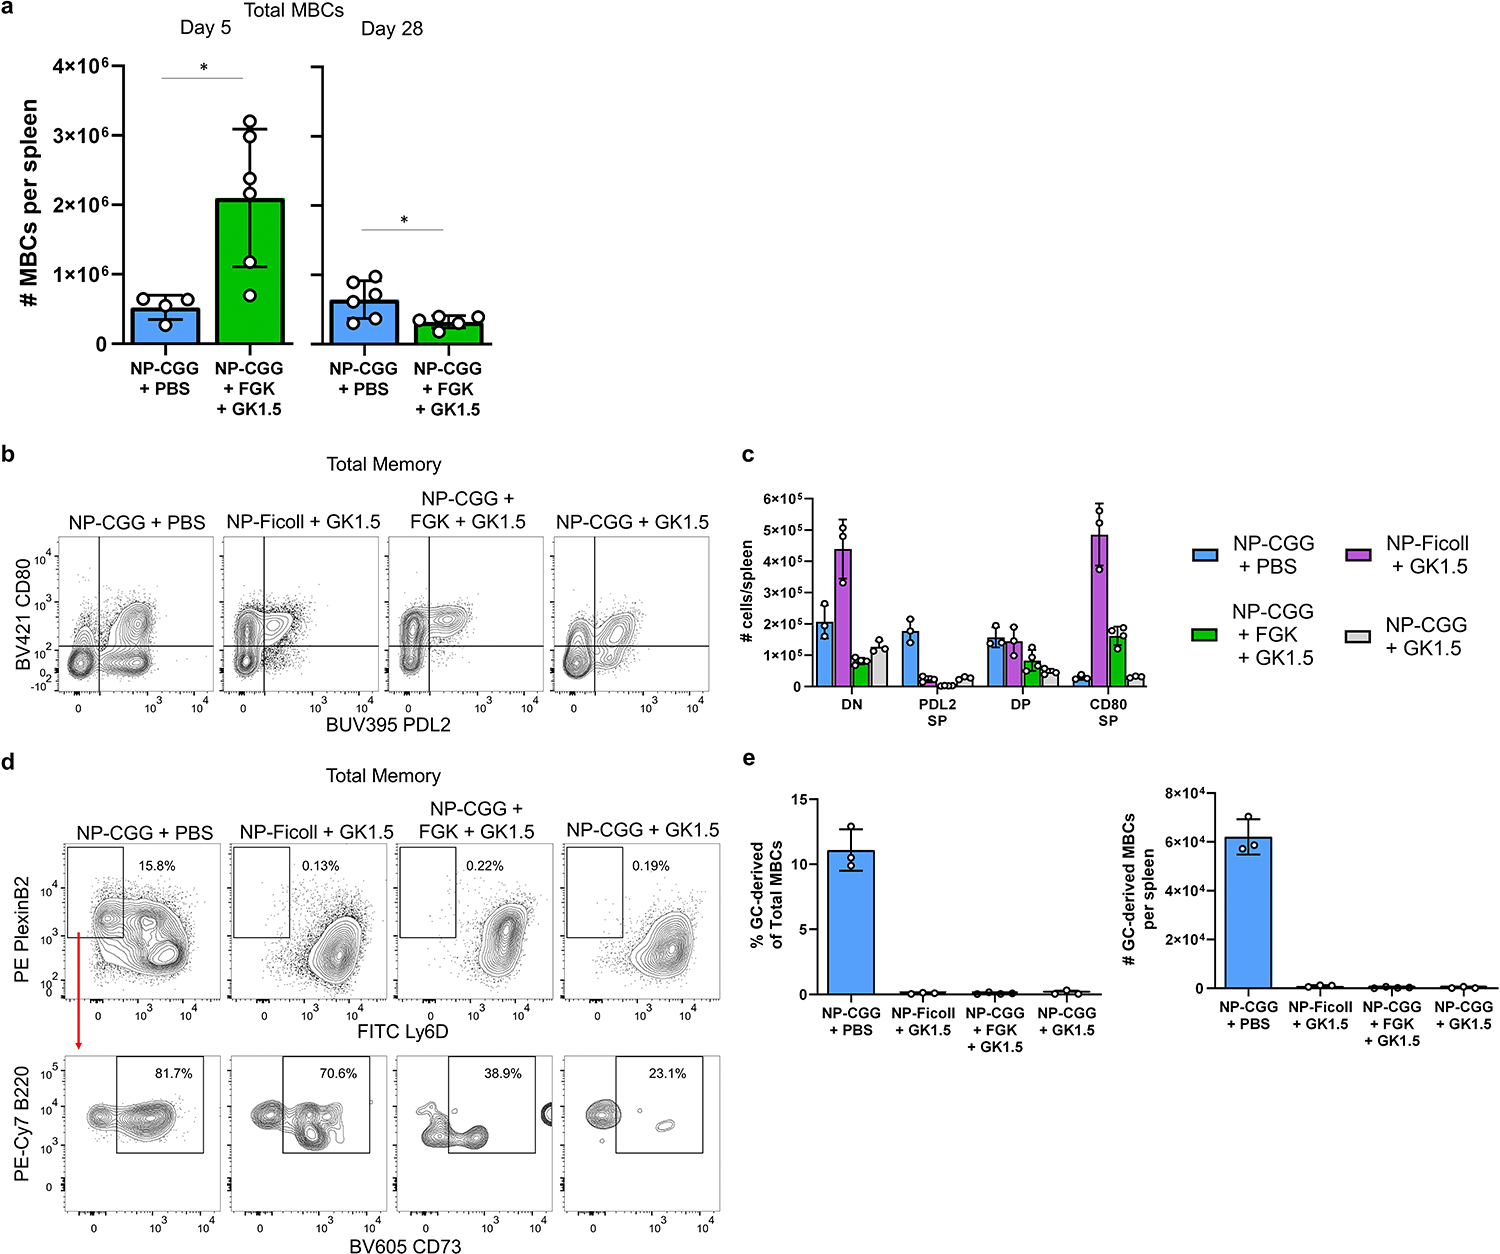
a, Number of total MBCs at Day 5 (left) and Day 28 (right) between NP-CGG + PBS control (day 5; n=4, day 28, n= 6) and NP-CGG + GK1.5 + FGK (day 5; n=6, day 28, n= 5) treated mice. b, Representative flow plots of NIP+ MBCs from BALBc transfer system under indicated immunizations at week 4. c, Number of MBC subsets per spleen for each indicated immunization. d, Representative flow plots of NIP+ MBCs from BALB/c transfer system under indicated immunizations at week 4, showing gating to determine GC-derived MBCs. e, left: percent of; right: number of; total MBCs displaying a GC-derived phenotype in the 4 different immunizations. For b-e, n=3, except NP-CGG + FGK + GK1.5, where n=4. Bars display mean ± s.d. P-values were calculated using two-tailed Welch’s t-test (*P<=0.05). Actual p-values are listed in source data.
Extended Data Fig. 8. A shared CD80SP epigenetic signature can be found in TD and TI systems.

a, Examples of OCRs at Cd80 and Pdcd1lg2 that display a consistent pattern of accessibility in CD80SP MBCs within each system (NP-CGG + PBS, NP-Ficoll + GK1.5, NP-CGG + FGK + GK1.5, MBCs from day 28. n=2 per cell types). b, GSEA plots using DARs between CD80SP MBCs and DN MBCs as genesets, showing all possible comparisons across all different systems. c, GSEA plots usng DARs between CD80SP MBCs and DP MBCs as genesets, showing all possible comparisons across all different systems. Cutoff of log2FC >= 1, p-value <= 0.05 (calculated via two-tailed permutations), accessibility >= 2 log2 normalized counts was used for all genesets; the top 300 DARs, ordered by log2 FC, were used for the geneset unless total DARs were fewer than 300. Number of total DARs (in parentheses): NP-CGG; CD80SP > DN (884), CD80SP < DN (383), DP > CD80SP (93), DP < CD80SP (652). NP-Ficoll + GK1.5; CD80SP > DN (395), CD80SP < DN (83), DP > CD80SP (184), DP < CD80SP (37). NP-CGG + FGK + GK1.5; CD80SP > DN (1,332), CD80SP < DN (503), DP > CD80SP (499), DP < CD80SP (665).
Extended Data Fig. 9. TD-derived CD80SPs exhibit an inflammatory signature.

a, Bar graphs depicting OCRs that differ between DN MBCs and each other MBC subset. Top plot depicts OCRs lower in DNs than each MBC subset (x-axis); bottom plot depicts OCRs higher in DNs. Differential accessibility cutoff for each MBC subset compared to DNs is log2FC >= 1, FDR <= 0.05, and log2 accessibility >=1 normalized counts. b, Venn diagrams plotting the intersection of DARs that were more accessible in any MBC subset compared to DNs on the top and less accessible compared to DNs on the bottom, as enumerated in a. c, Bar graphs depicting OCRs that differ between DP MBCs and each other MBC subset. Top plot depicts OCRs lower in DPs than each MBC subset (x-axis); bottom plot depicts OCRs higher in DPs. Differential accessibility cutoff for each MBC subset compared to DPs is log2FC >= 1, FDR <= 0.05, and log2 accessibility >=1 normalized counts. d, Venn diagrams plotting the intersection of DARs that were more accessible in any MBC subset compared to DPs on the top and less accessible compared to DPs on the bottom, as enumerated in c. e, Select DARs near S1pr5 and Tbx21 showing specificity to CD80SP MBCs from the NP-CGG system. f, RNA expression heatmap (row z-scored) of select Tbet/ABC-associated genes among different systems and cell types (n=3 for NP-CGG, n=2 for other systems). g, PageRank score (z-scored) of Tbx21 from NP-CGG derived cell types.
Supplementary Material
Supplementary Fig. 1
a, Gating strategy for sorting of FO naïve cells from B18i+/− JK−/− mice and post-sort purity. b, Gating strategy for sorting of MBC subsets from BALB/c transfer system (10 weeks post-immunization) and post-sort purity.
Supplementary Fig. 2
a,b, Gating strategy for sorting GL7+ EMPs, DZ, and LZ GC B cells as in Fig. 2b with resulting purity. c,d, Heatmap k-means clustering using the pheatmap package in R for DEGs (c) and DARs (d) between DN and DP MBCs as in Fig. 2c,d. Cluster rows were manually annotated to assign DEGs and DARs to the listed groups.
Supplementary Fig. 3
a, Flow cytometry gating strategy for GCBC and MBC analysis after PBS or MR1 treatment, pertaining to Fig. 3 a,b,c. b, Diagram of GCET-TamCre locus. The iCre-ERT2 and T2A sequences were inserted into exon 1 of Gcet. Exon 1L; left flank of exon 1. Exon 1R; right flank of exon 1. c, Spectral cytometry gating strategy for GCBC, MBC, and YFP analysis, pertaining to Fig. 3d–h. d, IgG1 expression in total YFP− or YFP+ MBCs. e, Somatic hypermutation analysis of Vh186.2 Ig sequences of cells produced from Fig. 3d,e. Sorted populations indicated on x-axis. Cells were sorted at day 42 with days 9, 10, and 11 1 mg tamoxifen treatment as in Fig. 3d. Cells were pooled from 10 spleens across two independent experiments, resulting in n=15 for DN IgM YFP−, n=19 for DP IgM YFP−, n=13 for DP IgM YFP+, n=22 for DP IgG YFP−, and n=21 for DP IgG YFP+. Boxes display median and quartile ranges. Statistics were calculated using two-tailed Wilcoxon’s test (**P < 0.01, **P < 0.001, ***P < 0.0001). Actual p-values are listed in source data.
Supplementary Fig. 4
a, Sorting strategy to isolate NIP+ MBCs in BALB/c transfer system, corresponding to Fig. 5b,c. b, Gating strategy for NIP+ B cells to show justification of Ly6D/PlexinB2, IgG1- DP sorting gates in Fig. 5b. c, Sorting strategy to isolate NIP+ MBCs in GCET-TamCre+/− × R26-LSL-YFP+/− mice, corresponding to Fig. 5d,e.
Supplementary Fig. 5
a, Flow cytometry gating strategy for GCBC and non-GCBC analysis after NP-CGG + PBS, NP-Ficoll + PBS, or NP-Ficoll + GK1.5 treatment at day 5, corresponding to Fig. 5. b, Flow cytometry gating strategy to confirm CD4 T cell depletion in GK1.5-treated mice at day 5. c, Flow cytometry gating strategy for GCBC and MBC analysis after NP-CGG + PBS, NP-Ficoll + PBS, or NP-Ficoll + GK1.5 treatment at day 28, corresponding to Fig. 5. d, Flow cytometry gating strategy to confirm CD4 T cell depletion in GK1.5-treated mice at day 28.
Supplementary Fig. 6
a, Flow cytometry gating strategy for GCBC and non-GCBC analysis after NP-CGG + PBS or NP-CGG + GK1.5 + FGK treatment at day 5, corresponding to Fig. 6. b, Flow cytometry gating strategy to confirm CD4 T cell depletion in GK1.5-treated mice at day 5. c, Flow cytometry gating strategy to confirm CD4 T cell depletion in GK1.5-treated mice at day 14. d, Flow cytometry gating strategy for GCBC and MBC analysis after NP-CGG + PBS or NP-CGG + GK1.5 + FGK treatment at day 28, corresponding to Fig. 6. e, Flow cytometry gating strategy to confirm CD4 T cell depletion in GK1.5-treated mice at day 28.
Supplementary Fig. 7
a-f, Schematics to generate different cell types used in Fig. 7d,e. g, Table of descriptions for each cell type and the time at which they were collected.
Supplementary Fig. 8
a, PCA plot of cell types plotted in Fig. 7d,e (minus DZ GC). PCs are based on all DARs between DN and DP MBCs. b, Heatmap depicting log2 normalized RNA expression of select TFs from Figs. 7f,g.
Acknowledgements
We thank Harinder Singh for extensive discussions and critical reading of the manuscript; Shruit Naik, Joe Sun, and Colleen Lau for critical reading of the manuscript. We thank Tony Marinov, Melinda Berkey, Laura Conter, and Meagan Price for technical support; University of Pittsburgh DLAR for excellent animal husbandry; members of the Shlomchik Lab Memory Group for suggestions and discussion throughout the development of this work. We thank the University of Pittsburgh Innovative Technology Development Core, led by Sebastien Gingras, and the Mouse Embryo Services Core, led by Chunming Bi, for generating the GCET-TamCre mice. This research was supported in part by the University of Pittsburgh Center for Research Computing, RRID:SCR_022735, through the resources provided. Specifically, this work used the HTC cluster, which is supported by NIH award number S10OD028483. This research was also supported by NIH grants R01-AI43603 and R01-AI105018 to MJS. DJC was supported by NIH T32 AI060525 (J. Flynn, PI).
Data Availability Statement
All bulk RNA-seq data have been deposited in the NCBI’s Gene Expression Omnibus (GEO) database and are publicly available under accession number GSE225748.
All bulk ATAC-seq data have been deposited in the NCBI GEO database and are publicly available under accession number GSE225672.
All scRNA-seq data have been deposited in the NCBI GEO database and are publicly available under accession number GSE225673.
The mm10 genome database (https://www.ncbi.nlm.nih.gov/assembly/GCF_000001635.20/) was used to align sequences for the RNA-seq analysis and to align sequencing reads for the ATAC-seq analysis. Source data are provided with this paper.
All raw data and materials will be made available to investigators upon request.
References
- 1.Anderson SM, Tomayko MM, Ahuja A, Haberman AM & Shlomchik MJ New markers for murine memory B cells that define mutated and unmutated subsets. J Exp Med 204, 2103–2114 (2007). [DOI] [PMC free article] [PubMed] [Google Scholar]
- 2.Tomayko MM, Steinel NC, Anderson SM & Shlomchik MJ Cutting edge: Hierarchy of maturity of murine memory B cell subsets. J Immunol 185, 7146–7150 (2010). [DOI] [PMC free article] [PubMed] [Google Scholar]
- 3.Zuccarino-Catania GV et al. CD80 and PD-L2 define functionally distinct memory B cell subsets that are independent of antibody isotype. Nat Immunol 15, 631–637 (2014). [DOI] [PMC free article] [PubMed] [Google Scholar]
- 4.Weisel FJ, Zuccarino-Catania GV, Chikina M & Shlomchik MJ A Temporal Switch in the Germinal Center Determines Differential Output of Memory B and Plasma Cells. Immunity 44, 116–130 (2016). [DOI] [PMC free article] [PubMed] [Google Scholar]
- 5.Taylor JJ, Pape KA & Jenkins MK A germinal center-independent pathway generates unswitched memory B cells early in the primary response. J Exp Med 209, 597–606 (2012). [DOI] [PMC free article] [PubMed] [Google Scholar]
- 6.Viant C et al. Germinal center-dependent and -independent memory B cells produced throughout the immune response. J Exp Med 218 (2021). [DOI] [PMC free article] [PubMed] [Google Scholar]
- 7.Shinnakasu R et al. Regulated selection of germinal-center cells into the memory B cell compartment. Nat Immunol 17, 861–869 (2016). [DOI] [PubMed] [Google Scholar]
- 8.Glaros V et al. Limited access to antigen drives generation of early B cell memory while restraining the plasmablast response. Immunity 54, 2005–2023 e2010 (2021). [DOI] [PMC free article] [PubMed] [Google Scholar]
- 9.Inamine A et al. Two waves of memory B-cell generation in the primary immune response. Int Immunol 17, 581–589 (2005). [DOI] [PubMed] [Google Scholar]
- 10.Takemori T, Kaji T, Takahashi Y, Shimoda M & Rajewsky K Generation of memory B cells inside and outside germinal centers. Eur J Immunol 44, 1258–1264 (2014). [DOI] [PubMed] [Google Scholar]
- 11.Yu B et al. Epigenetic landscapes reveal transcription factors that regulate CD8(+) T cell differentiation. Nat Immunol 18, 573–582 (2017). [DOI] [PMC free article] [PubMed] [Google Scholar]
- 12.Zhang K, Wang M, Zhao Y & Wang W Taiji: System-level identification of key transcription factors reveals transcriptional waves in mouse embryonic development. Sci Adv 5, eaav3262 (2019). [DOI] [PMC free article] [PubMed] [Google Scholar]
- 13.Bories JC et al. Increased T-cell apoptosis and terminal B-cell differentiation induced by inactivation of the Ets-1 proto-oncogene. Nature 377, 635–638 (1995). [DOI] [PubMed] [Google Scholar]
- 14.John SA, Clements JL, Russell LM & Garrett-Sinha LA Ets-1 regulates plasma cell differentiation by interfering with the activity of the transcription factor Blimp-1. J Biol Chem 283, 951–962 (2008). [DOI] [PubMed] [Google Scholar]
- 15.Angelin-Duclos C, Cattoretti G, Lin KI & Calame K Commitment of B lymphocytes to a plasma cell fate is associated with Blimp-1 expression in vivo. J Immunol 165, 5462–5471 (2000). [DOI] [PubMed] [Google Scholar]
- 16.Fukuda T et al. Disruption of the Bcl6 Gene Results in an Impaired Germinal Center Formation. The Journal of Experimental Medicine 186, 439–448 (1997). [DOI] [PMC free article] [PubMed] [Google Scholar]
- 17.Vasanwala FH, Kusam S, Toney LM & Dent AL Repression of AP-1 function: a mechanism for the regulation of Blimp-1 expression and B lymphocyte differentiation by the B cell lymphoma-6 protooncogene. J Immunol 169, 1922–1929 (2002). [DOI] [PubMed] [Google Scholar]
- 18.Tooze RM A replicative self-renewal model for long-lived plasma cells: questioning irreversible cell cycle exit. Front Immunol 4, 460 (2013). [DOI] [PMC free article] [PubMed] [Google Scholar]
- 19.Scharer CD, Barwick BG, Guo M, Bally APR & Boss JM Plasma cell differentiation is controlled by multiple cell division-coupled epigenetic programs. Nat Commun 9, 1698 (2018). [DOI] [PMC free article] [PubMed] [Google Scholar]
- 20.Heinz S et al. Simple combinations of lineage-determining transcription factors prime cis-regulatory elements required for macrophage and B cell identities. Mol Cell 38, 576–589 (2010). [DOI] [PMC free article] [PubMed] [Google Scholar]
- 21.Dogan I et al. Multiple layers of B cell memory with different effector functions. Nat Immunol 10, 1292–1299 (2009). [DOI] [PubMed] [Google Scholar]
- 22.Schenten D, Egert A, Pasparakis M & Rajewsky K M17, a gene specific for germinal center (GC) B cells and a prognostic marker for GC B-cell lymphomas, is dispensable for the GC reaction in mice. Blood 107, 4849–4856 (2006). [DOI] [PMC free article] [PubMed] [Google Scholar]
- 23.Weisel NM et al. Surface phenotypes of naive and memory B cells in mouse and human tissues. Nat Immunol 23, 135–145 (2022). [DOI] [PMC free article] [PubMed] [Google Scholar]
- 24.Kuraoka M et al. Complex Antigens Drive Permissive Clonal Selection in Germinal Centers. Immunity 44, 542–552 (2016). [DOI] [PMC free article] [PubMed] [Google Scholar]
- 25.de Vinuesa CG et al. Germinal centers without T cells. J Exp Med 191, 485–494 (2000). [DOI] [PMC free article] [PubMed] [Google Scholar]
- 26.Obukhanych TV & Nussenzweig MC T-independent type II immune responses generate memory B cells. J Exp Med 203, 305–310 (2006). [DOI] [PMC free article] [PubMed] [Google Scholar]
- 27.Liu X, Zhao Y & Qi H T-independent antigen induces humoral memory through germinal centers. J Exp Med 219 (2022). [DOI] [PMC free article] [PubMed] [Google Scholar]
- 28.Cancro MP Age-Associated B Cells. Annu Rev Immunol 38, 315–340 (2020). [DOI] [PubMed] [Google Scholar]
- 29.Johnson JL et al. The Transcription Factor T-bet Resolves Memory B Cell Subsets with Distinct Tissue Distributions and Antibody Specificities in Mice and Humans. Immunity 52, 842–855 e846 (2020). [DOI] [PMC free article] [PubMed] [Google Scholar]
- 30.Kim CC, Baccarella AM, Bayat A, Pepper M & Fontana MF FCRL5(+) Memory B Cells Exhibit Robust Recall Responses. Cell Rep 27, 1446–1460 e1444 (2019). [DOI] [PMC free article] [PubMed] [Google Scholar]
- 31.Li J et al. CCR5+T-bet+FoxP3+ Effector CD4 T Cells Drive Atherosclerosis. Circ Res 118, 1540–1552 (2016). [DOI] [PMC free article] [PubMed] [Google Scholar]
- 32.Evrard M et al. Sphingosine 1-phosphate receptor 5 (S1PR5) regulates the peripheral retention of tissue-resident lymphocytes. J Exp Med 219 (2022). [DOI] [PMC free article] [PubMed] [Google Scholar]
- 33.Reis BS, Hoytema van Konijnenburg DP, Grivennikov SI & Mucida D Transcription factor T-bet regulates intraepithelial lymphocyte functional maturation. Immunity 41, 244–256 (2014). [DOI] [PMC free article] [PubMed] [Google Scholar]
- 34.Nickerson KM et al. Age-associated B cells are heterogeneous and dynamic drivers of autoimmunity in mice. J Exp Med 220 (2023). [DOI] [PMC free article] [PubMed] [Google Scholar]
- 35.Kaji T et al. Distinct cellular pathways select germline-encoded and somatically mutated antibodies into immunological memory. J Exp Med 209, 2079–2097 (2012). [DOI] [PMC free article] [PubMed] [Google Scholar]
- 36.Price MJ, Scharer CD, Kania AK, Randall TD & Boss JM Conserved Epigenetic Programming and Enhanced Heme Metabolism Drive Memory B Cell Reactivation. J Immunol 206, 1493–1504 (2021). [DOI] [PMC free article] [PubMed] [Google Scholar]
- 37.Lai AY et al. DNA methylation profiling in human B cells reveals immune regulatory elements and epigenetic plasticity at Alu elements during B-cell activation. Genome Res 23, 2030–2041 (2013). [DOI] [PMC free article] [PubMed] [Google Scholar]
- 38.Jadhav U et al. Extensive Recovery of Embryonic Enhancer and Gene Memory Stored in Hypomethylated Enhancer DNA. Mol Cell 74, 542–554 e545 (2019). [DOI] [PMC free article] [PubMed] [Google Scholar]
- 39.Schauder DM et al. E2A-regulated epigenetic landscape promotes memory CD8 T cell differentiation. Proc Natl Acad Sci U S A 118 (2021). [DOI] [PMC free article] [PubMed] [Google Scholar]
- 40.Ruckert T, Lareau CA, Mashreghi MF, Ludwig LS & Romagnani C Clonal expansion and epigenetic inheritance of long-lasting NK cell memory. Nat Immunol 23, 1551–1563 (2022). [DOI] [PMC free article] [PubMed] [Google Scholar]
- 41.Naik S et al. Inflammatory memory sensitizes skin epithelial stem cells to tissue damage. Nature 550, 475–480 (2017). [DOI] [PMC free article] [PubMed] [Google Scholar]
- 42.Lau CM et al. Epigenetic control of innate and adaptive immune memory. Nat Immunol 19, 963–972 (2018). [DOI] [PMC free article] [PubMed] [Google Scholar]
- 43.Hsu J & Sage J Novel functions for the transcription factor E2F4 in development and disease. Cell Cycle 15, 3183–3190 (2016). [DOI] [PMC free article] [PubMed] [Google Scholar]
- 44.Corces MR et al. An improved ATAC-seq protocol reduces background and enables interrogation of frozen tissues. Nat Methods 14, 959–962 (2017). [DOI] [PMC free article] [PubMed] [Google Scholar]
- 45.Dobin A et al. STAR: ultrafast universal RNA-seq aligner. Bioinformatics 29, 15–21 (2013). [DOI] [PMC free article] [PubMed] [Google Scholar]
- 46.Liao Y, Smyth GK & Shi W featureCounts: an efficient general purpose program for assigning sequence reads to genomic features. Bioinformatics 30, 923–930 (2014). [DOI] [PubMed] [Google Scholar]
- 47.Law CW, Chen Y, Shi W & Smyth GK voom: Precision weights unlock linear model analysis tools for RNA-seq read counts. Genome Biol 15, R29 (2014). [DOI] [PMC free article] [PubMed] [Google Scholar]
- 48.Ritchie ME et al. limma powers differential expression analyses for RNA-sequencing and microarray studies. Nucleic Acids Res 43, e47 (2015). [DOI] [PMC free article] [PubMed] [Google Scholar]
- 49.Langmead B & Salzberg SL Fast gapped-read alignment with Bowtie 2. Nat Methods 9, 357–359 (2012). [DOI] [PMC free article] [PubMed] [Google Scholar]
- 50.Danecek P et al. Twelve years of SAMtools and BCFtools. Gigascience 10 (2021). [DOI] [PMC free article] [PubMed] [Google Scholar]
- 51.Stoeckius M et al. Simultaneous epitope and transcriptome measurement in single cells. Nat Methods 14, 865–868 (2017). [DOI] [PMC free article] [PubMed] [Google Scholar]
- 52.Stuart T et al. Comprehensive Integration of Single-Cell Data. Cell 177, 1888–1902 e1821 (2019). [DOI] [PMC free article] [PubMed] [Google Scholar]
- 53.Rydyznski CE et al. Affinity Maturation Is Impaired by Natural Killer Cell Suppression of Germinal Centers. Cell Rep 24, 3367–3373 e3364 (2018). [DOI] [PMC free article] [PubMed] [Google Scholar]
- 54.Tiller T, Busse CE & Wardemann H Cloning and expression of murine Ig genes from single B cells. J Immunol Methods 350, 183–193 (2009). [DOI] [PubMed] [Google Scholar]
- 55.Giudicelli V, Chaume D & Lefranc MP IMGT/GENE-DB: a comprehensive database for human and mouse immunoglobulin and T cell receptor genes. Nucleic Acids Res 33, D256–261 (2005). [DOI] [PMC free article] [PubMed] [Google Scholar]
- 56.Ye J, Ma N, Madden TL & Ostell JM IgBLAST: an immunoglobulin variable domain sequence analysis tool. Nucleic Acids Res 41, W34–40 (2013). [DOI] [PMC free article] [PubMed] [Google Scholar]
- 57.Yaari G et al. Models of somatic hypermutation targeting and substitution based on synonymous mutations from high-throughput immunoglobulin sequencing data. Front Immunol 4, 358 (2013). [DOI] [PMC free article] [PubMed] [Google Scholar]
Associated Data
This section collects any data citations, data availability statements, or supplementary materials included in this article.
Supplementary Materials
Supplementary Fig. 1
a, Gating strategy for sorting of FO naïve cells from B18i+/− JK−/− mice and post-sort purity. b, Gating strategy for sorting of MBC subsets from BALB/c transfer system (10 weeks post-immunization) and post-sort purity.
Supplementary Fig. 2
a,b, Gating strategy for sorting GL7+ EMPs, DZ, and LZ GC B cells as in Fig. 2b with resulting purity. c,d, Heatmap k-means clustering using the pheatmap package in R for DEGs (c) and DARs (d) between DN and DP MBCs as in Fig. 2c,d. Cluster rows were manually annotated to assign DEGs and DARs to the listed groups.
Supplementary Fig. 3
a, Flow cytometry gating strategy for GCBC and MBC analysis after PBS or MR1 treatment, pertaining to Fig. 3 a,b,c. b, Diagram of GCET-TamCre locus. The iCre-ERT2 and T2A sequences were inserted into exon 1 of Gcet. Exon 1L; left flank of exon 1. Exon 1R; right flank of exon 1. c, Spectral cytometry gating strategy for GCBC, MBC, and YFP analysis, pertaining to Fig. 3d–h. d, IgG1 expression in total YFP− or YFP+ MBCs. e, Somatic hypermutation analysis of Vh186.2 Ig sequences of cells produced from Fig. 3d,e. Sorted populations indicated on x-axis. Cells were sorted at day 42 with days 9, 10, and 11 1 mg tamoxifen treatment as in Fig. 3d. Cells were pooled from 10 spleens across two independent experiments, resulting in n=15 for DN IgM YFP−, n=19 for DP IgM YFP−, n=13 for DP IgM YFP+, n=22 for DP IgG YFP−, and n=21 for DP IgG YFP+. Boxes display median and quartile ranges. Statistics were calculated using two-tailed Wilcoxon’s test (**P < 0.01, **P < 0.001, ***P < 0.0001). Actual p-values are listed in source data.
Supplementary Fig. 4
a, Sorting strategy to isolate NIP+ MBCs in BALB/c transfer system, corresponding to Fig. 5b,c. b, Gating strategy for NIP+ B cells to show justification of Ly6D/PlexinB2, IgG1- DP sorting gates in Fig. 5b. c, Sorting strategy to isolate NIP+ MBCs in GCET-TamCre+/− × R26-LSL-YFP+/− mice, corresponding to Fig. 5d,e.
Supplementary Fig. 5
a, Flow cytometry gating strategy for GCBC and non-GCBC analysis after NP-CGG + PBS, NP-Ficoll + PBS, or NP-Ficoll + GK1.5 treatment at day 5, corresponding to Fig. 5. b, Flow cytometry gating strategy to confirm CD4 T cell depletion in GK1.5-treated mice at day 5. c, Flow cytometry gating strategy for GCBC and MBC analysis after NP-CGG + PBS, NP-Ficoll + PBS, or NP-Ficoll + GK1.5 treatment at day 28, corresponding to Fig. 5. d, Flow cytometry gating strategy to confirm CD4 T cell depletion in GK1.5-treated mice at day 28.
Supplementary Fig. 6
a, Flow cytometry gating strategy for GCBC and non-GCBC analysis after NP-CGG + PBS or NP-CGG + GK1.5 + FGK treatment at day 5, corresponding to Fig. 6. b, Flow cytometry gating strategy to confirm CD4 T cell depletion in GK1.5-treated mice at day 5. c, Flow cytometry gating strategy to confirm CD4 T cell depletion in GK1.5-treated mice at day 14. d, Flow cytometry gating strategy for GCBC and MBC analysis after NP-CGG + PBS or NP-CGG + GK1.5 + FGK treatment at day 28, corresponding to Fig. 6. e, Flow cytometry gating strategy to confirm CD4 T cell depletion in GK1.5-treated mice at day 28.
Supplementary Fig. 7
a-f, Schematics to generate different cell types used in Fig. 7d,e. g, Table of descriptions for each cell type and the time at which they were collected.
Supplementary Fig. 8
a, PCA plot of cell types plotted in Fig. 7d,e (minus DZ GC). PCs are based on all DARs between DN and DP MBCs. b, Heatmap depicting log2 normalized RNA expression of select TFs from Figs. 7f,g.
Data Availability Statement
All bulk RNA-seq data have been deposited in the NCBI’s Gene Expression Omnibus (GEO) database and are publicly available under accession number GSE225748.
All bulk ATAC-seq data have been deposited in the NCBI GEO database and are publicly available under accession number GSE225672.
All scRNA-seq data have been deposited in the NCBI GEO database and are publicly available under accession number GSE225673.
The mm10 genome database (https://www.ncbi.nlm.nih.gov/assembly/GCF_000001635.20/) was used to align sequences for the RNA-seq analysis and to align sequencing reads for the ATAC-seq analysis. Source data are provided with this paper.
All raw data and materials will be made available to investigators upon request.