

Abstract
Objective
To examine the associations between characteristics of daily rainfall (intensity, duration, and frequency) and all cause, cardiovascular, and respiratory mortality.
Design
Two stage time series analysis.
Setting
645 locations across 34 countries or regions.
Population
Daily mortality data, comprising a total of 109 954 744 all cause, 31 164 161 cardiovascular, and 11 817 278 respiratory deaths from 1980 to 2020.
Main outcome measure
Association between daily mortality and rainfall events with return periods (the expected average time between occurrences of an extreme event of a certain magnitude) of one year, two years, and five years, with a 14 day lag period. A continuous relative intensity index was used to generate intensity-response curves to estimate mortality risks at a global scale.
Results
During the study period, a total of 50 913 rainfall events with a one year return period, 8362 events with a two year return period, and 3301 events with a five year return period were identified. A day of extreme rainfall with a five year return period was significantly associated with increased daily all cause, cardiovascular, and respiratory mortality, with cumulative relative risks across 0-14 lag days of 1.08 (95% confidence interval 1.05 to 1.11), 1.05 (1.02 to 1.08), and 1.29 (1.19 to 1.39), respectively. Rainfall events with a two year return period were associated with respiratory mortality only, whereas no significant associations were found for events with a one year return period. Non-linear analysis revealed protective effects (relative risk <1) with moderate-heavy rainfall events, shifting to adverse effects (relative risk >1) with extreme intensities. Additionally, mortality risks from extreme rainfall events appeared to be modified by climate type, baseline variability in rainfall, and vegetation coverage, whereas the moderating effects of population density and income level were not significant. Locations with lower variability of baseline rainfall or scarce vegetation coverage showed higher risks.
Conclusion
Daily rainfall intensity is associated with varying health effects, with extreme events linked to an increasing relative risk for all cause, cardiovascular, and respiratory mortality. The observed associations varied with local climate and urban infrastructure.
Introduction
Emerging evidence from epidemiological studies suggests a compelling association between rainfall events and adverse health outcomes,1 2 particularly the transmission of infectious diseases.3 The influence of rainfall events on non-communicable diseases, however, remains understudied.4 5 Current evidence, derived mainly from specific locations,6 7 has failed to capture the diverse health effects of regional variations in rainfall characteristics. Extreme rainfall events can result in rapid meteorological changes that potentially lead to an interaction with harmful aerosols,8 9 which can contribute to an increased risk for various cardiovascular6 10 and respiratory conditions.10
Several challenges hinder comprehensive understanding of the association between rainfall events and health outcomes. Firstly, most studies defined rainfall events using traditional centile methods,11 12 13 and the variation in centile thresholds used across studies has led to mixed results. This problem, compounded by limitations such as restricted geographical locations and short study durations,6 has prevented consensus from being reached. Secondly, these traditional centile methods failed to reflect local rainfall patterns and did not follow the World Meteorological Organization criteria for identifying important events14: High intensity (substantial rainfall within a brief period), low frequency, and short duration.14 Thirdly, the association between rainfall intensity and health outcomes was likely non-linear. Although moderate rainfall can mitigate summer heat and help reduce air pollution, which in turn might reduce some environmental health risks,15 high intensity rainfall events of low frequency and short duration may have a particularly harmful effect on health, as such events can result in rapid meteorological changes, increased run-off, overwhelmed infrastructures,16 increased breeding of pathogens, and increased risk of different kinds of pollutants, including particulate matter and chemicals,13 17 which can potentially exacerbate health conditions.
Climate change is intensifying the variability in precipitation18 19 and extreme rainfall events both daily and overall.20 21 An awareness of the effects of these extreme events is crucial for understanding the complex health consequences of climate change. Using an intensity-duration-frequency model to combine the three rainfall indices (high intensity, low frequency, short duration) with mortality data from 34 countries or regions, we estimated associations between mortality (all cause, cardiovascular, and respiratory) and rainfall events with different return periods (the expected average time between occurrences of an extreme event of a certain magnitude) and crucial effect modifiers, including climatic, socioeconomic, and urban environmental conditions. The findings should help improve our understanding of the effect of rainfall on health and guide health services to better respond to rainfall related health risks in the context of climate change.
Methods
Study population
We obtained data on mortality from the Multi-Country Multi-City (MCC) Collaborative Research Network database (https://mccstudy.lshtm.ac.uk/), which is described elsewhere.22 23 24 Daily mortality records, provided by local statistical authorities within each participating country or region, were categorised using ICD-9 and ICD-10 (international classification of diseases, ninth and 10th revisions, respectively) codes. We obtained records for non-external mortality (ICD-10 codes: A00-R99; ICD-9 codes: 001-799) or all cause mortality depending on data availability, as well as specific data for cardiovascular diseases (ICD-10 codes: I00-I99; ICD-9 codes: 390-459) and respiratory diseases (ICD-10 codes: J00-J99; ICD-9 codes: 460-519) across a total of 743 locations from 1980 to 2020. These locations were selected based on the representativeness of the mortality data in relation to demographic characteristics of populations across diverse conditions in different countries and regions.25 26 The appendix in our previous study provides a list of these locations and details on the sources of mortality data for each.24
Exposure data
Our primary climate data consisted of surface precipitation rates on an hourly scale (hourly rainfall amount) sourced from the land component of the fifth generation of the European reanalysis (ERA5-Land) dataset.27 This dataset integrates satellite and ground observations through advanced assimilation and modelling to estimate climate variables globally on land. We obtained data on a regular 0.1°×0.1° grid for 1980 to 2020 for each location, although the available years differed by location. The data were aggregated to daily scales, accounting for different time zones. Numerous studies have validated the precision of this precipitation data across various regions.28 29 Furthermore, considering the distinct effects of rainfall and snowfall,30 we also collected data on snow depth. To differentiate between rain and snow in subsequent analyses, we treated rainfall days with a daily mean temperature <0°C and a snow depth >0 as non-precipitation days, assuming such conditions likely indicated snowfall or mixed precipitation rather than pure rainfall.30
In addition, we sourced precipitation data from two additional datasets for sensitivity tests. The MSWEP (multi-source weighted-ensemble precipitation) dataset31 provided data with a three hour temporal resolution, matching ERA5-Land’s spatial resolution for 1980-2020. We also utilised the IMERG (integrated multi-satellite retrievals for global precipitation measurement) dataset, which offers half hourly precipitation measurements from 2000 to 2021.32 IMERG uses >10 satellites with passive microwave radiometers to deliver calibrated global estimates of precipitation, a method widely recognised for its reliability.33 From these datasets, for each city in our study, we extracted data from the grid point closest to the city centre’s coordinates. We also obtained daily mean temperature and relative humidity data from the MCC database, originally sourced from local monitoring stations. Further details on data collection and assessment procedures are provided elsewhere.26 Finally, we collected daily (24 hour average) pollutant concentrations, specifically particulate matter with aerodynamic diameters ≤2.5 μm (PM2.5) and eight hour maximum ozone, from local monitoring stations. These air pollution data were available only for 372 locations across 19 countries or regions, as described previously.23
Definitions of rainfall events
Rainfall patterns often do not follow a normal distribution owing to periods of no rain leading to many zero values and extreme weather events causing skewness.34 35 Geographical factors also contribute to uneven distributions across regions.36 Therefore, centile methods that are suitable for defining heat waves or cold spells based on daily temperature data may be inadequate for rainfall analysis. Impactful events are usually intense and rare, necessitating a definition that accounts for both intensity and frequency.
Following the World Meteorological Organization’s guideline,14 we used the extreme value theorem to assess the threshold of extreme rainfall events at daily scale with a specific return period. Return periods are the expected average times between occurrences of an extreme event of a certain magnitude. This approach involves considering the frequency, duration, and intensity of extreme events at the same time.37 Specifically, we used the regional frequency analysis framework38 with the generalised extreme value function to model the distribution of annual maximum daily cumulative rainfall across all locations.39 Using this fitted generalised extreme value model, we established thresholds for rainfall events with return periods of one year, two years, and five years for each group of cities with similar climatic and precipitation conditions. For example, if the cumulative probability of daily cumulative rainfall reached 50% based on the fitted distribution, this level of rainfall was then associated with a two year return period. This does not imply that such events happen regularly every two years but rather describes their probability of occurrence over a long term horizon. The supplementary methods provide details on the methodological and validation approaches. The methodology is commonly employed in research examining the health effects of extreme climatic conditions40 and is extensively used in hydrological studies.37 41 42 43
Furthermore, to illustrate the gradation of relative risk associated with increasing rainfall intensity from relatively moderate to extreme, we calculated the percentage of daily accumulated rainfall exceeding the two year return period threshold as a continuous variable, denoted as PE2 (fig 1). This measure provides a continuous index for quantifying the relative intensity of extreme rainfall events.
Fig 1.
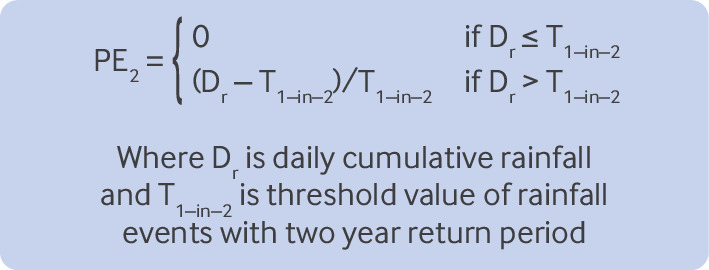
Equation to calculate percentage of daily accumulated rainfall exceeding a two year return period. The return period is the expected average time between occurrences of an extreme event of a certain magnitude
As an example, if the threshold for a two year return period was 50 mm and a city experienced 70 mm in a day, the index value would be calculated as 40%, meaning that on that day the city experienced rainfall that was 40% greater than expected for a two year return period. We selected this threshold based on our preliminary research findings, where no significant effect was observed for rainfall events with a one year and two year return period.43
Statistical analysis
To investigate the association between extreme rainfall events and daily mortality, we employed an established two stage analytical method.26 44 45 This approach follows the methods detailed in previous studies,43 45 ensuring consistency and comparability in our analysis.
In the first stage of our analysis, we utilised quasi-Poisson regression models to assess the city specific associations between extreme rainfall events and daily mortality. The quasi-Poisson regression model was adopted as it has been found to fit data for daily mortality count well in many related studies.45 46 For the main model, we employed distributed lag models to evaluate the cumulative impact of exposure to extreme rainfall as a binary variable. Based on return period analysis, we identified a rainfall threshold for three different return periods (one year, two years, and five years). Days with rainfall below certain threshold were assigned a value of 0, indicating either no rainfall or precipitation not meeting the criteria. Conversely, days exceeding this threshold were assigned a value of 1. We modelled the lag structure using a natural cubic B spline with four degrees of freedom and two internal knots, which were evenly spaced in the log scale.47 The lag period was set to 14 days, which was informed by our preliminary findings in east Asia.43 To control the potential confounding effects of non-optimal temperatures, we used a distributed lag non-linear model to introduce a cross basis function of daily mean temperature in the main model. This distributed lag non-linear model comprised a quadratic B spline with three internal knots placed at the 10th, 75th, and 90th centiles of location specific temperature distributions.26 Additionally, the model included a lag response curve characterised by a natural cubic spline with three internal knots evenly spaced on the log scale with the same 14 day lag setting.26 We also included a natural cubic B spline of time with seven degrees of freedom per year26 and an indicator of the day of the week to control for the long term and seasonal trends and weekly variations.26 In the second stage, we pooled the city specific estimates to obtain overall relative risk based on coefficients and covariance matrices of the results from each city using random effects meta-analysis with restricted maximum likelihood estimation.48 Specifically, these associations were pooled to generate an overall level and were based on several key factors related to the rainfall effect to explore potential effect modifications that have not been adjusted for, including local climate types (according to the Köppen climate classification, a widely used global climate zoning method49), annual cumulative precipitation, the average annual standard deviation of daily cumulative precipitation for all rainfall days, economic conditions (reflected in the country’s income class, 2010 version), population density, and the average percentage of vegetation coverage (2010 version). The supplementary file provides detailed information on the data sources for each factor. We examined heterogeneity using Cochran’s Q test and the I2 statistic.50
For the analysis of PE2, we employed a similar process, with one key distinction. In the first step, we replaced the distributed lag model function of extreme rainfall events (treated as a binary variable) with a distributed lag non-linear model cross basis function of PE2, treating it as a continuous variable. For this function, we utilised the same distributed lag non-linear model settings as those applied for daily mean temperature. This modification in the model allowed us to capture the cumulative effects of varying rainfall intensities while maintaining methodological consistency.
To strengthen the reliability of our analysis, we focused on locations that had matched a minimum of two days of rainfall events with a five year return period during the study period to exclude locations lacking adequate exposure events. Additionally, we excluded rainfall events if during event days no hourly total rainfall exceeded 4 mm, according to the World Meteorological Organization’s criteria.51 Finally, to ensure the robustness of our findings, we conducted a series of sensitivity analyses (see supplementary methods), including adjustments to some key model settings, the incorporation of alternative precipitation datasets, and controlling for air pollution and flood events.
Effect modifications
To investigate how various factors might modify the health effects of extreme rainfall events across different populations, we applied random effects meta-regressions with maximum likelihood estimation. This approach allowed us to compare the cumulative relative risks across different levels of potential effect modifiers.45 The potential effect modifiers examined include the classification of local climate types, the amount of total annual precipitation, the yearly average standard deviation of precipitation on rainfall days, economic status, population density, and average vegetation coverage.
Patient and public involvement
This study utilised data from worldwide death registries, which inherently restricts direct involvement of patients or their relatives owing to data privacy and security regulations across different counties. In addition, no funding was allocated for patient or public involvement, and given the nature of the data, such interaction was not feasible. At the same time, given the nature of this study it was not appropriate or feasible to involve members of the public directly. Moreover, the research was primarily data driven, with no clear mechanism for public participation in the analysis process. Importantly, this study was partially inspired by observed respiratory health effects after extreme rainfall events, which reflect the issues patients face.
Results
After excluding 98 locations owing to insufficient exposure events, where the number of matched extreme rainfall days with a five year return period was less than two days, this study encompassed 645 locations across 34 countries or regions. Results of the Kolmogorov-Smirnov test, a method used to verify the reliability of the results (see supplementary methods for details), showed that the generalised extreme value distributions were accepted at a 5% significance level for all included locations (see supplementary figure S1). Our analysis included 109 954 744 all cause, 31 164 161 cardiovascular, and 11 817 278 respiratory deaths. During the study period, we identified a total of 50 913 rainfall events with a one year return period, 8362 events with a two year return period, and 3301 events with a five year return period. Figure 2 illustrates the distribution patterns of the threshold of rainfall events with the three levels of return periods. Locations that experienced higher daily cumulative rainfall within the same return period were predominantly in South America, east Asia, and South East Asia. Supplementary table S1 provides a statistical overview of the included locations, detailing the economic classification, number of included locations, and number of matched extreme rainfall events during the study period for each country or region.
Fig 2.

Daily cumulative thresholds for extreme rainfall events in 645 locations. Analysis used the intensity-duration-frequency model across the three return periods. The return period is the expected average time between occurrences of an extreme event of a certain magnitude
We identified a global positive association between all cause mortality and extreme rainfall events with a five year return period (fig 3). However, shorter return periods of one year or two years were not associated with increased risks of all cause mortality. Overall, across all locations, a day of extreme rainfall with a five year return period was associated with a cumulative relative risk across 1-14 lag days of 1.08 (95% confidence interval (CI) 1.05 to 1.11) for daily all cause mortality. Cause specific analyses showed that rainfall events with a two year return period were associated with increased daily respiratory mortality (1.14, 1.05 to 1.23), whereas no significant effect was observed for the same period for cardiovascular mortality (1.01, 0.98 to 1.04). Furthermore, five year return period events were associated with increased risk for both cardiovascular (1.05, 1.02 to 1.08) and respiratory mortality (1.29, 1.19 to 1.39), with the risk for respiratory mortality notably higher than for cardiovascular mortality (P<0.05). Conversely, rainfall events with a one year return period showed no effect on either cardiovascular or respiratory mortality. The lag-response function results (see supplementary figure S2) indicate that the peak relative risk occurred on the day of the event (lag 0), with a substantial decrease observed by lag 3 to 4 days. Sensitivity analyses (see supplementary file) further confirmed the robustness of these findings.
Fig 3.

Cumulative relative risks of all cause, cardiovascular, and respiratory mortality associated with exposure to extreme rainfall events with three different return periods across all locations, and by territory or region. CI=confidence interval; NA=not available
Figure 4 illustrates the distinct intensity-response associations between PE2 and all cause mortality. The association displayed a negative trend when PE2 was below a critical threshold. However, the curve showed a consistent upward trajectory once PE2 surpassed 50%, with a substantial positive effect emerging as PE2 surpassed about 100%, indicative of rainfall intensities more than twice the threshold for the two year return period. The pattern for cardiovascular mortality closely mirrored that of all cause mortality, which initially presented a negative association but shifted to a positive association at higher PE2 values. The association for respiratory mortality escalated steeply and more pronouncedly with increasing PE2 values.
Fig 4.
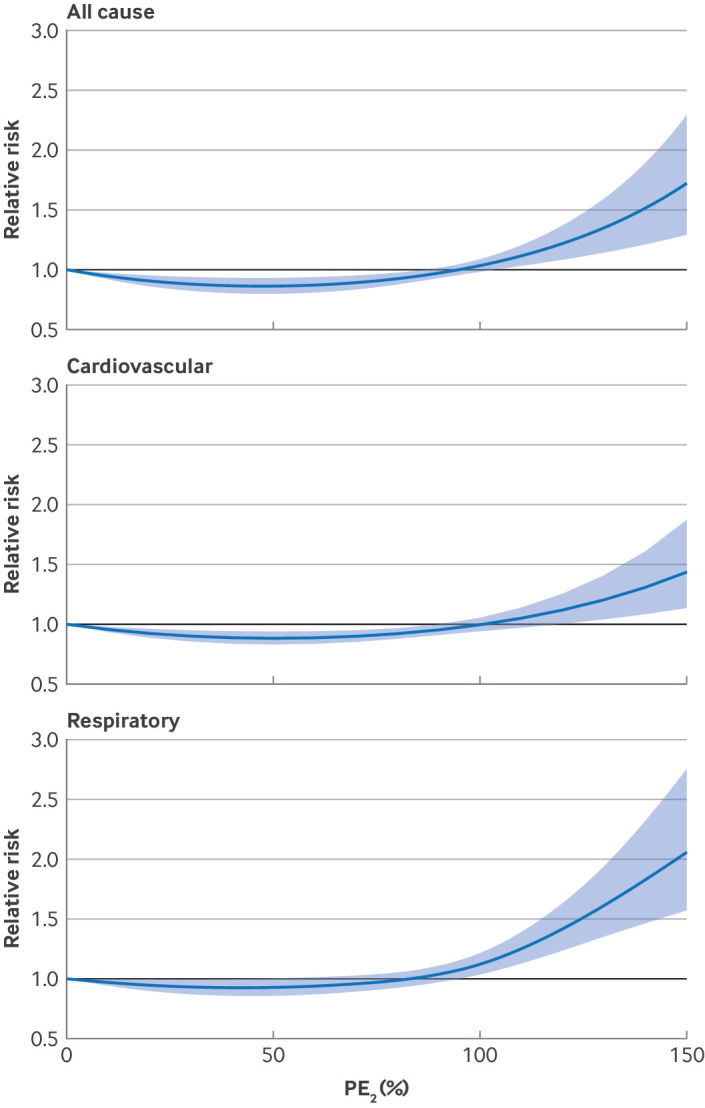
Exposure-response function of the relative risks of all cause, cardiovascular, and respiratory mortality associated with daily accumulated rainfall exceeding the two year return period threshold (PE2). The return period is the expected average time between occurrences of an extreme event of a certain magnitude
Regional specific analyses revealed variations in the relative risk of daily mortality associated with different rainfall events (fig 3). For events with a two year return period, the relative risk ranged from 0.85 (95% CI 0.74 to 0.99) in Australia to 1.23 (1.08 to 1.38) in South America. This variation became more pronounced for events with a five year return period, with the relative risk in South America reaching 1.43 (1.19 to 1.67). When regions were compared, the estimated impact of extreme rainfall events on mortality in South America was notably higher than the global average for both two year and five year return periods. North America’s estimates were close to the global average. Additionally, increases in mortality risk (P<0.05) were observed with five year return period events in east Asia, North America, and South America. When health outcomes were compared, risk ratios for respiratory mortality exceeded those for cardiovascular mortality across most regions.
The analyses of effect modification (see table 1 and supplementary figures S3-S7) revealed that climate types modified the mortality risk associated with extreme rainfall events with a five year return period. The relative risk of all cause mortality was found to be higher in locations characterised by scarce vegetation coverage or lower variability in daily precipitation (P<0.05). Additionally, a statistically significant association with all cause mortality was observed predominantly in lower income countries. The association with respiratory mortality was also more pronounced in locations with scarce vegetation coverage and lower variability in daily precipitation. Evidence that average annual precipitation and population density modified these associations is, however, limited.
Table 1.
Cumulative relative risks of daily mortality associated with exposure to extreme rainfall events with a five year return period* by climate zones, precipitation conditions, socioeconomic status, income class, vegetation coverage, and population density
| All cause mortality | Cardiovascular mortality | Respiratory mortality | ||||||
|---|---|---|---|---|---|---|---|---|
| Relative risk (95% CI) | P value for difference | Relative risk (95% CI) | P value for difference | Relative risk (95% CI) | P value for difference | |||
| Climate zones† | ||||||||
| Tropical (n=81) | 0.95 (0.84 to 1.06) | Ref | 0.81 (0.60 to 1.03) | Ref | 0.99 (0.83 to 1.15) | Ref | ||
| Arid (n=48) | 1.17 (1.04 to 1.30) | 0.01 | 1.08 (0.97 to 1.19) | 0.02 | 1.23 (0.90 to 1.56) | 0.23 | ||
| Temperate (n=405) | 1.08 (1.03 to 1.12) | 0.03 | 1.03 (0.95 to 1.11) | 0.045 | 1.29 (1.08 to 1.51) | 0.02 | ||
| Continental (n=111) | 1.03 (0.93 to 1.13) | 0.06 | 0.93 (0.81 to 1.05) | 0.26 | 1.25 (1.03 to 1.47) | 0.05 | ||
| Annual average precipitation (mm) | ||||||||
| <834.5 (n=158) | 1.10 (0.93 to 1.27) | Ref | 1.08 (0.92 to 1.26) | Ref | 1.30 (0.98 to 1.63) | Ref | ||
| 834.5-1231.5 (n=166) | 1.05 (0.95 to 1.15) | 0.27 | 1.08 (0.93 to 1.26) | 1.00 | 1.23 (1.05 to 1.51) | 0.73 | ||
| 1231.5-1487.8 (n=166) | 1.07 (0.93 to 1.21) | 0.61 | 0.93 (0.86 to 1.01) | 0.54 | 1.20 (1.10 to 1.29) | 0.46 | ||
| >1487.8 (n=155) | 1.07 (0.93 to 1.21) | 1.00 | 0.99 (0.86 to 1.12) | 0.15 | 1.24 (0.96 to 1.53) | 0.38 | ||
| Daily precipitation SD (mm) | ||||||||
| <4.6 (n=156) | 1.13 (1.04 to 1.21) | Ref | 1.10 (1.05 to 1.15) | Ref | 1.45 (1.13 to 1.77) | Ref | ||
| 4.6-6.9 (n=158) | 1.01 (0.93 to 1.09) | 0.01 | 1.03 (0.98 to 1.08) | 0.22 | 1.13 (0.97 to 1.29) | 0.08 | ||
| 6.9-8.3 (n=173) | 0.95 (0.90 to 1.01) | 0.01 | 1.04 (0.89 to 1.30) | 0.21 | 1.21 (0.95 to 1.47) | 0.135 | ||
| >8.3 (n=158) | 1.02 (0.95 to 1.09) | 0.02 | 0.99 (0.82 to 1.16) | 0.07 | 1.20 (0.95 to 1.45) | 0.10 | ||
| Income class | ||||||||
| Low (n=146) | 1.18 (1.05 to 1.31) | Ref | 1.09 (0.93 to 1.25) | Ref | 1.29 (1.11 to 1.47) | Ref | ||
| Lower middle (n=355) | 1.09 (0.94 to 1.24) | 0.08 | 1.07 (0.95 to 1.19) | 0.46 | 1.20 (1.04 to 1.36) | 0.51 | ||
| Upper middle (n=54) | 1.04 (0.93 to 1.15) | 0.47 | 1.03 (0.95 to 1.11) | 0.52 | 1.20 (0.95 to 1.45) | 0.71 | ||
| High (n=90) | 1.03 (0.74 to 1.32) | 0.07 | 1.04 (0.77 to 1.31) | 0.31 | 1.27 (0.91 to 1.63) | 0.84 | ||
| Average vegetation coverage (%) | ||||||||
| <72.8 (n=164) | 1.20 (1.10 to 1.30) | Ref | 1.04 (1.01 to 1.07) | Ref | 1.79 (1.31 to 2.27) | Ref | ||
| 72.8-79.0 (n=171) | 1.07 (1.01 to 1.13) | 0.10 | 0.98 (0.84 to 1.12) | 0.44 | 1.19 (1.07 to 1.31) | 0.035 | ||
| 79.0-83.3 (n=159) | 0.96 (0.90 to 1.02) | 0.01 | 0.99 (0.84 to 1.14) | 0.77 | 1.10 (0.95 to 1.25) | 0.015 | ||
| >83.8 (n=151) | 0.97 (0.90 to 1.04) | 0.01 | 1.06 (0.85 to 1.27) | 0.67 | 1.12 (0.90 to 1.34) | 0.02 | ||
| Population density (people/km2) | ||||||||
| <116 (n=167) | 1.04 (0.96 to 1.16) | Ref | 1.02 (0.98 to 1.06) | Ref | 1.27 (0.98 to 1.46) | Ref | ||
| 116-301 (n=174) | 1.15 (0.83 to 1.47) | 0.41 | 1.05 (0.99 to 1.11) | 0.38 | 1.18 (1.06 to 1.30) | 0.76 | ||
| 301-998 (n=170) | 1.35 (0.65 to 2.05) | 0.415 | 0.97 (0.90 to 1.14) | 0.78 | 1.15 (0.98 to 1.33) | 0.48 | ||
| >998 (n=134) | 1.05 (0.94 to 1.18) | 0.91 | 0.97 (0.86 to 1.09) | 0.57 | 1.10 (0.79 to 1.63) | 0.48 | ||
CI=confidence interval; SD=standard deviation.
The expected average time between occurrences of an extreme event of a certain magnitude.
Tropical zone was selected as reference for this part of comparison (see supplementary table S6). This climatic zone identified the highest frequency of extreme rainfall events, which provides a more stable estimate for reliable statistical comparisons.
Discussion
In this study, we performed an analysis of mortality risks associated with extreme rainfall using a large dataset covering 34 countries or regions and employing a uniform methodology to define rainfall events based on intensity, frequency, and duration. Our analysis identified associations between extreme rainfall events and daily mortality from all causes, as well as specifically from cardiovascular and respiratory diseases. Furthermore, the intensity-response functions revealed a protective effect of daily rainfall at moderate to heavy intensities, which transitioned to a marked increase in mortality risk at extreme rainfall intensities. Moreover, the substantial health effects of these extreme rainfall events were found to vary by climate types. Extreme rainfall events were more severe in locations with lower variability of precipitation or scarce vegetation coverage. Our study utilised a comprehensive database encompassing information from multiple countries, territories, and continents. The analysis incorporated death records from numerous locations from 1980 to 2020, providing a global perspective on the effect of extreme rainfall events on health.
Only a few studies have explored the association between exposure to rainfall events and risk of mortality from non-external causes, with results showing notable inconsistencies.52 53 54 This variation might be attributed to the lack of a consistent definition of rainfall events and the limited geographical scope of most previous investigations. Similar to our results, many studies have found harmful effects of extreme precipitation. A study in rural Bangladesh observed a 0.6% increase in daily mortality for every additional millimetre of rainfall beyond 100 mm per day in the 5-19 age group.53 A study in Burkina Faso found an increased risk of malaria related death associated with precipitation levels ≥453 mm.1 Additionally, a notable connection has been observed between thunderstorms accompanying extreme rainfall and an increase in respiratory morbidity and mortality, especially in people with asthma.55 56 However, limited studies have shown either insignificant effects or protective effects of rainfall, aligning with certain aspects of our findings. A recent study in tropical regions of Africa found no significant association between extreme rainfalls and incidence of respiratory diseases among children.11 A study in India observed a significant reduction in risk of all cause mortality during the first week after extreme rainfall.2 Similarly, research conducted in rural areas of Ecuador found that extreme rainfall events were associated with a decreased incidence of diarrhoea after wet periods.57 These findings align with our observations that some levels of precipitation may not only be non-detrimental but could also offer certain protective effects.
Biological mechanisms
Although the biological mechanisms linking rainfall intensity with health outcomes are not fully elucidated, several plausible explanations may be helpful to clarify the complex association observed in our study. Firstly, moderate to high intensity rainfall may exert protective effects through two primary mechanisms: Improvement in air quality (rainfall can decrease the concentration of PM2.5 particles in the atmosphere,58 potentially mitigating its adverse effects on all cause, respiratory, and cardiovascular mortality), and behavioural changes (rainfall may alter people’s daily patterns, leading to more time spent indoors).59 This reduction in direct exposure to outdoor air pollution and non-optimal temperatures could explain the protective effect observed on various health outcomes when intensity is not extreme. Secondly, as rainfall intensity increases, the initial protective effects may be affected by a cascade of negative impacts: Critical disruptions to resources, physiological impacts, and indirect effects.
Critical resource disruptions—Intense rainfall can cause major disruptions to healthcare access. It might damage infrastructure, leading to power outages and hindering essential medical services, both of which can particularly affect older people and those with chronic illnesses, who often require consistent access to drugs and healthcare.60 Intense rainfall can compromise water and food quality by allowing pathogenic microorganisms to reproduce and spread,61 leading to diarrhoeal diseases, infections, and associated mortality.62 63
Physiological effects—Increased humidity levels facilitate the growth of airborne pathogens,64 potentially triggering allergic reactions and respiratory problems, particularly in vulnerable individuals.65 Rapid shifts in atmospheric pressure can reduce the partial pressure of oxygen in the body,66 67 leading to cardiovascular and respiratory complications.60 Furthermore, major temperature fluctuations often accompanying rainfall days can affect both respiratory and cardiovascular systems.68
Indirect effects—Extreme rainfall can have profound effects on mental health, inducing stress and anxiety that may exacerbate pre-existing mental health conditions69 and indirectly contributing to increased total mortality from non-external causes. Overall, these pathways elucidate the complex associations between rainfall intensity and health outcomes observed in our study. Moderate rainfall (PE2 <100%) shows protective effects, whereas intense rainfall (PE2 >100%) leads to important harmful effects as negative factors accumulate. Supplementary analysis of the five year return period threshold also corroborated these findings, showing a weaker protective effect and a rapid transition to harmful impacts beyond 50% of the threshold rather than 100% as seen with PE2 (see supplementary figure S7). Moreover, the rapid onset of these negative factors during extreme rainfall days explained the observed lag pattern (see supplementary figure S2), with health effects most pronounced on the first day and then gradually diminishing.
We found several factors that could influence the variability in the health effects of extreme rainfalls. Notably, the associations were modified by climate types and baseline variations in rainfall intensity. Many studies have identified an association between a region’s resilience to extreme climate events and its natural conditions.70 71 Areas with stable rainfall patterns, such as arid regions or areas with low variability in rainfall, often have weaker adaptive capacities for heavy rainfall. A recent study suggested that the risk of rainfall associated infectious diseases is more pronounced in arid areas, likely due to the more major environmental changes caused by brief heavy downpours.72 Furthermore, many studies have highlighted a negative correlation between per capita gross domestic product and mortality resulting from extreme climate events.73 74 This finding suggests that socioeconomic development enhances urban resilience and the ability to respond rapidly to extreme rainfall related disasters. Conversely, unemployment and social inequality can exacerbate health problems during such events. It has also been noted that the effect of extreme rainfall is influenced by vegetation coverage, with higher vegetation coverage correlating with greater adaptive capacity for managing the consequences of extreme rainfall.75 In contrast, we found no significant effect modifications linked to annual average precipitation and population density. Greater cumulative rainfall does not necessarily equate to a higher frequency of extreme rain events. Adaptation to extreme rainfall is most noticeable in areas with more frequent and variable rainfalls.76 Additionally, population density does not indicate socioeconomic conditions or residential environments,77 and thus it does not serve as a reliable predictor of resilience to disasters. Regional variations in the effects of extreme rainfall can be attributed to several factors, in addition to the varying adequacy of identified total events. In east Asia, higher intensity of extreme rainfall events (fig 2) coupled with rapid urbanisation and reduced green space coverage (see supplementary figure S5) could increase overall vulnerability. In North America, varying green space coverage (see supplementary figure S5) combined with ageing infrastructure, inadequate updates to drainage and water management systems, and uneven distribution of resources, are important explanatory factors for the observed effects.78 In South America, major effects likely arise from limited access to medical resources.79
Policy implications
Our findings have some practical implications. Policy makers should be aware of the implications of rainfall related risks on public health, encompassing both non-communicable and infectious diseases. Hospitals and clinicians need vigilance when monitoring and managing patients during the rainy season, and researchers need to investigate the exact mechanisms that could then be targeted by systematic protective action. Considering the health risks associated with the modification of rainfall by local climatic conditions and vegetation coverage, localised or health education initiatives centred on communities would be imperative to increase awareness about the risks to health of severe rainfalls, and increasing vegetation coverage is a reasonable adaptation strategy. A multidisciplinary approach and integrated strategies are essential to navigate public health interventions to cope with extreme rainfall. This necessitates not only the fortification of meteorological observation and early warning systems but also the implementation of robust measures across urban planning and social security sectors to bolster the resilience of communities and individuals against disasters.
Limitations of this study
This study has some limitations. Firstly, although the analysis included 34 major counties or regions on six continents, the analysed locations were mainly located in east Asia, Europe, and North America, with fewer in Latin America and Africa. This limitation restricts the global representativeness of the estimated risks. Furthermore, the study areas were all urban centres, therefore the associations between extreme rainfall and mortality might differ in rural areas, and we only used mortality statistics from nearly 700 cities globally. Although our results provide a broad, population level perspective, they do not capture granular details of individual factors such as age, sex, race, urban/rural residence, or specific clinical settings. In addition, this study could be limited by its ecological study design as with most previous epidemiological studies on the impact of climate related events.26 80 As such, this study was unable to analyse specific personal factors, interventions, or clinic based practices. A more granular study focusing on individual features or clinical settings would be a valuable next step in this line of research. Secondly, the accuracy of our assessment outcomes may be influenced by potential exposure misclassification arising from our reliance on modelled output precipitation data.81 This issue might further be compounded by the limited spatial resolution inherent in the rainfall databases employed. We incorporated a diverse array of rainfall databases to sensitively test our findings. Thirdly, in a global study spanning several decades, diagnostic or coding errors in health data may have occurred. The effect of these errors on our results is likely to be minimal, however, given most data used in this study were from urban centres and from government data sources. Finally, our analysis captured only a part of the health effects of heavy rainfalls. It notably lacked data such as hospital admission records and health outcome data from rural areas and excluded data on external causes of mortality. These limitations highlight the need for further comprehensive studies to evaluate a broader range of health effects associated with extreme rainfall events.
Conclusions
Our multicountry analysis provided epidemiological evidence for associations between heavy rainfall events and mortality from all causes and cardiovascular or respiratory causes, based on a global dataset and standard statistical methods. Notably, the intensity-response curves for the health effect of heavy rainfalls showed a non-linear trend, transitioning from a protective effect at heavy rainfall levels to a risk of major harm as rainfall intensity became extreme. Furthermore, the significant effects of extreme events were modified by climate types and were most pronounced in locations characterised by low variability in precipitation or scarce vegetation coverage. These findings underscore the need for comprehensive public health strategies, developed through collaboration among meteorological, public health, and urban planning sectors. Such strategies are crucial to mitigate the broad health effects of extreme rainfall. This is especially important considering the well established trend of increasing short term rainfall intensity as a result of climate change.
What is already known on this topic
Climate change is intensifying the frequency and severity of short term rainfall events
Current research on rainfall related health risks primarily focuses on infectious diseases and severe storms, overlooking broader impacts such as those on cardiovascular and respiratory health, and how varying rainfall intensities affect these condition
Existing evidence is predominantly derived from specific locations, and regional variations in rainfall intensity, duration, frequency, and timing can lead to diverse health impacts across different geographical areas
What this study adds
This study found that local factors such as climate conditions, climate type, and vegetation coverage have a potential influence on rainfall related all cause and cardiovascular and respiratory mortality
These results can enhance understanding of the broad and complex health impacts of climate change, guiding the development of localised adaptation measures for policy makers
Web extra.
Extra material supplied by authors
Supplementary material: Additional information
Contributors: AS is the senior author. CH designed the study. CH, SB, VH. KC, and SZ coordinated the work, conducted the statistical analysis, and took the lead in drafting the manuscript and interpreting the results. AG, MB, HK, DR, BA, JS, FS, AMV-C, and FD provided substantial scientific input in interpreting the results and drafting the manuscript. YH, JJ, NR, YG, ST, PM, MC, PS, EL, JK, HO, EI, MP, PG, AZ, YK, MHD, EA, AO, JK, SR, SP, GC, XS, SS, JM, JH, LH, NS, FA, HKi, WL, MH, AT, CI, BF, MR, YLG, SCP, SO, SL, AZ, TND, and DVD provided the data and contributed to the revision of the submitted version of the manuscript. CH and AS are the guarantors. The corresponding author attests that all listed authors meet authorship criteria and that no others meeting the criteria have been omitted.
Funding: CH was supported by the Alexander von Humboldt Foundation. The funders had no role in considering the study design or in the collection, analysis, interpretation of data, writing of the report, or decision to submit the article for publication.
Competing interests: All authors have completed the ICMJE uniform disclosure form at https://www.icmje.org/disclosure-of-interest/ and declare: Support from the Alexander von Humboldt Foundation no financial relationships with any organizations that might have an interest in the submitted work in the previous three years; no other relationships or activities that could appear to have influenced the submitted work.
Transparency: The lead authors (CH and AS) affirm that the manuscript is an honest, accurate, and transparent account of the study being reported; that no important aspects of the study have been omitted; and that any discrepancies from the study as planned have been explained.
Dissemination to participants and related patient and public communities: We plan to disseminate the findings through multiple channels. A press release will be coordinated with our communication department, as well as with the communication departments of some key coauthors. The results will also be shared with students during lectures. Additionally, we will present this study at some well known academic conferences and will continue to engage with journalists, particularly when discussing the health impacts of climate change. We are also exploring the possibility of a blog post or other accessible formats to increase public engagement with the study.
Provenance and peer review: Not commissioned; externally peer reviewed.
Publisher’s note: Published maps are provided without any warranty of any kind, either express or implied. BMJ remains neutral with regard to jurisdictional claims in published maps.
Ethics statements
Ethical approval
Not required.
Data availability statement
Health outcome data have been collected within the MCC (Multi-Country Multi-City) Collaborative Research Network (https://mccstudy.lshtm.ac.uk/) under a data sharing agreement and cannot be made publicly available. Researchers can refer to MCC participants listed as coauthors for information on accessing the data for each country. The time series rainfall data from ERA5-Land, MSWEP, and IMERG are publicly accessible from their respective websites (https://cds.climate.copernicus.eu; https://www.gloh2o.org/mswep/; https://disc.gsfc.nasa.gov/datasets/GPM_3IMERGHHL_06/summary)
References
- 1. Arisco NJ, Sewe MO, Bärnighausen T, Sié A, Zabre P, Bunker A. The effect of extreme temperature and precipitation on cause-specific deaths in rural Burkina Faso: a longitudinal study. Lancet Planet Health 2023;7:e478-89. 10.1016/S2542-5196(23)00027-X [DOI] [PubMed] [Google Scholar]
- 2. Ingole V, Juvekar S, Muralidharan V, Sambhudas S, Rocklöv J. The short-term association of temperature and rainfall with mortality in Vadu Health and Demographic Surveillance System: a population level time series analysis. Glob Health Action 2012;5:44-52. 10.3402/gha.v5i0.19118 [DOI] [PMC free article] [PubMed] [Google Scholar]
- 3. Aune KT, Davis MF, Smith GS. Extreme precipitation events and infectious disease risk: a scoping review and framework for infectious respiratory viruses. Int J Environ Res Public Health 2021;19:165. 10.3390/ijerph19010165 [DOI] [PMC free article] [PubMed] [Google Scholar]
- 4. Kraay ANM, Man O, Levy MC, Levy K, Ionides E, Eisenberg JNS. Understanding the impact of rainfall on diarrhea: testing the concentration-dilution hypothesis using a systematic review and meta-analysis. Environ Health Perspect 2020;128:126001. 10.1289/EHP6181 [DOI] [PMC free article] [PubMed] [Google Scholar]
- 5. Peirce AM, Espira LM, Larson PS. Climate change related catastrophic rainfall events and non-communicable respiratory disease: a systematic review of the literature. Climate (Basel) 2022;10:101 10.3390/cli10070101. [DOI] [Google Scholar]
- 6. Tang C, Liu X, He Y, et al. Association between extreme precipitation and ischemic stroke in Hefei, China: Hospitalization risk and disease burden. Sci Total Environ 2020;732:139272. 10.1016/j.scitotenv.2020.139272 [DOI] [PubMed] [Google Scholar]
- 7. Jiang G, Ji Y, Chen C, et al. Effects of extreme precipitation on hospital visit risk and disease burden of depression in Suzhou, China. BMC Public Health 2022;22:1710. 10.1186/s12889-022-14085-w [DOI] [PMC free article] [PubMed] [Google Scholar]
- 8. Zheng Z, Zhao C, Lolli S, et al. Diurnal variation of summer precipitation modulated by air pollution: observational evidences in the beijing metropolitan area. Environ Res Lett 2020;15:094053 10.1088/1748-9326/ab99fc. [DOI] [Google Scholar]
- 9. Luan T, Guo X, Zhang T, et al. Below-cloud aerosol scavenging by different-intensity rains in Beijing city. J Meteorol Res 2019;33:126-37 10.1007/s13351-019-8079-0. [DOI] [Google Scholar]
- 10. Chen Y, Chang Z, Zhao Y, et al. Association of extreme precipitation with hospitalizations for acute myocardial infarction in Beijing, China: A time-series study. Front Public Health 2022;10:1024816. 10.3389/fpubh.2022.1024816 [DOI] [PMC free article] [PubMed] [Google Scholar]
- 11. Uttajug A, Ueda K, Seposo X, Francis JM. Association between extreme rainfall and acute respiratory infection among children under-5 years in sub-Saharan Africa: an analysis of Demographic and Health Survey data, 2006-2020. BMJ Open 2023;13:e071874. 10.1136/bmjopen-2023-071874 [DOI] [PMC free article] [PubMed] [Google Scholar]
- 12. Chan K, Ban J, Ma Y, et al. Association of exposure to extreme rainfall events with cause-specific mortality in North Carolina, US. Environmental Research Letters 2024;19:044006. 10.1088/1748-9326/ad2dd2 [DOI] [Google Scholar]
- 13. Lai H, Hales S, Woodward A, et al. Effects of heavy rainfall on waterborne disease hospitalizations among young children in wet and dry areas of New Zealand. Environ Int 2020;145:106136. 10.1016/j.envint.2020.106136 [DOI] [PubMed] [Google Scholar]
- 14.World Meteorological Organization. Guidelines on the Definition and Characterization of Extreme Weather and Climate Events. https://library.wmo.int/records/item/68658-guidelines-for-the-wmo-evaluation-of-records-of-weather-and-climate-extremes
- 15. Kwak H-Y, Ko J, Lee S, et al. Identifying the correlation between rainfall, traffic flow performance and air pollution concentration in Seoul using a path analysis. Transp Res Procedia 2017;25:3552-63 10.1016/j.trpro.2017.05.288. [DOI] [Google Scholar]
- 16. Hosseinzadehtalaei P, Tabari H, Willems P. Climate change impact on short-duration extreme precipitation and intensity–duration–frequency curves over Europe. J Hydrol (Amst) 2020;590:125249 10.1016/j.jhydrol.2020.125249. [DOI] [Google Scholar]
- 17. Lefrancq M, Jadas-Hécart A, La Jeunesse I, Landry D, Payraudeau S. High frequency monitoring of pesticides in runoff water to improve understanding of their transport and environmental impacts. Sci Total Environ 2017;587-588:75-86. 10.1016/j.scitotenv.2017.02.022 [DOI] [PubMed] [Google Scholar]
- 18. Donat MG, Lowry AL, Alexander LV, et al. More extreme precipitation in the world’s dry and wet regions. Nat Clim Chang 2016;6:508-13 10.1038/nclimate2941. [DOI] [Google Scholar]
- 19. Zhang W, Zhou T, Wu P. Anthropogenic amplification of precipitation variability over the past century. Science 2024;385:427-32. 10.1126/science.adp0212 [DOI] [PubMed] [Google Scholar]
- 20. Ham Y-G, Kim J-H, Min S-K, et al. Anthropogenic fingerprints in daily precipitation revealed by deep learning. Nature 2023;622:301-7. 10.1038/s41586-023-06474-x [DOI] [PMC free article] [PubMed] [Google Scholar]
- 21. Chinita MJ, Richardson M, Teixeira J, et al. Global mean frequency increases of daily and sub-daily heavy precipitation in ERA5. Environ Res Lett 2021;16:074035 10.1088/1748-9326/ac0caa. [DOI] [Google Scholar]
- 22. Liu C, Chen R, Sera F, et al. Interactive effects of ambient fine particulate matter and ozone on daily mortality in 372 cities: two stage time series analysis. BMJ 2023;383:e075203. 10.1136/bmj-2023-075203 [DOI] [PMC free article] [PubMed] [Google Scholar]
- 23. Meng X, Liu C, Chen R, et al. Short term associations of ambient nitrogen dioxide with daily total, cardiovascular, and respiratory mortality: multilocation analysis in 398 cities. BMJ 2021;372:n534. 10.1136/bmj.n534 [DOI] [PMC free article] [PubMed] [Google Scholar]
- 24. Chen G, Guo Y, Yue X, et al. Mortality risk attributable to wildfire-related PM2·5 pollution: a global time series study in 749 locations. Lancet Planet Health 2021;5:e579-87. 10.1016/S2542-5196(21)00200-X [DOI] [PubMed] [Google Scholar]
- 25. Liu C, Chen R, Sera F, et al. Ambient particulate air pollution and daily mortality in 652 cities. N Engl J Med 2019;381:705-15. 10.1056/NEJMoa1817364 [DOI] [PMC free article] [PubMed] [Google Scholar]
- 26. Gasparrini A, Guo Y, Hashizume M, et al. Mortality risk attributable to high and low ambient temperature: a multicountry observational study. Lancet 2015;386:369-75. 10.1016/S0140-6736(14)62114-0 [DOI] [PMC free article] [PubMed] [Google Scholar]
- 27. Muñoz-Sabater J, Dutra E, Agustí-Panareda A, et al. ERA5-Land: A state-of-the-art global reanalysis dataset for land applications. Earth Syst Sci Data 2021;13:4349-83 10.5194/essd-13-4349-2021. [DOI] [Google Scholar]
- 28. Xu J, Ma Z, Yan S, et al. Do ERA5 and ERA5-land precipitation estimates outperform satellite-based precipitation products? A comprehensive comparison between state-of-the-art model-based and satellite-based precipitation products over mainland China. J Hydrol (Amst) 2022;605:127353 10.1016/j.jhydrol.2021.127353. [DOI] [Google Scholar]
- 29. Gomis-Cebolla J, Rattayova V, Salazar-Galán S, et al. Evaluation of ERA5 and ERA5-Land reanalysis precipitation datasets over Spain (1951-2020). Atmos Res 2023;284:106606 10.1016/j.atmosres.2023.106606. [DOI] [Google Scholar]
- 30. Kotz M, Levermann A, Wenz L. The effect of rainfall changes on economic production. Nature 2022;601:223-7. 10.1038/s41586-021-04283-8 [DOI] [PubMed] [Google Scholar]
- 31. Beck HE, Wood EF, Pan M, et al. MSWEP V2 global 3-hourly 0.1 precipitation: methodology and quantitative assessment. Bull Am Meteorol Soc 2019;100:473-500 10.1175/BAMS-D-17-0138.1. [DOI] [Google Scholar]
- 32.Huffman GJ, Bolvin DT, Nelkin EJ, et al. Integrated Multi-satellitE Retrievals for GPM (IMERG) technical documentation. https://gpm.nasa.gov/sites/default/files/document_files/IMERG_doc.pdf
- 33. Huffman GJ, Bolvin DT, Braithwaite D, et al. Integrated Multi-satellite Retrievals for the Global Precipitation Measurement (GPM) Mission (IMERG). In: Levizzani V, Kidd C, Kirschbaum DB, Kummerow CD, Nakamura K, Turk FJ. (eds). Satellite Precipitation Measurement. Advances in Global Change Research, vol 67. Springer, 2020.. 10.1007/978-3-030-24568-9_19. [DOI] [Google Scholar]
- 34. Trenberth KE, Dai A, Rasmussen RM, et al. The changing character of precipitation. Bull Am Meteorol Soc 2003;84:1205-18 10.1175/BAMS-84-9-1205. [DOI] [Google Scholar]
- 35. Monjo R, Martin‐Vide J. Daily precipitation concentration around the world according to several indices. Int J Climatol 2016;36:3828-38 10.1002/joc.4596. [DOI] [Google Scholar]
- 36. Wang H, Xuan Y. Spatial Variation of Extreme Rainfall Observed From Two Century‐Long Datasets. Geophys Res Lett 2021;48:e2020GL091933. https://agupubs.onlinelibrary.wiley.com/doi/full/10.1029/2020GL091933 [Google Scholar]
- 37. Koutsoyiannis D, Kozonis D, Manetas A. A mathematical framework for studying rainfall intensity-duration-frequency relationships. J Hydrol (Amst) 1998;206:118-35 10.1016/S0022-1694(98)00097-3. [DOI] [Google Scholar]
- 38. Le Gall P, Favre A-C, Naveau P, et al. Improved regional frequency analysis of rainfall data. Weather Clim Extrem 2022;36:100456 10.1016/j.wace.2022.100456. [DOI] [Google Scholar]
- 39. Sivapalan M, Blöschl G. Transformation of point rainfall to areal rainfall: Intensity-duration-frequency curves. J Hydrol (Amst) 1998;204:150-67 10.1016/S0022-1694(97)00117-0. [DOI] [Google Scholar]
- 40. Lüthi S, Fairless C, Fischer EM, et al. Rapid increase in the risk of heat-related mortality. Nat Commun 2023;14:4894. [DOI] [PMC free article] [PubMed] [Google Scholar]
- 41. Rogger M, Kohl B, Pirkl H, et al. Runoff models and flood frequency statistics for design flood estimation in Austria–Do they tell a consistent story? J Hydrol (Amst) 2012;456-457:30-43 10.1016/j.jhydrol.2012.05.068. [DOI] [Google Scholar]
- 42. Merz B, Aerts J, Arnbjerg-Nielsen K, et al. Floods and climate: emerging perspectives for flood risk assessment and management. Nat Hazards Earth Syst Sci 2014;14:1921-42 10.5194/nhess-14-1921-2014. [DOI] [Google Scholar]
- 43. He C, Kim H, Hashizume M, et al. The overlooked health impacts of extreme rainfall exposure in 30 East Asian cities. Nat Sustain 2024;7:423-31 10.1038/s41893-024-01294-x. [DOI] [Google Scholar]
- 44. Vicedo-Cabrera AM, Scovronick N, Sera F, et al. The burden of heat-related mortality attributable to recent human-induced climate change. Nat Clim Chang 2021;11:492-500. 10.1038/s41558-021-01058-x [DOI] [PMC free article] [PubMed] [Google Scholar]
- 45. Yang Z, Huang W, McKenzie JE, et al. MCC Collaborative Research Network . Mortality risks associated with floods in 761 communities worldwide: time series study. BMJ 2023;383:e075081. [DOI] [PMC free article] [PubMed] [Google Scholar]
- 46. Huang W, Li S, Vogt T, et al. Global short-term mortality risk and burden associated with tropical cyclones from 1980 to 2019: a multi-country time-series study. Lancet Planet Health 2023;7:e694-705. 10.1016/S2542-5196(23)00143-2 [DOI] [PubMed] [Google Scholar]
- 47. Guo Y, Gasparrini A, Armstrong BG, et al. Heat wave and mortality: a multicountry, multicommunity study. Environ Health Perspect 2017;125:087006. 10.1289/EHP1026 [DOI] [PMC free article] [PubMed] [Google Scholar]
- 48. Sera F, Gasparrini A. Extended two-stage designs for environmental research. Environ Health 2022;21:1-13. [DOI] [PMC free article] [PubMed] [Google Scholar]
- 49.Köppen W. Das Geographische System der Klimate [The Geographical System of Climates]. In: Handbuch der Klimatologie, vol 1(part C). Gebrüder Borntraeger, 1936. [Google Scholar]
- 50. Gasparrini A, Armstrong B, Kenward MG. Multivariate meta-analysis for non-linear and other multi-parameter associations. Stat Med 2012;31:3821-39. 10.1002/sim.5471 [DOI] [PMC free article] [PubMed] [Google Scholar]
- 51.World Meteorological Organization. Precipitation. Retrieved 17 Aug 2024 from https://community.wmo.int/en/activity-areas/aviation/hazards/precipitation.
- 52. Alam N, Lindeboom W, Begum D, Streatfield PK. The association of weather and mortality in Bangladesh from 1983-2009. Glob Health Action 2012;5:53-60. 10.3402/gha.v5i0.19121 [DOI] [PMC free article] [PubMed] [Google Scholar]
- 53. Lindeboom W, Alam N, Begum D, Streatfield PK. The association of meteorological factors and mortality in rural Bangladesh, 1983-2009. Glob Health Action 2012;5:61-73. 10.3402/gha.v5i0.19063 [DOI] [PMC free article] [PubMed] [Google Scholar]
- 54. Diboulo E, Sié A, Rocklöv J, et al. Weather and mortality: a 10 year retrospective analysis of the Nouna Health and Demographic Surveillance System, Burkina Faso. Glob Health Action 2012;5:6-13. 10.3402/gha.v5i0.19078 [DOI] [PMC free article] [PubMed] [Google Scholar]
- 55. Grundstein A, Sarnat SE, Klein M, et al. Thunderstorm associated asthma in Atlanta, Georgia. Thorax 2008;63:659-60. 10.1136/thx.2007.092882 [DOI] [PMC free article] [PubMed] [Google Scholar]
- 56. Park J-H, Lee E, Fechter-Leggett ED, et al. Associations of Emergency Department Visits for Asthma with Precipitation and Temperature on Thunderstorm Days: A Time-Series Analysis of Data from Louisiana, USA, 2010-2012. Environ Health Perspect 2022;130:87003. 10.1289/EHP10440 [DOI] [PMC free article] [PubMed] [Google Scholar]
- 57. Carlton EJ, Eisenberg JN, Goldstick J, Cevallos W, Trostle J, Levy K. Heavy rainfall events and diarrhea incidence: the role of social and environmental factors. Am J Epidemiol 2014;179:344-52. 10.1093/aje/kwt279 [DOI] [PMC free article] [PubMed] [Google Scholar]
- 58. Sun Y, Zhao C, Su Y, et al. Distinct impacts of light and heavy precipitation on PM2. 5 mass concentration in Beijing. Earth Space Sci 2019;6:1915-25 10.1029/2019EA000717. [DOI] [Google Scholar]
- 59. Horanont T, Phithakkitnukoon S, Leong TW, Sekimoto Y, Shibasaki R. Weather effects on the patterns of people’s everyday activities: a study using GPS traces of mobile phone users. PLoS One 2013;8:e81153. 10.1371/journal.pone.0081153 [DOI] [PMC free article] [PubMed] [Google Scholar]
- 60. Parks RM, Anderson GB, Nethery RC, Navas-Acien A, Dominici F, Kioumourtzoglou MA. Tropical cyclone exposure is associated with increased hospitalization rates in older adults. Nat Commun 2021;12:1545. 10.1038/s41467-021-21777-1 [DOI] [PMC free article] [PubMed] [Google Scholar]
- 61. Nabi G, Ali M, Khan S, Kumar S. The crisis of water shortage and pollution in Pakistan: risk to public health, biodiversity, and ecosystem. Environ Sci Pollut Res Int 2019;26:10443-5. 10.1007/s11356-019-04483-w [DOI] [PubMed] [Google Scholar]
- 62. Kirby M, Nagel C, Uejio C, et al. Effect of precipitation on clinic-diagnosed enteric infections in children in Rwanda: An observational study. Lancet Planet Health 2018;2:S14 10.1016/S2542-5196(18)30099-8. [DOI] [Google Scholar]
- 63. Galan DI, Roess AA, Pereira SVC, Schneider MC. Epidemiology of human leptospirosis in urban and rural areas of Brazil, 2000-2015. PLoS One 2021;16:e0247763. 10.1371/journal.pone.0247763 [DOI] [PMC free article] [PubMed] [Google Scholar]
- 64. Jang GI, Hwang CY, Cho BC. Effects of heavy rainfall on the composition of airborne bacterial communities. Front Environ Sci Eng 2018;12:12 10.1007/s11783-018-1008-0. [DOI] [Google Scholar]
- 65. Choi Y-J, Lee KS, Oh J-W. The impact of climate change on pollen season and allergic sensitization to pollens. Immunol Allergy Clin North Am 2021;41:97-109. 10.1016/j.iac.2020.09.004 [DOI] [PubMed] [Google Scholar]
- 66. Vencloviene J, Braziene A, Dobozinskas P. Short-term changes in weather and space weather conditions and emergency ambulance calls for elevated arterial blood pressure. Atmosphere 2018;9:114 10.3390/atmos9030114. [DOI] [Google Scholar]
- 67. Vencloviene J, Beresnevaite M, Cerkauskaite S, et al. The effects of weather on depressive symptoms in patients after cardiac surgery. Psychol Health Med 2023;28:682-92. [DOI] [PubMed] [Google Scholar]
- 68. Guo Y, Gasparrini A, Armstrong BG, et al. Temperature variability and mortality: a multi-country study. Environ Health Perspect 2016;124:1554-9. 10.1289/EHP149 [DOI] [PMC free article] [PubMed] [Google Scholar]
- 69. Lee S, Salvador C, Tuel A, Vicedo-Cabrera AM. Exploring the association between precipitation and hospital admission for mental disorders in Switzerland between 2009 and 2019. PLoS One 2023;18:e0283200. 10.1371/journal.pone.0283200 [DOI] [PMC free article] [PubMed] [Google Scholar]
- 70. Wilby RL. Resilience viewed through the lens of climate change and water management. Water 2020;12:2510 10.3390/w12092510. [DOI] [Google Scholar]
- 71.Food and Agriculture Organization of the United Nations. 2012. Proceedings of the OECD-FAO Agricultural Outlook. https://www.fao.org/fileadmin/templates/agphome/documents/faooecd/oecd_proceedings.pdf.
- 72. Ceccato P, Vancutsem C, Klaver R, Rowland J, Connor SJ. A vectorial capacity product to monitor changing malaria transmission potential in epidemic regions of Africa. J Trop Med 2012;2012:595948. [DOI] [PMC free article] [PubMed] [Google Scholar]
- 73. Dieleman H. Organizational learning for resilient cities, through realizing eco-cultural innovations. J Clean Prod 2013;50:171-80 10.1016/j.jclepro.2012.11.027. [DOI] [Google Scholar]
- 74. Callahan CW, Mankin JS. Globally unequal effect of extreme heat on economic growth. Sci Adv 2022;8:eadd3726. 10.1126/sciadv.add3726 [DOI] [PMC free article] [PubMed] [Google Scholar]
- 75. Fatti CE, Patel Z. Perceptions and responses to urban flood risk: Implications for climate governance in the South. Appl Geogr 2013;36:13-22 10.1016/j.apgeog.2012.06.011. [DOI] [Google Scholar]
- 76. Tabari H. Climate change impact on flood and extreme precipitation increases with water availability. Sci Rep 2020;10:13768. 10.1038/s41598-020-70816-2 [DOI] [PMC free article] [PubMed] [Google Scholar]
- 77. Greenberg M, Schneider D. Population density: What does it really mean in geographical health studies? Health Place 2023;81:103001. 10.1016/j.healthplace.2023.103001 [DOI] [PubMed] [Google Scholar]
- 78. Parks RM, Benavides J, Anderson GB, et al. Association of tropical cyclones with county-level mortality in the US. JAMA 2022;327:946-55. 10.1001/jama.2022.1682 [DOI] [PMC free article] [PubMed] [Google Scholar]
- 79. Haakenstad A, Yearwood JA, Fullman N, et al. GBD 2019 Healthcare Access and Quality Collaborators . Assessing performance of the Healthcare Access and Quality Index, overall and by select age groups, for 204 countries and territories, 1990-2019: a systematic analysis from the Global Burden of Disease Study 2019. Lancet Glob Health 2022;10:e1715-43. 10.1016/S2214-109X(22)00429-6 [DOI] [PMC free article] [PubMed] [Google Scholar]
- 80. He C, Kim H, Hashizume M, et al. The effects of night-time warming on mortality burden under future climate change scenarios: a modelling study. Lancet Planet Health 2022;6:e648-57. 10.1016/S2542-5196(22)00139-5 [DOI] [PubMed] [Google Scholar]
- 81. Levy MC, Collender PA, Carlton EJ, et al. Spatiotemporal error in rainfall data: consequences for epidemiologic analysis of waterborne diseases. Am J Epidemiol 2019;188:950-9. 10.1093/aje/kwz010 [DOI] [PMC free article] [PubMed] [Google Scholar]
Associated Data
This section collects any data citations, data availability statements, or supplementary materials included in this article.
Supplementary Materials
Supplementary material: Additional information
Data Availability Statement
Health outcome data have been collected within the MCC (Multi-Country Multi-City) Collaborative Research Network (https://mccstudy.lshtm.ac.uk/) under a data sharing agreement and cannot be made publicly available. Researchers can refer to MCC participants listed as coauthors for information on accessing the data for each country. The time series rainfall data from ERA5-Land, MSWEP, and IMERG are publicly accessible from their respective websites (https://cds.climate.copernicus.eu; https://www.gloh2o.org/mswep/; https://disc.gsfc.nasa.gov/datasets/GPM_3IMERGHHL_06/summary)