

Abstract
How does unconditional income for families in poverty affect parental investments for their young children? Mothers in four US metropolitan areas were randomized to receive a monthly unconditional cash transfer of either $333 per month (high) or $20 per month (low) for the first several years after childbirth. During the first 3 years, high-cash gift households spent more money on child-specific goods and more time on child-specific early learning activities than the low-cash gift group. Few changes were evident in other core household expenditures. Compared with low-cash gift families, high-cash gift families reported lower rates of public benefit receipt and fewer were residing in poverty, although mean income and wealth remain low for the majority of families by year 3. No statistically significant differences were evident in mothers’ participation in paid work, children’s time in childcare or mothers’ subjective wellbeing.
US social welfare and income-support benefits have been found to improve children’s health and development across the life course1–3 Benefits experienced during the early periods of childhood, in particular, are linked to higher earnings and improved cardiovascular health in adulthood4–6. Collectively, this body of empirical work points to promising short- and long-run returns to children’s development from social investments in poverty alleviation strategies in the United States1. Yet, whether benefits accrued to children from these policies are due to resulting higher household income versus other changes in family behaviour remains an open question. Although economic models inform the design, and anticipated impact, of poverty alleviation strategies, whether and how income support affects parent investments in their children and their children’s environments as predicted by these models is also not well understood. Evidence about how families respond to direct income support as a poverty alleviation strategy is crucial in light of economic policy debates about how parents will spend the money and whether parents will reduce their time in the labour market or become dependent on government aid7–9. This study reports on the causal impacts of income support, via a monthly unconditional cash transfer, on family investments in young children residing in poverty in the United States, contributing to both these scholarly and policy literatures.
Stylized economic models posit the ways in which monetary resources and information, as well as parent beliefs and preferences, contribute to children’s human capital development starting as early as birth and accumulating through young adulthood10. This model has been used to guide research on the impact of child-directed early intervention and education services, as well as home visiting and related parenting-skill programmes through channels of increased parent information and beliefs about children’s development11; thereby improving the quality of parenting found to produce economically meaningful returns to early human capital development12,13. The element of the model related to the effect of parent inputs in goods or time from increased monetary (versus educational or informational) resources that may also render improvements in children’s human capital has not been as rigorously tested14–19. Higher income among financially resource-constrained families might affect purchases of basic household goods, or the quality or quantity of child-specific purchases, including educational materials or childcare20–24, or it might enable parents to restructure their time in the labour force, time with children and/or time spent investing in their own human capital, health or self-care, including sleep25–29. Further, the ways in which parent investments in goods and time are allocated may be responsive to the format, design and conditions of the income receipt. Income support conditioned on behaviours, such as employment or children’s enrollment in schooling, typically generate change on the targeted behaviours. Income support without conditions may also affect certain behaviours related to earmarking and use of funds by eliciting psychological or social meaning based on the origin of the money or other design features30–32.
The unconditional income support examined in this study offers an opportunity to inform these scientific and related policy questions in a contemporary time period. Most US-based cash supports, including those provided through tax credits, are conditioned on behaviours, such as participation in work-related activities or proof of formal earnings, thus making it difficult to unbundle the impact of household or parental employment behaviour and children’s time in non-parental care, for example, from the impact of higher household income33–37. Other US social welfare benefits, many of which have also been found to benefit children in some way2,5,38–41, are typically in-kind and earmarked for spending on certain goods, such as food, housing or medical care. In these cases food, housing or medical care consumption are likely to increase in addition to potential increases in net household income, thus making it difficult to untangle which aspects may have led to improvements in children’s development. Recent investigations of the 2021 expanded US child tax credit are making noteworthy contributions to our understanding of the effects of unconditional income on household expenditures and family wellbeing42. However, even here, assumptions necessary to make causal inferences hinge on successful implementation and whether derived estimates of a time-limited expansion during the height of the coronavirus disease 2019 (COVID-19) pandemic can be generalized43.
In this Article, to address these gaps in understanding of how unconditional income support for families residing in poverty can contribute to parent investments in children’s human capital development, we specifically examine expenditures on child-specific and other goods, maternal time in the labour market and with children obtained as part of an ongoing, multi-site and multi-year randomized controlled trial in the United States. We additionally examine overall maternal happiness, life satisfaction and hope, aspects of subjective wellbeing posited to change in response to redistributive economic policies in contexts of high income inequality (such as the United States) and that stylized economic models posit as influencing investment decisions related to, and allocations of, resources in children, particularly with respect to time spent with children44–47.
The Baby’s First Years (BFY) intervention is a monthly predictable unconditional cash gift disbursed to low-income mothers of newborns starting at the child’s birth. Mothers in the treatment group (termed the ‘high-cash gift group’) receive monthly gifts of $333 ($3,996 per year), while mothers in the control group (termed the ‘low-cash gift group’) receive a $20 monthly gift ($240 per year). The treatment amount is equivalent to increasing the annual income of a family of three residing at the poverty line ($21,330 in 2019) by nearly 20%. The annual cash gift is in the moderate to high range of cash transfers tested in low to middle income nations (typically 8–25% of average household income in the geographic region receiving the cash transfer). It is also similar in magnitude (in today’s dollars) to income supplements experienced by families in prior US welfare-to-work experiments34, similar to the average $3,200 lump-sum income transfers to families with children from the Earned Income Tax Credit35 and, more recently, within the range of many of the guaranteed-income pilots currently being tested in the United States among families with children48.
A number of steps were taken to ensure that receipt of the cash transfer does not deem families ineligible for other government benefits and services and thus mechanically reduce overall household resources. The cash transfer is a gift available through charitable organizations and, as such, is not taxable. Agreements were secured with state and local officials to minimize risk of the cash gift interfering with eligibility for public benefits, including Temporary Assistance for Needy Families (TANF), Supplemental Nutrition Assistance Program, Medicaid, childcare subsidies and Head Start. In two of the four sites, we secured state legislation to ensure this; other sites relied on state and local administrative rulings. Mothers were informed of any risk to their income eligibility for other programmes before agreeing to receive the cash gift.
Once mothers consented to participate in the research study, and completed a baseline survey, they were offered the opportunity to receive the cash gift. The cash gift debit card was activated immediately after randomization to the high- or low-cash gift group. Participants continued to receive the cash gifts on an opt-out (versus opt-in) basis. The Mastercard debit card used to disburse the monthly cash allotment was co-labelled with a ‘4MyBaby’ logo. The cash disbursements began upon enrollment, and were automatically loaded on the debit card each month on the day of the child’s birth date, accompanied by a text message reminder.
Results
Hypotheses on the causal impact of the unconditional cash gift on family processes were broadly conceptualized as following two pathways: an investment pathway and a stress pathway. This study’s analysis focuses on the investment pathway as informed by stylized economic models and the implicated pre-registered outcomes on household income, household and children’s time, goods investments and general subjective wellbeing. These pre-registered outcomes represent a portion of what has been pre-registered for the larger project. A full list of pre-registered outcomes for the broader study is available in Table 1.
Table 1 |.
Pre-registered outcomes categorized as informed by hypotheses from the economic model of family investment and the family stress model
| Outcomes | Family investment | Family stress | Other | Data collection waves | Outcome groups used for multiple hypothesis testing |
|---|---|---|---|---|---|
| Maternal and family focused | |||||
| Household poverty status | S | 1, 2, 3 | 1 | ||
| Maternal global happiness | S | 1, 2, 3 | 5 | ||
| Maternal agency (HOPE scale) | S | 1, 2, 3 | 5 | ||
| Number of benefits (social services) received by mother | S | 1, 2, 3 | 2 | ||
| Mother’s education and training participation and attainment | S | 1, 2, 3 | 3 | ||
| Index of child-focused expenditures (since birth) | S | 1, 2, 3 | 4 | ||
| Index of child-focused expenditures (in past 30 days) | S | 1, 2, 3 | 4 | ||
| Cost of paid childcare last week | S | 1, 2, 3 | 4 | ||
| Use of centre-based care in last year | S | 1 | 4 | ||
| Use of centre-based care in last week | S | 2, 3 | 4 | ||
| Parent-child activities index | S | S | 1, 2, 3 | 6 | |
| Index of food insecurity | S | 1, 2, 3 | 1 | ||
| Index of economic stress | S | 1, 2, 3 | 1 | ||
| Maternal perceived stress | S | 1, 2, 3 | |||
| Maternal parenting stress | S | 1, 2 | |||
| Physiological stress (maternal hair cortisol) | S | 1 | |||
| Maternal depression (PHQ-8) | S | 1, 2, 3 | |||
| Maternal anxiety (GAD-7) | S | 2, 3 | |||
| Maternal anxiety (Beck) | S | 1, 3 | |||
| Physical abuse | S | 1,2 | |||
| Frequency of arguing | S | 1,2 | |||
| Romantic relationship quality | S | 1, 2, 3 | |||
| Spanking discipline strategy | S | 1, 2, 3 | |||
| Mother’s positive parenting behaviours (PICCOLO) | S | ||||
| Mother’s time to labour market re-entry from birth | S | 1 | 3 | ||
| Mother’s time to full-time labour market re-entry from birth | S | 1 | 3 | ||
| Index of perceptions of neighbourhood safety | S | 1, 2, 3 | |||
| Index of housing quality | S | 1 | |||
| Homelessness | S | 1, 2, 3 | |||
| Excessive residential mobility | S | 1, 2, 3 | |||
| Neighbourhood poverty | S | 1, 2, 3 | |||
| Alcohol and cigarette use | S | 1, 3 | |||
| Opioid use | S | 1, 3 | |||
| Index of chaos in the home | S | 1, 2 | |||
| Maternal global health | S | 1, 2 | |||
| Maternal sleep | S | 1, 3 | |||
| Adult word count (LENA) | S | 1 | |||
| Conversational turns (LENA) | S | 1 | |||
| Child focused | |||||
| Maternal concern for language delay | P | 1 | |||
| Socio-emotional problems (BITSEA) | S | 1, 2 | |||
| Behaviour/emotional problems | P | 3 | |||
| Maternal concern for behavioural and social-emotional problems | P | 3 | |||
| Age 1 resting brain function | S | 1 | |||
| Sleep problemsa | P, S | 1, 2, 3 | |||
| Index of overall healtha | P, S | 1, 2, 3 | |||
| Consumption of healthy foods | S | 2 | |||
| Consumption of unhealthy foods | S | 2 | |||
| Parents’ Evaluation of Developmental Status (PEDS) | S | 3 | |||
| Total ‘predictive concerns’ in the PEDS | S | 3 | |||
Registered as secondary outcome in waves 1 and 2, and as primary outcome in wave 3. ‘P’ denotes primary outcomes and ‘S’ denotes secondary outcomes. HOPE, Adult Hope Scale; PHQ, Personal Health Questionnaire Depression scale; GAD, Generalized Anxiety Disorder (GAD-7) scale; PICCOLO, Parenting Interactions with Children: Checklist of Observations Linked to Outcomes; LENA, Language Environment Analysis; BITSEA, Brief Infant-Toddler Social-Emotional Assessment.
To answer the question of how the BFY unconditional cash gift affects expenditures, time use and wellbeing as proposed in this study, we calculated intent-to-treat (ITT) point estimates of the regression-adjusted differences between the high- and low-cash gift groups, following within-wave pre-registration analysis protocols inclusive of multiple comparison adjustments. The list of pre-registered outcomes and families of outcomes used for adjusting for multiple hypotheses testing are presented in Table 1.
Table 2 presents the main ITT findings for each data collection wave and pooled. Figures 1–3 show the ITT estimates and 95% confidence intervals (CIs) with the pooled sample from three annual waves of survey data that draw on the within-wave pre-registered analytic protocols but generate exploratory pooled estimates by stacking the data to represent the first 3 years of cash gift receipt over the course of children’s development from birth to age 3.
Table 2 |.
ITT estimates following pre-registered protocols, by wave, corresponding follow-up age of child and calendar year of data collection, applying multiple hypothesis Westfall–Young family-wise adjustments
| Age 1 (2019–2020) | Westfall-Young adjusted P value |
Age 2 (2020–2021) | Westfall-Young adjusted P value |
Age 3 (2021–2022) | Westfall-Young adjusted P value |
Low-cash gift mean (2019–2022) | Pooled (2019–2022) | Pooled adjusted P value |
|
|---|---|---|---|---|---|---|---|---|---|
| Household income and poverty | |||||||||
| Below 100% of FPL including cash gift (income-to-needs ratio <1) | −0.064* (−0.121 to −0.008) | 0.064 | −0.082** (−0.139 to −0.024) | 0.009 | −0.027 (−0.089 to 0.036) | 0.762 | 0.661 | −0.056** (−0.096 to −0.017) | 0.005 |
| Social Services Receipt Index | −0.080 (−0.285 to 0.124) | 0.428 | −0.167 (−0.368 to 0.033) | 0.096 | −0.219** (−0.363 to −0.074) | 0.004 | 2.657 | −0.151* (−0.296 to −0.006) | 0.006 |
| Mother’s and child’s time use | |||||||||
| Mother’s participation in education and training | 0.014 (−0.045 to 0.072) | 0.985 | 0.033 (−0.028 to 0.094) | 0.284 | 0.059 (−0.001 to 0.119) | 0.049 | 0.257 | 0.035 (−0.007 to −0.078) | 0.203 |
| Child in centre-based care in last year | 0.022 (−0.036 to 0.080) | 0.479 | 0.276 | 0.022 (−0.036 to 0.080) | 0.718 | ||||
| Child in centre-based care in last week | 0.026 (−0.004 to 0.055) | 0.160 | −0.023 (−0.080 to 0.033) | 0.426 | 0.133 | 0.004 (−0.024 to 0.031) | 0.774 | ||
| Parent-child activities index | 0.438* (0.085 to 0.792) | 0.018 | 0.429* (0.045 to 0.812) | 0.027 | 0.383* (0.051 to 0.715) | 0.019 | 12.332 | 0.417** (0.136 to 0.699) | 0.000 |
| Child-specific expenditures ($) | |||||||||
| Purchases of infant durable goods since birth index | 0.243 (−0.023 to 0.509) | 0.187 | 4.803 | 0.243 (−0.023 to 0.509) | 0.198 | ||||
| (Focal) Child-specific expenditures in last 30 days | 66.081** (20.760 to 111.402) | 0.022 | 78.440* (16.157 to 140.723) | 0.042 | 64.137* (12.781 to 115.493) | 0.041 | 348.583 | 67.684** (28.802 to 106.565) | 0.000 |
| Out-of-pocket cost of childcare last week | 7.461 (−4.380 to 19.303) | 0.382 | 5.551 (−6.180 to 17.283) | 0.353 | 6.785 (−4.960 to 18.530) | 0.426 | 48.790 | 6.839 (−1.260 to 14.938) | 0.180 |
| Maternal subjective wellbeing | |||||||||
| Maternal happiness | 0.008 (−0.085 to 0.101) | 0.878 | −0.022 (−0.119 to 0.075) | 0.663 | −0.116* (−0.204 to −0.027) | 0.012 | 1.250 | −0.046 (−0.113 to 0.021) | 0.081 |
| HOPE maternal agency scale | −0.349 (−0.958 to 0.260) | 0.466 | −0.253 (−0.889 to 0.384) | 0.663 | −0.534 (−1.174 to 0.105) | 0.095 | 31.808 | −0.383 (−0.879 to 0.113) | 0.059 |
The 95% CIs in parenthesis correspond to unadjusted P values.
P < 0.05 and
P < 0.01.
Column 9 presents P values of pooled estimates with Westfall–Young family adjustment according to groups of outcomes as specified in Table 1. Family-wise adjustments with pooled data combine follow-up wave 1, wave 2 and wave 3 families from Table 1. The income-to-needs ratio is calculated using annual income. The social services index here counts each item asked within each wave. For waves 1 and 2, this includes TANF, Head Start, childcare subsidies and Low Income Energy Assistance. Child-specific expenditures here include each item asked within wave; for example, money spent on diapers was collected only at wave 1 and money spent on activities was only collected at waves 2 and 3. Covariates from baseline survey: mother’s age, completed schooling, household income, net worth, general health, mental health, race and ethnicity, marital status, number of adults in the household, number of other children born to the mother, smoked during pregnancy, drank alcohol during pregnancy, father living with the mother, child’s sex, birth weight and gestational age at birth. Other covariates: phone interview, child age at interview (in months above target age) and site. Missing covariate values are imputed using the full sample mean among the sample of respondents who completed the wave 1 survey. Missing covariate dummies are included in covariate-adjusted models.
Fig. 1 |. ITT estimates of impact of the high-cash gift on income and poverty status.

Pooled estimates combine n = 931 from wave 1, n = 922 from wave 2 and n = 922 from wave 3 samples. a, ITT estimates of the impact of the high-cash gift on household income poverty status and receipt of income by source, pooled waves 1–3. b, ITT estimates of the impact of the high-cash gift on number of social services received, pooled waves 1–3. c, ITT estimate of the impact of the high-cash gift on household income by source, pooled waves 1–3. The dots represent ITT estimates adjusted for baseline covariates and site and whiskers represent 95% CIs. See Supplementary Fig. 1 and Supplementary Table 1 for more details and full results.
Fig. 3 |. ITT estimates of impact of the high-cash gift on expenditures.
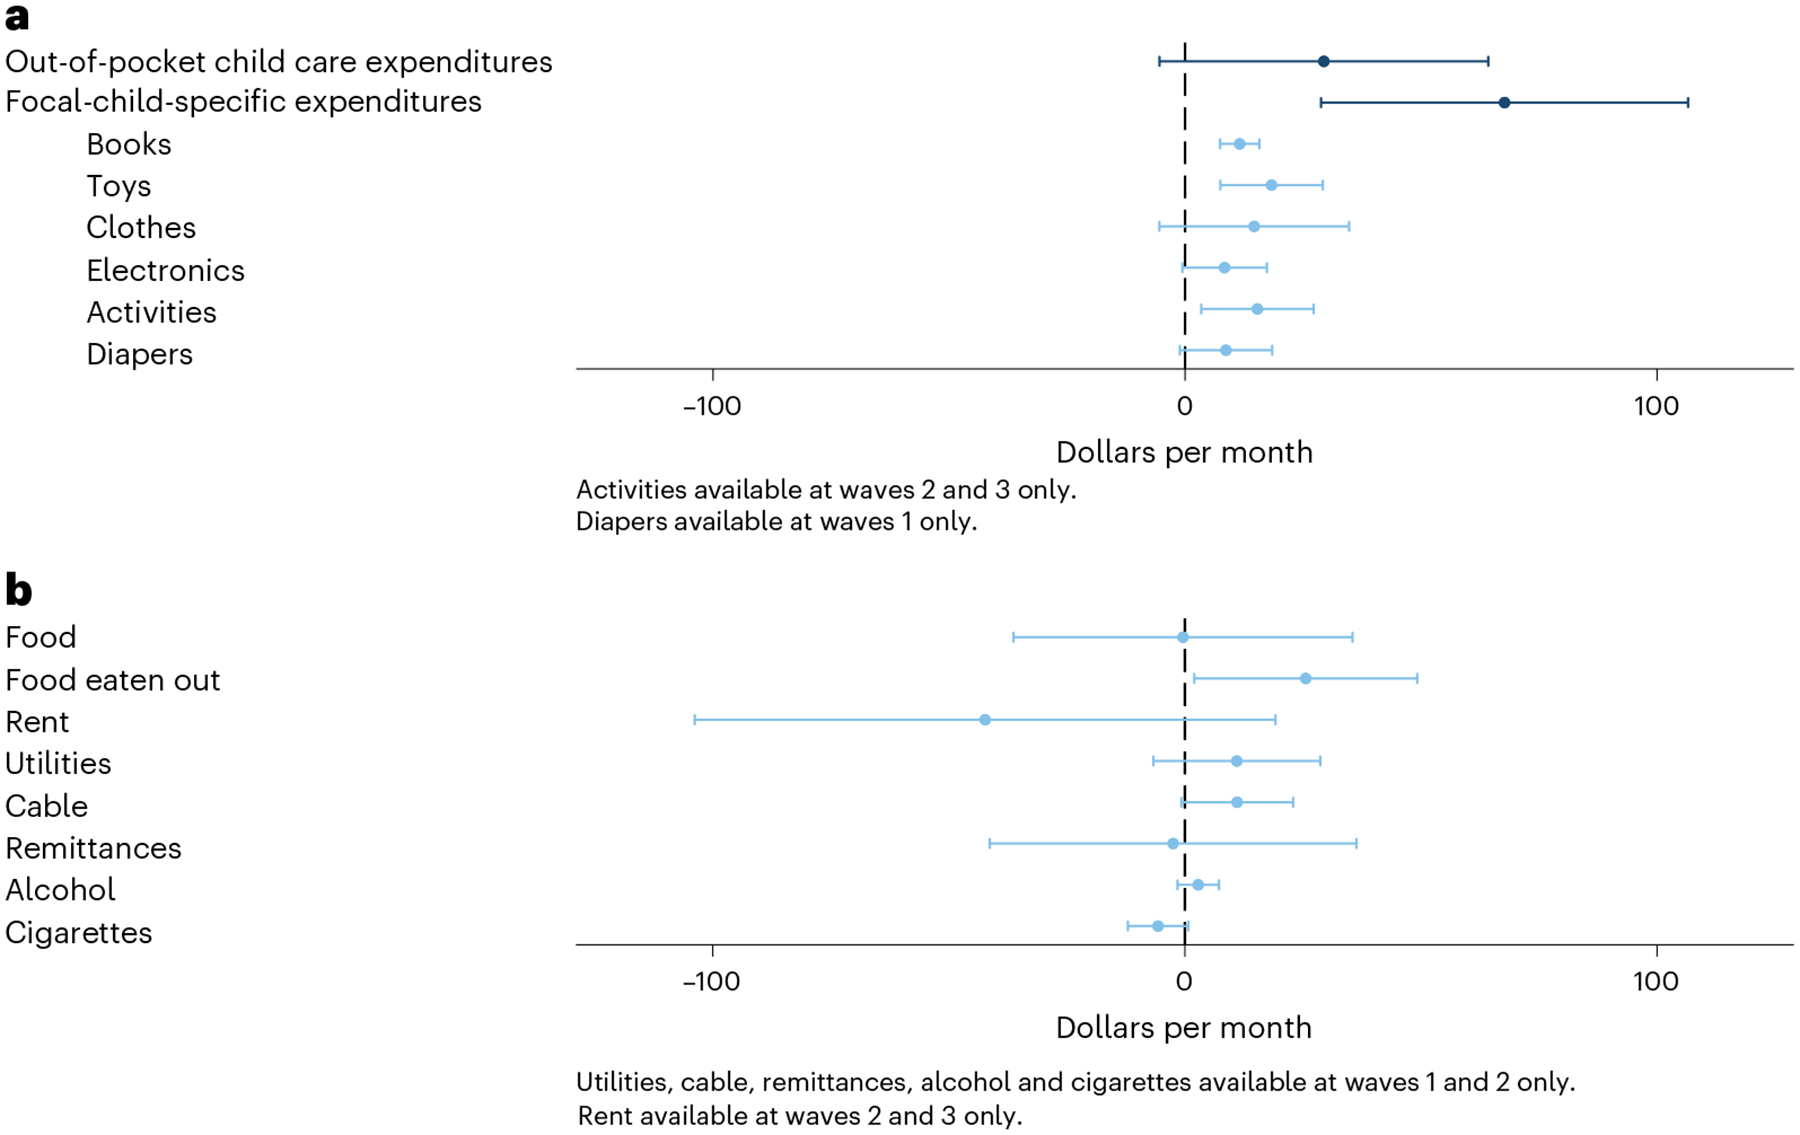
Pooled estimates combine n = 931 from wave 1, n = 922 from wave 2 and n = 922 from wave 3 samples. a, ITT estimates of the impact of the high-cash gift on out-of-pocket childcare and focal child-specific expenditures, pooled waves 1–3. b, ITT estimates of general and other household expenditures, pooled waves 1 to 3. Note: Dots represent ITT estimates adjusted for baseline covariates and site; whiskers represent 95% CIs. See Supplementary Fig. 1 and Supplementary Table 4 for more details and full results.
Details about the study sample, baseline characteristics and equivalence across treatment groups (Table 3) as well as response rates and construction of pre-registered and exploratory measures are provided in Methods. Cash gift uptake is nearly universal among recipient families. ITT estimates are thus to be interpreted as treatment on the treated (see Table 4 and refer to Methods for more discussion of the analyses of uptake from transactions on the debit card).
Table 3 |.
Baseline balance by high and low cash gift groups: full sample (n = 1,000)
| Low-cash gift | High-cash gift | s.d. mean difference | |||||
|---|---|---|---|---|---|---|---|
| Mean (s.d.) or proportion | N | Mean (s.d.) or proportion | N | Hedges’ g | Cox’s index | P value | |
| Child is female | 0.502 | 600 | 0.477 | 400 | −0.05 | 0.458 | |
| Child weight at birth (pounds) | 7.1 (1.08) | 599 | 7.1 (1.01) | 399 | −0.04 | 0.572 | |
| Child gestational age (weeks) | 39.1 (1.25) | 596 | 39.0 (1.24) | 399 | −0.04 | 0.512 | |
| Mother age at birth (years) | 26.8 (5.82) | 600 | 27.4 (5.86) | 400 | 0.10 | 0.113 | |
| Mother education (years) | 11.9 (2.83) | 593 | 11.9 (2.96) | 398 | −0.00 | 0.978 | |
| Mother race/ethnicity: white, non-Hispanic | 0.112 | 600 | 0.085 | 400 | −0.13 | 0.128 | |
| Mother race/ethnicity: Black, non-Hispanic | 0.395 | 600 | 0.443 | 400 | 0.10 | 0.091 | |
| Mother race/ethnicity: multiple, non-Hispanic | 0.040 | 600 | 0.030 | 400 | −0.18 | 0.369 | |
| Mother race/ethnicity: other or unknown | 0.048 | 600 | 0.028 | 400 | −0.32 | 0.066 | |
| Mother race/ethnicity: Hispanic | 0.405 | 600 | 0.415 | 400 | 0.00 | 0.594 | |
| Mother marital status: never married | 0.425 | 600 | 0.495 | 400 | 0.17 | 0.024 | |
| Mother marital status: single, living with partner | 0.260 | 600 | 0.217 | 400 | −0.13 | 0.119 | |
| Mother marital status: married | 0.208 | 600 | 0.215 | 400 | 0.00 | 0.791 | |
| Mother marital status: divorced/separated | 0.050 | 600 | 0.028 | 400 | −0.32 | 0.064 | |
| Mother marital status: other or unknown | 0.057 | 600 | 0.045 | 400 | −0.26 | 0.400 | |
| Mother health is good or better | 0.878 | 600 | 0.917 | 400 | 0.27 | 0.041 | |
| Mother depression (CESD) | 0.7 (0.45) | 600 | 0.7 (0.46) | 400 | 0.02 | 0.805 | |
| Cigarettes per week during pregnancy | 5.0 (21.17) | 595 | 3.5 (11.76) | 397 | −0.09 | 0.111 | |
| Alcohol drinks per week during pregnancy | 0.2 (1.63) | 598 | 0.0 (0.39) | 399 | −0.11 | 0.052 | |
| Number of children born to mother | 2.4 (1.38) | 600 | 2.5 (1.41) | 400 | 0.09 | 0.146 | |
| Number of adults in household | 2.1 (1.00) | 600 | 2.0 (0.96) | 400 | −0.09 | 0.156 | |
| Biological father lives in household | 0.397 | 600 | 0.352 | 400 | −0.13 | 0.154 | |
| Household combined income | 22,465.84 (21,359.96) | 562 | 20,918.15 (16,145.53) | 370 | −0.08 | 0.219 | |
| Household income unknown | 0.063 | 600 | 0.075 | 400 | 0.10 | 0.482 | |
| Household net worth | −1,980.63 (28,640.19) | 531 | −3,308.22 (20,323.38) | 358 | −0.05 | 0.423 | |
| Household net worth unknown | 0.115 | 600 | 0.105 | 400 | −0.12 | 0.644 | |
| Joint test: x2(30)=33.28, P=0.226, n=1,000. | |||||||
P values were derived from a series of ordinary least squares bivariate regressions in which each respective baseline characteristic was regressed on the treatment status indicator using robust standard errors and site-level fixed effects. The bivariate regressions were also run without site-level fixed effects, and the P values differed on average by 0.011. The P values without fixed effects do not appear in the table. The joint test of orthogonality was conducted using a probit model with robust standard errors and site-level fixed effects. Standardized mean differences were calculated using Hedges’ g for continuous variables and Cox’s index for dichotomous variables. If there were more than ten missing cases for a covariate, missing data dummies were included in the table and the joint test. If fewer than ten cases were missing, missing data dummies were not included in the table but were included in the joint test. CESD, Center for Epidemiological Studies Depression.
Table 4 |.
Descriptive analyses of 4MyBaby debit card transactions among BFY mothers who consented for research use of transaction data
| Age 0–1 years | Age 1–2 years | Age 2–3 years | Age 0–3 years | |||||||||
|---|---|---|---|---|---|---|---|---|---|---|---|---|
| All | High cash | Low cash | All | High cash | Low cash | All | High cash | Low cash | All | High cash | Low cash | |
| Purchasing behaviour | ||||||||||||
| Number of unique categories purchased from | 10.6 | 16.6 | 6.3 | 10.1 | 15.7 | 6.0 | 9.7 | 15.0 | 5.8 | 17.6 | 26.2 | 11.5 |
| Only use the debit card at vendors | 53% | 15% | 80% | 53% | 13% | 81% | 51% | 15% | 78% | 31% | 7% | 49% |
| Transactions done at ATMs | 9% | 16% | 4% | 10% | 17% | 4% | 10% | 17% | 4% | 12% | 19% | 7% |
| Total amount that is spent at ATMs (%) | 18% | 35% | 6% | 18% | 35% | 6% | 18% | 34% | 6% | 18% | 35% | 7% |
| Only use the debit card at ATMs | 1% | 1% | 1% | 1% | 1% | 2% | 2% | 3% | 2% | 1% | 1% | 1% |
| Use the card at a mixture of ATM and vendors | 46% | 84% | 19% | 46% | 85% | 17% | 46% | 81% | 20% | 68% | 92% | 50% |
| Haven’t used the card | 2% | 0% | 3% | 2% | 1% | 4% | 2% | 0% | 3% | 1% | 0% | 1% |
| No. of months card was used | 10.08 | 11.52 | 9.03 | 10.06 | 11.44 | 9.05 | 9.87 | 11.41 | 8.73 | 30.11 | 34.83 | 26.78 |
| Per cent of months used the card | 84% | 96% | 75% | 84% | 95% | 75% | 82% | 95% | 73% | 84% | 97% | 74% |
| Used the card every month | 39% | 66% | 20% | 45% | 64% | 30% | 40% | 63% | 23% | 26% | 53% | 7% |
| Used the card at least 11 out of 12 months | 70% | 94% | 52% | 69% | 94% | 50% | 63% | 92% | 42% | |||
| Used the card at least 35 out of 36 months | 46% | 84% | 20% | |||||||||
| Transaction success, number per mother | ||||||||||||
| Approved transactions | 54.6 | 98.9 | 21.1 | 52.9 | 95.5 | 21.2 | 49.0 | 87.6 | 19.6 | 152.5 | 281.9 | 60.2 |
| Failed transactions due to insufficient funds | 2.7 | 3.7 | 2.0 | 2.7 | 3.8 | 1.9 | 1.7 | 2.5 | 1.2 | 7.1 | 10.1 | 5.1 |
| Failed transactions due to PIN problems | 1.9 | 2.6 | 1.4 | 1.6 | 2.2 | 1.2 | 0.9 | 1.4 | 0.6 | 4.4 | 6.1 | 3.2 |
| Failed transactions due to other errors | 10.4 | 14.6 | 7.3 | 11.1 | 15.3 | 8.0 | 11.4 | 16.1 | 7.9 | 8.2 | 11.5 | 5.9 |
| Transaction amount, top ten categories ($) | ||||||||||||
| ATM | 566.7 | 1,324.8 | 10.7 | 583.8 | 1,367.2 | 13.0 | 526.1 | 1,214.4 | 17.1 | 1,642.3 | 3,912.0 | 39.9 |
| Department/variety store | 47.1 | 104.0 | 5.4 | 38.4 | 84.1 | 5.1 | 42.5 | 92.4 | 5.5 | 125.1 | 280.4 | 15.5 |
| Dollar discount | 62.5 | 126.1 | 15.8 | 67.2 | 136.1 | 17.1 | 63.6 | 127.4 | 16.5 | 190.0 | 389.5 | 49.2 |
| Fast food | 72.5 | 143.2 | 20.6 | 77.1 | 148.8 | 24.8 | 98.7 | 194.0 | 28.2 | 247.0 | 494.5 | 72.3 |
| Fuel/service station | 81.1 | 156.2 | 26.0 | 84.4 | 157.3 | 31.2 | 93.9 | 178.0 | 31.8 | 256.5 | 496.3 | 87.2 |
| Grocery store/supermarket | 161.1 | 341.3 | 29.0 | 158.4 | 340.9 | 25.5 | 121.1 | 253.8 | 23.0 | 427.1 | 924.0 | 76.3 |
| Online variety store | 34.4 | 74.9 | 4.7 | 48.3 | 104.0 | 7.7 | 47.8 | 103.4 | 6.7 | 127.8 | 281.0 | 19.8 |
| Other | 416.2 | 902.5 | 59.6 | 451.0 | 972.1 | 71.4 | 427.4 | 914.9 | 66.8 | 1,271.3 | 2,790.4 | 198.8 |
| Phone | 61.1 | 141.0 | 2.5 | 71.8 | 166.4 | 2.8 | 64.4 | 148.6 | 2.1 | 192.9 | 455.7 | 7.3 |
| Walmart | 191.9 | 414.3 | 28.7 | 159.1 | 343.0 | 25.2 | 144.7 | 309.0 | 23.2 | 481.4 | 1,056.0 | 75.7 |
| Wholesale | 27.5 | 62.5 | 1.9 | 33.8 | 75.9 | 3.1 | 35.3 | 79.1 | 2.8 | 92.4 | 212.5 | 7.5 |
| Observations | 839 | 355 | 484 | 828 | 349 | 479 | 835 | 355 | 480 | 882 | 365 | 517 |
To be included in the age 0–1, age 1–2 and age 2–3 samples, participants had to have completed the wave 1, wave 2 and wave 3 surveys, respectively. To be included in the age 0–3 sample, participants had to have completed one survey other than the baseline (either wave 1, wave 2 or wave 3).
To offer a fuller appraisal of impacts informing the investment pathway framework, Supplementary Tables 1–5 expand upon the pre-registered outcomes presented in Table 2 and Figs. 1–3. For example, Fig. 1 and Supplementary Table 1 include pre-registered poverty status and social services receipt outcomes as well as exploratory outcomes in the domain of household income. Supplementary Tables 1, 3 and 5 provide detailed ITT estimates within wave following pre-registered analysis protocols, the derived exploratory pooled estimate across waves, the low-cash gift group means and a conversion of the exploratory pooled estimate into effect size (ES) units. Findings for the longitudinal sample of families (that is, n = 857) across all three surveys are substantively similar (Supplementary Table 6). Household wealth-related outcomes in Supplementary Table 2, only measured at wave 3, are exploratory and included because of their importance in explaining spending and consumption in response to the cash gift. Pre-registered and exploratory outcomes are constructed to capture behavioural changes on the extensive margin (for example, participating in the labour force or dropping out, or purchasing books or toys) and the intensive margins (for example, changes in hours worked or amount of money spent on books or toys).
Household income and wealth
Descriptively, poverty levels of families in this study tended to increase as the child’s birth approached, and then returned to pre-birth levels 6 months post-partum, similar to patterns observed in nationally representative samples49. The amount of government income received by BFY families increased over the time period of analyses, as might be expected given availability of pandemic-based income supports: 72% report receiving pandemic-related stimulus payments over the 2021–2022 time period. The high-cash gift should have increased overall household financial resources, presuming that families did not adjust hours of work or there were no changes in other sources of income, including government benefits. Figure 1 (see also Table 2) shows this to be true. Over the 3 years of follow-up, families in the high-cash gift group were less likely than families in the low-cash gift group to be residing in poverty (pooled ES of −0.14, 95% CI −0.106 to −0.025, P = 0.002) and had higher income-to-needs ratio (11.2% higher than the low-cash gift group; pooled ES of 0.16, 95% CI 0.051 to 0.173), P < 0.001). Poverty reduction impacts were largest in wave 2 (8.2 percentage points; 95% CI −0.139 to −0.024, P = 0.009). Estimates were robust to adjustments for multiple hypothesis testing and to different assumptions about household size (described in Methods). Household composition (that is, the number of adults and children) is similar across treatment groups. The mean level of income remains low: By wave 3, more than 94% of families in both the high-cash and low-cash gift groups were residing at or below 200% of the federal poverty threshold.
Net household income for high-cash gift families increased by approximately $245 (pooled estimate in Table 2; 95% CI 100.00 to 390.33, P = 0.001) as shown in Fig. 1c. Considering each source of income, households in the high-cash gift group received slightly less income, converted into monthly values, from mothers’ earnings, other household members’ earnings, government sources and other sources. However, none of the differences in these sources of income statistically differed between households in the high-cash and low-cash gift groups, including maternal earnings or earnings from other adults in the household; together, the differences were less than the value of the BFY monthly cash gift.
Estimates of the high-cash gift impacts on family poverty status are qualitatively similar when considering the contribution of tax and benefit transfers. Even though families in the high-cash gift group had similar amounts of annual income from government sources as did families in the low-cash gift group, Fig. 1b shows that families in the high-cash gift group reported receiving fewer types or number of social service programmes (or government assistance benefits) than families in the low-cash gift group (pooled estimate Table 2; 95% CI −0.26 to −0.03, P = 0.012). Impacts on number of social services programmes primarily occurred during wave 3 (95% CI −0.363 to −0.074, P = 0.004). The pooled estimates in Table 2 show that families in the high-cash gift group were less likely to report receiving Low Income Energy Assistance (95% CI −0.069 to −0.004, P = 0.026), Medicaid50 (95% CI −0.101 to −0.012, P = 0.014) and housing assistance benefits (95% CI −0.102 to −0.015, P = 0.009). Given that the cash gifts did not count towards eligibility for public benefits as described above, the reduction in benefit receipt is due to either families in the high-cash gift group voluntarily declining to apply (or re-certify) for benefit receipt or families becoming ineligible for reasons unrelated to the cash gifts.
Supplementary Table 2 presents impacts on exploratory outcomes related to debt, savings and overall household wealth from the wave 3 survey. Over half of BFY families report some savings or a savings account; however, median savings is zero, irrespective of treatment group. Upon making adjustments for multiple hypothesis testing, there is no evidence that families in the high-cash gift group were more likely to report having debt or savings, or a savings account.
Maternal time use: work, childcare and child activities
Although a vast literature in the United States finds some, mostly small, labour market responses to income support51,52, as shown in Fig. 2 (see also Supplementary Table 3 for more details), mothers in the high-cash gift group were no more or less likely to spend time in paid work; however, mothers in the high-cash gift group were more likely to report working 20 h or less a week (95% CI 0.000 to 0.047, P = 0.049) as well as less likely to report working 40 h or more a week (95% CI −0.082 to −0.006, P = 0.025). There were no statistically significant differences in timing of mothers’ labour market entry or re-entry overall, or their full-time employment in the first year after the child’s birth53. There is no evidence that mothers’ participation in a joint measure of education and training differed by cash gift treatment group in pooled estimates (Supplementary Table 3). However, more mothers in the high-cash gift group reported participation in education and training in wave 3 (95% CI −0.001 to 0.119, P = 0.049). As an exploratory addendum, uncoupling measurement of participation in education from participation in training programmes, Supplementary Table 3 shows an increase in participation in an educational course or programme (a 7.1 percentage point impact in wave 3; 95% CI 0.019 to 0.123, P = 0.007).
Fig. 2 |. ITT estimates of impact of the high-cash gift on maternal time use.

Pooled estimates combine n = 931 from wave 1, n = 922 from wave 2 and n = 922 from wave 3 samples. a, ITT estimates on maternal time in the labour market, child time in non-parental care and maternal time with child, pooled waves 1–3. b, ITT estimates on the parent–child activities index, pooled waves 1–3. The dots represent ITT estimates adjusted for baseline covariates and site; whiskers represent 95% CIs. See Supplementary Fig. 1 and Supplementary Table 3 for more details and full results.
Although entry into formal childcare after the child’s birth was delayed by 1 month among high-cash gift families53, focal child’s participation in centre-based care did not statistically differ between the high- and low-cash gift families through wave 3 (Table 2).
At each wave of data collection, mothers were asked about the frequency of time spent reading, telling stories, playing with the child to build things, engaging in pretend play and participating in play groups. The frequency of these activities, summed by activity in an index (Fig. 2b) according to pre-registration, was higher in families in the high-cash gift group relative to the low-cash gift group pooled across waves (Table 2; pooled estimate 95% CI 0.136 to 0.699, P < 0.001). Exploratory analyses, pooled across waves, show that more mothers in the high-cash gift group reported reading books (95% CI 0.024 to 0.093, P = 0.001) or telling stories (95% CI 0.007 to 0.085, P = 0.022) a few times per week or more, compared with mothers in the low-cash gift group. For ease of interpretation, a transformation of this measure into minutes per week at each wave (described in Methods) indicates that this is equivalent to high-cash gift mothers spending approximately 11.3 min more per week (5.2% increase) on early learning and related enrichment activities with the focal child, encompassing reading (1.4 min more; 8.6% increase), storytelling (1.3 min more; 8.5% increase) and other activities related to playing and building (8.5 min more; 4.6% increase), compared with low-cash gift mothers.
Child-specific and general household expenditures
Cash transfers in many countries have been found to increase spending on consumption such as food and accumulation of asset-generating goods54; studies have found a more limited impact of unconditional cash transfers on child-specific goods and services25.
As shown in Fig. 3 (see also Supplementary Table 4), mothers in the high-cash gift group reported spending $67.8 more, on average in the prior month, on a pooled estimate of the sum of focal child-specific goods relative to expenditures by low-cash gift mothers, an increase that was both economically (19%) and statistically significant (95% CI 28.80 to 106.57, P = 0.001). This impact is substantively similar in each wave correcting for multiple comparisons following within-wave pre-registration protocols (Supplementary Table 6). The increased spending in the month prior to the survey in pooled estimates included books ($11.60; 95% CI 7.41 to 15.75, P < 0.001), toys ($18.32; 95% CI 7.48 to 29.17, P = 0.001) and activities ($15.34; 95% CI 3.43 to 27.25, P = 0.012).
High-cash gift families increased the amount spent on child-specific goods as well as the likelihood of spending on child-specific goods in pooled estimates (exploratory analyses; Supplementary Table 4). High-cash gift families were more likely to purchase books, toys, clothing and activities related to the focal child. For the smaller wave 1 pre-pandemic sample, in-person interviewers observed high-cash gift families’ homes as more likely to have children’s books (25%), compared with homes of low-cash gift families (21%). High-cash gift families were no more likely to purchase child-specific durable goods in the first year as measured via an index (pre-registered, marginally statistically significant; Supplementary Table 6). However, high-cash gift families were 7.6 percentage points more likely than low-cash gift families to have purchased a high chair since the birth of the infant (Supplementary Table 4; 95% CI 0.012 to 0.139, P = 0.02). An increased $29.41 per month on out-of-pocket childcare difference between high-cash versus low-cash gift families is marginally statistically significant.
Families in the high-cash gift group reported generally similar expenditures on other measures of core consumption categories assessed, including expenditures on utilities, food, rent and cable/internet/phone. None of these individual expenditure categories statistically differed for the high- versus low-cash gift families except that high-cash gift mothers reported spending more money on food eaten out than did low-cash gift families ($25.60; 95% CI 1.98 to 49.21, P = 0.034). This might suggest potential time savings relative to cooking food at home and/or increased time in leisure activities. Household expenditures on alcohol (approximately $2.80 per month) are negligible and do not differ by treatment group; expenditures on cigarettes (based on cost of cigarette packs) are statistically lower among high-cash families than among low-cash gift families (at wave 2, 95% CI −17.514 to −0.337, P = 0.042; for impact on maternal substance use through wave 1, also see Yoo et al.55).
Subjective wellbeing
Pooled estimates show that mothers in the high-cash gift group do not report higher levels of subjective wellbeing compared with the low-cash gift group (Supplementary Table 5). There is no evidence of differences in reports of maternal happiness or in an index measure of maternal agency and hope (for example, meeting and pursuing goals and problem solving despite discouragement). At wave 3, mothers in the high-cash gift group report lower happiness than mothers in the low-cash gift group (Table 2, 95% CI −0.204 to −0.027, P = 0.012). Analyses of pre-registered outcomes on financial worry and hardship, maternal mental health and parenting stress as posited by a family stress model also show no evidence of positive impacts of the high-cash gift56.
Discussion
The BFY study’s unconditional cash gifts had selective impacts on time and money investments in young children. Compared with mothers who received the low-cash monthly gift, mothers in the high-cash gift group reported engaging more frequently in child-specific early learning activities such as reading books and telling stories with their children. Families in the high-cash gift group also reported consistently higher spending on child-specific goods including activities, books and toys. These findings are consistent with the cash gift’s child-related behavioural cues. Estimates on time spent with children in early learning activities are similar in magnitude to the effects of more costly and intensive direct early literacy interventions on increased time spent reading among comparable populations of 3–4 year olds residing in families with low income57; the findings are also similar to those of bundled interventions offering parenting coaching, support and children’s items such as diapers and clothing58. Scaled to annual amounts, $984 of the $3,760, or approximately 26% of the cash gift differential, was allocated to children’s books, toys, activities, clothing, diapers and children’s electronic items/devices. Conversion of estimates from wave 1 data show that families are more likely to consume child-specific goods from the high-cash gift than from other sources of income and more likely to consume child-specific goods than comparable families from a nationally representative sample59.
The findings offer empirical evidence that predictable, monthly unconditional cash impacts spending in ways that may be beneficial for children in a contemporary US context, thus complementing studies of impacts on children’s outcomes generated from quasi-experimental studies such as those of maternal pensions4,24,37,60 and income transfers to Indigenous populations61. These findings on spending directed towards child-specific goods are qualitatively similar to findings documented in other research, such as the Dutch child benefit62 and a cash transfer labelled as ‘education support’ given to fathers of school-aged children in poor rural communities in Morocco63. The estimates also align with investigations of cash-based economic policies such as the recent child-labelled 2021 expanded tax credit that shows approximately 15% spent on child-specific goods among all households with children eligible for payouts20, and spending on child-specific goods among families with low income that received one-time payouts from the Alaska Dividend Fund25.
The child-focused design of the cash gift in this study may have particularly encouraged households’ complementary investments in child-specific goods and time spent with the child; that is, having money to purchase books may have also fostered more time spent reading books. The behavioural cues in the child-focused design, coupled with the high-cash gift, might have also increased the salience of a parenting identity that translated into such child-specific investments64. Notably, these investments occurred during the economically important first few years of children’s development65,66. As such, the findings reveal psychological, or non-financial, influences in people’s spending allocations that is counter to conventional economic assumptions about the fungibility of cash irrespective of the structure, format or related implementation features.
The extent to which the child-specific investments posited to have been increased by the BFY high-cash gift affect children’s developmental outcomes will be important to examine. Time spent on early enrichment activities such as those measured in this study has been found to predict children’s language and literacy development67 and is positively associated with schooling outcomes68–70. Early looks at the impact of the cash gift on brain functioning among the subsample of infants who had in-person (pre-pandemic) visits at wave 1 show positive, substantive impacts71. Estimates from nationally representative samples of 3–6 year olds suggest that the magnitude of the high-cash gift impact on increased time spent reading is associated with a 0.08 standard deviation increase in vocabulary development, which is a very small difference72.
A combined measure of household core expenditures, including utilities, cable/internet/phone and food was somewhat higher among families in the high-cash gift group than in the low-cash gift group; however, none of the specific items in these categories except for food eaten out of the home differed by treatment status (that is, we could not reject the null hypothesis of |ES| >0.2 based on two one-sided equivalence tests). There are several possible explanations for why larger differences in core household expenditures are not seen. It may be that the ways in which high-cash gift families spent the money for the households was very diverse and the survey measures were not comprehensive enough to capture these many ways. Many large categories of expenditures, such as durable goods, educational expenses, transportation and smartphone maintenance, were not included in the survey, so we are unable to investigate impacts there.
The availability of unconditional cash may have freed up options for families to devote financial resources towards goods and services that are not subsidized by many in-kind or related public programmes. Indeed, the debit card data show transactions as diverse as gas stations, restaurants and phone bills. BFY funds spent on books is one example73, mothers’ investing in their own training and educational attainment is yet another. With regard to oft-cited concerns about whether unconditional cash income is spent responsibly, the data show that families in the high-cash gift group had similar or lower spending on adult-specific goods such as alcohol and cigarettes, compared with the low-cash gift group.
In in-depth, semi-structured qualitative interviews, mothers explicitly talked about mentally earmarking the BFY money for their child74, with parents seeing both child-specific goods and more general household needs as benefiting the child. However, mothers’ experiences of the BFY cash gift suggest that the salience of the cash aid for their children is much broader than use of the cash solely for child-specific goods74. Even in the context of facing continued daily financial struggles, mothers commonly describe working towards the long-term goal of having happy, healthy children, and they pursue varying routes—including in their use of the BFY gift—to achieve that goal.
In considering other aspects of maternal time use and children’s time spent with others, a number of findings emerged. No statistically detectable changes were present in mothers’ labour market participation or in the incidence of non-parental care for the child in the first 3 years of life. However, there were changes along intensive margins. For example, as previously noted, high-cash gift children’s entry into formal childcare after birth was delayed by 1 month relative to low-cash gift children53 and mother’s shifts in employment occurred on margins related to hours of work, with increases in part time (<20 h) and reductions in long hours (>40 h) per week in work. Receipt of social services were lower and food eaten out was higher, each of which may be revealing choices related to time savings. Assessing whether and how much impacts on mother’s own human capital persevere (at conventional levels of statistical significance) and their spillover to employment and earnings will be important.
The implementation of the cash gift through a debit card mechanism in this study additionally demonstrated potential scalability of this mechanism for cash gifts in the ease of receipt and use of cash via ATM withdrawals and point-of-sale vendors. Mothers reported few problems with the debit cards, and uptake was nearly universal. Features of this cash gift distribution do not mimic the recent distribution of expanded child tax credits through the US tax system, but do offer insights on how unconditional cash transfers could be rolled out on a broader scale, potentially with less friction and bureaucratic burden than, for example, the current US system based on tax credits.
Several limitations of this study are worth noting. First, to reduce research participation burden on mothers, we did not attempt to obtain full appraisals of the dynamic monthly, weekly or daily nature of resource inflows or outflows or details regarding time use outside of maternal work or not specific to the focal child. Second, because the BFY newborn was not necessarily the first child in the family, trade-offs and spillovers of time and money investments across siblings in response to receipt of the high-cash gift are currently unknown. A sibling with particular health or intellectual demands could draw more attention or financial investment among high-cash gift families, or siblings could experience spillover of benefits from the high-cash gift. Third, the external validity of the findings on the BFY cash gift in regard to scaled policy implementation is limited by features of the BFY cash gift related to eligibility determination (that is, the BFY cash gift does not change according to family income, number of children or cost of living) and its delivery format and source (from private charitable organizations and not the government, and monthly and not lump sum). Further, BFY families share many of the characteristics of families from the communities from which they were recruited, but may differ on characteristics related to their willingness to participate in a research study.
Despite these limitations, the findings suggest that direct, predictable, monthly unconditional cash transfers may be a viable policy approach for investing in children whose families reside in poverty. These findings also provide evidence on the causal impacts of unconditional income on parental time and money investments in children as proposed in economic models demonstrating the importance of investing in the development of children’s early human capital.
Methods
The study is approved and monitored by Teacher’s College, Columbia University, as the single Institutional Review Board record, and is registered at clinicaltrials.gov (NCT03593356; first posted July 2018) and on the American Economic Association’s registry (AEARCTR-0003262, first posted June 2019). Informed consent was secured at the time of the study focal child’s birth to participate in a longitudinal research study and for several components of data collection including consent to use data from transactions on the cash gift debit card. Subsequently, consent was also provided at each wave of data collection.
Study sample
Participating mothers and infants in the BFY study were recruited from 12 hospitals in four metropolitan areas: New York City, New Orleans, the greater Omaha metropolitan area and the Twin Cities (Minneapolis and St. Paul). Selection of these metropolitan areas was guided by an aim to enroll a racially and ethnically diverse sample of low-income mothers across geographic regions that vary in cost of living and generosity of public services and safety-net programmes. The racial and ethnic diversity of the sample reflects that of the communities of the hospitals where mothers gave birth. In the United States, 98.6% of all births in 2012 occurred in hospitals, with a higher percentage among births to low-income, Black and Hispanic women. Between May 2018 and June 2019, all 1,000 mother–infant dyads were recruited. Eligibility criteria for the study included (1) mother 18 years or older with the exception of Nebraska, where the age of consent was 19 years or older; (2) self-reported household income below the federal poverty threshold in the calendar year before the interview, counting the newborn; (3) healthy full-term birth (that is, 37 weeks’ gestation or greater, not in the neonatal intensive care unit and no known developmental or neurological problems); (4) scheduled to be discharged into the custody of the birth mother; (5) living in the state of recruitment and not being ‘highly likely’ to move to a different state or country in the next 12 months; and (6) proficiency in English or Spanish for the purposes of available child outcome measurement.
Approximately 8,200 of 13,483 mothers were identified by nursing staff across the 12 hospitals to be approached about their interest in participating in a longitudinal child development research study. Of these, 6,839 did not meet the inclusion criteria and 341 declined to consent. A baseline interview was completed with the remaining 1,051 mothers. After completing the baseline interview, mothers were offered the opportunity to receive the cash gift. Of the 1,003 mothers who were subsequently randomized, three were excluded because they notified the interviewer within 2 days after completing the baseline interview that they wanted to withdraw and stop receiving cash gifts. The result is a final sample of 1,000 mothers and infants initially enrolled. Striking a balance between statistical power and project costs, 40% of the recruited sample within each site was randomized to receive $333 monthly cash gifts and 60% to receive $20 monthly cash gifts. With an enrolled sample of n = 1,000 mother–infant dyads, and accounting for a predicted 20% attrition over longer-term follow-ups, the anticipated sample size of 800 dyads during subsequent waves of data collection is estimated to provide 80% power to detect a 0.207 s.d. impact at P < 0.05 in a two-tailed test on the family investment and related family process outcomes examined here. Data collectors were blinded to assignment of treatment status.
Randomization successfully achieved baseline equivalence across multiple characteristics for the full enrolled sample of 1,000 mother–infant dyads and within each site; see Table 3 ref. 75. The study sample is racially and ethnically diverse: per mothers’ self-reports, 39% identify as Black, 42% Latina, <1% Asian/Pacific Islander, 1.5% Native American, 11% white, non-Hispanic and 7% multiple races/other. Approximately one out of three infants were first-time births for the mother, and one out of five mothers reported being married. Nearly 60% of mothers worked for pay while pregnant, and 92% reported plans to return to work. Forty-one per cent reported that the biological father of the infant resided in the household. The average household income, at $22,313, is just above the federal poverty line for a family of three ($21,330 in 2019). Less than 13% of mothers reported receiving government cash assistance from the TANF programme, whereas over 95% reported receiving some type of government benefit (Supplemental Nutrition Assistance Program, WIC (Special Supplemental Nutrition Program for Women, Infants, and Children), Head Start, other free childcare, Medicaid, housing assistance, unemployment benefits or other). Eighty per cent of families were net worth poor (defined as net worth less than one-fourth of the federal poverty line or having assets sufficient to meet basic needs for 3 months, as defined by the poverty line76).
State-level child poverty rates and racial/ethnic populations vary by study sites and, accordingly, some characteristics of the families show similar variation. Nearly 80% of mothers in the New Orleans sample identify as Black, whereas 87% of mothers in the New York City sample identify as Latina. Mothers who report being married account for 32% in New York City, 24% in the Twin Cities and Omaha sites, and 7% in New Orleans. On the other hand, rates of residence with the baby’s biological father at study entry are substantively similar across sites, as is overall household income and reports of household receipt of government benefits. To account for site-specific differences, all estimates described later also include a site indicator in addition to individual and family baseline characteristics.
The child age 1 survey (hereafter referred to as wave 1 follow-up) began in July 2019 and continued through June 2020. The University of Michigan Survey Research Center served as a subcontractor and managed data collection with a team of interviewers at each study site. The wave 2 and wave 3 follow-up surveys, respectively, took place over a similar approximate 12-month time frame in 2021–2022 and 2022–2023. Overall response rates were high: 93%, 92% and 92%, respectively for waves 1–3. Response rates for each follow-up wave, and reasons for non-response or exclusion, are detailed in CONSORT diagrams in Supplementary Fig. 1a–c. As shown in Supplementary Fig. 1a–c, there were more refusals to participate among low-cash gift mothers (n = 6 in wave 1, n = 7 in wave 2 and n = 8 in wave 3) than high-cash gift mothers (the small difference is statistically significant at P < 0.05) and more low-cash gift mothers (n = 38 in wave 1, n = 43 in wave 2 and n = 45 in wave 3) were not found or were not able to be contacted for the follow-up than high-cash gift mothers (the small difference is statistically significant at P < 0.05). Of the 1,000 mothers initially enrolled, 85.7% completed each of the three survey waves; 8.7% completed two surveys (n = 87), 3.0% completed one survey (n = 30) and only n = 26 had no contact with the research team or no survey data.
Consistent with the high response rate, few statistical differences emerge when the baseline characteristics of the fully enrolled sample are compared with those of each survey sample both overall and within each site. There is baseline equivalence across groups with respect to reasons for non-response during the time period evaluated with respect to the study focal child being deceased, the study focal child no longer being in the mother’s custodial care or the mother being incarcerated. Of the 37 characteristics measured at study entry (see Supplementary Table 7 for the study sample that contributes to the pooled analyses and see Supplementary Table 8 for the longitudinal sample), four had small statistically significant differences by cash gift group including race/ethnicity (whether the mother identified as Black or American Indian/Eskimo/Aleut), single-parent status (whether never married, single living with partner or biological father living in household), alcoholic drinking during pregnancy and reports of household receipt of benefits. Some of these statistical differences have very little substantive meaning by way of magnitude of difference (for example, household receipt of benefits is 95% versus 97%); nevertheless, as described below, all estimates are adjusted by these baseline characteristics. Baseline characteristics of participants with no completed survey data are balanced across treatment group.
The cash gift and debit card transactions
The BFY cash gift is disbursed monthly on the 4MyBaby debit card automatically, on the day matching the date of the child’s birth. The debit card was activated upon the mother’s consent to receive the cash gift before leaving the hospital. The debit card can be used to obtain cash at ATMs or for any point-of-sale transaction in person or online. Money from other sources cannot be loaded on the card. Implementation and design of the cash gift was informed by insights from behavioural economics and its implications in the context of poverty and financial instability77–79: the cash transfer is predictable and monthly, thus reducing the mentally taxing nature of income uncertainty and instability prevalent in US low-income households, whether due to characteristics of low-wage work, the eligibility and re-certification requirements of public benefits80,81 or uncertainty in the amount or timing of benefit receipt. Unlike existing US anti-poverty programmes, the administrative burdens were low, with little required documentation or certification of income eligibility.
We sought consent from mothers to access their transaction data and obtained consent from the majority. We are able to track activity on the 4MyBaby card regardless of mothers’ responsivity to the data collection, and it is made clear to mothers that the monthly cash gift will continue regardless of their participation in the research. For example, 4MyBaby card activity is observed for four mothers with deceased infants, one of four incarcerated mothers and all three low-cash gift mothers who declined to participate in the wave 1 survey. Data available from the debit card vendor, Greenphire, include the amount, type of transaction (point-of-sale or ATM), date of transaction, response (approved or declined) and merchant name, thus allowing for analyses of cash gift uptake and characteristics and patterns of cash gift spending. As of June 2022, the end of wave 3 data collection, <1% (n = 5) of the mothers never used the card (Table 4). Very few transactions failed due to insufficient funds or PIN problems. Mothers can call Mastercard regarding any difficulties or call customer service at a 4MyBaby hotline (hosted and managed by research assistants and students at Teachers College, Columbia University). Approximately 2,550 calls were received between study entry and the end of the wave 1 data collection, with 45% of the BFY mothers calling at least once, primarily seeking clarity about the study or the debit card. As this mechanism of implementing the cash gift has proven successful with nearly universal use, the ITT estimates can be interpreted as treatment-on-the-treated.
In terms of other patterns of use, nearly half (46%) used the debit card nearly every month of the first 36 months of receipt. Considering the mix of ATM withdrawals and point-of-sale transactions, very few BFY families only use the debit card at ATMs (1%), and most use the card for a mix of cash withdrawals and point-of-sale purchases (68% over the first 36 months of cash gift receipt). Most of the cash gift tends to be expended within days of the disbursement, and nearly all of it tends to be spent or withdrawn from the card before the next monthly disbursement (similar spending patterns are noted with receipt of the Earned Income Tax Credit)82. The largest transaction among high-cash gift recipients is ATM withdrawal, averaging $3,912 in cash withdrawals, representing approximately one-third of the $12,000 received over the first 36 months. The remainder of the high-cash gift is dispersed across a variety of point-of-sale venues, with the largest amounts and most frequent transactions occurring at large chain stores and various food- or grocery-related venues. Very few transactions occur at tobacco or alcohol vendors. Given the high amount of ATM cash withdrawal among high-cash gift recipients, additional information from survey data is important to interpret the implications of receiving the cash gift on household consumption and allocation of funds across various expenditures.
ITT estimates
Estimates for each follow-up wave following pre-registration protocols are derived by the following straightforward model:
where Y is the outcome of interest for mother or the household and ε is the error term. The model includes the following baseline covariates (X) with the goal of improving precision in the estimate: mother’s characteristics (mother’s age, maximum education level attained, race and ethnicity, marital status, general health, an indicator of maternal depressive symptoms and cigarettes and alcohol consumption during pregnancy), household characteristics (number of children born to mother, number of adults in the household, father living with the mother, household income and household net worth), baby’s birth characteristics (weight at birth and gestational age), a site-based fixed effect and an indicator for the switch from in-person to phone interviews. Z is an indicator of whether a mother is in the high-cash gift group, and thus Π is the causal estimate of being assigned to the high-cash gift group. Given the implementation success of the debit card mechanism, the ITT estimate captures the effects of a net positive income shock of $313, essentially equivalent to a treatment-on-the-treated interpretation. Robust standard errors are produced via Huber–White adjustments for heteroskedasticity. In pre-registered analyses, we address the possibility of false positives by estimating the statistical significance of conceptually similar outcomes, that is, we capture a common or similar domain or ‘family’ by generating a family-wise error rate of outcomes using step-down resampling methods83.
Exploratory estimates pooling the data across each of the three survey waves were derived from an expansion of the above equation:
| (2) |
The regression-adjusted model also includes an indicator for whether the follow-up survey was conducted in person or by phone in the first wave to capture the onset of the COVID-19 pandemic during fielding (described further below), an indicator for each wave of follow-up and the child’s age in months relative to the time of the survey interview.
Approximately 70% of survey interviews (71% wave 1, 77% wave 2 and 73% wave 3) were completed within a 1-month window before or after the child’s birthday each year. The average age of the focal child at the time of the survey interview did not substantively differ by treatment status (average age of child: wave 1: 13.1 months (s.d. 2.1) for the low-cash gift group and 12.6 months (s.d. 1.5) for the high-cash gift group; wave 2, 24.9 months (s.d. 1.9) for the low-cash gift group and 24.5 months (s.d. 1.3) for the high-cash gift group; wave 3: 36.9 months (s.d. 1.8) for the low-cash gift group and 36.9 months (s.d. 1.3) for the high-cash gift group).
The COVID-19 pandemic
The COVID-19 pandemic affected the study in two ways. First, the onset of the pandemic in 2020 disrupted the format of the wave 1 survey in the middle of fielding. By 16 March 2020, when the pandemic forced stay-at-home orders and related disruptions, the data collection team from the University of Michigan Survey Research Center were able to successfully pivot from in-person to phone interviews within 3 days. The outcomes that are the focus of this study, all of which have established validity through phone as well as in-person administration, had no disruption. The findings on pre-registered outcomes from the first wave of data collection do not differ in economic or statistical significance when the ITT estimates were re-estimated with weighting via inverse probability weights to adjust the baseline characteristics of the low-cash gift group to the baseline characteristics of the high-cash gift group for the wave 1 sample (n = 931), the wave 1 pre-pandemic sample (n = 605) and the wave 1 pandemic sample (n = 325). Results from these analyses are available as appendix tables in a publicly posted working paper59. There were no statistically discernible discontinuities in the types of transactions observed on the debit cards 30 and up to 60 days before and following 16 March 2020, with the exception of an increase in purchases occurring online after the onset of the pandemic as compared with the pre-pandemic period.
Second, while the context for interpreting the findings shifted dramatically upon the onset of the pandemic, ITT estimates retain internal validity. Nevertheless, the pandemic changed the context of the families’ lives in complicated ways, bringing greater labour market uncertainty, health risks and social isolation, as well as childcare and school closures. The pandemic also brought higher levels of social benefits in the form of increased food assistance, generous unemployment assistance and direct cash payments, including the 2021 expanded Child Tax Credit of $3,000–3,600 per child. These contextual changes may have also affected the ways in which mothers used the BFY cash gifts or the ways in which the BFY cash gift affected their experiences through the shifting circumstances of the pandemic. The cash gift was disbursed throughout this study’s analysis period without disruption. The majority of families had been receiving the BFY cash gift for nearly 9 months before the onset of the pandemic. During the 2-year follow-up data collection, we also asked mothers about their health, income and employment experiences specifically related to the pandemic. We found that mothers were likely to report a loss of household income related to the pandemic (63%), and many reported receiving federal stimulus payments (68%). About 13% of the mothers reported having had COVID-19 at some point. Those in the high-cash gift group reported that they were more likely to make major changes in their behaviour (for example, cutting back on work) because of the pandemic, compared with those in the low-cash gift group (75% versus 69%, P < 0.05; see Sauval et al.84); although this small difference in work participation did not exist by the third year of follow-up. Other than this small difference in maternal work participation, experiences related to COVID-19, including reported receipt of pandemic-related stimulus payments, were similar for the high- and low-cash gift families. Descriptive patterns of spending behaviours and time use, including monthly patterns of debit card transactions, show few large shifts in response to pandemic-related lockdowns or infection rate peaks (with one exception being the increase in debit card use for online shopping). The amount of government income reported by families slightly increased over time as expected.
Variable descriptions
The follow-up surveys asked mothers about a variety of wellbeing, time and financial resource items. All survey questionnaires are posted online. Two components of the follow-up surveys captured direct child investments: maternal reports of expenditures on child-specific goods and maternal reports of frequency of time spent with the child on human-capital building activities such as reading, telling stories and playing. Mothers’ time spent in market work is based on self-reports of labour force participation. Pre-registered outcomes considered in this study as informed by the economic model of family investment in the context of the broader study’s conceptualization of family processes as following the investment and, separately, the family stress pathway, are listed in Table 1. Detailed descriptions of variables and variable coding included in this study are provided in Supplementary Table 9. In the following sections, we offer more explanation on estimates of household income and poverty status, and on our strategy to transform the parent–child activities scale into minutes of time spent with the focal child for interpretation purposes.
Household income and poverty status.
Following protocols of nationally representative US surveys, mothers reported pre-tax household income during the prior calendar year, as opposed to the last 12 months. Mothers reported on their own total earnings; earnings of a spouse, husband wife or domestic partner; earnings of other members of the household (that is, the people who have been living with the mother and were related to the baby by blood, marriage, adoption or domestic partnership); government income received by mother and/or other members of the household from the government, such as welfare, supplemental security income, unemployment benefits and social security; and all other sources of income such as money from any businesses, help from friends or relatives, child support and any other money income (excluding the cash gift and regular contributions from people who did not live with the mother). For each source of income, reporting follows a similar format of questions starting with the total amount, the unit of reporting and then an unfolding scale. For example, for mother’s earnings, the series of questions are: How much did you earn from all your employers before taxes and deductions during (previous year)? Is that for the entire last year, per month or per week? This amount is then verified with the mother: does (total earning estimate) sound about right for all of (previous year)? If mother states ‘do not know’ at any point, she is redirected to an unfolding scale that follows the following series until she responds ‘no’: would those annual earnings in (previous year) amount to $10,000 or more? Would it amount to $15,000 or more? Would it amount to $20,000 or more? Would it amount to $25,000 or more? Would it amount to $5,000 or more? At the end of the income module, each source of income is summed to derive a measure of total combined household income, and then the mother is asked to verify it: is (combined income) about the right amount of total combined income in your household during the year (previous year), which included money from jobs, welfare, social security payments, dividends and any other money income received by you or any other household members?’ For more specificity on the flow and logic of the survey items, the survey questionnaire can be found at https://www.babysfirstyears.com/data-and-documentation.
As fielding of the survey mimicked the temporal flow of study recruitment, each wave of data collection occurred over two calendar years (for example, for wave 1, July 2019 through June 2020). For example, for the wave 1 sample, 40% reported on household income for fiscal year 2018 and 60% reported on fiscal year 2019. While for some participants the last 12 months and previous calendar year overlap perfectly, the amount of overlap between two 12-month periods varies by family. To accommodate these complexities, we construct measures of average monthly income and an ideal income-to-needs ratio (average monthly income divided by the 2019 official federal poverty level) by scaling each source of income and combined total income by one/twelfth without any loss of generality. This assumes that average monthly income in the approximate 12 months following the start of the experiment (during child’s infancy) and the average monthly income in the calendar year before wave 1 data collection (pre-natally) are substantively similar. We adjust this average monthly income by the respective cash gift amount (that is, $313 for the high-cash gift group and $20 for the low-cash gift group) to reflect the differential influx of cash from the experiment. In addition to average monthly income measures as presented in Supplementary Table 1, we generate an annual poverty measure following pre-registration protocols as presented in Table 2. All measures of income are adjusted to 2019 dollars.
In the case of the first follow-up wave, how well does average monthly income in the prior year approximate the average monthly income in the 12 months following study enrollment? For about two-thirds of the sample (64%), at least 6 months overlap and, on average, 8 months overlap. Nonetheless, the potential error in approximation leaves us concerned about the direction of bias in our impact estimate. Theoretically, we might predict that the income effect of the cash transfer intervention effectively lowered other sources of household income for the high-cash gift group. In this case, our approximation of the monthly income for the high-cash gift group is probably an upper bound of the true monthly income and thus the resulting income-to-needs ratio. On the basis of this reasoning, the proposed measure of the income-to-needs ratio will yield the upper bound of the intervention effect estimate. On the other hand, we might rely on more precise information for the subsample in which we have concurrent information about sources of household income. This subsample is balanced in characteristics across treatment group and has similar characteristics to the full sample. The resulting income-to-needs ratio is larger for this subsample than estimates derived using the assumed monthly values.
Another consideration for constructing income–poverty measures is the choice of the family size. A detailed roster of household members is available contemporaneously at study entry and at each follow-up wave; however, neither necessarily captures household size during the period of calendar year reporting of income or during the full period of cash gift receipt. This implies, for example, that mothers report on prior calendar year earnings from a partner currently residing in the household even if that partner might not have been residing in the household during the reported calendar year. Nationally representative estimates from surveys have similar dilemmas though household membership is typically confirmed over a longer time period. The US Census typically reports poverty levels based on the official poverty measure by using the household income reported in the prior year and the household size reported in the current year. We assess whether the estimated income-to-needs ratio is sensitive to the choice of timing in which household size is reported, noting that using household size reported at each wave is more consistent with practices of national estimates from the census.
Maternal time spent with child.
The parent–child activity index is a composite of items: reading, telling stories, playing to build things and participating in play groups (wave 1), with playing pretend games added in wave 2 and participating in play groups removed in wave 3. Thus, the three consistent items over time are reading books, telling stories and playing to build things. Each item has four response options: rarely, a few times a month, weekly and daily. The main BFY pre-registered ITT analyses rely on a cumulative calculation of these response categories (varying from 1 to 4) for each item and then for the composite. Each item collected at each respective wave is included in the within-wave estimate of the parent–child activities index; thus the total cumulative value of the index may artificially increase at wave 2 because it is composed of five items. This within-wave calculation approach has value for generating the main ITT impacts following pre-registration protocols, but is difficult to interpret in a practical manner for a lay, policy or general social science audience. For these reasons we also include ITT estimates using a cross-wave index that includes only the three measures collected at all waves.
In addition, we convert the Likert scale categorization of frequency into interpretable approximate measures of time use in minutes, to enable comparison with other published literature on time investments in children. We take American Time Use Survey (ATUS) daily weekend time use estimates from Kalil et al.85 for mothers with children 0–2 years old. We apply estimates for time spent teaching and apply those for the reading and telling stories items; we do the same for the ATUS estimates of playing and apply those for each of the BFY play-based items. If a BFY mother responds ‘rarely’, we assign 0 min; if a mother responds ‘a few times a month’, we assign the value for 1 day; if a mother responds ‘weekly’, we assign the value for 3 days; if a mother responds ‘daily’, we assign the value for 7 days.
Using these estimates requires a few additional assumptions that we believe are reasonably met and will not introduce bias in the ITT estimates. First, we assume that time spent on teaching activities, which includes reading, talking and helping with homework or any other educational activity, is equivalent to time reading and storytelling for young children. Second, we assume that time use with respect to reading has not changed significantly between the 2003–2007 estimates from Kalil et al.85 and 2019–2021, when BFY measures were collected, and we assume that time spent reading on a typical day is similar during the week and on the weekend. Evidence from 2019–2022 ATUS statistics supports these assumptions, as women with young children have spent approximately similar time reading to children in the prior decade and similar time reading to children during the week and on weekends86. Third, we assume that time use is homogeneous by completed level of maternal education and that time use in any one activity on any one day is representative of time use for that same activity irrespective of the day (that is, time use does not vary across days).
We created three versions of the time use conversions to assess sensitivity to assumptions related to maternal education: (1) assignment in units of minutes to each item adjusted by mother’s baseline level of education (less than high school, high school, some college, college graduate or higher), (2) assignment in units of minutes to each item assuming estimates from Kalil et al.85 for mothers with less than a high school degree and (3) assignment in units of minutes to each item assuming estimates from Kalil et al.85 for mothers with some college education or higher. The magnitude of the treatment impact is substantively similar across each of these transformations. Thus, we report on the parent–child activities index in the pre-specified and pre-registered units by survey wave (Supplementary Table 6), the parent–child activities index among the items similarly asked across each of the survey waves, and a transformation of selective items from the index into minutes, as an interpretable unit of time use.
Supplementary Material
Acknowledgements
We thank O. Attanasio, D. Del Boca, F. Cunha, L. Katz, S. Lundberg and participants in the National Bureau of Economic Research’s Children’s Program March 2021 meeting, and in seminars at San Diego State University’s Center for Health Economics and Policy Studies and University of California Santa Barbara for feedback. In addition, we thank A. Karsh and L. Meyer for their important contributions to study support and infrastructure, and L. Basurto, C. Behrer, R. Daniel, E. Premo, M. Sauval, H. Shah, M. Spiegel, L. Stilwell, J. Wedewer and P. Youngmin Yoo for their assistance with data processing and analyses. We thank the University of Michigan Survey Research Center, our collaborators for recruitment, data collection and maintaining contact with families. We are profoundly grateful to the BFY study site community partners and families. Research reported in this publication was supported by the Eunice Kennedy Shriver National Institute of Child Health and Human Development of the National Institutes of Health under Award Number R01HD087384 (G.D., K.M. and K.G.N.) and 2R01HD087384 (G.D., L.A.G., K.M. and K.G.N.). The content is solely the responsibility of the authors and does not necessarily represent the official views of the National Institutes of Health. This research was additionally supported by the US Department of Health and Human Services, Administration for Children and Families, Office of Planning, Research and Evaluation (R01HD087384; G.D., K.M. and K.G.N. and 2R01HD087384; G.D., L.A.G., K.M. and K.G.N.); Office of Behavioral and Social Sciences Research-Office of the Director, National Institutes of Health (2R01HD087384; G.D., L.A.G., K.M. and K.G.N.); Andrew and Julie Klingenstein Family Fund (K.G.N.); Annie E. Casey Foundation (214.0183; K.G.N.); Arnold Ventures (21-06173; K.G.N.); Arrow Impact (K.G.N.); BCBS of Louisiana Foundation (K.M.); Bezos Family Foundation (K.G.N.), Bill and Melinda Gates Foundation (OPP1185312; K.G.N.); Bill Hammack and Janice Parmelee (K.M.), Brady Education Fund (G.D.); Chan Zuckerberg Initiative (Silicon Valley Community Foundation; 2017-177918; K.G.N.); Charles and Lynn Schusterman Family Philanthropies (13080; K.G.N.); Child Welfare Fund (13-1624202; K.G.N.); Esther A. and Joseph Klingenstein Fund (K.G.N.); Ford Foundation (0170-0832; K.G.N.); Greater New Orleans Foundation (K.M.); Heising-Simons Foundation (542569; K.M. and S.H.-M.); Holland Foundation (542709; K.G.N.); Jacobs Foundation (102535; G.D.); JPB Foundation (1132 and 2711 and 3652; K.G.N.); J-PAL North America (S5341 and 21-05679 G.D. and L.A.G.); Lozier Foundation (K.G.N.); New York City Mayor’s Office for Economic Opportunity (CT1 069 20201415397; K.G.N.); Perigee Fund (K.G.N.); Robert Wood Johnson Foundation (71446 and 75592 and 78562; K.G.N.); Robin Hood (L.A.G.); Sherwood Foundation (4288; K.G.N.); Valhalla Foundation (K.G.N.); Weitz Family Foundation (K.G.N.); W.K. Kellogg Foundation (P3031579; K.G.N.); and three anonymous donors (G.D. and K.M.). The funders had no role in study design, data collection and analysis, decision to publish or preparation of the manuscript.
Footnotes
Reporting summary
Further information on research design is available in the Nature Portfolio Reporting Summary linked to this article.
Code availability
No custom code was developed for this research. Analysis code is at https://www.openicpsr.org/openicpsr/project/159422/version/V2/view.
Competing interests
The authors declare no competing interests.
Supplementary information The online version contains supplementary material available at https://doi.org/10.1038/s41562-024-01915-7.
Data availability
The data that support the findings of this study are publicly available at the Inter-University Consortium for Political and Social Research (see Magnuson et al.87 at https://doi.org/10.3886/ICPSR37871.v5).
References
- 1.Aizer A, Hoynes H & Lleres-Muney A Children and the US social safety net: balancing disincentives for adults and benefits for children. J. Econ. Perspect 36, 149–174 (2022). [DOI] [PMC free article] [PubMed] [Google Scholar]
- 2.Almond D, Currie J & Duque V Childhood circumstances and adult outcomes: act II. J. Econ. Lit 56, 1360–1446 (2018). [Google Scholar]
- 3.National Academies of Sciences, Engineering, and Medicine. A Roadmap to Reducing Child Poverty (National Academies Press, 2019). [PubMed] [Google Scholar]
- 4.Aizer A, Eli S, Ferrie J & Lleras-Muney A The long-run impact of cash transfers to poor families. Am. Econ. Rev 106, 935–971 (2016). [DOI] [PMC free article] [PubMed] [Google Scholar]
- 5.Hoynes H, Schanzenbach DW & Almond D Long-run impacts of childhood access to the safety net. Am. Econ. Rev 106, 903–934 (2016). [Google Scholar]
- 6.Chetty R, Hendren N & Katz LF The effects of exposure to better neighborhoods on children: new evidence from the moving to opportunity experiment. Am. Econ. Rev 106, 855–902 (2016). [DOI] [PubMed] [Google Scholar]
- 7.Evans DK & Popova A Cash transfers and temptation goods. Econ. Dev. Cult. Change 65, 189–221 (2017). [Google Scholar]
- 8.Hammond S & Xu A Lead us not into temptation: how the child tax credit creates healthier families. Niskanen Center https://www.niskanencenter.org/the-child-tax-credit-reduces-spending-on-alcohol-and-tobacco/ (2021). [Google Scholar]
- 9.Winship S Reforming Tax Credits to Promote Child Opportunity and Aid Working Families (American Enterprise Institute, 2021). [Google Scholar]
- 10.Attanasio O, Cattan S & Meghir C Early childhood development, human capital, and poverty. Annu. Rev. Econ 14, 853–892 (2022). [Google Scholar]
- 11.Cunha F & Heckman J The technology of skill formation. Am. Econ.Rev 97, 31–47 (2007). [Google Scholar]
- 12.Algan Y et al. The impact of childhood social skills and self-control training on economic and noneconomic outcomes: evidence from a randomized experiment using administrative data. Am. Econ. Rev 112, 2553–2579 (2022). [Google Scholar]
- 13.Conti G, Heckman J & Pinto R The effects of two influential early childhood interventions on health and healthy behaviour. Econ. J 126, F28–F65 (2016). [DOI] [PMC free article] [PubMed] [Google Scholar]
- 14.Attanasio OP & Kaufmann KM Educational Choices, Subjective Expectations, and Credit Constraints. NBER Working Paper 15087 (NBER, 2009). [Google Scholar]
- 15.Banerjee AV & Duflo E Good Economics For Hard Times (Hachette, 2019). [Google Scholar]
- 16.Cunha F, Elo I & Culhane J Eliciting Maternal Expectations about the Technology of Cognitive Skill Formation. NBER Working Paper 19144 (NBER, 2013). [Google Scholar]
- 17.Mullins J Designing cash transfers in the presence of children’s human capital formation. Working Paper 2022–019. Human Capital and Economic Opportunity Global Working Group http://humcap.uchicago.edu/RePEc/hka/wpaper/Mullins_2022_designing-cash-transfers-childrens-humcap-formation.pdf (2022). [Google Scholar]
- 18.Del Boca D, Flinn C & Wiswall M Transfers to households with children and child development. Econ. J 126, F136–F183 (2016). [Google Scholar]
- 19.Del Boca D, Flinn C & Wiswall M Household choices and child development. Rev. Econ. Stud 81, 137–185 (2014). [Google Scholar]
- 20.Schild J et al. Effects of the Expanded Child Tax Credit on Household Spending: Estimates Based on US Consumer Expenditure Survey Data. NBER Working Paper 31412 (NBER, 2023). [Google Scholar]
- 21.Kornrich S & Furstenberg F Investing in children: changes in parental spending on children, 1972–2007. Demography 50, 1–23 (2013). [DOI] [PubMed] [Google Scholar]
- 22.Morrissey TW The earned income tax credit and short-term changes in parents’ time investments in children. J. Fam. Econ. Issues 44, 412–433 (2023). [DOI] [PMC free article] [PubMed] [Google Scholar]
- 23.Soni A & Morrisey T The effect of Medicaid expansion on home production and child care. South. Econ. J 88, 931–950 (2022). [Google Scholar]
- 24.Jones LE, Milligan K & Stabile M Child cash benefits and family expenditures: evidence from the national child benefit. Can. J. Econ 52, 1433–1463 (2019). [Google Scholar]
- 25.Amorim A Socioeconomic disparities in parental spending after universal cash transfers: the case of the Alaska dividend. Soc. Forces 101, 252–280 (2022). [Google Scholar]
- 26.Bessone P, Rao G, Schilbach F, Schofield H & Toma M The economic consequences of increasing sleep among the urban poor. Q. J. Econ 136, 1887–1941 (2021). [DOI] [PMC free article] [PubMed] [Google Scholar]
- 27.Bornstein MH & Bradley RH Socioeconomic Status, Parenting, and Child Development (Routledge, 2002). [Google Scholar]
- 28.Raver CC, Gershoff ET & Aber JL Testing equivalence of mediating models of income, parenting, and school readiness for white, black, and Hispanic children in a national sample. Child Dev. 78, 96–115 (2007). [DOI] [PMC free article] [PubMed] [Google Scholar]
- 29.Fox L, Han W-J, Ruhm C & Waldfogel J Time for children: trends in the employment patterns of parents, 1967–2009. Demography 50, 25–49 (2013). [DOI] [PMC free article] [PubMed] [Google Scholar]
- 30.Gennetian LA, Shafir E, Aber JL & de Hoop J Behavioral insights into cash transfers to families with children. Behav. Sci. Policy J 7, 71–92 (2021). [Google Scholar]
- 31.Romich JL & Weisner T How families view and use the EITC: advance payment versus lump sum delivery. Natl Tax. J 53, 1245–1265 (2000). [Google Scholar]
- 32.Zelizer VA Economic Lives: How Culture Shapes the Economy (Princeton Univ. Press, 2011). [Google Scholar]
- 33.Barr A, Eggleston J & Smith A Investing in infants: the effects of cash transfers to new families. Q. J. Econ 137, 2539–2583 (2022). [Google Scholar]
- 34.Duncan GJ, Morris PA & Rodrigues C Does money really matter? Estimating impacts of family income on young children’s achievement with data from random-assignment experiments. Dev. Psychol 47, 1263–1279 (2011). [DOI] [PMC free article] [PubMed] [Google Scholar]
- 35.Dahl GB & Lochner L The impact of family income on child achievement: evidence from the earned income tax credit. Am. Econ. Rev 102, 1927–1956 (2012). [Google Scholar]
- 36.Dahl GB & Lochner L The impact of family income on child achievement: evidence from the earned income tax credit: reply. Am. Econ. Rev 107, 629–631 (2017). [Google Scholar]
- 37.Hoynes H, Miller D & Simon D Income, the earned income tax credit, and infant health. Am. Econ. J 7, 172–211 (2015). [Google Scholar]
- 38.Almond D, Hoynes HW & Schanzenbach DW Inside the war on poverty: the impact of food stamps on birth outcomes. Rev. Econ. Stat 93, 387–403 (2011). [Google Scholar]
- 39.Anders J, Barr A & Smith A The effect of early childhood education on adult criminality: evidence from the 1960s through 1990s. Am. Econ. J 15, 37–69 (2023). [Google Scholar]
- 40.Barr A & Smith AA Fighting crime in the cradle: the effects of early childhood access to nutritional assistance. J. Hum. Resour 58, 43–73 (2023). [Google Scholar]
- 41.Black SE, Devereux PJ, Løken KV & Salvanes KG Care or cash? The effect of child care subsidies on student performance. Rev. Econ. Stat 96, 824–833 (2014). [Google Scholar]
- 42.Fenton G Gains from expanded child tax credit outweigh overstated employment worries. Center on Budget and Policy Priorities https://www.cbpp.org/research/federal-tax/gains-from-expanded-child-tax-credit-outweigh-overstated-employment-worries (2023). [Google Scholar]
- 43.Gabriel Zucker G & Snyderman R With CTC reform, implementation is half the battle. Bipartisan Policy Center https://bipartisanpolicy.org/blog/ctc-reform-implementation/ (2022). [Google Scholar]
- 44.Kanh H & Rhee D-E Does income (re)distribution matter for subjective well-being? Evidence from cross-country panel data. Soc. Sci. Q 102, 706–721 (2021). [Google Scholar]
- 45.Blanchflower D & Clark A Children, unhappiness and family finances. J. Popul. Econ 34, 625–653 (2021). [Google Scholar]
- 46.Guryan J, Hurst H & Kearney M Parental education and parental time with children. J. Econ. Perspect 22, 23–46 (2008). [Google Scholar]
- 47.Kalil A, Mayer S, Delgado W & Gennetian LA Education gradients in parental time investment and subjective well-being. NBER working paper 31712. NBER 10.3386/w31712 (2023). [DOI] [Google Scholar]
- 48.Shah H & Gennetian LA Unconditional cash transfers for families with children in the US: a scoping review. Rev. Econ. Househ 10.1007/s11150-023-09672-8 (2023). [DOI] [Google Scholar]
- 49.Hamilton C, Sariscsany L, Waldfogel J & Wimer C Experiences of poverty around the time of a birth: a research note. Demography 60, 965–976 (2023). [DOI] [PubMed] [Google Scholar]
- 50.Sperber JF et al. Unconditional cash transfers and maternal assessments of children’s health, nutrition, and sleep: a randomized clinical trial. JAMA Netw. Open 6, e2335237 (2023). [DOI] [PMC free article] [PubMed] [Google Scholar]
- 51.Jones D & Marinescu I The labor market impacts of universal and permanent cash transfers: evidence from the Alaska permanent fund. Am. Econ. Rev 14, 315–340 (2022). [Google Scholar]
- 52.Bibler A, Guettabi M & Reimer MN Universal cash transfers and labor market outcomes. J. Policy Anal. Manag 42, 198–224 (2023). [Google Scholar]
- 53.Stilwell L et al. Unconditional cash and breastfeeding, child care and maternal employment among families with young children residing in poverty. Soc. Serv. Rev 10.1086/729364 (2024). [DOI] [PMC free article] [PubMed] [Google Scholar]
- 54.Bastagli F et al. The impact of cash transfers: a review of the evidence from low- and middle-income countries. J. Soc. Policy 48, 569–594 (2019). [Google Scholar]
- 55.Yoo PY et al. Unconditional cash transfers and maternal substance use: findings from a randomized control trial of low-income mothers with infants in the US. BMC Public Health 22, 897 (2022). [DOI] [PMC free article] [PubMed] [Google Scholar]
- 56.Magnuson K et al. Can a Poverty Reduction Intervention Reduce Family Stress among Families with Infants? An Experimental Analysis. SSRN Working Paper (SSRN, 2022). [Google Scholar]
- 57.Mayer SE, Kalil A, Oreopoulos P & Gallegos S Using behavioral insights to increase parental engagement: the Parents and Children Together Intervention. J. Hum. Resour 54, 900–925 (2019). [Google Scholar]
- 58.Wimer C, Marti M, Brooks-Gunn J & Waldfogel J Early impacts of Room to Grow: a multifaceted intervention supporting parents and children age zero to three. Child Youth Serv. Rev 126, 106041 (2021). [DOI] [PMC free article] [PubMed] [Google Scholar]
- 59.Gennetian LA et al. Unconditional Cash and Family Investments in Infants: Evidence from a Large-Scale Cash Transfer Experiment in the US. NBER Working Paper 30379 (NBER, 2022). [Google Scholar]
- 60.Duflo E Grandmothers and granddaughters: old-age pensions and intrahousehold allocation in South Africa. World Bank Econ. Rev 17, 1–25 (2003). [Google Scholar]
- 61.Akee RK, Copeland WE, Keeler G, Angold A & Costello EJ Parents’ incomes and children’s outcomes: a quasi-experiment using transfer payments from casino profits. Am. Econ. J 2, 86–115 (2010). [DOI] [PMC free article] [PubMed] [Google Scholar]
- 62.Kooreman P The labeling effect of a child benefit system. Am. Econ. Rev 90, 571–583 (2000). [Google Scholar]
- 63.Benhassine N, Devoto F, Duflo E, Dupas P & Pouliquen V Turning a shove into a nudge? A ‘labeled cash transfer’ for education. Am. Econ. Rev 7, 86–125 (2015). [Google Scholar]
- 64.Akerlof G & Kranton R Economics and identity. Q. J. Econ 115, 715–753 (2010). [Google Scholar]
- 65.Knudsen EI, Heckman JJ, Cameron JL & Shonkoff JP Economic, neurobiological, and behavioral perspectives on building America’s future workforce. Proc. Natl Acad. Sci. USA 103, 10155–10162 (2006). [DOI] [PMC free article] [PubMed] [Google Scholar]
- 66.Heckman JJ The economics, technology and neuroscience of human capability formation. Proc. Natl Acad. Sci. USA 104, 13250–13255 (2007). [DOI] [PMC free article] [PubMed] [Google Scholar]
- 67.Noble C et al. The impact of shared book reading on children’s language skills: a meta-analysis. Educ. Res. Rev 28, 100290 (2019). [Google Scholar]
- 68.Wade SM in Handbook of Parenting: Theory and Research For Practice (eds Hoghughi M & Nicholas Long N) 198–212 (Sage Publications, 2004). [Google Scholar]
- 69.Cook GA, Roggman LA & Boyce LK Fathers’ and mothers’ cognitive stimulation in early play with toddlers: predictors of 5th grade reading and math. Fam. Sci 2, 131–145 (2011). [Google Scholar]
- 70.Hardaway CR, Sterrett-Hong EM, De Genna NM & Cornelius MD The role of cognitive stimulation in the home and maternal responses to low grades in low-income African American adolescents’ academic achievement. J. Youth Adolesc 49, 1043–1056 (2020). [DOI] [PMC free article] [PubMed] [Google Scholar]
- 71.Troller-Renfree S et al. The impact of poverty reduction intervention on infant brain activity. Proc. Natl Acad. Sci. USA 119, e2115649119 (2022). [DOI] [PMC free article] [PubMed] [Google Scholar]
- 72.Price J & Kalil A The effect of mother–child reading time on children’s reading skills: evidence from natural within-family variation. Child Dev. 90, 688–702 (2019). [DOI] [PubMed] [Google Scholar]
- 73.Randles J Fixing a leaky US social safety net: diapers, policy and low income families. J. Soc. Sci 8, 166–183 (2022). [Google Scholar]
- 74.Halpern-Meekin S, Gennetian LA, Hoiting J, Stilwell L & Meyer L Monthly unconditional income supplements starting at birth: experiences among mothers of young children with low incomes in the US. J. Policy Anal. Manag 10.1002/pam.22571 (2024). [DOI] [PMC free article] [PubMed] [Google Scholar]
- 75.Noble KG et al. Baby’s First Years: design of a randomized controlled trial of poverty reduction in the United States. Pediatrics 148, e2020049702 (2021). [DOI] [PMC free article] [PubMed] [Google Scholar]
- 76.Gibson-Davis C, Keister LA & Gennetian LA Net worth poverty in child households by race and ethnicity, 1989–2019. J. Marriage Fam 83, 667–682 (2021). [DOI] [PMC free article] [PubMed] [Google Scholar]
- 77.Gennetian LA et al. in Using Cash Transfers to Build an Inclusive Society: A Behaviorally Informed Approach (eds Soman D, Zhao J & Datta S) Ch. 9, 193–216 (Univ. of Toronto Press, 2023). [Google Scholar]
- 78.Gennetian LA & Shafir E The persistence of poverty in the context of financial instability: a behavioral perspective. J. Policy Anal. Manag 34, 904–936 (2015). [Google Scholar]
- 79.Mullainathan S & Shafir E Scarcity: Why Having Too Little Means So Much (Picador, 2013). [Google Scholar]
- 80.Hill HD, Morris P, Gennetian LA, Wolf S & Tubbs C The consequences of income instability for children’s well-being. Child Dev. Perspect 7, 85–90 (2013). [DOI] [PMC free article] [PubMed] [Google Scholar]
- 81.Morduch J & Schneider R The Financial Diaries: How American Families Cope in a World Of Uncertainty (Princeton Univ. Press, 2017). [Google Scholar]
- 82.Aditya A et al. Spending responses to high-frequency shifts in payment timing: evidence from the earned income tax credit. Am. Econo. J 15, 89–114 (2023). [Google Scholar]
- 83.Westfall PH & Young SS Resampling-Based Multiple Testing: Examples and Methods for P-Value Adjustment (Wiley, 1993). [Google Scholar]
- 84.Sauval M et al. Unconditional Cash Transfers and Maternal Employment: Evidence from the Baby’s First Years Study. SSRN Working Paper (SSRN, 2022). [Google Scholar]
- 85.Kalil A, Ryan R & Corey M Diverging destinies: maternal education and the development gradient in time with children. Demography 49, 1361–1383 (2012). [DOI] [PMC free article] [PubMed] [Google Scholar]
- 86.American time use survey—2022 results (June 22), Table 9. Bureau of Labor Statistics; https://www.bls.gov/news.release/pdf/atus.pdf (2023). [Google Scholar]
- 87.Magnuson KA et al. Baby’s First Years (BFY), New York City, New Orleans, Omaha, and Twin Cities, 2018–2021. Inter-university Consortium for Political and Social Research 10.3886/ICPSR37871.v5 (2023). [DOI] [Google Scholar]
Associated Data
This section collects any data citations, data availability statements, or supplementary materials included in this article.
Supplementary Materials
Data Availability Statement
The data that support the findings of this study are publicly available at the Inter-University Consortium for Political and Social Research (see Magnuson et al.87 at https://doi.org/10.3886/ICPSR37871.v5).