

Abstract
Type I and III interferons (IFNs) are robustly induced during infections and protect cells against viral infection. Both type I and type III IFNs are also produced at low levels in the thymus at steady state, however their role in T cell development and immune tolerance is unclear. Here we identified that both type I and III IFNs were constitutively produced by a very small number of AIRE+ murine thymic epithelial cells, independent of microbial stimulation. Antigen presenting cells were highly responsive to thymic IFNs, and IFNs were required for the activation and maturation of thymic DC1, macrophages and B cells. Loss of IFN-sensing led to reduced T regulatory cell selection, reduced T cell receptor (TCR) repertoire diversity and enhanced autoreactive T cell responses to self-antigens expressed during peripheral IFN signaling. Thus, constitutive exposure to IFNs in the thymus is required for generating a tolerant and diverse TCR repertoire.
One-Sentence Summary:
IFN shapes the thymic microenvironment by promoting unique transcriptomes and function in APC, and are required to select a diverse, self-tolerant TCR repertoire.
Introduction
Interferons (IFNs) provide a robust first line of defense against invading pathogens. Production of IFNs is rapidly induced upon viral infection, activating transcriptional programs that promote both innate and adaptive immune functions(1, 2). IFN production is largely restricted to infectious contexts, often requiring pathogen-associated molecular patterns (PAMPs) and ligation of pattern recognition receptors (PRRs). However, several studies have hinted that IFN-β (a type I IFN) and IFN-λ (type III interferon) are constitutively produced in the thymus(3–6), the site of T cell development and a crucial organ for immune tolerance. However, the cellular source of type I and type III IFN in the thymus, and the effect of constitutive IFN production on T cell development, remains unclear.
IFNs are divided into three groups based on sequence homology, receptor usage and functional properties. Our study here focused on type I and type III IFNs, which possess similar functional activities(7), distinct from the immunomodulatory functions of type II IFN (IFN-γ). Thymic cells including thymocytes(5, 8, 9), dendritic cells (DCs)(6) and B cells(10) constitutively sense IFN, as indicated by expression of interferon stimulated genes (ISGs) associated with type I and type III IFN signaling. How interferons might impact the complex populations of immune, stromal and progenitor cells in the thymus is unknown. In particular, the thymus accommodates a variety of antigen presenting cells (APCs), including medullary thymic epithelial cells (mTECs), DCs, macrophages and B cells that present self-peptide-MHC (self-p:MHC) complexes to developing T cells(11–13) in order to coordinate the selection of a functional and safe T cell receptor (TCR) repertoire(11). Importantly, the composition of the self-p:MHC complexes encountered by thymocytes is largely determined by the gene expression profiles of thymic APCs, which may be in part regulated by thymic IFN. Furthermore, several highly activated sub-populations of thymic DC play crucial roles in thymic selection and central tolerance, yet the exact signals required for the generation and maintenance of these subsets are not understood. For example, thymic SIRPα+ cDC2 contain a population of MHCIIhigh CD301b+ cDC2 that are potent mediators of clonal deletion and require type 2 cytokines (Il-4, Il-13) for their generation(14). Alternatively, thymic XCR1+ cDC1 are involved in regulatory T cell (Treg) selection and can cross present AIRE-dependent antigens acquired from mTECs, but the signals promoting thymic cDC1 maturation have yet to be described(6, 12, 15). Thus, understanding the impact of constitutive IFN on the thymic microenvironment is important.
Here, we characterize the production and impact of interferons in the complex thymic microenvironment. We found that IFN-β and IFN-λ are each produced by a very small number of distinct MHC-II+ mTEC (mTEChigh) cells. This IFN production is largely, although not entirely, dependent on the transcriptional regulator AIRE and it does not require microbial cues or PRR signaling. Furthermore, we demonstrated that most cells in the thymic microenvironment respond to both type I IFN and type III IFN, and these IFN signals significantly shape thymic APC composition - driving DC1, macrophage and B cell maturation. Finally, we show that the selection of a diverse and self-tolerant TCR repertoire requires thymic interferon signaling.
Results
Sterile IFN-β and IFN-λ are expressed in a subset of mTEC cells
In order to study how interferons are regulated in the thymus, we obtained Ifnb1-luciferase reporter mice (Ifnbluc) (Fig. 1A)(4). Luciferase expression is present in the thymus of these mice at steady state and mTEC are the main producers(4). We observed highest expression of luciferase within the CD80+ MHCII+ subset of mTEC (mTEChigh) (Fig. 1B). Given the cellular heterogeneity of mTEC(16, 17), we aimed to characterize IFN-β expression at the single cell level. We developed an Ifnb1tdTomato knock-in reporter mouse strain (Fig. S1A, B) and performed cytometric analysis of thymi, using markers that distinguish immature mTEClow, mTEChigh and post-AIRE mTEC, which include mimetic cells (16, 17) (Fig. S1C). IFN-β was not detected in hematopoietic cells (Fig. 1D, S1D), and within stromal cells, its expression was restricted to mTEChigh cells (Fig. 1C and S1C), of which only 1-2% were positive for tdTomato.
Figure 1. Sterile IFNβ and IFNλ are expressed in a subset of mTEC cells.

(A) The measurement of bioluminescent light emission in Ifnb1luc mice injected with D-Luciferin at 2 and 7 weeks of age. Representative pictures are shown. (B) Distribution of luciferase activity (relative light units, RLU) in various cell populations isolated from the thymus of Ifnb1luc mice, n=3 mice from 3 independent experiments. (C) Representative flow cytometry plots of IFN-β and IFN-λ expression in mTEChigh (gated as CD45−EpCAM+Ly51-MHCIIhigh) from Ifnb1tdTomato and Ifnl2eGFP mice. (D) Frequency of tdTomato+ or eGFP+ cells among thymic CD45+ cells and stromal subpopulations (gating strategy shown in Fig. S1C and D) from Ifnb1tdTomato and Ifnl2eGFP mice, n=4-8 mice from 2 independent experiments. (E) Frequency of tdTomato+ and eGFP+ cells in mTEChigh from Aire−/−Ifnb1tdTomato and Aire−/−Ifnl2eGFP mice, n=3-9 mice from 2 independent experiments. (F) Luciferase bioluminescence (average flux in photons/second) (Ifnb1luc mice) or frequency of eGFP+ mTEChigh cells (Ifnl2eGFP mice) was measured at different ages, n=1-8 mice per time point. (G) Ifnb1, Ifnl2 and Ifnl3 expression by qPCR in sorted mTEChigh from WT, Aire−/−, Mavs−/−Sting−/−, Myd88−/−Trif−/−, and Germ-free mice (GF) presented relative to the expression in mTEChigh from WT mice, n=3-4 mice from 2 or 3 independent experiments. (H) Representative flow cytometry plots and frequency of tdTomato+ or eGFP+ cells in mTEChigh from Ifnb1tdTomato+/−Ifnl2eGFP+/− mice from different age (embryonic day 18.5 (E18.5), 2 days (D2) and 29 days (D29)), n=6-8 mice per 1 or 2 independent experiments. Statistical analysis was performed by a one-way ANOVA with multiple comparison test (B) or unpaired t-test (E). Data are shown as mean ± SD, **p≤0.01.
Type III IFN (IFN-λ) is also constitutively produced in the thymus by mTECs(3), therefore to compare the expression of type I and III IFN we next obtained Ifnl2 eGFP reporter mice(18). eGFP expression was similarly restricted to a small proportion of these (1-2%) mTEChigh cells (Fig 1C, D and S1C, D). This expression pattern is consistent with that of other previously described AIRE-regulated genes(19, 20). Indeed, imaging of thymic slices from interferon reporter mice revealed that a majority of IFN-β+ or IFN-λ+ mTEC also expressed Aire (S1E). Therefore, we examined Aire−/− mice. We observed reduced expression of both IFN reporters in mTEChigh cells from Aire−/− mice (Fig. 1E) consistent with previous findings(3, 4). qPCR of endogenous IFN transcripts in Aire−/− mice recapitulated this finding (Fig. 1G). Ifnl2/3 expression was less dependent on AIRE than Ifnb1. We further confirmed these findings using publicly available bulk RNA sequencing analysis of thymic APC(21, 22) (Fig S2A,B). Interestingly, expression of other type I IFNs was much lower than that of Ifnb1 in both mTEC and hematopoietic APC, suggesting that Ifnb1 production by mTECs is the primary source of type I IFN in the thymus. We observed a similar paradigm in bulk RNAseq data from healthy human mTEChigh cells, which expressed IFN-β and IFN-λ transcripts, with minor expression of IFN-a transcripts (Fig. S2C). Notably, human mTECs were distinct from murine in expressing IFN-κ; and IFNL1, and IFNL4, which are pseudo-genes in mice.
While using Ifnbluc mice, we noted that weanling mice had a striking signal in the thymus (Fig. 1A). Thus, we investigated the temporal dynamics of luciferase expression in the thymus. We observed luciferase expression to be highest at 3 weeks of age, although it continued to be expressed at low levels throughout adulthood (Fig. 1F). eGFP expression showed similar temporal regulation in Ifnl2eGFP mice. The high expression of both IFNs around the time of weaning suggested that expression of IFN in the thymus could be regulated by gut commensal changes, which are high early in life and wane after weaning(23). Thus, we sorted mTEChigh cells from germ-free as well as Toll-like receptor (TLR) signaling deficient mice (Myd88−/−Trif−/−). However, Ifnb1 and Ifnl2/3 expression in mTEChigh cells was not different than that of mTEChigh cells from conventionally housed WT mice of the same age (Fig. 1G). Given that AIRE+ mTEChigh cells were reported to be higher in number early in life(24, 25) we compared the temporal abundance of AIRE+ cells within the thymus to that of IFN reporter expression. We observed similar temporal patterns between thymic IFN expression and AIRE+ mTEC, even when corrected for the total number of cells in the thymus (Fig. S2D). Thus, we conclude that the high expression of thymic IFNs in early life likely reflects its AIRE dependence.
We next examined the role of RANKL, since a previous study showed that RANKL induced IFN-β expression in mTEC cells cultured in vitro, and those authors concluded that IFN-β induced both the development of mTEC and their expression of AIRE(26). However, we did not observe a reduction in any TEC subsets or AIRE expression in mTEC in mice lacking Ifnar1, the receptor for IFN-β (Fig. S2E, F). We also tested the role of RANKL in vivo using short-term RANKL blockade. Two days of anti-RANKL treatment resulted in a 2-fold decrease in luciferase expression in Ifnb1luc mice, but also resulted in a 2-fold decrease in the number of mTEC expressing AIRE (Fig. S2G, H). Overall, these results are most consistent with a model where RANKL signaling induces AIRE, which induces variegated expression of IFN-β and IFN-λ.
Although both IFN-β and IFN-λ were dependent on AIRE, we questioned whether AIRE might stimulate IFN production by de-repressing endogenous retroelement expression, which is high in mTEC(27, 28) or by causing DNA damage(29), either of which can stimulate IFN production through cytosolic sensors (MAVS or STING)(30, 31). To determine whether IFN production was dependent on the sensing of non-self or damage-associated nucleic acids, we analyzed IFN transcript levels in mTEChigh cells from mice deficient in the genes for both Mavs and Sting1. There was no decrease in IFN production in Mavs−/−/Sting1−/− mice compared to WT controls. (Fig. 1G) These findings suggest that thymic IFN is not induced by traditional innate immune signaling pathways. Finally, we observed tdTomato and eGFP in different cells in Ifnl2eGFP Ifnb1tdTomato mice, (Fig. 1H) which would not be expected if a microbial sensor was activating an innate immune response to induce IFN production. We also detected the expression of both reporters very early in life - day 2 after birth in the case of Ifnb1tdTomato and Ifnl2eGFP in embryonic tissue (Fig. 1H) – again confirming that production of these interferons in the thymus happens in sterile environments. Altogether, these results suggest that AIRE drives the sterile production of type I and type III IFN in the thymus, independent of microbial cues and pattern recognition receptor signaling.
Thymic APCs are highly responsive to steady-state interferons
To determine which cells in the thymic microenvironment respond to IFN, we used a reporter mouse that expresses GFP under the control of the endogenous Mx1 locus (Mx1eGFP)(32). Mx1 is an ISG induced by IFN-a/β and IFN-λ (33). We found that numerous antigen presenting cells (APC) – including B cells, DCs, monocytes and macrophages– were GFP+ in these mice, implying that they respond constitutively to thymically produced IFN. Neutrophils and eosinophils were GFP− (Fig. 2A and S3A), and only a small fraction of mTEChigh were GFP+ even though they are the major IFN producing cells (Fig. S3B). Interestingly the geometric mean fluorescence intensity (gMFI) of GFP was notably higher in thymic APC than the analogous APC from the spleen which indicates that the thymic IFN response is stronger than the systemic “basal” IFN response described previously(32, 34, 35) (Fig. 2B). This is also consistent with the stronger steady-state luciferase signal in the thymus of Ifnb1luc mice (Fig. 1A).
Figure 2. Thymic APCs are highly responsive to steady-state interferons.
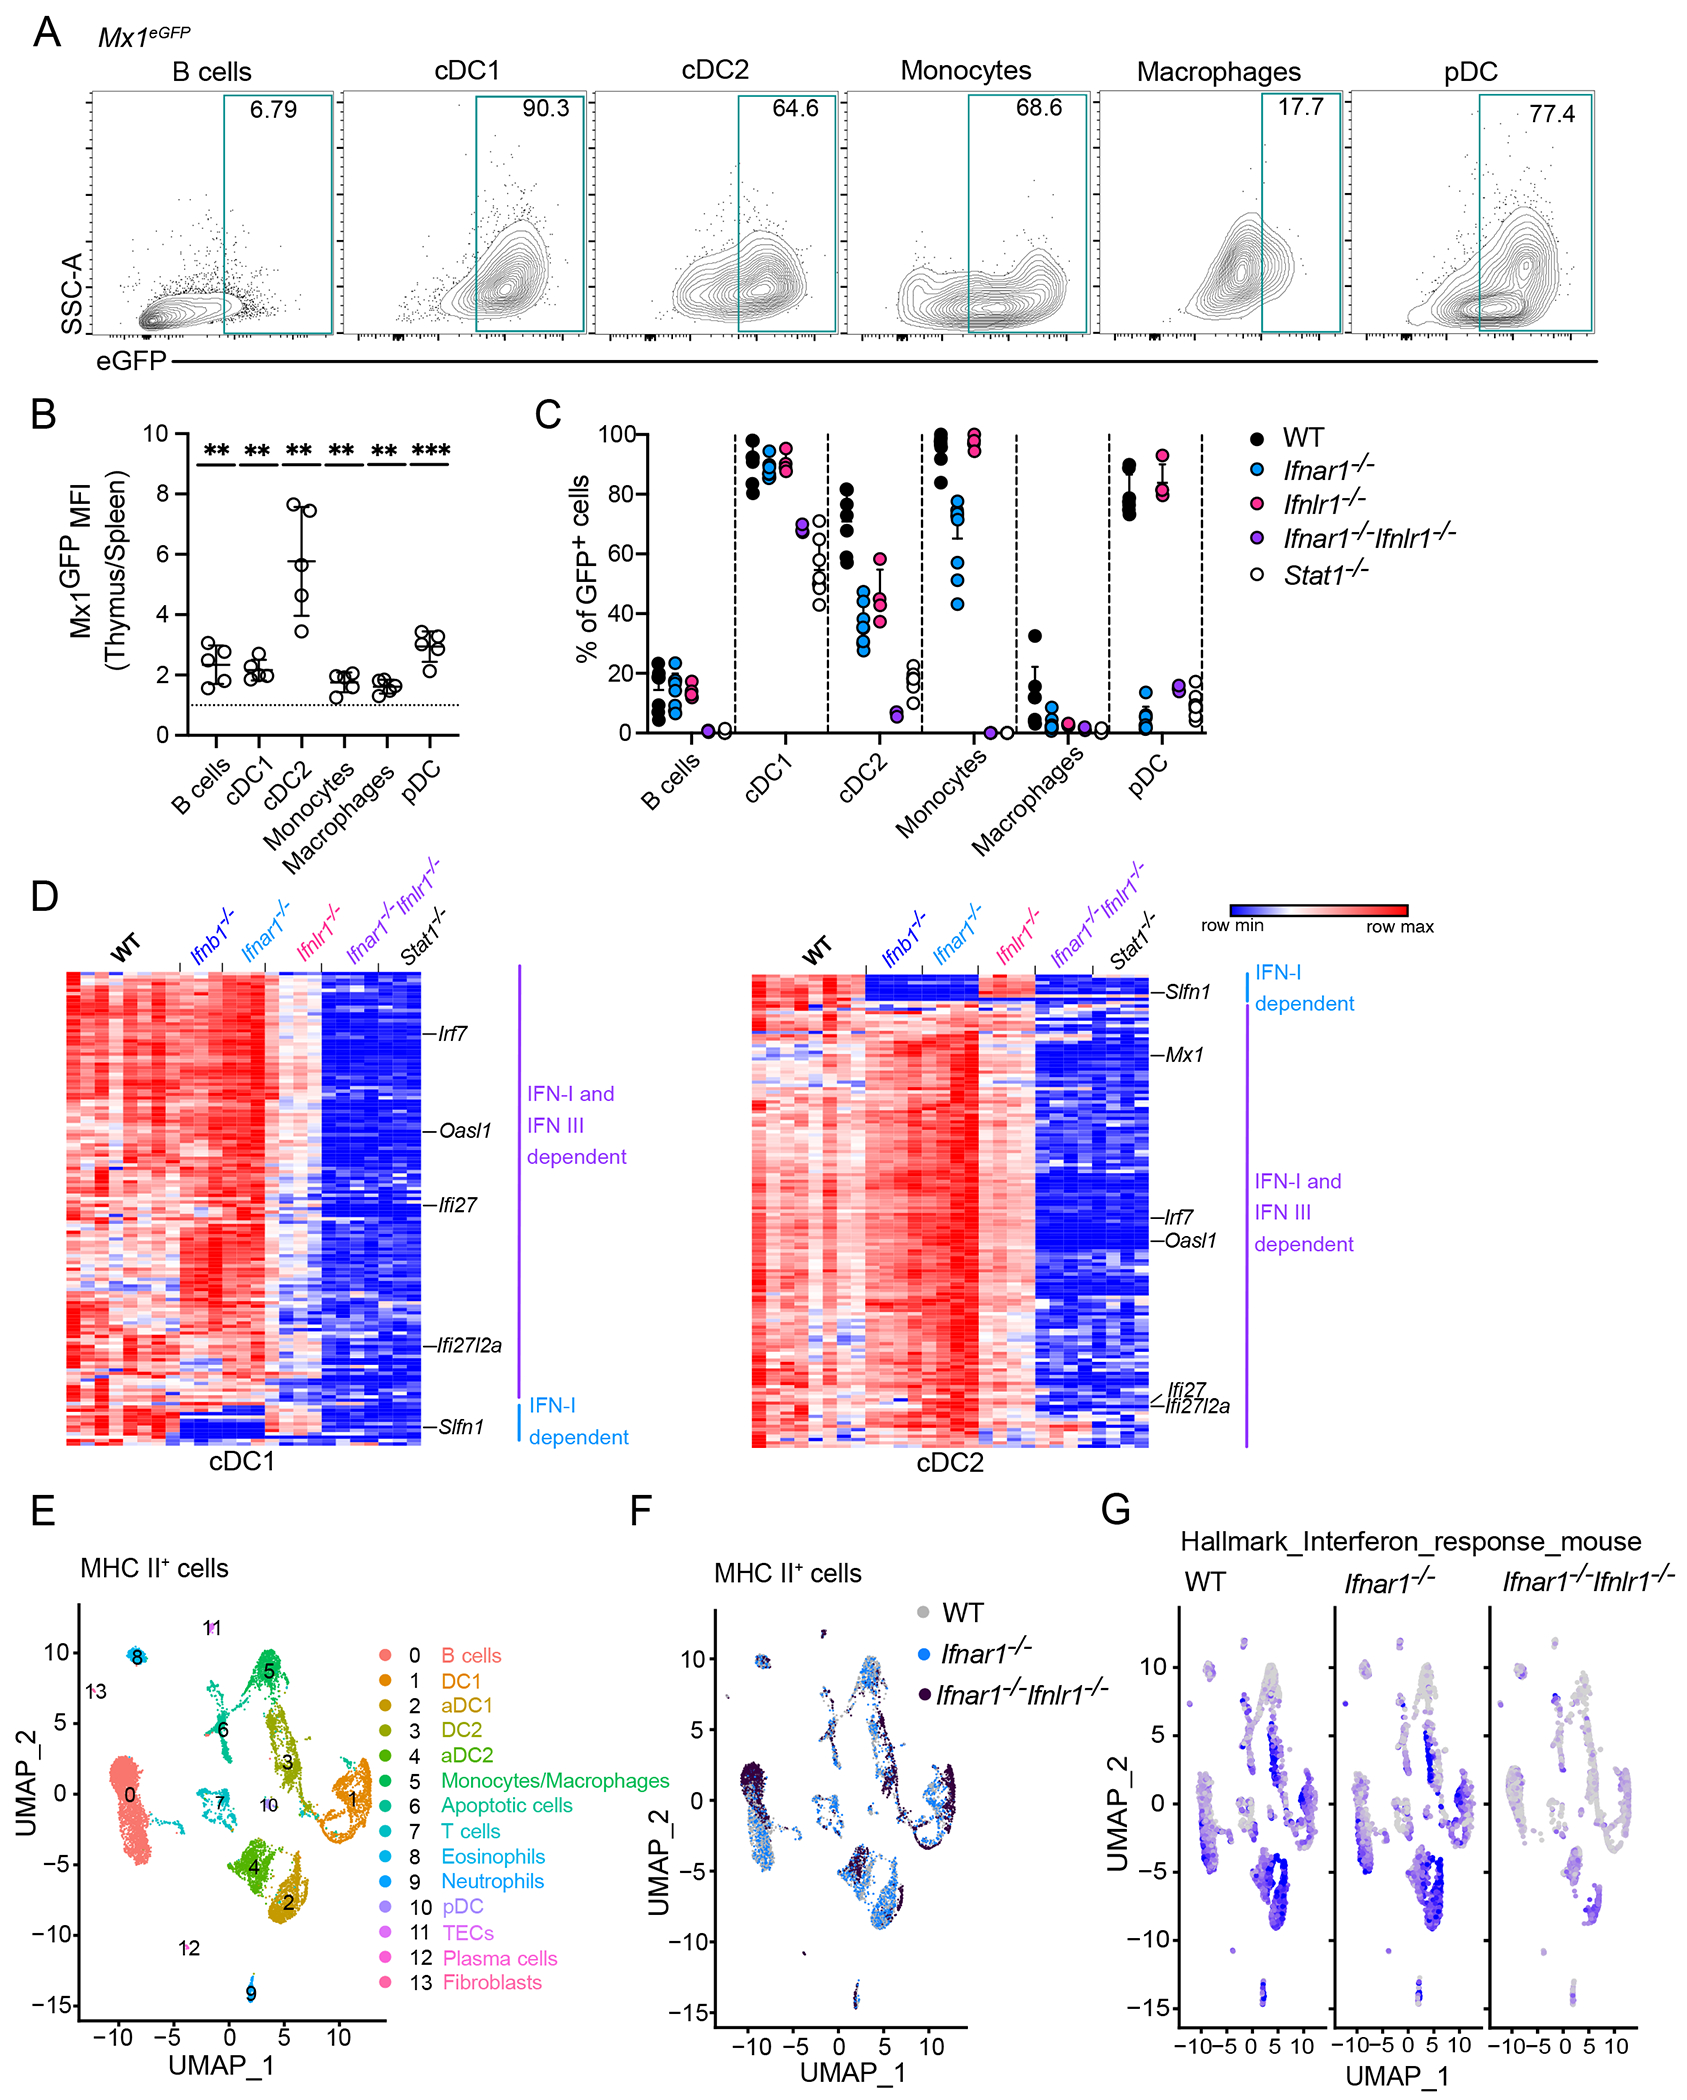
(A) Representative flow cytometry plots of Mx1 expression in populations of thymic hematopoietic APCs from Mx1eGFP mice. eGFP+ gates were set up according to the individual WT controls per each cell type. (B) Ratio of geometric mean fluorescence (gMFI) of eGFP in the thymus vs. spleen for the indicated populations, n=5 mice. (C) Frequency of eGFP+ cells in populations of thymic hematopoietic APCs from Mx1eGFP mice crossed with Ifnar1−/−, Ifnlr1−/−, Ifnar1−/−Ifnlr1−/−, and Stat1−/− mice, n=3-7 from 3 independent experiments. (D) Transcriptomic analysis of thymic XCR1+ cDC1 and SIRPα+ cDC2 by bulk RNA sequencing sorted from Ifnb1−/−, Ifnar1−/−, Ifnlr1−/−, Ifnar1−/−Ifnlr1−/−, and Stat1−/− mice. Heatmaps display unsupervised clustering of the normalized expression of genes significantly downregulated in Stat1−/− compared to the WT in each population, n=3-8 mice. (E) MHC class II-expressing cells from thymus of WT, Ifnar1−/− and Ifnar1−/−Ifnlr1−/− were FACS-sorted, captured with a 3’ Single Cell V5 chemistry platform, and sequenced. Cell hashing was used to distinguish the genotypes of origin. Data are shown as a UMAP plot from all 10,743 transcriptome events showing 14 clusters identified. (F) UMAP plot presented in (E) using Cell hashing to identify cells from WT, Ifnar1−/−, and Ifnar1−/−Ifnlr1−/− mice. (G) Feature plots showing normalized expression of genes associated with “Hallmark interferon response mouse” in WT, Ifnar1−/−, and Ifnar1−/−Ifnlr1−/− mice. Statistical analysis in (B) was performed by one sample t and Wilcoxon test with theoretical mean 1. Data are shown as mean ± SD, **p≤0.01, ***p≤0.001.
Although both type I and type III IFN signaling require STAT1 and result in the upregulation of overlapping groups of ISGs, these two signaling pathways are distinct – involving different receptors and cytokines for their initiation(7). Using Mx1 as a model ISG, we next aimed to determine how type I and type III IFN signaling pathways are involved in ISG expression by different thymic APC. We found that GFP expression was lost in pDC and mTEChigh populations when Mx1eGFP were crossed with Ifnar1−/− mice, suggesting these cells respond only to type I IFN (Fig. 2C, S3C). Analysis of mTEChigh cells from Ifnb1tdTomato x Mx1eGFP mice revealed that type I IFN-stimulated ISG expression by mTEChigh can occur through both autocrine and paracrine signaling as we detected low frequencies of Mx1eGFP+ cells among both IFN-producing (tdTomato+) and IFN-negative mTECs (Fig. S3D). However, GFP was not lost in thymic B cells, monocytes, macrophages and XCR1+ cDC1, SIRPα+ cDC2, unless both Ifnar1 and Ifnlr1 were deficient, suggesting these cells were responding to both type I and type III IFN (Fig. 2C). Analysis of Mx1eGFP mice deficient in all IFN signaling pathways (Stat1−/−) further corroborated these results (Fig. 2C). Curiously, even STAT1 deficiency did not entirely eliminate GFP expression in DC1 cells.
We next used bulk RNAseq to analyze the transcriptomes of the major thymic DC populations (Fig. 2D) and mTEChigh cells (Fig. S3E) from mice deficient in type I IFN signaling, (Ifnb1−/−, Ifnar1−/−), type III IFN signaling (Ifnlr1−/−), both type I and type III IFN signaling (Ifnar1−/− /Ifnlr1−/−), or Stat1−/− mice, with complete loss of all IFN signaling. We identified a large group of genes whose expression was dependent on STAT1 (Fig. 2D). Expression of these genes was also lost in Ifnar1−/− /Ifnlr1−/− mice, excluding the role of type II IFN (IFN-γ) in ISG expression in thymic DC. We also found that, except for a small group of genes that were lost from Ifnb1−/− and Ifnar1−/− mice, most ISGs were only lost from thymic DC when both type I and type III IFN signaling were deficient (Fig. 2D, Supplementary data file S1) suggesting that these pathways have significant redundancy. Our transcriptional analysis of mTEChigh cells suggested that they might be less responsive to type I and type III IFN signaling than thymic DC, as mTEChigh cells expressed fewer IFN-responsive genes (Fig. S3E). This observation agrees with our analysis of Mx1eGFP expression in mTECs, which is lower (by frequency and MFI) than Mx1eGFP expression by thymic DC. We also identified that Mx1 was not differentially expressed among cDC1 from IFN-signaling deficient mice (Supplementary data file S1), corroborating data from Mx1eGFP mice, and suggesting that a low level of Mx1 expression by cDC1 was independent of IFN-signaling. These data highlight the complexity of IFN-stimulated transcriptional changes, as Mx1 expression is highly IFN-dependent in many other thymic APC, and cDC1 themselves express many other classical ISGs that do require IFN-signaling.
To appreciate the newly described heterogeneity in thymic APCs(14, 36, 37) we performed single cell RNA sequencing (scRNAseq) analysis on total MHC class II-expressing thymic cells from WT, Ifnar1−/− and Ifnar1−/−/Ifnlr1−/− mice. After processing, we obtained sequences from 10,743 cells that were divided using UMAP dimensionality reduction into 14 cell clusters (Fig. 2E). Using feature plot analysis of signature genes (Supplementary data file S2) we were able to identify the 6 most populated clusters (#0 - 5) accounting approximately 75% of thymic APC; B cells (Cd19), DC1 (Xcr1), activated DC1 (aDC1) (Xcr1, Ccr7), DC2 (Sirpa, Mgl2), activated DC2 (aDC2) (Sirpa, Ccr7) and monocyte/macrophages cluster (Fcgr1) (Fig. 2E, S3F). Two of the four DC clusters expressed Xcr1, thus were labeled DC1 and aDC1. The gene expression differences between DC1 and aDC1 were consistent with those described between CCR7+ activated and CCR7− XCR1+ resting DCs(6). The other two DC clusters expressed Sirpa and were labeled DC2 and aDC2, where aDC2 resembled the aDC1 by the expression of Ccr7 and other genes(14, 36). The remaining clusters (#6-13) were identified as apoptotic cells, T cells, eosinophils, neutrophils, pDC, TEC, plasma cells and fibroblasts, respectively (signature genes in Fig. S3F). These clusters were expected to be small due to either low expression levels of MHC II (#6-10, 12-13) or inefficient cell recovery with the digestion protocol used (collagenase D) (#11). We also examined the expression of type I and III IFN receptors (Ifnar1 and Ifnlr1) in different thymic APC populations. As expected Ifnar1 was broadly expressed among all cells, but the expression of Ifnlr1 was mainly restricted to B cells and cDCs and was not expressed by pDC (Fig. S3G). This is consistent with Fig. 2C where ISG expression in pDC was dependent only on Type I IFNs.
All the major thymic APC populations showed a striking transcriptome shift between WT and IFN-signaling deficient samples (Fig. 2F). Consistent with the bulk RNAseq analysis of DCs, the DEG analysis of all the main clusters found only a handful of DEGs between WT and Ifnar1−/−, but an extensive list when WT and Ifnar1−/−/Ifnlr1−/− were compared (Fig. S4A, Supplementary data file S3). Feature plot analysis of “Hallmark Interferon Response mouse”(38) shows that the transcriptional shift seen mainly between WT and Ifnar1−/−/Ifnlr1−/− is almost exclusively caused by changes in ISG expression (Fig. 2G). To further scrutinize these IFN-dependent gene expression changes, we created heat maps to visualize the normalized expression of the IFN-dependent genes in the main clusters (Fig. S4B). Even though different ISG were present in each cell type, we also observed a large ISG expression overlap between the clusters that consisted largely of canonical ISG (Ifi27l2a, Irf7, Oasl1, Stat1, Bst2, etc.) (Fig. S4A, B). In agreement with bulk RNAseq data some ISGs showed different patterns of type I and III IFN regulation. For example, Ifi27l2a and Ifi44 were regulated by IFNαR alone, meanwhile Isg15 was only differentially expressed in Ifnar1−/−/Ifnlr1−/− mice (Fig. S4B, C). To verify that sterile expression of IFNs in the thymus drives expression of ISG by thymic APC, we designed a set of canonical ISG primers (Ifi27l2a, Irf7 and Oasl1), based on our previous data (Fig. 2D and S4B) and performed qPCR analysis of these genes in sorted thymic APCs. As expected, given our RNAseq data, we observed profound reductions in ISG expression in Ifnar1−/−/Ifnlr1−/− animals (Fig. S4D). Although ISG expression was reduced in thymic APC from Aire−/− mice, it was not completely lost. This partial loss of ISG-expression is consistent with data in Figure 1 from Ifnb1 and Ifnl2 reporter mice, in which we observed some residual AIRE-independent expression of Ifnl2 in particular (Fig. 1E). Furthermore, we did not see changes in ISG expression in GF, Myd88−/−/Trif−/− or Mavs−/−/Sting1−/− mice (Fig. S4E). Together, these data show that thymic APCs are highly responsive to steady-state type I and III IFNs, leading to the robust expression of ISGs in the thymic milieu.
Type III interferon drives maturation of thymic DC1, macrophages and B cells
Given the involvement of some ISGs in maturation and antigen presentation, we were curious whether thymic IFNs play a role in driving maturation programs in thymic APCs. Indeed, when the analysis was broken down by cell hashtags, Ifnar1−/−/Ifnlr1−/− mice showed notably fewer cells in the CCR7+ DC1 (aDC1), monocytes/macrophage and B cell clusters, compared to WT and Ifnar1−/− mice (Fig. 3A). Interestingly, all three of these populations exhibit highly activated states in the thymus, (6, 39) (40, 41) (10, 42, 43) and previous work from our lab has already confirmed that type III IFN sensing is critical to the activation of B cells(10). Notably, the aDC2 cluster, another highly activated subset of thymic APC, was not decreased in Ifnar1−/−/Ifnlr1−/−, suggesting that their maturation is independent of type I and type III IFN signaling (Fig. 3A), despite their robust expression of classical IFN-stimulated genes (Fig. 2D, S4B).
Figure 3. Type III interferon drives maturation of thymic DC1, macrophages, and B cells.

(A) UMAP analysis of scRNA sequencing data presented in Fig. 2E separated by barcoded antibodies for WT, Ifnar1−/−, and Ifnar1−/−Ifnlr1−/− cells. The clusters showing the most pronounced differences between the genotypes (B cells, aDC1 and Monocytes/Macrophages) are marked by the dash line. (B, C, D) Representative flow cytometry plots and graphs showing differences in the frequency and numbers of aDC1 (XCR1+CCR7+ DCs) (B), MHCII+ macrophages (CD64+CD11c+MHCII+) (C) and class-switched B cells (B220+, CD11c−, Ly6C+IgD−) (D) between WT and Ifnar1−/−, Ifnlr1−/−, Ifnar1−/−Ifnlr1−/−, and Ifgnr1−/− mice. Cell gating shown in Fig. S5A. Differences are shown as KO/WT ratios of cell numbers, n=5-16 mice from at least 3 independent experiments. (E) Representative flow cytometry plots of aDC1 cells from Thymus and Spleen of WT and Ifnar1−/−Ifnlr1−/− mice. (F) Frequency of aDC1 and MHCII+ macrophages in 50:50 mixed bone marrow chimeras from WT and Ifnlr1−/− mice analyzed 6 weeks after reconstitution, n=5 mice. (G) Numbers of aDC1, MHCII+ macrophages and Ly6C+ B cells in Aire−/− shown as KO/WT ratios of cell numbers, n=5 mice from 2 independent experiments. Statistical analysis was performed by a one-way ANOVA with multiple comparison test (F) or one sample t and Wilcoxon test with theoretical mean 1 (B, C, D, G). Data are shown as mean ± SD, *p≤0.05, **p≤0.01, ***p≤0.001, ****p≤0.0001, n.s. = not significant.
To confirm that thymic aDC1, macrophages and B cells were dependent on thymic IFN signaling and investigate whether type I and type III IFN have redundant roles in these populations, we designed a gating strategy to enable flow cytometric analysis of cells from these scRNAseq clusters (Fig. S5A) in Ifnar1−/−, Ifnlr1−/− and Ifnar1−/−/Ifnlr1−/−. Additionally, we analyzed mice deficient for type II IFN receptor (Ifngr1−/−), since the maturation of DCs in the peripheral tissues was shown to be abrogated in Ifngr1−/− mice(44) (45). We found that numbers of aDC1 but not their DC1 precursors were reduced by approximately 50% in Ifnlr1−/− and Ifnar1−/−/Ifnlr1−/− but not in Ifnar1−/− or Ifngr1−/− mice, suggesting a major involvement of type III IFN in DC1 maturation in the thymus (Fig. 3B and Fig. S5B). Consistent with scRNAseq analysis, numbers of DC2 and aDC2 were not reduced in any of the IFN receptor KO mice (Fig. S5C and S5D). Similarly, pDC numbers were only slightly reduced in Ifnar1−/−/Ifnlr1−/− mice (Fig. S5E), suggesting a limited contribution of thymic IFN in pDC maturation, which was unexpected given their complete dependence on type I IFN signaling for ISG expression (Fig. 2C). Using CD64 to identify thymic macrophages, we found that the CD11c+MHCIIhigh subpopulation of these cells was reduced by greater than 50% in Ifnlr1−/− and Ifnar1−/−/Ifnlr1−/− mice, but not Ifnar1−/− or Ifngr1−/− mice (Fig. 3C). In agreement with previous work from our lab, thymic B cell licensing (IgD−Ly6c+ cells) was ablated in Ifnlr1−/− mice(10) (Fig. 3D, S5F). We then analyzed the spleen of WT and Ifnar1−/−/Ifnlr1−/− mice to determine whether the requirement for type I and III IFN sensing was specific to the thymus. We observed far fewer aDC1, MHCIIhigh macrophages and licensed B cells in the spleen compared to the thymus at steady state. However, even among these smaller populations, there was no or very limited change in the numbers of peripheral aDC1, macrophages, or licensed B cells in Ifnar1−/−/Ifnlr1−/− mice (Fig. 3E, S5G).
We next wanted to confirm that the requirement for type III IFN sensing by DC1 and macrophages was cell intrinsic. Using mixed bone marrow chimeras, we found that Ifnlr1−/− progenitors were diminished in their ability to give rise to aDC1 and MHCIIhigh macrophages compared to WT progenitors, confirming a cell intrinsic role of type III IFN sensing in these maturation processes (Fig. 3F, S5H). Additionally, thymic aDC1, MHCIIhigh macrophages and licensed B cells were all decreased in Aire−/− mice, consistent with our previous finding that AIRE drives expression of IFN-λ by mTECs (Fig. 3G). Notably, we did not find a role for type III IFN in TEC development – as observed in Ifnar1−/− mice (Fig. S2E,F), TEC populations were unchanged in Ifnlr1−/− and Ifnar1−/−/Ifnlr1−/− animals (Fig. S5I), with the exception of a modest reduction in post-Aire mTEC in Ifnar1−/−/Ifnlr1−/− animals. These data confirm that the sterile production of IFN in the thymus provides a unique environment that supports robust activation of hematopoietic APC, even in the absence of overt infection.
Thymic interferon signaling promotes TCR repertoire diversity
To determine how the IFN-dependent changes in thymic APC might impact the development of T cells, we analyzed thymocytes from Ifnar1−/−, Ifnlr1−/− and Ifnar1−/−/Ifnlr1−/− mice. We found that Ifnar1−/− deficiency did not impact the frequency of DP (CD4+CD8+), CD4SP (CD4+CD8−TCR+) or CD8SP (CD4−CD8+TCR+) thymocytes (Fig. 4A, S6A), in agreement with previous reports, (5). This was also true for Ifnlr1−/− and Ifnar1−/−/Ifnlr1−/− mice (Fig. 4A). Functional markers of T cell maturity – downregulation of CD69 and upregulation of CD62L – occurred in Ifnar1−/−, Ifnlr1−/− and Ifnar1−/−/Ifnlr1−/− mice (Fig. 4B), although we observed subtle defects in the frequency of the most mature thymocytes among CD4SP (Fig. 4C) and CD8SP (Fig. S6B), Nonetheless, IFN-receptor deficient mice were not lymphopenic and peripheral T cell composition resembled that of wild type controls, leading us to conclude that T cell development is generally intact in mice deficient in type I and type III IFN signaling (Fig. S6C).
Figure 4. Thymic interferon signaling promotes TCR repertoire diversity.

(A-B) Representative flow cytometry plots comparing murine thymocyte frequencies. (C) Frequency of mature CD4+SP thymocytes among total CD4SP. (D) Average CDR3 peptide read counts (normalized as counts per million) among CD4+ T conventional T cells (Tconv) from WT (TclibTgTcra+/−) and Ifnar1−/− (TclibTgTcra+/−Ifnar1−/−) mice. Dots are colored according to the log10(FDR) value for each CDR3. Squares represent CDR3 with FDR ≤0.05 between WT and Ifnar1−/− mice, n=5 mice per genotype. CDR3 peptide plotted below a CPM of 1 were not detected. Pie chart shows summary of DE analysis. (E) Shannon diversity (left) and species richness (right) of CDR3 peptide counts in murine CD4+ Tconv, n=5 mice. (F) Average CDR3 peptide read counts (normalized as counts per million) among CD4+ Tconv from WT (TclibTgTcra+/−) and Ifnar1−/−Ifnlr1−/− (TclibTgTcra+/− Ifnar1−/−Ifnlr1−/−) mice. Dots colored according to the log10(FDR) value for each CDR3. Squares represent CDR3 with FDR ≤0.05 between WT and Ifnar1−/−Ifnlr1−/− mice, n=6 mice per genotype. CDR3 peptide plotted below a CPM of 1 were not detected. Pie chart shows summary of DE analysis. (G) Shannon diversity (left) and species richness (right) of CDR3 peptide counts in CD4+ murine Tconv, n=6 mice. (H) Frequency of CD5+TCRβ+CD25− cleaved caspase 3+ CD4+SP murine thymocytes, n=12-27 mice per at least 2 independent experiments. (I) Violin plot from scRNAseq (Fig. 2E) showing expression of Ciita by cDC2 population (left). Ratio of geometric mean fluorescence (gMFI, right) of MHCII. Differences shown as KO/WT ratios of cell gMFI, n=4-8 mice from 2 independent experiments. (J) Ratio of numbers of CD301b+ cDC2, n=9-12 mice from 2 independent experiments. Statistical analysis was performed by one-way ANOVA with multiple comparison test (C, H), unpaired t-test (E, G) or one sample t and Wilcoxon test with theoretical mean 1 (I). Data are mean ± SD, *p≤0.05, **p≤0.01, ***p≤0.001, ****p≤0.0001, n.s. = not significant.
We were interested in whether IFNs might impact thymic selection, especially given our observation that IFN signaling changes the transcriptome and activation state of thymic APC, which could influence the self-peptidome presented to developing thymocytes(46). To determine whether there were differences in the TCR repertoire of IFN-signaling deficient mice, we analyzed the TCRα repertoire of Ifnar1−/− and Ifnar1−/−/Ifnlr1−/− crossed to TCRβ transgenic animals (TclibTg). (Fig. S6D). The Ifnar1−/− conventional CD4SP repertoire was highly similar to WT animals – we detected no difference in repertoire diversity and there were very few differentially expressed CDR3 sequences (Fig. 4D, E). However, there were dramatic differences when we compared the WT repertoire to that of Ifnar1−/−/Ifnlr1−/− mice. The diversity of the Ifnar1−/−/Ifnlr1−/− conventional repertoire was reduced compared to WT, driven by lower species richness (less unique CDR3 sequences) (Fig. 4F, G) Furthermore, nearly a third of the filtered repertoire was overrepresented in WT animals compared to Ifnar1−/−/Ifnlr1−/− animals, consistent with a loss of specific CDR3 sequences from the Ifnar1−/−/Ifnlr1−/− repertoire (Fig. 4F). Notably, when we used these same parameters to compare the conventional CD4SP repertoires of two cohorts of WT mice, we found no differentially expressed receptors (Fig. S6E). We also observed a shift in CDR3 length distribution in the Ifnar1−/−/Ifnlr1−/−( but not Ifnar1−/−) repertoire (Fig. S6F), consistent with altered selection in Ifnar1−/−/Ifnlr1−/− mice.
To determine whether these repertoire differences were detectable in Ifnar1−/−/Ifnlr1−/− animals without a transgenic TCRβ, we stained lymphocytes from the spleen with a panel of Vb and Va antibodies. We detected an increase in the frequency of conventional CD4 T cells expressing Vb8.1/.2 and a decrease in cells expressing Va3.2 (Fig. S6G). Although these shifts in Vb/Va usage are subtle, these findings are significant given the rich diversity of the naïve TCR repertoire, and provide good confirmation that the TCR repertoire of Ifnar1−/−/Ifnlr1−/− animals is distinct from WT.
Although we observed a decrease in conventional repertoire diversity in Ifnar1−/−/Ifnlr1−/−, we did not detect any differences in the frequency of post-selection DP thymocytes, suggesting that IFN signaling does not affect the process of thymocyte positive selection (Fig. S6H). To determine whether the decrease in diversity in Ifnar1−/−/Ifnlr1−/− mice was due to increased clonal deletion, we utilized a previously described “cleaved caspase 3” assay to identify CD4SP undergoing clonal deletion in the thymus(47). We observed approximately a 20% increase in clonally deleted CD4SP in Ifnar1−/−/Ifnlr1−/− mice (Fig. 4H). There was a similar increase in deletion among CD4SP in Ifnlr1−/− mice, but not in Ifnar1−/− mice – suggesting that the enhanced clonal deletion in Ifnar1−/−/Ifnlr1−/− mice is likely due to the loss of type III IFN signaling. Previous work found that deficiencies in cDC1result in increased clonal deletion, possibly due to a compensatory increase in DC2, which are potent mediators of clonal deletion(14). This is interesting given the decrease in aDC1 that we observed in Ifnar1−/−/Ifnlr1−/− mice. Perhaps even subtle deficiency in cDC1 is accompanied by increased functionality of DC2, and thus increased clonal deletion. Consistent with this hypothesis, we found that expression of MHCII transactivator Ciita and MHCII levels were increased on cDC2. We also observed increased numbers of CD301b+ cDC2 in Ifnar1−/−/Ifnlr1−/− mice compared to WT (Fig. 4I, J and S6I). These observations are consistent with our hypothesis that the loss of aDC1, a result of IFN receptor deficiency, may result in an increase in clonal deletion, thus reducing the diversity of the mature T cell repertoire.
Interferon plays a crucial role in Treg selection and central tolerance
We next examined thymic Treg cell generation in Ifnar1−/−, Ifnlr1−/− and Ifnar1−/−/Ifnlr1−/− mice. Frequencies of mature Treg cells were not changed in Ifnar1−/− mice, consistent with previous reports that type I IFN signaling is dispensable for thymic Treg generation at steady state(48) (Fig. 5A,B). In contrast, mature Treg cells and Treg progenitors were decreased in Ifnlr1−/− and Ifnar1−/−/Ifnlr1−/− mice (Fig. 5A, B, Fig. S7A). Using CD73 and CD62L staining to distinguish nascent and recirculating Treg cells we found that both were reduced in Ifnlr1−/− and Ifnar1−/−/Ifnlr1−/− mice (Fig. S7B) This may reflect the loss of key Treg-selecting APC populations when mice are deficient in type III IFN signaling. Alternatively, the observation that Treg generation was largely intact in Ifnar1−/− mice provided an interesting opportunity to determine whether the small, mostly ISG-related transcriptional changes in thymic APC in Ifnar1−/− mice could impact the Treg TCR repertoire. Unlike Ifnlr1−/− and Ifnar1−/−/Ifnlr1−/− mice, Treg-selecting APC populations in Ifnar1−/− mice were intact, while expression of some classical ISGs was decreased (Fig. 3A and S4B).
Figure 5. Interferons Plays a Crucial Role in Treg selection and central tolerance.

(A) Representative flow cytometry plots comparing frequency of murine Treg cells (B) Frequency of mature (CD25+FOXP3+) Treg cells among total murine CD4SP, n=7-23 mice from at least 3 independent experiments. (C) Average CDR3 peptide read counts (normalized as counts per million) among Treg cells (CD4+CD25+GITR+) from WT (TclibTgTcra+/−) and Ifnar1−/− (TclibTgTcra+/−Ifnar1−/−) mice. Dots are colored according to the log10(FDR) value for each CDR3. Squares represent CDR3 with FDR ≤0.05 between WT and Ifnar1−/− mice, n=5 mice per genotype. CDR3 peptide plotted below a CPM of 1 were not detected. Pie chart shows summary of DE analysis. (D) Shannon diversity (left) and species richness (right) of CDR3 peptide counts in Treg cells from WT and Ifnar1−/− mice, n=5 mice. (E) Average CDR3 peptide read counts (normalized as counts per million) among Treg cells from WT (TclibTgTcra+/−) and Ifnar1−/−Ifnlr1−/− (TclibTgTcra+/− Ifnar1−/−Ifnlr1−/−) mice. Dots are colored according to the log10(FDR) value for each CDR3. Squares represent CDR3 with FDR ≤0.05 between WT and Ifnar1−/−Ifnlr1−/− mice, n=6 mice per genotype. CDR3 peptide plotted below a CPM of 1 were not detected. Pie chart shows summary of DE analysis. (F) Shannon diversity (left) and species richness (right) of CDR3 peptide counts in Treg cells from WT and Ifnar1−/−Ifnlr1−/− mice, n=6 mice. (G) Design of experiment. (H) Quantification of CFSE dilution by flow cytometry analysis of CD4+ T cells isolated from WT, Ifnb1−/−, and Aire−/− mice intravenously transferred into the WT mice previously stimulated with PolyI:C (PI:C, 200μg) or PBS (control mice). CD4+ T cells were isolated from the spleen of donor mice 7 days after the transfer. T cells from Aire−/− mice were used as positive controls, n=5-7 mice. Statistical analysis was performed by a one-way ANOVA with multiple comparison test (B, H), unpaired t-test (D, F). Data are shown as mean ± SD, *p≤0.05, **p≤0.01, ***p≤0.001, ****p≤0.0001, n.s. = not significant.
To determine whether the Treg TCR repertoire was impacted by Ifnar1 deficiency, Tregs were sorted from the thymi and sequenced as described above (Fig. S6D). We found that ~27% of the filtered Treg TCR repertoire was underrepresented in Ifnar1−/− compared to WT mice (Fig. 5C), even though the conventional repertoires were similar (Fig. 4D). Treg TCR repertoire diversity was also modestly decreased in Ifnar1−/− mice (Fig. 5D). As a control, when we used this same analysis to compare two cohorts of WT mice, we identified no differentially expressed Treg TCRs (Fig. S7C). We also analyzed the TCR repertoire of Ifnar1−/−/Ifnlr1−/− mice (Fig. 5D). As expected, given the reduced diversity of conventional CD4SP thymocytes from Ifnar1−/−/Ifnlr1−/− mice, the Treg TCR repertoire had greatly decreased diversity compared to WT - approximately ~55% of the filtered repertoire was up in WT mice compared to Ifnar1−/−/Ifnlr1−/− mice (Fig. 5F.) Consistent with data from conventional CD4SP cells we also observed the slight shift in CDR3 length distribution in the Ifnar1−/−/Ifnlr1−/−(but not Ifnar1−/−) repertoire of Tregs (Fig. S7D). Altogether, these data suggest that, while type III IFN promotes Treg generation by enhancing the antigen presentation capacity of numerous thymic APC, type I IFN may be required specifically for the selection of Tregs specific for ISG-derived self-antigens.
Given the shift in Treg TCR repertoire of Ifnar1−/− mice, we hypothesized that type I IFN signaling was required for central tolerance to ISG-derived self-antigens. To determine whether type I IFN signaling impacted immune tolerance, we used a syngeneic adoptive transfer approach(43). Importantly, IFNAR is expressed by mature T cells and type I IFN signaling can be involved in the activation, migration, and proliferation of peripheral T cells. To avoid confounding impacts of T cell intrinsic IFN signaling, Ifnb1−/− T cells were used in these experiments in lieu of Ifnar1−/− T cells. Conventional CD4 T cells were isolated from WT, Ifnb1−/− and Aire−/− mice (as a positive control). CFSE labeled CD4 T cells were transferred into congenically marked WT mice and T cell proliferation was measured 7 days post transfer (Fig. 5G). Thus, Ifnb1−/− T cells here developed in the absence of type I IFN signaling but can sense type I IFN cytokines when transferred into WT mice. To increase IFN production and expression of ISGs, we also treated some recipient mice with the TLR3 agonist Poly I:C (PI:C). Interestingly, we did not observe any change in proliferation between the T cells from WT mice and Ifnb1−/− when transferred into PBS-treated WT mice (Fig. 5H). This could be because the robust expression of ISGs outside of the thymus requires stimulation of type I IFN production. Indeed, under inflamed conditions (when recipient mice were treated with PI:C), we observed an increase in proliferation (by approximately 50%) of T cells from Ifnb1−/− mice (Fig. 5H). In fact, the increased proliferation of Ifnb1−/− cells in PI:C treated mice reached almost the same level as T cells isolated from Aire−/− mice – suggesting that expression of type I IFN (in this case IFN-β) during thymic development was critical for tolerance to the inflammation-associated self-antigens expressed in the context of PI:C treatment. Notably, the proliferation of T cells from Aire−/− mice was further increased when transferred into PI:C treated recipients. This is consistent with our observation that IFN-β production by mTECs is regulated by AIRE and suggests that tolerance to ISGs is also dysregulated by AIRE deficiency.
Altogether these data support the critical role of Type I and Type III IFNs signaling in thymic Treg generation and suggest that thymic expression of Type I IFNs is required to provide the tolerance to ISG-derived self-antigens (Fig. S8A).
Discussion
The thymus is the site of T cell development and a critical organ for immune tolerance(13). T cells maintain self-tolerance at steady state, but critically, they need to maintain self-tolerance during bouts of infection and inflammation as well. The displayed self-peptidome has been shown to change dramatically during infection, due to the many effects of interferons on antigen processing and presentation pathways(1, 2, 46). Thus, the finding that IFN is produced constitutively in the thymus(3, 4) has stimulated much interest in the potential impact of these cytokines on T cell development and selection(49).
In this study, we used interferon reporter strains to confirm that production of both type I and type III IFN by mTEC is controlled by the transcriptional regulator AIRE, but were surprised to find it was not disrupted by loss of TLR signaling, deficiencies in cytosolic nucleic acid sensors or disruption of the microbiome in germ free mice. Thus, it is unlikely that IFN production by mTECs requires sensing of endogenous retroviruses (ERVs) – an intriguing possibility given recent reports that mTECs express especially high levels of ERVs(28) and that ERVs are involved in IFN production by epithelial cells in the skin(31). Our finding that IFN-λ expression was only partially ablated in Aire−/− mice suggests that other mechanisms may also be involved in production of type III IFN. Taken as a whole, the data suggest that thymic production of IFN cytokines is sterile.
Using IFN signaling reporter mice, we found that all thymic APCs express IFN-stimulated genes at steady state, indicative of strong transcriptional responses to these cytokines. Thymic APC expression of IFN-stimulated genes was complex – including classical ISGs involved in anti-viral responses and cell type-specific genes associated with APC maturation and activation, such as the induction of class switch recombination by type III IFN in thymic B cells(10). These observations suggest a distinct paradigm from many previously descried AIRE-regulated tissue-specific genes, most of which do not have any known physiological functions in the thymus apart from their antigenicity. In this case, AIRE-driven expression of IFN cytokines has myriad downstream effects on the thymic milieu. Thymic IFN signaling likely has dramatic impacts on the self-peptidome presented to developing T cells – due to both enhanced expression of inflammation-associated genes (such as Mx1, Ifitm3, Isg15) and changes in antigen processing (such as induction of immuno-proteasome subunits.) Furthermore, IFN signaling was required for the maturation of several key Treg-selecting APC populations. First, thymic B cells, which have been shown to play a role in both deletion(50) and Treg selection(10, 51, 52) (43)of self-reactive CD4SP, required type III IFN for licensing and intra-thymic class switching as described previously (10). DC1 also required type III IFN for their activation – a particularly interesting finding given previous work that has implicated DC1 in selection of AIRE-dependent Tregs through cross-presentation of tissue-specific antigens acquired from AIRE+ mTECs(15). Additionally, a population of highly activated MHCIIhigh macrophages was also dependent on type III IFN signaling and previous work has indicated that phagocyte-presented self-antigen in the thymus can enhance negative selection(41). Thus, the AIRE-dependent expression of type I and type III IFN has dramatic impacts on both the maturation of thymic APCs and the nature of antigens they present to thymocytes during selection.
We hypothesized that such changes in thymic APC were likely to have an impact on T cell selection and central tolerance. Specifically, we were curious whether thymic IFN was required for tolerance to inflammation-associated self-antigens, such those derived from ISGs and antigens that require processing by immunoproteasome subunits for their presentation. Using IFN-receptor deficient animals, we showed that Treg cell generation and repertoire diversity was indeed dependent on IFNs – perhaps due to changes in Treg selecting APC and/or reduced expression of co-stimulatory molecules. We were surprised to find that the T cell repertoire of conventional T cells was also less diverse in Ifnar1−/−/Ifnlr1−/− animals – potentially indicative of a defect in positive selection or excessive negative selection. We did not find any change in the frequency of post-selection DP thymocytes (suggesting that positive selection is grossly normal in Ifnar1−/−/Ifnlr1−/− mice), but we did detect a consistent increase in clonal deletion. This increase was consistent with an increase in CD301b+ DC2 (which were previously shown to potently delete self-reactive CD4SP(14)) and distinctly higher levels of MHCII in Ifnar1−/−/Ifnlr1−/− mice. Thus, we favor the idea that DC1/DC2 compete for a shared niche and that deficiency in one population can result in a compensatory increase in the other. This shared DC niche in the thymus is a particularly intriguing paradigm given their nonredundant roles in T cells selection – previous work suggests that DC1 are highly efficient at Treg selection(12, 15), while DC2 are potent mediators of clonal deletion(14). These data suggest that type III IFN may play a crucial role in establishing a balance between these two populations, which in turn tend to favor opposing selection outcomes.
Interestingly, we did not observe any changes in Treg numbers or frequency in Ifnar1−/− mice. This observation is in agreement with our finding that thymic APC maturation is largely intact in the absence of type I IFN signaling. Thus, Ifnar1−/− animals provided an excellent system to determine whether the small, mostly classical ISG-related, transcriptional changes in thymic APC could impact T cell selection and tolerance to ISG-related antigens. Indeed, we found that the Treg TCR repertoire (but not the conventional CD4SP TCR repertoire) was less diverse than the WT Treg repertoire in Ifnar1−/− mice, due to the loss of a specific subset of Treg clones. We postulate that these TCRs are specific for ISG-derived self-antigens, although confirming the specificity of these TCRs is difficult due to the large number of possible ISGs and lack of known MHCII-binding peptides derived from these gene products. Furthermore, it is difficult to reconcile the small number of differentially expressed genes in Ifnar1−/− APC with the relatively large number of differentially expressed Treg receptors in these mice (~27% of the filtered TCR repertoire.) Although it is not possible to draw quantitative comparisons between TCR repertoire datasets, (due to differences in experimental design, data analysis, and use of mice with different fixed TCRβ chains,) it is certainly puzzling that previous reports have found smaller shifts in the repertoire of Aire−/− mice than we report here in IFN-receptor deficient mice, especially given the involvement of Aire−/− in production of IFN. For example, Malchow et al reported that 2.7% of the peripheral Treg repertoire was dependent on AIRE(53) and Perry et al reported that 10% of the thymic Treg repertoire was AIRE-dependent(15). Interestingly, a 2014 report estimated that bone marrow-derived APCs were responsible for ~30% of CD4SP deletion and ~60% of Treg selection(12). Thus, our repertoire data in Ifnar1−/−/Ifnlr1−/− mice in particular could be consistent with broad functional alterations of hematopoietic APCs in the thymus rather than antigen-specific differences in selection. Notably, although the Treg TCR of Batf3−/− (cDC1 deficient) mice has been previously characterized(15, 54), the field lacks detailed knowledge of the conventional TCR repertoire of Batf3−/− mice, which could provide useful insight into this paradigm.
If type I IFN dependent TCRs were specific for ISG-derived self-antigens, their failure to be diverted to the Treg lineage would be predicted to result in the escape of self-reactive clones. Indeed, the enhanced proliferation of Ifnb1−/− KO T cells compared to WT when transferred into polyI:C treated recipients provides some preliminary evidence that loss of type I IFN during development can result in the escape of self-reactive clones. In fact, during these studies, several other groups have provided interesting evidence that the thymus is involved in generating tolerance to ‘inflamed-self’; these studies have found that human patients with mutations in AIRE(55, 56) or NFkB(57)(required for mTEC differentiation) generate high affinity class-switched autoantibodies that recognize IFNs – suggesting that these individuals lack T cell tolerance to IFN cytokines. Unfortunately, detection of anti-IFN autoantibodies in AIRE deficient SPF housed mice has proven difficult. As such, we were not able to utilize anti-IFN autoantibodies as a readout of tolerance in these studies.
Although there is still much left to understand about the specificity of IFNR-dependent Treg cells, how they are selected in the thymus and their role in tolerance during inflammation, these data - combined with the discovery of anti-IFN autoantibodies in humans with deficiencies in thymic selection - provide compelling evidence that the thymus is involved in generating immune tolerance to inflammation-associated self-antigens, and that constitutive exposure to IFNs in the thymus generates a tolerant and diverse TCR repertoire.
Materials and Methods
Study design
In this study, we combined the use of IFN reporter mice with various gene deficient mice to define the signals that lead to IFN production in the thymus of mice. We used mice lacking the type I or type III IFN receptors, or both, in order to define the effects of IFN on thymocyte development. Deep sequencing of Tcra genes in TCRb transgenic mice with IFNR deficiency was used to define the effect of IFNs on the T cell repertoire.
Mice
5- to 7-weeks old males and females (unless otherwise stated), age-matched mice were used for experiments. C57BL/6NCrl (CD45.2) and B6.SJL-PtprcaPepcb/BoyCrl (CD45.1) were purchased from the Charles River Laboratories. B6.129S2-Airetm1.1Doi/J (Aire−/−), B6.129S2-Ifnar1tm1Agt/Mmjax (Ifnar1−/−), B6.129S(Cg)-Stat1tm1Dlv/J (Stat1−/−), B6.129S7-Ifngr1tm1Agt/J (Ifngr1−/−), B6.129P2(SJL)-Myd88tm1.1Defr/J (Myd88−/−), C57BL/6J-Ticam1Lps2/J (Trif−/−), B6;129-Mavstm1Zjc/J (Mavs−/−), B6(Cg)-Sting1tm1.2Camb/J (Sting−/−) and B6.129S2TcraTm1Mom/J (Tcra−/−) mice were obtained from Jackson Laboratories. Ifnb1tm2.2Lien mice (Ifnb1luc) were kindly provided by S. David (University of Minnesota) and have been described previously(4). Ifnb11dTomato reporter mice were created by D. B. Stetson (University of Washington) and reported here (Figure S1A). Ifnl2eGFP mice were kindly provided by Joan E. Durbin (Rutgers New Jersey Medical School) and have been described previously(18). Ifnlr1tm1.2Svko mice (Ifnlr1−/−) were kindly provided by Sergei V. Kotenko (Rutgers New Jersey Medical School) and have been described previously(58). B6.Cg-Mx1tm1.1Agsa/J mice (Mx1eGFP) were kindly provided by A. García-Sastre (Icahn School of Medicine at Mount Sinai) and have been described previously(32). Tg(Tcrb51–11.5)AR1251Ayr mice (TClibTg) were described previously(59). B6.129P2-Ifnb1tm1Acgp mice (Ifnb1−/−) were kindly provided by E. Fish (University of Toronto) and have been described previously(60). C57BL/J Germ-free (GF) mice were obtained from National Gnotobiotic Rodent Resource Center (University of North Carolina School of Medicine). All animal experiments were approved by the Institutional Animal Care and Use Committee of the University of Minnesota. All animals (except GF mice) were maintained under specific pathogen-free conditions at the University of Minnesota.
Ifnb1tdTomato reporter mice
Targeting of C57BL6/J embryonic stem (ES) cells and generation of chimeric mice was performed by Biocytogen. A construct was targeted immediately downstream of the endogenous Ifnb stop codon using Cas9 and a gRNA targeting the genomic site TGCAACCACCACTCATTCTGAGG; the underlined sequence represents the protospacer adjacent motif (PAM). The construct included an encephalomyocarditis virus (EMCV) internal ribosome entry site (IRES), coding sequence for the tdTomato red fluorescent protein, a picornavirus T2A “self-cleaving” peptide, a nuclear localization sequence (NLS)-containing Cre recombinase, and a bovine growth hormone (BGH) polyadenylation (pA) sequence that bypasses the endogenous polyadenylation site in the 3’ untranslated region of the Ifnb gene. After the BGH pA sequence, the construct contained a FRT site-flanked phosphoglycerate kinase (PGK)-neomycin resistance cassette. The insertion cassette was flanked by ~2 kilobase homology arms on either side, and a Diptheria Toxin A (DTA) gene at the 3’ end to select against random insertions. Successful targeting of ES cells was confirmed by PCR. After germline transmission, the knock-in mice were confirmed by sequencing and then bred to FLPer mice to remove the FRT-flanked neo cassette.
Cell isolation and Flow cytometry
Thymic epithelial cells were isolated as described elsewhere(61). Briefly, the thymus was digested using 0.05% Liberase (TH Research Grade, Roche) dissolved in RPMI. The tissue was pipetted up and down several times and incubated for 10-15 minutes at 37°C. The supernatant was collected, and reaction was stopped by adding 2% FBS and 2mM EDTA in PBS. This process was repeated three times or until the tissue is completely dissolved. The final cell suspension was filtered using 70mM cell strainers and washed with 2% FBS and 2mM EDTA in PBS. The CD45 negative fraction was enriched using anti-CD45 microbeads (Miltenyi Biotec) according to manufacturer’s instructions and stained for 30 minutes at 4°C with the indicated antibodies.
Thymic, Splenic or lymph node myeloid cells and B cells were isolated using Collagenase D (1mg/ml, Roche) dissolved in 2% FBS and 10mM HEPES in HBSS (with Ca2+, Mg2+). Tissues were finely minced in 900μl of Collagenase D solution and incubated for 30 minutes at 37°C (pipetted up end down several times after 15 minutes). The final suspension was passed through 70μM cell strainers and reaction was stopped by adding 2% FBS and 2mM EDTA in PBS. Cells were stained with Fc block (anti-CD16/CD32; 2.4G2, Tonbo Biosciences) for 15 minutes at 4°C and then incubated for 30 minutes at 37°C with anti-CCR7 antibody (4B12, Thermo Fisher). Cells were washed and stained for 30 minutes at 4°C with the indicated antibodies.
For T cells isolation, thymus was mechanistically mashed through 70μM cell strainers, washed with 0.5% BSA in PBS and stained for 30 minutes at 4°C with the indicated surface antibodies. For FoxP3 (FJK-16s, Thermo Fisher) staining, the Foxp3/Transcription Factor Staining Buffer Kit (Tonbo Biosciences) was used according to manufacturer’s instructions.
Samples were acquired with Fortessa X-20, X-30, H1770 or LSRII (BD Biosciences) and analyzed with FlowJo (FlowJo LLC).
Antibodies
Antibodies purchased from BioLegend: CD11c (N418), CD25 (PC61), CD80 (16-10A1), CD45 (30-F11), CD64 (X54-5/7.1) CD172a (SIRPα; P84), Ly-51 (6C3), CD45.1 (A20), CD45.2 (104), EpCAM (G8.8), H-2Kb (AF6-88.5), CD11b (M1/70), CD301b (URA-1), GITR (DTA-1), XCR1 (ZET),
Antibodies purchased from BD Biosciences: CD4 (RM4-5), CD8a (53-6.7), CD69 (H1.2F3), TCRβ (H57-597), CCR7 (4B12), CD104 (346-11A), CD45R (B220; RA3-6B2), Ly-6G (1A8), Siglec-F (E50-2440), CD62L (MEL-14), IgD (11-26c.2a)
Antibodies purchased from Thermo Fischer: CD5 (53-7.3), I-A/I-E (M5/114.15.2), AIRE (5H12), FoxP3 (FJK-16s), Ly-6C (HK1.4), AIRE (5H12)
Antibodies purchased from Cell Signaling: Cleaved Caspase-3 (ASP175, D3E9)
Agglutinin purchased from Vector Laboratories: UEA-1 (FL-1061)
Luciferase assays
For ex vivo luciferase measurement of populations from Ifnb1luc mice, MACS separation columns were used (Miltenyi Biotech): depletion with CD45 microbeads was followed by CD80 enrichment (labeling with PE conjugated CD80, anti-PE microbeads). Samples were treated with cell culture lysis buffer (Promega), and luciferase activity was measured in a luminometer (Berthold) using the luciferase assay system following the manufacturer’s protocol (Promega).
For in vivo imaging, mice were injected i.p. with 150 mg/Kg of D-luciferin in PBS (Goldbio), anesthetized using Isoflurane (Piramal) and analyzed using a Xenogen IVIS 100 imaging system (Caliper, a PerkinElmer company). Photon flux was quantified using Living Image (Caliper).
Cell Isolation and RNA preparation
Thymic epithelial cells, thymic dendritic cells and B cell subsets were isolated from mice of the indicated genotypes as described above. For thymic DCs and B cells, cell suspension was stained with Biotin conjugated anti-CD11c and anti-CD19 and enriched using anti-Biotin microbeads (Miltenyi Biotec) according to the manufacturer’s instructions. Cells were surface stained with indicated antibodies and separated by FACSAria (BD Biosciences). A RNeasy micro kit (Qiagen) was used to isolate RNA obtained from each sample per the manufacturer’s instructions.
Immunofluorescence
Thymi were fixed in Cytofix/Cytoperm (BD Biosciences) diluted 1:4 in PBS for 24 hours at 4°C, washed twice in PBS, and placed in 30% sucrose for 24 hours at 4°C. Thymi were embedded in OCT (Sakura Finetek), frozen in vapor phase of liquid nitrogen, and stored at −80°C. Tissue was sectioned at 10μm and dried overnight. Samples were rehydrated in PBS for 5 minutes and blocked for 60 minutes at room temperature (PBS 0.3% Triton-X-100, 1% BSA, and mouse Fc block) and washed three times with PBS. For samples using biotinylated antibodies, samples were blocked with the Avidin/Biotin blocking kit following manufacturer protocol (Vector Laboratories). Sections were stained with primary antibodies, AIRE (Thermo Scientific), anti-RFP (Rockland), and anti-GFP (Novus) overnight at 4°C followed by three washes with PBS. Secondary staining was performed with streptavidin-AF555 (Life Technologies) or AF555 donkey anti-rabbit IgG H+L (Life Technologies) for 30 minutes at room temperature. Sections were washed three times with PBS and stained with Hoechst 33342 (Thermo Scientific) for 5 minutes at room temperature. Sections were washed and mounted in ProLong Gold antifade. Images were acquired using a Stellaris 8 confocal microscope (Leica Microsystems) and analyzed using Fiji and QuPath.
Quantitative RT-PCR (qPCR)
cDNA was produced using SuperScript III First Strand Synthesis SuperMix (Invitrogen). FastStart Universal SYBR Green Master (Roche) and an ABI PRISM 7900HT sequence detection system (Applied Bioscience) were used for amplification and detection. Gapdh (forward: TGG CCT ACA TGG CCT CCA, reverse: TCC CTA GGC CCC TCC TGT TAT) was used for normalization of samples. Primers for Ifnb1 were forward: CCC TAT GGA GAT GAC GGA GA, reverse: CTG TCT GCT GGT GGA GTT CA, Ifnl2 forward: AGG TGC AGT TCC CAG CTC T, reverse: TCA GTC ATG TTC TCC CAG ACC, Ifnl3 forward: TCC CAG CTG CG ACC TGT, reverse: CAG GGG TCT CCT TGC TCT G, Ifi27l2a forward: GAA CAC TGT TTG GCT CTG CCA T, reverse: AGG ACC CCT GCT GAT TGG AG, Irf7 (predesign IDT Mm.PT.58.32394021.g), Oasl1 (predesign IDT Mm.PT.56a.30363159).
Bulk RNA sequencing and analysis
RNA sequencing was performed by the University of Minnesota Genomics Center (UMGC). Total RNA was quantified using a RiboGreen assay. RNA quality was assessed via Agilent BioAnalyzer (Agilent Biotechnologies). Library creation was performed using the SMARTer Stranded Total RNA Pico Mammalian v2 kit (Takara Bio), according to manufacturer’s instruction. Sequencing was performed on a NovaSeq6000 using paired-end 150-base chemistry at the University of Minnesota Genomics Center. Reads were analyzed using the CHURP v0.2.1 pipeline developed by the University of Minnesota Supercomputing Institute(62). Heat maps of expression values were generated using the Morpheus website(63).
scRNA sequencing and analysis
Sequencing and initial analyses were done at the UMGC of the University of Minnesota. MHC-II-expressing thymic cells were captured using the 10x Genomics 3’ Single Cell V3 chemistry platform and sequenced in a NovaSeq instrument. Raw sequencing data were processed using CellRanger (v 4.0.0). Cellranger ‘count’ was used to obtain gene and protein count data for all cells. Count tables were generated for the mRNA and HTO data. Raw count data were loaded into R (v 4.3.1) and analyzed with the Seurat R package (v 4.3.0.1)(64). The mRNA expression data were normalized using a log normalization method in which feature counts for each cell were divided by the total count for that cell and multiplied by a scale factor. A subset of 2000 highly variable features (that is, genes that are highly expressed in some cells and lowly expressed in others) was identified using the ‘FindVariableFeatures’ function from the Seurat package. The HTO count data were added into the dataset and normalized using a centered-log ratio method. The Seurat function ‘HTODemux” was used to identify ‘doublet’ cells. Principal components analysis was performed using the Seurat function ‘RunPCA’ and a two-dimensional representation of the data was generated using the RunUMAP Seurat function. Cells were clustered using the Seurat ‘FindNeighbors’ and ‘FindClusters’ functions. In the ‘FindClusters’ function, different resolution values were tested and resolution value of 0.1, which identified 14 clusters, was chosen.
Differentially expressed genes were identified between treatment groups within the six largest clusters identified above. A Wilcoxon Rank Sum test was implemented in the ‘FindMarkers’ function in Seurat to identify differentially expressed genes.
TCRα RNA sequencing
Tcra sequencing was performed as described previously. Briefly, CD4+ T cells, Tconv (CD8−CD4+ CD25− GITR−) and Tregs (CD8− CD4+ CD25+ GITR+) were FACS sorted from the thymus. Cells were sorted into RNAprotect (Qiagen) and bulk RNA sequencing of the Trav locus was performed using the RepSeq service from iRepertoire amplifying all the expressed TCRs. Samples were sequenced at depth of 5 reads per cell. TCRs were analyzed based on the predicted amino acid sequence of the CDR3 region and filtered to select for high confidence, recurrently expressed CDR3 clones(65). Reads were normalized to counts per million (CPM) and data were filtered to include only CDR3 clones that were present at or above 10 CPM in at least 3 biological replicates of at least one sample type. Equal-number cohorts of WT and experimental mice (5 mice per group for Ifnar1−/− analysis and 6 mice per group for Ifnar1−/−/Ifnlr1−/− analysis) were sex and age matched. Analysis was performed using R (v 4.3.1), including packages EdgeR, ggplot2, and pheatmap.
Mixed Bone marrow chimeras
Mixed BM chimeras were generated by reconstituting sex matched lethally irradiated (1000 rad in 2 doses) recipient mice (CD45.1+/+) with 1 x 10⁷ bone marrow cells from B6 WT mice (CD45.1+/−CD45.2+/−) and 1 x 10⁷ BM cells from Ifnlr1−/− mice (CD45.2+/+) (50:50). Bone marrow cells were isolated from femur and tibia and subsequently depleted of erythrocytes using ACK lysis buffer. Irradiated mice were given neomycin (40μg/ml) and polymyxin B (15μg/ml) supplemented water for 2 weeks following irradiation and bone marrow transplantation. Chimeras were analyzed 6 weeks after reconstitution.
Cleaved caspase-3 clonal deletion assay
Assay was performed as described previously(47). Briefly, thymic T cells were isolated as described above. 5 x 10⁶ cells were stained with anti-CCR7 antibody (4B12, Thermo Fisher) for 30 minutes at 37°C followed by surface antibody staining for 30 minutes at 4°C. Cells were fixed with Cytofix/Cytoperm (BD Biosciences) for 30 minutes at 4°C. Cells were then washed with Perm/Wash buffer (BD Biosciences) twice and stained with anti-cleaved Caspase 3 antibody (ASP175 D3E9, Cell Signaling) for 30 minutes at room temperature. Cleaved Caspase 3 positivity was measured by FACS.
T cell transfer and proliferation
CD4+ T cells were isolated from spleens of WT, Ifnb−/− and Aire−/− mice using CD4+ T cell Isolation Kit (Miltenyi Biotech). 5x10⁶ CD4+ T cells were stained by CFSE (Invitrogen, according to the manufacturer’s instructions), resuspended in 200μl of PBS and intravenously injected into the WT (congenially distinct) mice previously treated (day −1) with 200μg of PolyI:C or PBS (used as control). Seven days after the T cell transfer spleens were harvested, donor CD4+ T cells were isolated as described above and T cell proliferation was measured as CFSE dilution by FACS.
Statistical Analysis
Comparisons of two data sets were carried out using a two-tailed unpaired Student’s t-test. For comparison of three or more data sets, ordinary one-way ANOVA with multiple comparisons test was used. One sample t-test and Wilcoxon test was used to performed single column statistics. P-values less than 0.05 were considered significant. Sample size, experimental replicates, and additional details are provided in the figure legends. Statistical analyses were performed using GraphPad Prism 9.0.
Supplementary Material
Acknowledgments:
We thank Dr. Adolfo García-Sastre (Icahn School of Medicine at Mount Sinai) for providing Mx1eGFP and Mx1eGFP/Ifnar1−/− mice; Stefan Leinenklaus (Hannover Medical School) for developing Ifnb1luc mice; Stefani Vogel (University of Maryland School of Medicine) for developing the Ifnb1−/− mice; Jane Ding and Talia Dalzell for technical assistance; Jason Motl (University Flow Cytometry Resource) for cell sorting; Juan Abrahante (University of Minnesota Genomics Center) for assistance with bulk RNA sequencing and scRNA sequencing; and the University of Minnesota Research Animal Resources for animal husbandry.
Funding:
This project was supported by the National Institutes of Health (P01AI035296).
National Institutes of Health grant P01AI035296 (KAH)
National Institutes of Health grant R37 AI39560 (KAH)
M.V. is a Cancer Research Institute Irvington Fellow supported by the Cancer Research Institute (CRI4536)
National Institutes of Health grant T32 AI007313 (KMA and ERB)
National Institutes of Health grant T32 GM113846 (STL)
University of Minnesota Doctoral Dissertation Fellowship (KMA)
Footnotes
Competing interests: Authors declare that they have no competing interests.
Data and materials availability:
Bulk RNAseq data and scRNAseq data are available from the National Center for Biotechnology Information Gene Expression Omnibus (NCBI GEO) under accession number GSE192715 and GSE192716. All data needed to evaluate the conclusions in the paper are present in the paper or the Supplementary Materials. Underlying tabulated data for all figures can be found in supplementary data file S4.
References and Notes
- 1.Kotenko SV, Rivera A, Parker D, Durbin JE, Type III IFNs: Beyond antiviral protection. Seminars in Immunology 43, 101303 (2019). [DOI] [PMC free article] [PubMed] [Google Scholar]
- 2.Ivashkiv LB, Donlin LT, Regulation of type I interferon responses. Nat Rev Immunol 14, 36–49 (2014). [DOI] [PMC free article] [PubMed] [Google Scholar]
- 3.Benhammadi M, Mathé J, Dumont-Lagacé M, Kobayashi KS, Gaboury L, Brochu S, Perreault C, IFN-λ Enhances Constitutive Expression of MHC Class I Molecules on Thymic Epithelial Cells. J Immunol 205, 1268–1280 (2020). [DOI] [PubMed] [Google Scholar]
- 4.Lienenklaus S, Cornitescu M, Zietara N, Łyszkiewicz M, Gekara N, Jabłónska J, Edenhofer F, Rajewsky K, Bruder D, Hafner M, Staeheli P, Weiss S, Novel reporter mouse reveals constitutive and inflammatory expression of IFN-beta in vivo. J Immunol 183, 3229–3236 (2009). [DOI] [PubMed] [Google Scholar]
- 5.Xing Y, Wang X, Jameson SC, Hogquist KA, Late stages of T cell maturation in the thymus involve NF-κB and tonic type I interferon signaling. Nat Immunol 17, 565–573 (2016). [DOI] [PMC free article] [PubMed] [Google Scholar]
- 6.Ardouin L, Luche H, Chelbi R, Carpentier S, Shawket A, Montanana Sanchis F, Santa Maria C, Grenot P, Alexandre Y, Grégoire C, Fries A, Vu Manh T-P, Tamoutounour S, Crozat K, Tomasello E, Jorquera A, Fossum E, Bogen B, Azukizawa H, Bajenoff M, Henri S, Dalod M, Malissen B, Broad and Largely Concordant Molecular Changes Characterize Tolerogenic and Immunogenic Dendritic Cell Maturation in Thymus and Periphery. Immunity 45, 305–318 (2016). [DOI] [PubMed] [Google Scholar]
- 7.Lazear HM, Schoggins JW, Diamond MS, Shared and Distinct Functions of Type I and Type III Interferons. Immunity 50, 907–923 (2019). [DOI] [PMC free article] [PubMed] [Google Scholar]
- 8.Steier Z, Aylard DA, McIntyre LL, Baldwin I, Kim EJY, Lutes LK, Ergen C, Huang T-S, Robey EA, Yosef N, Streets A, Single-cell multiomic analysis of thymocyte development reveals drivers of CD4+ T cell and CD8+ T cell lineage commitment. Nat Immunol 24, 1579–1590 (2023). [DOI] [PMC free article] [PubMed] [Google Scholar]
- 9.Hemmers S, Schizas M, Azizi E, Dikiy S, Zhong Y, Feng Y, Altan-Bonnet G, Rudensky AY, IL-2 production by self-reactive CD4 thymocytes scales regulatory T cell generation in the thymus. Journal of Experimental Medicine 216, 2466–2478 (2019). [DOI] [PMC free article] [PubMed] [Google Scholar]
- 10.Martinez RJ, Breed ER, Worota Y, Ashby KM, Vobořil M, Mathes T, Salgado OC, O’Connor CH, Kotenko SV, Hogquist KA, Type III interferon drives thymic B cell activation and regulatory T cell generation. Proceedings of the National Academy of Sciences 120, e2220120120 (2023). [DOI] [PMC free article] [PubMed] [Google Scholar]
- 11.Ashby KM, Hogquist KA, A guide to thymic selection of T cells. Nat Rev Immunol, 24, 103–117 (2024). [DOI] [PubMed] [Google Scholar]
- 12.Perry JSA, Lio C-WJ, Kau AL, Nutsch K, Yang Z, Gordon JI, Murphy KM, Hsieh C-S, Distinct contributions of Aire and antigen-presenting-cell subsets to the generation of self-tolerance in the thymus. Immunity 41, 414–426 (2014). [DOI] [PMC free article] [PubMed] [Google Scholar]
- 13.Breed ER, Lee ST, Hogquist KA, Directing T cell fate: How thymic antigen presenting cells coordinate thymocyte selection. Seminars in Cell & Developmental Biology 84, 2–10 (2018). [DOI] [PMC free article] [PubMed] [Google Scholar]
- 14.Breed ER, Vobořil M, Ashby KM, Martinez RJ, Qian L, Wang H, Salgado OC, O’Connor CH, Hogquist KA, Type 2 cytokines in the thymus activate Sirpα+ dendritic cells to promote clonal deletion. Nat Immunol 23, 1042–1051 (2022). [DOI] [PMC free article] [PubMed] [Google Scholar]
- 15.Perry JSA, Russler-Germain EV, Zhou YW, Purtha W, Cooper ML, Choi J, Schroeder MA, Salazar V, Egawa T, Lee B-C, Abumrad NA, Kim BS, Anderson MS, DiPersio JF, Hsieh C-S, Transfer of Cell-Surface Antigens by Scavenger Receptor CD36 Promotes Thymic Regulatory T Cell Receptor Repertoire Development and Allo-tolerance. Immunity 48, 923–936.e4 (2018). [DOI] [PMC free article] [PubMed] [Google Scholar]
- 16.Givony T, Leshkowitz D, Del Castillo D, Nevo S, Kadouri N, Dassa B, Gruper Y, Khalaila R, Ben-Nun O, Gome T, Dobeš J, Ben-Dor S, Kedmi M, Keren-Shaul H, Heffner-Krausz R, Porat Z, Golani O, Addadi Y, Brenner O, Lo DD, Goldfarb Y, Abramson J, Thymic mimetic cells function beyond self-tolerance. Nature 622, 164–172 (2023). [DOI] [PubMed] [Google Scholar]
- 17.Michelson DA, Hase K, Kaisho T, Benoist C, Mathis D, Thymic epithelial cells co-opt lineage-defining transcription factors to eliminate autoreactive T cells. Cell 185, 2542–2558.e18 (2022). [DOI] [PMC free article] [PubMed] [Google Scholar]
- 18.Sandoval MJ, Tseng H-C, Risman HP, Smirnov S, Li Q, Lin J-D, Rivera A, Durbin RK, Kotenko SV, Durbin JE, The In Vivo Source of Type I and Type III IFNs is Pathogen Dependent. bioRxiv [Preprint] (2021). 10.1101/2021.10.05.463160. [DOI] [Google Scholar]
- 19.Brennecke P, Reyes A, Pinto S, Rattay K, Nguyen M, Küchler R, Huber W, Kyewski B, Steinmetz LM, Single-cell transcriptome analysis reveals coordinated ectopic gene-expression patterns in medullary thymic epithelial cells. Nat Immunol 16, 933–941 (2015). [DOI] [PMC free article] [PubMed] [Google Scholar]
- 20.Meredith M, Zemmour D, Mathis D, Benoist C, Aire controls gene expression in the thymic epithelium with ordered stochasticity. Nat Immunol 16, 942–949 (2015). [DOI] [PMC free article] [PubMed] [Google Scholar]
- 21.St-Pierre C, Trofimov A, Brochu S, Lemieux S, Perreault C, Differential Features of AIRE-Induced and AIRE-Independent Promiscuous Gene Expression in Thymic Epithelial Cells. J Immunol 195, 498–506 (2015). [DOI] [PubMed] [Google Scholar]
- 22.Nitta T, Tsutsumi M, Nitta S, Muro R, Suzuki EC, Nakano K, Tomofuji Y, Sawa S, Okamura T, Penninger JM, Takayanagi H, Fibroblasts as a source of self-antigens for central immune tolerance. Nat Immunol 21, 1172–1180 (2020). [DOI] [PubMed] [Google Scholar]
- 23.Carter JA, Strömich L, Peacey M, Chapin SR, Velten L, Steinmetz LM, Brors B, Pinto S, Meyer HV, Transcriptomic diversity in human medullary thymic epithelial cells. Nat Commun 13, 4296 (2022). [DOI] [PMC free article] [PubMed] [Google Scholar]
- 24.Nabhani ZA, Eberl G, Imprinting of the immune system by the microbiota early in life. Mucosal Immunology 13, 183–189 (2020). [DOI] [PubMed] [Google Scholar]
- 25.Baran-Gale J, Morgan MD, Maio S, Dhalla F, Calvo-Asensio I, Deadman ME, Handel AE, Maynard A, Chen S, Green F, Sit RV, Neff NF, Darmanis S, Tan W, May AP, Marioni JC, Ponting CP, Holländer GA, Ageing compromises mouse thymus function and remodels epithelial cell differentiation. Elife 9, e56221 (2020). [DOI] [PMC free article] [PubMed] [Google Scholar]
- 26.Griffith AV, Fallahi M, Venables T, Petrie HT, Persistent degenerative changes in thymic organ function revealed by an inducible model of organ regrowth. Aging Cell 11, 169–177 (2012). [DOI] [PMC free article] [PubMed] [Google Scholar]
- 27.Otero DC, Baker DP, David M, IRF7-dependent IFN-β production in response to RANKL promotes medullary thymic epithelial cell development. J Immunol 190, 3289–3298 (2013). [DOI] [PMC free article] [PubMed] [Google Scholar]
- 28.Larouche J-D, Trofimov A, Hesnard L, Ehx G, Zhao Q, Vincent K, Durette C, Gendron P, Laverdure J-P, Bonneil É, Côté C, Lemieux S, Thibault P, Perreault C, Widespread and tissue-specific expression of endogenous retroelements in human somatic tissues. Genome Med 12, 40 (2020). [DOI] [PMC free article] [PubMed] [Google Scholar]
- 29.Bansal K, Yoshida H, Benoist C, Mathis D, The transcriptional regulator Aire binds to and activates super-enhancers. Nat Immunol 18, 263–273 (2017). [DOI] [PMC free article] [PubMed] [Google Scholar]
- 30.Härtlova A, Erttmann SF, Raffi F. Am., Schmalz AM, Resch U, Anugula S, Lienenklaus S, Nilsson LM, Kröger A, Nilsson JA, Ek T, Weiss S, Gekara NO, DNA Damage Primes the Type I Interferon System via the Cytosolic DNA Sensor STING to Promote Anti-Microbial Innate Immunity. Immunity 42, 332–343 (2015). [DOI] [PubMed] [Google Scholar]
- 31.Lima-Junior DS, Krishnamurthy SR, Bouladoux N, Collins N, Han S-J, Chen EY, Constantinides MG, Link VM, Lim AI, Enamorado M, Cataisson C, Gil L, Rao I, Farley TK, Koroleva G, Attig J, Yuspa SH, Fischbach MA, Kassiotis G, Belkaid Y, Endogenous retroviruses promote homeostatic and inflammatory responses to the microbiota. Cell 184, 3794–3811.e19 (2021). [DOI] [PMC free article] [PubMed] [Google Scholar]
- 32.Uccellini MB, García-Sastre A, ISRE-Reporter Mouse Reveals High Basal and Induced Type I IFN Responses in Inflammatory Monocytes. Cell Reports 25, 2784–2796.e3 (2018). [DOI] [PMC free article] [PubMed] [Google Scholar]
- 33.Mordstein M, Kochs G, Dumoutier L, Renauld J-C, Paludan SR, Klucher K, Staeheli P, Interferon-λ Contributes to Innate Immunity of Mice against Influenza A Virus but Not against Hepatotropic Viruses. PLOS Pathogens 4, e1000151 (2008). [DOI] [PMC free article] [PubMed] [Google Scholar]
- 34.Gough DJ, Messina NL, Clarke CJP, Johnstone RW, Levy DE, Constitutive type I interferon modulates homeostatic balance through tonic signaling. Immunity 36, 166–174 (2012). [DOI] [PMC free article] [PubMed] [Google Scholar]
- 35.Mostafavi S, Yoshida H, Moodley D, LeBoité H, Rothamel K, Raj T, Ye CJ, Chevrier N, Zhang S-Y, Feng T, Lee M, Casanova J-L, Clark JD, Hegen M, Telliez J-B, Hacohen N, De Jager PL, Regev A, Mathis D, Benoist C, Immunological Genome Project Consortium, Parsing the Interferon Transcriptional Network and Its Disease Associations. Cell 164, 564–578 (2016). [DOI] [PMC free article] [PubMed] [Google Scholar]
- 36.Park J-E, Botting RA, Domínguez Conde C, Popescu D-M, Lavaert M, Kunz DJ, Goh I, Stephenson E, Ragazzini R, Tuck E, Wilbrey-Clark A, Roberts K, Kedlian VR, Ferdinand JR, He X, Webb S, Maunder D, Vandamme N, Mahbubani KT, Polanski K, Mamanova L, Bolt L, Crossland D, de Rita F, Fuller A, Filby A, Reynolds G, Dixon D, Saeb-Parsy K, Lisgo S, Henderson D, Vento-Tormo R, Bayraktar OA, Barker RA, Meyer KB, Saeys Y, Bonfanti P, Behjati S, Clatworthy MR, Taghon T, Haniffa M, Teichmann SA, A cell atlas of human thymic development defines T cell repertoire formation. Science 367, eaay3224 (2020). [DOI] [PMC free article] [PubMed] [Google Scholar]
- 37.Vobořil M, Brabec T, Dobeš J, Šplíchalová I, Březina J, Čepková A, Dobešová M, Aidarova A, Kubovčiak J, Tsyklauri O, Štěpánek O, Beneš V, Sedláček R, Klein L, Kolář M, Filipp D, Toll-like receptor signaling in thymic epithelium controls monocyte-derived dendritic cell recruitment and Treg generation. Nat Commun 11, 2361 (2020). [DOI] [PMC free article] [PubMed] [Google Scholar]
- 38.Liberzon A, Birger C, Thorvaldsdóttir H, Ghandi M, Mesirov JP, Tamayo P, The Molecular Signatures Database (MSigDB) hallmark gene set collection. Cell Syst 1, 417–425 (2015). [DOI] [PMC free article] [PubMed] [Google Scholar]
- 39.Oh J, Wu N, Barczak AJ, Barbeau R, Erle DJ, Shin J-S, CD40 Mediates Maturation of Thymic Dendritic Cells Driven by Self-Reactive CD4+ Thymocytes and Supports Development of Natural Regulatory T Cells. J Immunol 200, 1399–1412 (2018). [DOI] [PMC free article] [PubMed] [Google Scholar]
- 40.Tacke R, Hilgendorf I, Garner H, Waterborg C, Park K, Nowyhed H, Hanna RN, Wu R, Swirski FK, Geissmann F, Hedrick CC, The transcription factor NR4A1 is essential for the development of a novel macrophage subset in the thymus. Sci Rep 5, 10055 (2015). [DOI] [PMC free article] [PubMed] [Google Scholar]
- 41.Zhou T-A, Hsu H-P, Tu Y-H, Cheng H-K, Lin C-Y, Chen N-J, Tsai J-W, Robey EA, Huang H-C, Hsu C-L, Dzhagalov IL, Thymic macrophages consist of two populations with distinct localization and origin. eLife 11, e75148 (2022). [DOI] [PMC free article] [PubMed] [Google Scholar]
- 42.Yamano T, Nedjic J, Hinterberger M, Steinert M, Koser S, Pinto S, Gerdes N, Lutgens E, Ishimaru N, Busslinger M, Brors B, Kyewski B, Klein L, Thymic B Cells Are Licensed to Present Self Antigens for Central T Cell Tolerance Induction. Immunity 42, 1048–1061 (2015). [DOI] [PubMed] [Google Scholar]
- 43.Perera J, Zheng Z, Li S, Gudjonson H, Kalinina O, Benichou JIC, Block KE, Louzoun Y, Yin D, Chong AS, Dinner AR, Weigert M, Huang H, Self-Antigen-Driven Thymic B Cell Class Switching Promotes T Cell Central Tolerance. Cell Reports 17, 387–398 (2016). [DOI] [PMC free article] [PubMed] [Google Scholar]
- 44.Peng Q, Qiu X, Zhang Z, Zhang S, Zhang Y, Liang Y, Guo J, Peng H, Chen M, Fu Y-X, Tang H, PD-L1 on dendritic cells attenuates T cell activation and regulates response to immune checkpoint blockade. Nat Commun 11, 4835 (2020). [DOI] [PMC free article] [PubMed] [Google Scholar]
- 45.Maier B, Leader AM, Chen ST, Tung N, Chang C, LeBerichel J, Chudnovskiy A, Maskey S, Walker L, Finnigan JP, Kirkling ME, Reizis B, Ghosh S, D’Amore NR, Bhardwaj N, Rothlin CV, Wolf A, Flores R, Marron T, Rahman AH, Kenigsberg E, Brown BD, Merad M, A conserved dendritic-cell regulatory program limits antitumour immunity. Nature 580, 257–262 (2020). [DOI] [PMC free article] [PubMed] [Google Scholar]
- 46.Spencer CT, Bezbradica JS, Ramos MG, Arico CD, Conant SB, Gilchuk P, Gray JJ, Zheng M, Niu X, Hildebrand W, Link AJ, Joyce S, Viral infection causes a shift in the self peptide repertoire presented by human MHC class I molecules. Proteomics Clin Appl 9, 1035–1052 (2015). [DOI] [PMC free article] [PubMed] [Google Scholar]
- 47.Breed ER, Watanabe M, Hogquist KA, Measuring Thymic Clonal Deletion at the Population Level. J Immunol 202, 3226–3233 (2019). [DOI] [PMC free article] [PubMed] [Google Scholar]
- 48.Metidji A, Rieder SA, Glass DD, Cremer I, Punkosdy GA, Shevach EM, IFN-α/β Receptor Signaling Promotes Regulatory T Cell Development and Function under Stress Conditions. The Journal of Immunology 194, 4265–4276 (2015). [DOI] [PMC free article] [PubMed] [Google Scholar]
- 49.Martinez RJ, Hogquist KA, The role of interferon in the thymus. Current Opinion in Immunology 84, 102389 (2023). [DOI] [PMC free article] [PubMed] [Google Scholar]
- 50.Perera J, Meng L, Meng F, Huang H, Autoreactive thymic B cells are efficient antigen-presenting cells of cognate self-antigens for T cell negative selection. Proc Natl Acad Sci U S A 110, 17011–17016 (2013). [DOI] [PMC free article] [PubMed] [Google Scholar]
- 51.Lu F-T, Yang W, Wang Y-H, Ma H-D, Tang W, Yang J-B, Li L, Ansari AA, Lian Z-X, Thymic B cells promote thymus-derived regulatory T cell development and proliferation. J Autoimmun 61, 62–72 (2015). [DOI] [PubMed] [Google Scholar]
- 52.Walters SN, Webster KE, Daley S, Grey ST, A role for intrathymic B cells in the generation of natural regulatory T cells. J Immunol 193, 170–176 (2014). [DOI] [PubMed] [Google Scholar]
- 53.Leventhal DS, Gilmore DC, Berger JM, Nishi S, Lee V, Malchow S, Kline DE, Kline J, Vander Griend DJ, Huang H, Socci ND, Savage PA, Dendritic Cells Coordinate the Development and Homeostasis of Organ-Specific Regulatory T Cells. Immunity 44, 847–859 (2016). [DOI] [PMC free article] [PubMed] [Google Scholar]
- 54.Malchow S, Leventhal DS, Lee V, Nishi S, Socci ND, Savage PA, Aire enforces immune tolerance by directing autoreactive T cells into the regulatory T cell lineage. Immunity 44, 1102–1113 (2016). [DOI] [PMC free article] [PubMed] [Google Scholar]
- 55.Levin M, Anti-Interferon Auto-Antibodies in Autoimmune Polyendocrinopathy Syndrome Type 1. PLoS Med 3, e292 (2006). [DOI] [PMC free article] [PubMed] [Google Scholar]
- 56.Meager A, Visvalingam K, Peterson P, Möll K, Murumägi A, Krohn K, Eskelin P, Perheentupa J, Husebye E, Kadota Y, Willcox N, Anti-interferon autoantibodies in autoimmune polyendocrinopathy syndrome type 1. PLoS Med 3, e289 (2006). [DOI] [PMC free article] [PubMed] [Google Scholar]
- 57.Le Voyer T, Parent AV, Liu X, Cederholm A, Gervais A, Rosain J, Nguyen T, Perez Lorenzo M, Rackaityte E, Rinchai D, Zhang P, Bizien L, Hancioglu G, Ghillani-Dalbin P, Charuel J-L, Philippot Q, Gueye MS, Maglorius Renkilaraj MRL, Ogishi M, Soudée C, Migaud M, Rozenberg F, Momenilandi M, Riller Q, Imberti L, Delmonte OM, Müller G, Keller B, Orrego J, Franco Gallego WA, Rubin T, Emiroglu M, Parvaneh N, Eriksson D, Aranda-Guillen M, Berrios DI, Vong L, Katelaris CH, Mustillo P, Raedler J, Bohlen J, Bengi Celik J, Astudillo C, Winter S, McLean C, Guffroy A, DeRisi JL, Yu D, Miller C, Feng Y, Guichard A, Béziat V, Bustamante J, Pan-Hammarström Q, Zhang Y, Rosen LB, Holland SM, Bosticardo M, Kenney H, Castagnoli R, Slade CA, Boztuğ K, Mahlaoui N, Latour S, Abraham RS, Lougaris V, Hauck F, Sediva A, Atschekzei F, Sogkas G, Poli MC, Slatter MA, Palterer B, Keller MD, Pinzon-Charry A, Sullivan A, Droney L, Suan D, Wong M, Kane A, Hu H, Ma C, Grombiříková H, Ciznar P, Dalal I, Aladjidi N, Hie M, Lazaro E, Franco J, Keles S, Malphettes M, Pasquet M, Maccari ME, Meinhardt A, Ikinciogullari A, Shahrooei M, Celmeli F, Frosk P, Goodnow CC, Gray PE, Belot A, Kuehn HS, Rosenzweig SD, Miyara M, Licciardi F, Servettaz A, Barlogis V, Le Guenno G, Herrmann V-M, Kuijpers T, Ducoux G, Sarrot-Reynauld F, Schuetz C, Cunningham-Rundles C, Rieux-Laucat F, Tangye SG, Sobacchi C, Doffinger R, Warnatz K, Grimbacher B, Fieschi C, Berteloot L, Bryant VL, Trouillet Assant S, Su H, Neven B, Abel L, Zhang Q, Boisson B, Cobat A, Jouanguy E, Kampe O, Bastard P, Roifman CM, Landegren N, Notarangelo LD, Anderson MS, Casanova J-L, Puel A, Autoantibodies against type I IFNs in humans with alternative NF-κB pathway deficiency. Nature 623, 803–813 (2023). [DOI] [PMC free article] [PubMed] [Google Scholar]
- 58.Lin J-D, Feng N, Sen A, Balan M, Tseng H-C, McElrath C, Smirnov SV, Peng J, Yasukawa LL, Durbin RK, Durbin JE, Greenberg HB, Kotenko SV, Distinct Roles of Type I and Type III Interferons in Intestinal Immunity to Homologous and Heterologous Rotavirus Infections. PLOS Pathogens 12, e1005600 (2016). [DOI] [PMC free article] [PubMed] [Google Scholar]
- 59.Wong P, Goldrath AW, Rudensky AY, Competition for specific intrathymic ligands limits positive selection in a TCR transgenic model of CD4+ T cell development. J Immunol 164, 6252–6259 (2000). [DOI] [PubMed] [Google Scholar]
- 60.Deonarain R, Alcamí A, Alexiou M, Dallman MJ, Gewert DR, Porter ACG, Impaired Antiviral Response and Alpha/Beta Interferon Induction in Mice Lacking Beta Interferon. Journal of Virology 74, 3404–3409 (2000). [DOI] [PMC free article] [PubMed] [Google Scholar]
- 61.Xing Y, Hogquist KA, Isolation, identification, and purification of murine thymic epithelial cells. J Vis Exp 90, e51780 (2014). [DOI] [PMC free article] [PubMed] [Google Scholar]
- 62.Baller J, Kono T, Herman A, Zhang Y, “CHURP: A Lightweight CLI Framework to Enable Novice Users to Analyze Sequencing Datasets in Parallel” in Proceedings of the Practice and Experience in Advanced Research Computing on Rise of the Machines (Learning) (Association for Computing Machinery 19; ), pp. 1–5 (2019). [Google Scholar]
- 63.Morpheus. https://software.broadinstitute.org/morpheus/.
- 64.Hao Y, Hao S, Andersen-Nissen E, Mauck WM, Zheng S, Butler A, Lee MJ, Wilk AJ, Darby C, Zager M, Hoffman P, Stoeckius M, Papalexi E, Mimitou EP, Jain J, Srivastava A, Stuart T, Fleming LM, Yeung B, Rogers AJ, McElrath JM, Blish CA, Gottardo R, Smibert P, Satija R, Integrated analysis of multimodal single-cell data. Cell 184, 3573–3587.e29 (2021). [DOI] [PMC free article] [PubMed] [Google Scholar]
- 65.Miller CH, Klawon DEJ, Zeng S, Lee V, Socci ND, Savage PA, Eomes identifies thymic precursors of self-specific memory-phenotype CD8+ T cells. Nat Immunol 21, 567–577 (2020). [DOI] [PMC free article] [PubMed] [Google Scholar]
Associated Data
This section collects any data citations, data availability statements, or supplementary materials included in this article.
Supplementary Materials
Data Availability Statement
Bulk RNAseq data and scRNAseq data are available from the National Center for Biotechnology Information Gene Expression Omnibus (NCBI GEO) under accession number GSE192715 and GSE192716. All data needed to evaluate the conclusions in the paper are present in the paper or the Supplementary Materials. Underlying tabulated data for all figures can be found in supplementary data file S4.