

Abstract
Air pollution is a leading cause of death globally and has resulted in the loss of millions of healthy years of life. Moreover, the health burden has fallen disproportionately upon people in many low- and middle-income countries, where air quality continues to deteriorate. To assist authorities and civil society in improving air quality, World Health Organization has published the first global update to its 2005 air quality guidelines based on a significantly improved body of evidence. To facilitate the implementation of the World Health Organization Global Air Quality Guideline recommendations, this article summarizes the purpose and rationale of the quantitative air quality guidelines and interim target levels for six key pollutants: particulate matter 2.5, particulate matter 10, sulfur dioxide, nitrogen dioxide, ozone, and carbon monoxide. In addition, good practice statements are established for the management of pollutants of concern that lack sufficient evidence to substantiate numerical targets.
Introduction
As the most significant environmental threat to human health, air pollution exposure may account for as many as 1 in 5 deaths worldwide.1,2 Exposure has been linked to asthma development in children and worse outcomes in both children and adults, including decreased lung function and higher rates of asthma exacerbations, emergency room visits, and hospitalizations.3 The burden of disease disproportionately affects residents of low- and middle-income countries where air quality continues to worsen in contrast to high-income countries. However, even in high-income countries, new research has found that lower levels of air pollution than previously studied resulted in adverse health effects.1 The World Health Organization (WHO) last issued health-based guidelines for four major air pollutants in 2006: Air quality guidelines – global update 2005. Particulate matter, ozone, nitrogen dioxide and sulfur dioxide.4 Since then, methods of assessing air pollution exposure have improved.1 Studies on the relationship between air pollution and health have been conducted in nearly all WHO regions, whereas most prior studies were of North American and European origin.1
New evidence has linked air pollution with asthma, diabetes, reproductive outcomes, various neurocognitive endpoints, and other health conditions with which associations were not previously suspected.1,5,6 The WHO leveraged this expanded body of evidence to release a global update to its air quality guidelines with adjusted guideline and interim target values for particulate matter, ozone, nitrogen dioxide, and sulfur dioxide, and additional recommendations for carbon monoxide levels, which was not addressed in the prior guideline due to lack of evidence.1
The purpose of the guideline is to provide key stakeholders and decision-makers with 1) evidence-based air quality guideline (AQG) levels, or the lowest levels of exposure that result in harms to health, for particulate matter 2.5 (PM2.5), particulate matter 10 (PM10), nitrogen dioxide, ozone, sulfur dioxide, and carbon monoxide in both indoor and outdoor environments; 2) interim target levels to guide the reduction of these pollutants in countries that significantly exceed AQG levels; and 3) good practice statements to guide mitigation efforts for specific types of PM that pose a health risk but lack sufficient evidence to derive AQGs. The implementation of these guidelines is critical because, as shown in Figure 1, many people live in regions that do not meet WHO AQGs or even any of the interim targets for pollutants such as PM2.5, nitrogen dioxide, and ozone.7
Figure 1:
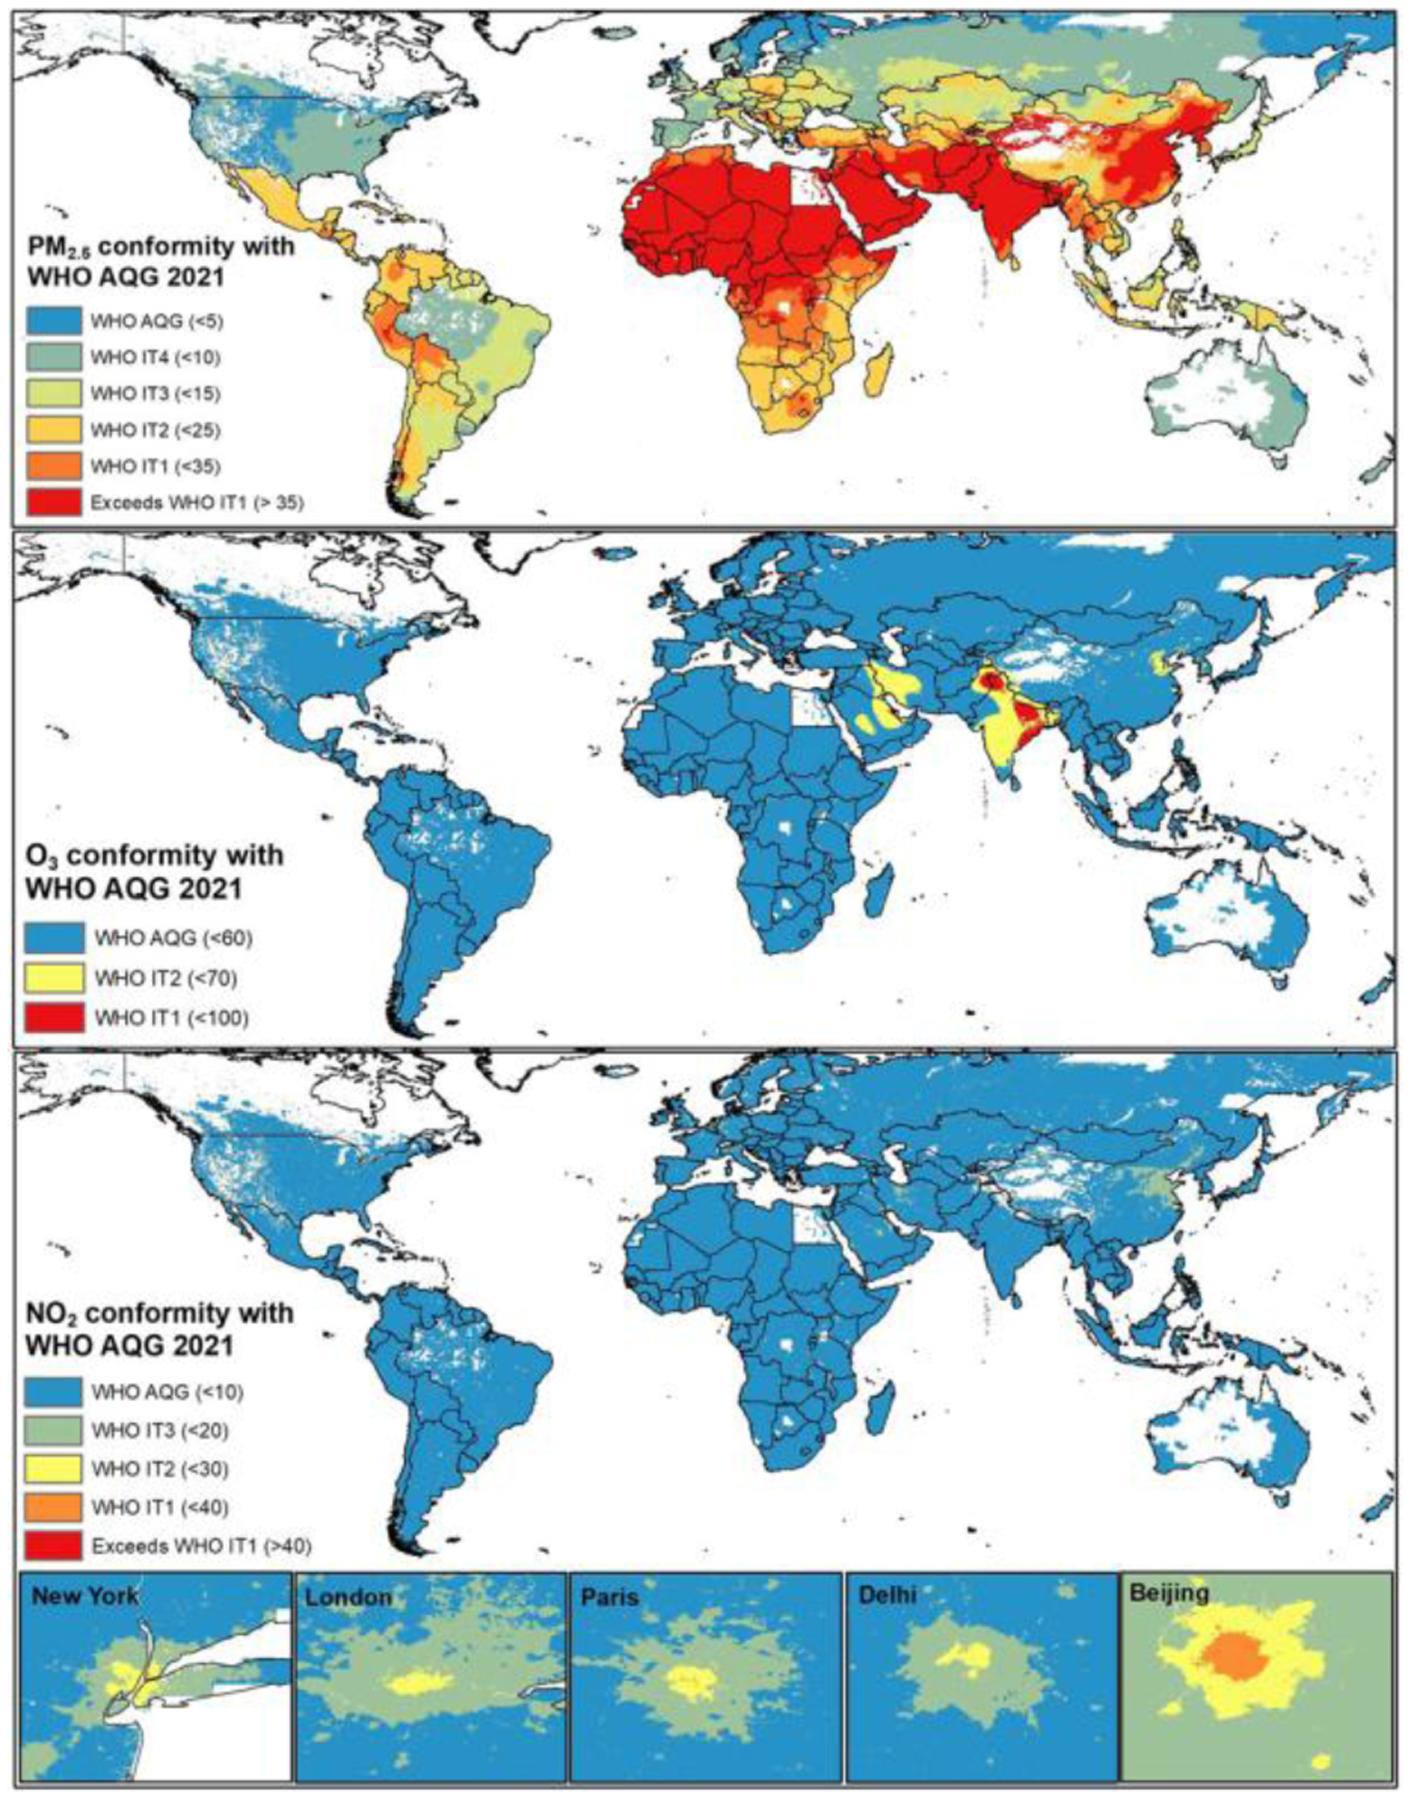
Conformation of key pollutants with WHO 2021 Air Quality Guidelines. (Reproduced from Amini H. WHO Air Quality Guidelines Need to be Adopted. Int J Public Health. 2021 Oct 15;66:1604483).
Methods
Guideline development was initiated and overseen by a WHO steering group. AQG recommendations and other guidance were informed by systematic reviews performed by a team of epidemiologists from five research groups spanning the Netherlands, England, Argentina, China, and Scotland, commissioned by the WHO steering group. Recommendations were determined by the consensus decisions of a guideline development group (GDG) comprised of subject matter experts in the area of air quality and health. Evidence evaluation was guided by the Grading of Recommendations Assessment, Development and Evaluation approach.8 AQG levels were defined on the basis of moderate or high certainty evidence supporting a link between a pollutant and a particular health outcome over a long-term (annual mean or highest six-month average) or short-term (8-hour or 24-hour) period, depending on the pollutant. Thus, long-term AQGs took precedence over short-term AQGs when both were considered. Interim targets, which are air pollutant levels higher than the AQGs but which are also associated with a reduction in health risk, were also established. These values serve as a series of targets to aid policymakers in areas with high levels of pollution to gradually progress toward the AQGs. Additional methodological details can be found in the complete guideline text.
The AQG and interim target recommendations are summarized in Table 1. Previously established WHO AQGs for pollutants and averaging times that are not addressed in this update remain valid. Good practice statements for the management of certain types of health risk-associated PM – black carbon/elemental carbon (BC/EC), ultrafine particles (UFP), and sand and dust storms (SDS) – are listed in Table 2. Further discussion of the rationale and complete citations for the recommendations can be found in the guideline.
Table 1:
AQG levels and interim targets for six key pollutants
| Pollutant | Averaging Time | Interim Targets | AQG | Evidence Certainty | |||
|---|---|---|---|---|---|---|---|
| 1 | 2 | 3 | 4 | ||||
| PM2.5, μg/m3 | Annual | 35 | 25 | 15 | 10 | 5 | High |
| 24-houra | 75 | 50 | 37.5 | 25 | 15 | High | |
| PM10, μg/m3 | Annual | 70 | 50 | 30 | 20 | 15 | High |
| 24-houra | 150 | 100 | 75 | 50 | 45 | High | |
| O3, μg/m3 | Peak seasonb | 100 | 70 | - | - | 60 | Low-moderate |
| 8-houra | 160 | 120 | - | - | 100 | High | |
| NO2, μg/m3 | Annual | 40 | 30 | 20 | - | 10 | Moderate-high |
| 24-houra | 120 | 50 | - | - | 25 | High | |
| SO2, μg/m3 | 24-houra | 125 | 50 | - | - | 40 | Low-high |
| CO, mg/m3 | 24-houra | 7 | - | - | - | 4 | Moderate |
99th percentile of the distribution of daily values (3–4 exceedance days per year)
Average of daily maximum 8-hour mean O3 concentration in a period of six consecutive months with the highest six-month running-average O3 concentration
Table 2:
Good practice statements for BC/EC, UFP, and SDS
| Pollutant | Good Practice Statements |
|---|---|
| BC/EC |
|
| UFP |
|
| SDS |
|
Guideline Recommendations
1. Classical Pollutants: PM2.5, PM10, O3, NO2, SO2, CO
1.1. PM2.5
PM2.5 are heterogeneous mixtures of fine inhalable particles defined by an aerodynamic diameter of less than or equal to 2.5μm.1,4 AQG and interim target levels were set based on the pollutant-attributed increase in all-cause non-accidental mortality and cause-specific mortality with high certainty of evidence.
- AQG level (μg/m3):
- Annual exposure: 5
- 24-hour exposure: 15
- Interim Targets (μg/m3) (IT1–4):
- Annual exposure: IT1 35, IT2 25, IT3 15, IT4 10
- 24-hour exposure: IT1 75, IT2 50, IT3 37.5, IT4 25
Health outcomes: all-cause mortality, cardiovascular mortality, respiratory mortality, lung cancer mortality
Causality: all associations between PM2.5 and health outcomes were determined to be causal or likely causal
1.2. PM10
PM10 are defined by an aerodynamic diameter of less than or equal to 10μm.1,4 AQG and interim target levels were set based on the pollutant-attributed increase in all-cause non-accidental mortality or cause-specific mortality with high certainty of evidence. In situations where both PM2.5 and PM10 measurements are available, priority should be given to PM2.5 AQGs.
- AQG level (μg/m3):
- Annual exposure: 15
- 24-hour exposure: 45
- Interim Targets (μg/m3):
- Annual exposure: IT1 70, IT2 50, IT3 30, IT4 20
- 24-hour exposure: IT1 150, IT2 100, IT3 75, IT4 50
Health outcomes: all-cause mortality, cardiovascular mortality, respiratory mortality, lung cancer mortality
Causality: all associations between PM10 and health outcomes were determined to be causal or likely causal
1.3. O3
Ozone is an oxidant species formed predominantly from nitrogen dioxide and non-methane volatile organic compounds in the atmosphere.1,4 Peak season AQG and interim target levels were set based on the pollutant-attributed increase in all-cause non-accidental mortality, with moderate certainty evidence, and respiratory mortality, with low certainty evidence. 24-hour levels were set based on all-cause non-accidental mortality, with high certainty evidence.
- AQG level (μg/m3):
- Peak season exposure: 60
- 24-hour exposure: 100
- Interim Targets (μg/m3):
- Peak season exposure: IT1 100, IT2 70
- 24-hour exposure: IT1 160, IT2 120
Health outcomes: all-cause mortality, respiratory mortality, asthma-related hospital admissions and emergency room visits
- Causality:
- Peak season exposure: likely causal for respiratory effects; suggestive of causality for all-cause mortality
- 24-hour exposure: suggestive of causality for all-cause mortality; causal for respiratory effects
1.4. NO2
NO2 is a trace atmospheric gas and strong oxidant that is both a threat to human health and implicated in climate change.1,4 Annual AQG and interim target levels were set based on the pollutant-attributed increase in all-cause non-accidental mortality, with moderate certainty evidence, and cause-specific respiratory mortality, with moderate to high certainty evidence. In addition, 24-hour levels were based on all cause non-accidental mortality and asthma-related hospital admissions and emergency room visits, with high certainty evidence.
- AQG level (μg/m3):
- Annual exposure: 10
- 24-hour exposure: 25
- Interim Targets (μg/m3):
- Annual exposure: IT1 40, IT2 30, IT3 20
- 24-hour exposure: IT1 120, IT2 50
Health outcomes: all-cause mortality, respiratory mortality, asthma-related hospital admissions and emergency room visits
- Causality:
- Annual exposure: suggestive of causality for total mortality, likely causal for respiratory effects
- 24-hour exposure: suggestive of causality for total mortality, causal for respiratory effects
1.5. SO2
Sulfur dioxide is derived from fossil fuel combustion and is a major component of air pollution globally.1,4 24-hour AQG and interim target levels were set based on pollutant-attributed increase in asthma-related hospital admissions and emergency room visits with low certainty evidence, all non-accidental mortality with high certainty evidence, and respiratory mortality with moderate certainty evidence.
24-hour AQG level (μg/m3): 40
24-hour Interim Targets (μg/m3): IT1 125, IT2 50
Health outcomes: all-cause mortality, asthma-related hospital admissions and emergency room visits, respiratory mortality
Causality: causal for respiratory effects, suggestive of causality for mortality
1.6. CO
Carbon monoxide is a product of incomplete combustion of carbon-rich fuels.1,4 24-hour AQG and interim target levels were set based on pollutant-attributed increase in hospital admissions and mortality from myocardial infarction with moderate certainty evidence.
24-hour AQG level (mg/m3): 4
24-hour Interim Targets (mg/m3): IT1 7
Health outcomes: hospital admissions and emergency room visits related to ischemic heart disease
Causality: likely causal for cardiovascular effects
2. Other Pollutants: BC/EC, UFP, and SDS
BC/EC, a measure of airborne soot-like carbon, is formed from the incomplete combustion of fossil fuels, biofuel, and biomass. Both short-term and long-term exposures have been linked to adverse cardiovascular health effects and premature death.1,9 UFPs, defined as particulates with a diameter less than or equal to 0.1μm, are largely generated from combustion. Short-term and long-term exposures have been associated with mortality and various morbidities.1,10 SDS exposure, which affects desert regions and countries affected by desert dust, may lead to an increased risk for inflammatory and allergic lung diseases such as asthma and cardiovascular mortality.1,11
The GDG determined that evidence was insufficient to establish quantitative AQG and interim target levels. Instead, the following good practice statements were formulated to aid the management of the health and environmental concerns associated with these types of PM.
Conflict of Interest Statement:
Dr. Akdis has received research grants from the Swiss National Science Foundation, European Union (EU CURE), Novartis Research Institutes (Basel, Switzerland), Stanford University (Redwood City, Calif), and SciBase (Stockholm, Sweden); is the Co-Chair for EAACI Guidelines on Environmental Science in Allergic diseases and Asthma; is on the Advisory Boards of Sanofi/Regeneron, Novartis, GlaxoSmithKline, and SciBase; and is the Editor-in-Chief of Allergy; Dr. Nadeau reports grants from National Institute of Allergy and Infectious Diseases (NIAID), National Heart, Lung, and Blood Institute (NHLBI), National Institute of Environmental Health Sciences (NIEHS), and Food Allergy Research & Education (FARE); stock options from IgGenix, Seed Health, ClostraBio, and ImmuneID; is Director of the World Allergy Organization Center of Excellence for Stanford, Advisor at Cour Pharma, Consultant for Excellergy, Red tree ventures, Eli Lilly, and Phylaxis, Co-founder of Before Brands, Alladapt, Latitude, and IgGenix; and National Scientific Committee member at Immune Tolerance Network (ITN), and National Institutes of Health (NIH) clinical research centers, outside the submitted work; patents include, “Mixed allergen composition and methods for using the same”, “Granulocyte-based methods for detecting and monitoring immune system disorders”, “Methods and Assays for Detecting and Quantifying Pure Subpopulations of White Blood Cells in Immune System Disorders,” and “Methods of isolating allergen-specific antibodies from humans and uses thereof.” Anna Goshua declares no conflict of interest.
References
- 1.World Health Organization. Regional Office for Europe. (2021). WHO global air quality guidelines: particulate matter (PM2.5 and PM10), ozone, nitrogen dioxide, sulfur dioxide and carbon monoxide. World Health Organization. Regional Office for Europe. https://apps.who.int/iris/handle/10665/345329 [PubMed] [Google Scholar]
- 2.Vohra K, Vodonos A, Schwartz J, Marais EA, Sulprizio MP, Mickley LJ. Global mortality from outdoor fine particle pollution generated by fossil fuel combustion: Results from GEOS-Chem. Environmental Research. 2021;195:110754. [DOI] [PubMed] [Google Scholar]
- 3.Tiotiu AI, Novakova P, Nedeva D, Chong-Neto HJ, Novakova S., Steiropoulos P et al. Impact of air pollution on asthma outcomes. International Journal of Environmental Research and Public Health. 2020;17(17), 6212. [DOI] [PMC free article] [PubMed] [Google Scholar]
- 4.World Health Organization. Regional Office for Europe. (2006). Air quality guidelines: global update 2005: particulate matter, ozone, nitrogen dioxide and sulfur dioxide. World Health Organization. Regional Office for Europe. https://apps.who.int/iris/handle/10665/107823 [Google Scholar]
- 5.Yang B-Y, Fan S, Thiering E, Seissler J, Nowak D, Dong G-H, et al. Ambient air pollution and diabetes: A systematic review and meta-analysis. Environmental Research. 2020;180:108817. [DOI] [PubMed] [Google Scholar]
- 6.Paul KC, Haan M, Mayeda ER, Ritz BR. Ambient air pollution, noise, and late-life cognitive decline and dementia risk. Annual Review of Public Health. 2019;40(1):203–20. [DOI] [PMC free article] [PubMed] [Google Scholar]
- 7.Amini H WHO Air Quality Guidelines Need to be Adopted. International Journal of Public Health. 2021;66. [DOI] [PMC free article] [PubMed] [Google Scholar]
- 8.Schünemann H, Brożek J, Guyatt G, Oxman A, editors (2013). Handbook for grading the quality of evidence and the strength of recommendations using the GRADE approach (updated October 2013). Hamilton: GRADE Working Group; (gdt.guidelinedevelopment.org/app/handbook/handbook.html, accessed 10 October 2021). [Google Scholar]
- 9.US EPA (2019a). Integrated Science Assessment (ISA) for particulate matter (final report, December 2019). Washington (DC): United States Environment Protection Agency; (EPA/600/R-19/188; https://www.epa.gov/isa/integrated-science-assessment-isa-particulate-matter, accessed 10 October 2021). [Google Scholar]
- 10.Thurston GD, Ahn J, Cromar KR, Shao Y, Reynolds HR, Jerrett M, et al. Ambient particulate matter air pollution exposure and mortality in the NIH-AARP diet and health cohort. Environmental Health Perspectives. 2016;124(4):484–90. [DOI] [PMC free article] [PubMed] [Google Scholar]
- 11.Tobias A, Karanasiou A, Amato F, Querol X. Health effects of desert dust and sand storms. Environmental Epidemiology. 2019;3:396. [DOI] [PMC free article] [PubMed] [Google Scholar]