

Abstract

The durability of solid backfilling based on carbonated coal-based waste (CCBW) under mine water environments is critical for its engineering feasibility. This study investigates the deterioration mechanisms of CCBW exposed to acid solution (Acid W), alkaline solution (Alkaline W), and mine water (Mine W) through hydrochemical analysis, XRD, and SEM. Results reveal that the uniaxial compressive strength of CCBW decreased by 10.05, 3.93, and 1.62% after 28 days of immersion in the groups, respectively. Acid conditions induced CaCO3 dissolution and gypsum formation, while alkaline environments triggered alkali–silica reaction expansion. Mine water exhibited minimal impact due to suspended particles mitigating ion exchange. Carbonation also enhanced the durability of CCBW by forming dense CaCO3 clusters and C-A-S-H gels, thus reducing ion leaching. Notably, the average erosion resistance of carbonated samples (CCBW-5, 10, 30) was 2.32% higher than that of noncarbonated counterparts. These findings confirm the feasibility of CCBW applications in weakly alkaline mine water and highlight its potential for sustainable coal mining practices, aligning with carbon capture and circular economy principles.
1. Introduction
The extraction of coal resources is associated with a multitude of environmental challenges, including soil erosion, surface subsidence, and accumulation of solid waste. According to relevant data, the annual production of raw coal in China has shown an upward trend since the conclusion of the coal downturn, reaching 4.66 billion tons in 2023 alone. Coal mine waste rock, which constitutes the primary solid waste byproduct of coal mining, can account for approximately 10% to 25% of total coal mine output.1 Its accumulation not only occupies significant land resources but also poses considerable environmental hazards. During the stacking process, heat accumulation leads to oxidation and spontaneous combustion, resulting in the release of substantial quantities of toxic and harmful gases, such as SO2. Fly ash—primarily generated from coal-fired power generation, which is a downstream industry related to coal mining—accounts for roughly 60% to 88% of all combustion byproducts within this sector.2 Among them, nearly 30% of fly ash remains underutilized each year. Furthermore, activities related to coal exploitation—particularly those involving coal-fired power generation—produce significant amounts of CO2 emissions that exacerbate the greenhouse effect. To address these pressing issues, numerous innovative studies have begun focusing on CO2 mineralization (formation of water-insoluble carbonates) as a potential solution.
The process known as CO2 mineralization involves the preparation of coal-based solid waste into backfill through CO2 mineralization, which is subsequently dispatched into the goaf after coal mining. This technology holds both economic and sustainable development significance. Fundamentally, utilizing coal-based solid waste for carbon capture, utilization, and storage (CCUS) aligns with the principles of a circular economy. The greenhouse gases emitted during the production process of the coal power industry are recycled and stored in materials used to fill underground goafs, effectively achieving carbon cycling. On the one hand, the circular economy inherently possesses significant economic value. Simultaneously, reintroducing this mineralized, nontoxic material into the underground environment contributes to the restoration of natural capital.3 Additionally, relevant research highlights the unique role of CCUS technology in the design of sustainable industrial materials. For instance, Liu et al.4 emphasized that CO2 mineralization can not only sequester carbon but also enhance the mechanical properties of solid waste materials. Hanson et al.5 discovered that when CCUS technology is applied to building materials, these materials exhibit higher compressive strength and durability. These examples underscore the added value of the circular economy within the carbon cycle sector.
On a technical level, the earliest research on CO2 mineralization focused on dry mineralization.6 However, it was soon supplanted by wet mineralization due to its superior efficiency in carbon capture.7 Current studies on wet mineralization predominantly aim to enhance both the efficiency and the rate of the carbonation process. Most investigations utilize variations in temperature and pressure during the reaction as methods to achieve improved CO2 storage outcomes. Mehdizadeh et al.8 employed a response surface model to experimentally and statistically assess how various operational parameters—including reaction temperature (60–180 °C), water content (0.1–0.5 mL/g), and carbonation duration (5–50 min)—affect the carbonation properties of recycled concrete fine powder. Their findings indicate that at 100 °C, the carbonation conversion rate can be increased by 37.41% compared to ambient conditions at 20 °C. Huo et al.,9 while investigating high-flexural-strength cement, discovered that elevating the temperature to 70 °C significantly promotes anorthite formation, which acts as a primary carrier for mineralized and stored CO2 within this material. Hernandez-Rodriguez et al.,10 in their study of the carbonation of cement-based materials under varying partial pressures of CO2 ranging from 1 to 51 bar, found that the carbonation rates increase with partial pressure up to 26 bar. However, once this threshold is exceeded, this trend ceases. In addition to modification of the reaction conditions to enhance the carbonation process, there are also studies exploring alternative raw materials for the carbonation reaction. For instance, high-calcium fly ash (with a CaO content exceeding 10%) has been identified as more conducive to undergoing carbonation reactions and exhibiting higher carbonation rates.11−13 However, these approaches are not universally applicable. First, additional heating and pressure treatment measures complicate the filling mining process. Furthermore, the heating conditions themselves generate a certain amount of CO2. Additionally, high-calcium fly ash is typically produced from burning lignite or subbituminous coal—resources that are relatively limited in availability—resulting in significantly lower yields compared to low-calcium fly ash, which is generally derived from burning bituminous coal or anthracite.14 To address these challenges, Ngo et al.15,16 developed a set of solid backfilling based on carbonated coal-based waste (CCBW) utilizing an alkaline activation process, within the context of wet carbonation and “Three Normal” conditions (normal temperature, normal pressure, and low-calcium fly ash).
However, the stability of CCBW in engineering applications is yet to be verified. Relevant studies have confirmed that erosion of the ordinary backfill by mine water can compromise its durability. Zhao et al.17 demonstrated that the bond strength of ordinary Portland cement (OPC) concrete diminishes due to the deterioration of both resin–fiber and resin–concrete interfaces under prolonged water immersion. Wu et al.18 observed that fiber-reinforced and geopolymer-stabilized loess (FRG loess) exhibits cracking and loosening phenomena following water erosion, attributing this primarily to a reduction in the cementation effect within FRG loess caused by water erosion, as well as weakening of the filling effects provided by gel and ettringite. However, limited research has focused on the durability of carbonated backfill under the influence of mine water environments. Specifically, in practical engineering applications, factors such as the type and concentration of cations and ions present in mine water,19,20 along with pH values,21 play a crucial role in the evolution of backfill durability. Therefore, it is crucial to investigate the impact of individual factors on carbonated backfill by controlling variables based on specific mine water conditions.
Table 1 lists the types of cations and ions, as well as the pH values, found in mine water from several significant coal mines located in northwest China. It is observed that the mine water in this region is predominantly weakly alkaline. In contrast, acid mine water is primarily distributed across southern provinces, including areas such as Bijie in Guizhou and Ji’an in Jiangxi, where its occurrence is relatively rare. Therefore, given the broader application potential of CCBW, this study will utilize alkaline mine water as an experimental solution to investigate its impact on CCBW durability. The experiment employs weakly alkaline mine water sourced from the fourth mining area of the Chenjiashan Coal Mine, located in Tongchuan, Shaanxi Province. Controlled experiments are conducted with carefully regulated variables. An acid and alkaline solution containing specific ions is prepared to examine changes in the mechanical properties of CCBW within this solution while elucidating the damage and deterioration mechanisms associated with carbonated backfill subjected to erosion by mine water. Furthermore, it is essential to consider material stability from both short-term and long-term perspectives. To facilitate phased research efforts, this paper initially focuses on investigating short-term stability aspects related to CCBW.
Table 1. pH Values and Types of Mine Water Anions and Cations in Major Mining Areas in Northwest China.
| name of coal mine | location | anions | cations | pH |
|---|---|---|---|---|
| Liuhuanggou Coal Mine22 | Changji, Xinjiang | HCO3–, SO42–, Cl– | K+, Na+ | 7.80 |
| Wudong Coal Mine23 | Urumqi, Xinjiang | SO42–, Cl–, HCO3– | Na+, Ca2+ | 7.80 |
| Yili Coal Mine24 | Ili, Xinjiang | SO42–, HCO3–, Cl– | Na+, K+, Ca2+, Mg2+ | 7.82 |
| Hongdunzi Coal Mine25 | Yinchuan, Ningxia | SO42–, Cl–, HCO3–, F– | Na+, Ca2+, Mg2+ | 7.88 |
| Tangjiahui Coal Mine26 | Ordos, Inner Mongolia | Cl–, HCO3–, SO42– | Na+, Ca2+ | 7.55 |
| Selian Coal Mine27 | Ordos, Inner Mongolia | HCO3–, SO42–, Cl– | Ca2+, Na+, Mg2+ | 8.11 |
| Ningtiaota Coal Mine28 | Yulin, Shaanxi | Cl–, SO42–, HCO3– | K+, Na+, Ca2+ | 7.62 |
| Mengcun Coal Mine29 | Xianyang, Shaanxi | SO42–, Cl–, F– | Ca2+, Mg2+ | 7.50 |
| Chenjiashan Coal Mine30 | Tongchuan, Shaanxi | SO42–, HCO3– | K+, Na+, Ca2+ | 8.02 |
2. Mining Area Introduction
The Chenjiashan Coal Mine is situated in the northwest region of Tongchuan City, Shaanxi Province (Figure 1), and it operates under the jurisdiction of Shaanxi Coal Tongchuan Mining Co., Ltd. It is located within the Jiaoping mining area, which lies to the south of the Northern Shaanxi Plateau. The total recoverable reserves are estimated at 42.03 million tons, encompassing an area of approximately 20.4 km2. The aquifers associated with the Chenjiashan Coal Mine primarily consist of Quaternary aquifers, Luohe sandstone aquifers from the Luohe Formation, Yijun conglomerate aquifers, and middle and upper sandstone aquifers from both the Zhiluo Formation and Yan’an Formation. In terms of water chemistry, the main cations present in mine water include K+, Na+, and Ca2+, whereas the predominant anions are SO42– and HCO3–. Overall, the quality of this water is considered to be good.30
Figure 1.

Geographical location of the Chenjiashan Coal Mine. Photograph courtesy of Esri. Copyright 2024.
3. Materials and Methods
3.1. Materials
3.1.1. Cement, Fly Ash, and Coal Mine Waste Rock
The ordinary Portland cement P.O42.5 (CM) utilized in this experiment was procured from Zhucheng Jiuqi Building Materials Co., Ltd. It served as a consolidation agent, facilitating hydration bonding during the experimental process. Fly ash (FA) was sourced from a coal-fired power plant located in Zhengzhou, Henan Province, China, and it functioned as both a gelling material and a fine aggregate within this study. Coal mine waste rock (WR) was obtained from the Energy and Chemical Engineering Base in Eastern Ningxia and was employed as the aggregate for backfill materials. The cumulative particle size distribution of the FA, CM, and WR was assessed using a laser particle size analyzer (Malvern Mastersizer 3000, UK), as illustrated in Figure 2. The oxide composition and phase characteristics of the raw materials were determined through X-ray fluorescence spectroscopy (XRF; Panalytical Zetium, The Netherlands) and X-ray diffraction analysis (XRD; Bruker D2 Phaser, Germany), respectively. The findings are summarized in Table 2 and depicted in Figure 3.
Figure 2.
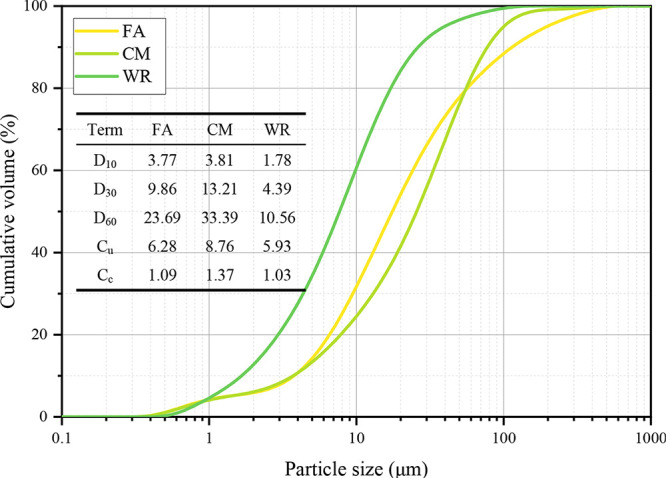
Particle size distribution of FA, CM, and WR. Dx represents the x% volume percentage of particles with a diameter less than Dx; Cu represents the coefficient of uniformity (Cu = D60/D10); and Cc represents the coefficient of curvature (Cc = D302/(D60 × D10)).
Table 2. Chemical Composition of FA, CM, and WR.
| chemical
composition (mass %) |
|||||||||||
|---|---|---|---|---|---|---|---|---|---|---|---|
| sample | CaO | SiO2 | Al2O3 | Fe2O3 | K2O | TiO2 | MgO | SO3 | P2O3 | P2O5 | other |
| FA | 2.616 | 54.867 | 32.297 | 4.362 | 1.518 | 1.632 | 0.231 | 0.640 | 0.327 | 1.510 | |
| CM | 49.980 | 24.200 | 8.050 | 3.080 | 0.920 | 0.500 | 4.890 | 4.020 | 0.170 | 4.190 | |
| WR | 61.441 | 12.967 | 4.677 | 1.481 | 0.903 | 0.317 | 9.047 | 0.468 | 0.075 | 8.624 | |
Figure 3.
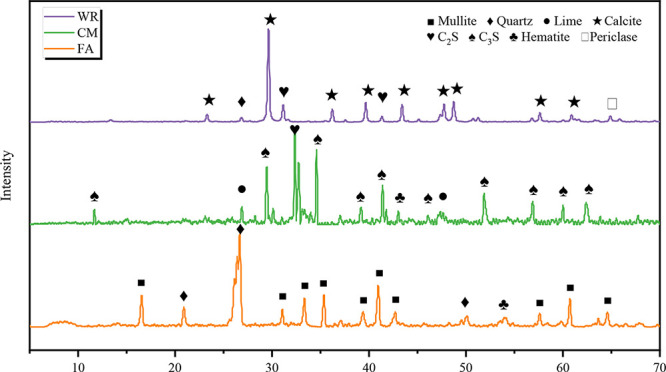
XRD spectra of FA, CM, and WR.
Data analysis indicates that the FA is predominantly composed of SiO2, Al2O3, and Fe2O3, corresponding to quartz, mullite, and hematite, respectively. The CM primarily consists of CaO, SiO2, and Fe2O3, which correspond to C3S (tricalcium silicate), C2S (dicalcium silicate), lime, and hematite. The WR mainly contains CaO, SiO2, and MgO corresponding to calcium compounds, such as C2S, quartz, and periclase.
3.1.2. Alkali Activator, CO2, and Solution
CO2 was supplied by Xuzhou Luyou Gas Co., Ltd. NaOH and Na2SiO3 (purity of 99.9%) were procured from Tianjin Hengxing Chemical Reagent Manufacturing Co., Ltd. The relative molecular weights of these compounds are 40.00 for NaOH and 284.22 for Na2SiO3, which are utilized to prepare the alkaline activator and enhance the latent activity of fly ash in this experiment.
The exposure solutions employed in this study included Tap W (tap water), Acid W (acid solution), Alkaline W (alkaline solution), and Mine W (mine water). Among these, Acid W and Alkaline W were formulated using tap water, along with a H2SO4 solution (0.05 mol/L, sourced from Guangzhou Hewei Medical Technology Co., Ltd.) and a KOH solution (0.1 mol/L, obtained from Weihui Tengsheng Trading Co., Ltd.), respectively. Detailed configuration parameters are listed in Table 3. Tap W (pH: 7.80 ± 0.2) was provided by Xuzhou Tap Water Co., Ltd., while Mine W (pH: 8.02 ± 0.2) was collected from the 416 working face of the Chenjiashan Coal Mine. The elemental compositions of both tap water and mine water are illustrated in Figure 4.
Table 3. Configuration Parameters of Tap W, Acid W, Alkaline W, and Mine W.
| no. | Tap water/mL | H2SO4/mL | KOH/mL | Mine water/mL | pH |
|---|---|---|---|---|---|
| Tap W | 565 | 7.80 | |||
| Acid W | 550 | 15 | 5.05 | ||
| Alkaline W | 550 | 15 | 9.38 | ||
| Mine W | 565 | 8.02 |
Figure 4.
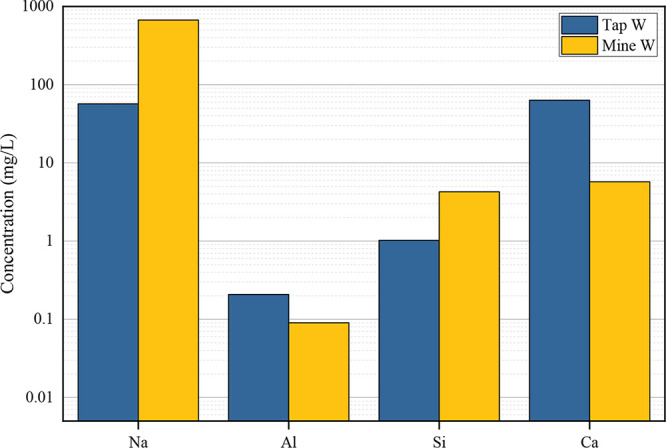
Element concentration detection of Tap W and Mine W.
3.2. Preparation
The water–solid ratio and the composition ratio of raw materials for CCBW were prepared in accordance with the Chinese national standard (GB/T 17671-2021),31 as detailed in Table 4. The mixing ratios were selected based on our previous studies to ensure optimal workability and mechanical performance. Initially, FA, CM, and WR were thoroughly mixed to achieve homogeneity in the dry phase. Subsequently, a predefined amount of NaOH and Na2SiO3 was dissolved in tap water and stirred at room temperature at a speed of 500 rpm for 10 min to prepare the alkali activator. Following this preparation, CO2 was continuously injected into the reactor at a rate of 1 L/min, according to the specified reaction time. The fresh CCBW slurry was then poured into a cylindrical mold measuring Φ50 mm × 100 mm, allowed to precipitate at room temperature for 48 h, after which it was demolded and transferred to a standard curing box maintained at a temperature of 20 ± 2 °C, with humidity levels set at 95 ± 2%. A detailed flowchart illustrating the experimental procedure is presented in Figure 5.
Table 4. Material Mixing Ratio of CCBW.
| solid
mass percentage |
liquid
mass percentage |
|||||||||
|---|---|---|---|---|---|---|---|---|---|---|
| no. | FA | CM | WR | solid | Na2SiO3 | NaOH | Tap water | liquid | curing time | CO2 |
| CCBW-0 | 45 wt % | 10 wt % | 45 wt % | 75 wt % | 10 wt % | 5 wt % | 85 wt % | 25 wt % | 3/28 days | 0 min |
| CCBW-5 | 45 wt % | 10 wt % | 45 wt % | 75 wt % | 10 wt % | 5 wt % | 85 wt % | 25 wt % | 3/28 days | 5 min |
| CCBW-10 | 45 wt % | 10 wt % | 45 wt % | 75 wt % | 10 wt % | 5 wt % | 85 wt % | 25 wt % | 3/28 days | 10 min |
| CCBW-30 | 45 wt % | 10 wt % | 45 wt % | 75 wt % | 10 wt % | 5 wt % | 85 wt % | 25 wt % | 3/28 days | 30 min |
Figure 5.

Experimental flowchart.
3.3. Methods
3.3.1. Water Weakening Test
The water weakening experiment was designed to investigate the corrosion effects of tap water, acid solutions, alkaline solutions, and weakly alkaline mine water on carbonated materials. Given the similarities between CCBW and traditional concrete samples regarding raw material composition, water–cement ratio, and curing mechanisms, this experiment adhered to the methodological frameworks established in standards (JTG 3420-2020)32 and (GB/T 50082-2009).33 However, considering the specific objectives of this study—to assess the short-term stability of CCBW—and considering the unique application scenario involving prolonged immersion in mine water rather than cyclic dry–wet conditions as outlined in the standards, modifications were made to both the testing duration and solution composition. Prior to the experiments, all required solutions were prepared in corrosion-resistant containers measuring Φ100 × 250 mm, following the proportions specified in Table 3. Subsequently, (CCBW) samples were immersed in Tap W, Acid W, Alkaline W, and Mine W at designated curing times. The solution was poured into the container at least 20 mm above the top surface of the sample and covered with plastic film during soaking to prevent evaporation of the solution. The soaking duration was maintained at 24 ± 0.5 h. After immersion, samples were dried at a temperature of 60 ± 5 °C for an additional period of 24 ± 0.5 h.
The weakening coefficient of the carbonated material postsoaking was calculated according to eq 1:
| 1 |
where fcn is the uniaxial compressive strength after water weakening and fco is the uniaxial compressive strength of the initial specimen.
3.3.2. Hydrochemical Detection
During soaking, the dynamic change of the pH value in the solution was measured at 0.5 h intervals using a pH meter (Qiwei microcomputer PHB-1). At the end of the test, the leaching solution was collected and filtered through a 0.45 μm membrane. The concentration of elements in the filtrate was subsequently analyzed by using inductively coupled plasma mass spectrometry (ICP-MS, Agilent 7800 MS).
3.3.3. Mass Change Test
The mass of the dry sample was measured and recorded as Mi0. After the sample underwent soaking and subsequent drying, its mass was reweighed and documented as Mi1. The rate of mass change for the samples before and after soaking is calculated in accordance with eq 2. This test was conducted using a specialized laboratory electronic scale with an accuracy of 0.01 g.
| 2 |
3.3.4. X-ray Diffraction (XRD)
An X-ray diffractometer (Bruker D2 Phaser, Germany) was employed for the XRD analysis of the sample. The relevant parameters were as follows: a Cu target Kα line was utilized (wavelength λ = 1.54184 Å), with a scanning angle range of 2θ = 5°–90° and a scanning speed set at 5°/min. The acquired diffraction patterns were processed using the MDI Jade software in accordance with a standardized workflow. To enhance signal clarity while preserving the morphological features of the peaks, the data were filtered utilizing a Savitzky–Golay algorithm (second-order polynomial, 5-point window). Subsequently, crystalline phases were identified by comparing the processed spectra against the ICDD PDF2-2004 database, with a threshold match score >90% and a signal-to-noise ratio > 3.
3.3.5. Micromorphology Analysis
Field emission scanning electron microscopy (FE-SEM) using a ZEISS Sigma 300 instrument and energy-dispersive X-ray spectroscopy (EDS) with an OXFORD X-max 50 instrument were employed for the analysis. During the treatment, 3 distinct regions of each sample were selected for scanning, with at least 5 data points collected from each region for EDS point analysis. The samples were tested under high vacuum conditions at a voltage of 3 kV. The spectral acquisition time for each measurement point was set to 14 s, with a working distance of 8.4 mm. Prior to testing, the samples underwent cutting, drying, and gold sputtering to facilitate microstructural and compositional analysis.
4. Results and Discussion
4.1. Water Weakening Effects
4.1.1. Characteristics of Water Weakening Properties
The weakening of CCBW after being soaked in solutions at different curing times is shown in Figure 6.
Figure 6.

Effects of different solutions on the UCS of CCBW.
Upon comparison of the effects of water weakening after curing at different stages, it is evident that as the curing time increases, the unconfined compressive strength (UCS) of the samples consistently rises, irrespective of whether they are subjected to carbonation or soaking conditions. For example, the UCS of CCBW-10 in the Tap W group increased from 2.40 to 3.13 MPa when cured for a duration from 3 to 28 days. This is associated with the continuous hydration throughout the curing process.34 It can also be found that the UCS after carbonation was higher than that without carbonation. After 28 days of curing the samples, the strength of CCBW-5, CCBW-10, and CCBW-30 was 11.24, 20.14, and 7.22% higher than that of CCBW-0, respectively. This may be because the carbonation process not only enhanced the strength of the aggregate but also filled the internal pores to promote cementation.35 The reaction equations of hydration and carbonation are listed in eqs 3–6.
However, it is worth noting that with the increase of CO2 absorption, the strength of CCBW-30 was not higher than that of CCBW-10. This may be due to the limited Ca source of the raw material (class F fly ash). CO2 carbonation may reach a saturation point before 30 min, resulting in a partial transformation of generated CaCO3 clusters to Ca(HCO3)2, as shown in eq 7. Ca(HCO3)2 has a higher solubility, leading to the formation of more pores at the original CaCO3 cluster formation site.36 Therefore, the reduction in the CaCO3 content and the increase in porosity contribute to a decline in the CCBW-30 strength. However, at the same time, it should be noted that the strength of CCBW-10 was 28.01% higher than that of CCBW-30 after 3 days of curing, while the gap was reduced to 12.05% after 28 days. This indicates that the difference in strength between the two gradually narrowed with the extension of curing time. It is hypothesized that this phenomenon may be attributed to the pozzolanic reaction during prolonged curing periods.37 Specifically, the two tetrahedrons [SiO(OH)3]− and [Al(OH)4]− are released from fly ash and actively compete for the bridge site of dimeric silicate in C–S–H gel (calcium silicate hydrate (xCaO·ySiO2·H2O), a gel formed during the hydration of cement) generated by cement hydration under an alkaline environment. During this process, it is highly probable that with the dissolution of Ca(HCO3)2, a novel gel structure is formed within the pores subsequent to its dissolution.38 This not only fills voids but also enhances the material cohesion, thereby diminishing the strength disparity between CCBW-10 and CCBW-30.
| 3 |
| 4 |
| 5 |
| 6 |
| 7 |
4.1.2. Performance of Corrosion Resistance in CCBW
After a curing period of 3 days, the carbonated samples from the Acid W group, Alkaline W group, and Mine W group exhibited increases in strength of 7.09, 11.02, and 13.39%, respectively. However, following a curing duration of 28 days, the corresponding reductions in strength were 10.05, 3.93, and 1.62%. This suggests that after merely 3 days of curing, the hydration process within the samples remains incomplete. Thus, continuous hydration during soaking contributes to further strength enhancement. In mine backfill engineering, it is common practice to consider the compressive strength at 28 days as a critical parameter for assessing the performance of filling materials.39 Consequently, this study on CCBW durability will primarily concentrate on samples curing over a span of 28 days.
Figure 7 fits the relationship between the weakening coefficient Kf of CCBW and the CO2 absorption levels. It is observed that the weakening coefficient initially increases and subsequently decreases as CO2 absorption increases, with a saturation point occurring approximately within the range of 15–20 min. This observation also aligns with the variation in strength corresponding to different amounts of the above CO2 absorption. Furthermore, the figure also illustrates that the average weakening coefficients for carbonated and noncarbonated samples differ across the three solutions. Specifically, within the Acid W, Alkaline W, and Mine W groups, the average weakening coefficient for the noncarbonated sample CCBW-0 is 92.44%, while the average weakening coefficient for the carbonated samples (CCBW-5, CCBW-10, and CCBW-30) is 94.76%. This indicates that the carbonated samples not only exhibit enhanced strength but also demonstrate greater resistance to corrosion. It is evident that when greenhouse gases emitted from the combustion of organic carbon in coal are resolidified and stored, the performance of filling materials can also be enhanced. This demonstrates that CCUS technology, which aligns with the principles of the circular economy, not only facilitates CO2 storage and carbon emission reduction but also improves the mechanical strength and stability of filling materials.40,41
Figure 7.
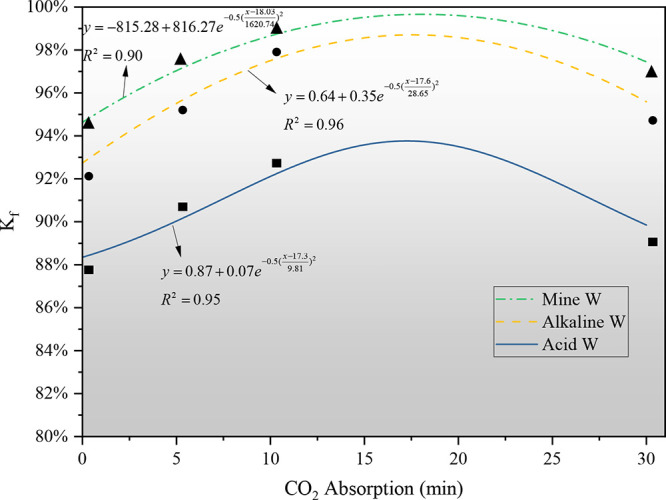
Coefficient of weakening as a function of the absorption of CO2 in various solutions.
Based on the compression failure diagram of the samples presented in Figure 8, it is clear that among the three testing solutions, the acid solution has a significantly greater impact on the erosion of all samples, including the noncarbonated sample CCBW-0. The average weakening coefficient resulting from this effect reaches 89.99%. Postcompression failure, the sample exhibits distinct shear failure surfaces, which are characterized by relatively large areas of failure. The erosive effect of alkaline solution on CCBW ranks second, resulting in an average weakening of 95.21%, accompanied by noticeable damage to surfaces and erosion holes of varying sizes across its surface. Conversely, mine water exhibits the least erosive effect on CCBW, yielding an average weakening of 96.93%. Notably, after compression testing, the morphology of the soaked sample remains largely intact, displaying only minor “white stains” on its surface. Additionally, it was found that the strength of CCBW in the Tap W group increased by 2.77% following immersion. This enhancement, which is less pronounced than that in 3-day curing, is primarily ascribed to the short-term and mild corrosive effect of tap water on carbonated materials.42
Figure 8.

Failure diagram of CCBW samples after compression.
4.2. Mass Change Analysis
To better compare the influence mechanism of various solutions on carbonated materials, the mass changes of CCBW-0 and CCBW-10 after curing for 3 and 28 days in various exposure conditions were measured. The results are shown in Figure 9.
Figure 9.

Radar map of CCBW mass changes after soaking in diverse solutions.
Intuitively, the mass of samples within each group exhibited varying degrees of improvement following soaking. Typically, the free water present in the solution sequentially infiltrates the sample and engages in various reactions to form bound water, thereby ensuring that this portion of water does not evaporate during drying at 60 °C.43,44 Consequently, the short-term soaking process maintains continuous hydration of the samples, leading to the formation of new compounds. At the same time, it can be observed that an increase in the curing duration of the sample correlates with a decrease in the mass change rate. Specifically, when the curing period for CCBW-0 and CCBW-10 was extended from 3 to 28 days, the average mass growth rates decreased by 37.02 and 39.92%, respectively. As indicated in Section 4.1, the soaking treatment of CCBW results in a reduction of its strength; therefore, it can be concluded that changes in mass are not positively correlated with changes in strength. In fact, this enhancement in mass may even serve as a contributing factor to the decline in CCBW strength in some cases.45,46 Additionally, the carbonated sample CCBW-10 demonstrates a lower mass growth rate compared to CCBW-0. Experimental results indicate that after 3 and 28 days of curing, followed by participation in the water weakening test, the mass growth rate of CCBW-10 was reduced by 5.13 and 9.49%, respectively, relative to CCBW-0. The two data sets suggest that both extended curing durations and the carbonation of filling materials contribute to a reduction in mass gain of CCBW during immersion.
The impact of various exposure solutions on the enhancement of the CCBW mass exhibits notable differences. The average mass change rates for CCBW in Tap W, Acid W, Alkaline W, and Mine W are recorded at 0.48, 0.40, 0.58, and 0.52%, respectively, with Alkaline W exhibiting the highest growth rate due to its alkaline environment promoting gel-like substance formation.47,48 This process is also accompanied by a significant conversion of free water into bound water. The observed increase in mass for weakly alkaline mine water and tap water may similarly arise from this mechanism. However, in comparison to Alkaline W, the relatively smaller mass increase in these two groups can be linked to the previously mentioned “white stains” and more neutral pH levels, respectively.49 Furthermore, the Acid W group demonstrated the least mass increase, primarily due to H+-induced degradation of gel materials, which leads to structural disintegration. However, even so, CCBW mass still improved postsoaking; this could potentially result from sulfur (S) substituting carbon (C), thereby yielding compounds with higher relative molecular masses.50
4.3. Solution Analysis
4.3.1. Leaching Element Analysis
To further investigate the ionic leaching behavior of carbonated materials following immersion in various solutions, leachate samples from CCBW-0 and CCBW-10 (cured for 28 days) after exposure to Acid W, Alkaline W, Mine W, and Tap W for 24 h were selected to analyze the leaching conditions of Na, Al, Si, and Ca. The results are shown in Figure 10.
Figure 10.
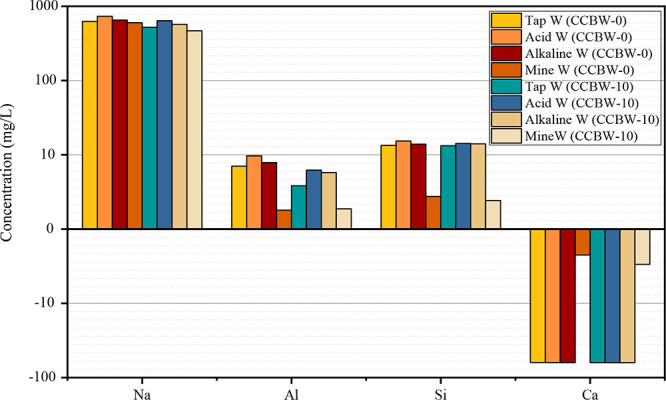
Variations in the concentrations of Na, Al, Si, and Ca in the exposure solution following immersion.
The results showed that the leaching concentration of Na was the highest, followed by that of Si and Al. The concentration of Ca decreased instead of increasing, which indicated that CCBW showed an adsorption characteristic for Ca. The former phenomenon is primarily influenced by the alkaline activator, which facilitates the dissolution of alkaline substances during the soaking process, thereby leaching Na, Al, and Si.51 In contrast, the latter phenomenon is likely attributed to the sequestration of Ca2+ through the precipitation of CaCO3 and its adsorption by the gel formed during sample immersion. This process consequently reduces the concentration of Ca2+ in the solution. On the one hand, Ca2+ ions are captured by CO32– ions that dissociate from the sample, resulting in the formation of CaCO3 precipitates via ionic bonding. However, at elevated pH levels, the extent of CO32– dissociation is limited, which restricts the amount of Ca2+ that can be captured.49 On the other hand, as indicated by previous studies,52 carbonated materials generate a specific gel during hydration that serves as an adsorption site for Ca2+ through hydrogen bonding on its surface.53 This results in the effective capture of Ca2+ via this anchoring effect. Once charge equilibrium is achieved, macroscopic adsorption of Ca2+ by the gel ceases, thus maintaining a certain concentration of Ca2+ in solution.
The ion transport process is illustrated in Figure 11.
Figure 11.

Diagram of the ion transport process during immersion.
Figure 10 also illustrates that, for the leaching of Na, Al, and Si, the leaching concentrations of the carbonated material CCBW-10 were lower than those of CCBW-0 by 15.76, 32.86, and 3.21%, respectively. This observation indicates that the carbonation process may have resulted in a denser pore structure within the material, thereby reducing contact between the exposure solution and its interior, which subsequently diminishes ion leaching.52 Furthermore, among the four types of solutions examined, the Acid W group exhibited the highest element leaching concentration, followed by the Alkaline W and Tap W groups. Conversely, the Mine W group demonstrated the lowest leaching concentration. The levels of elemental leaching are closely associated with material porosity. Generally speaking, an increase in porosity tends to correlate with a decrease in strength.54 Therefore, based on ion leaching levels across each group, it can be inferred that CCBW demonstrates inferior acid resistance compared to alkali resistance. The significant leaching of ions observed in the Acid W group also explains why the mass of CCBW in this group exhibited the least improvement, as discussed in Section 4.2.
Regarding Ca adsorption rates within Mine W configured with mine water, CCBW-0 exhibits an adsorption rate of 39.00%, while CCBW-10 shows a higher rate at 52.18%. This indicates that not only does CCBW-10 absorb CO2 during preparation but also facilitates secondary carbon fixation through Ca2+ retention during immersion in water. Previous studies have shown that carbonated materials yield a higher quantity of gels and enhance the adsorption of Ca2+ compared to their uncarbonated counterparts. Additionally, it is noteworthy that although initial tap water contains a higher Ca content than initial mine water, adsorption rates for both CCBW-0 and CCBW-10 reach approximately 99.05 and 99.29%, respectively, when tested against Acid W, Alkaline W, and Tap W groups utilizing tap water, indicating near-complete absorption efficiency. This phenomenon can be explained by visible suspended matter found in mine water. Such particles provide protective effects, which contribute to reduced ion leaching and adsorption levels for CCBW within Mine W group samples. This suspended substance also accounts for the previously mentioned “white stains”. The calculation for the adsorption rate follows eq 8:
| 8 |
where ΔC is the adsorption rate of Ca by CCBW, C0 is the initial element concentration of Ca in tap water or mine water (mg/L), and Cin is the adsorption concentration of Ca by CCBW (mg/L).
4.3.2. pH Change Curve Analysis
Figure 12 records the 24 h pH curve of CCBW-0 and CCBW-10 soaked in each exposure solution.
Figure 12.

24 h pH curve of the solutions during CCBW immersion.
It is evident that regardless of the type of solution being immersed, the pH value exhibits a significant increasing trend within the first 0 to 8 h, followed by a gradual increase thereafter. According to the study of Ngo et al.,51 this phenomenon primarily occurs due to the rapid dissolution and ionization of substantial quantities of OH– and HCO3– ions facilitated by alkaline activators in exposure solution during the initial immersion phase, leading to a swift increase in pH levels. Furthermore, it is noteworthy that the pH of the CCBW-10 leaching solution was higher than that of CCBW-0 in the first hour. However, subsequently, the pH of the CCBW-0 leaching solution increased and surpassed that of CCBW-10. This was plausibly due to a lower Ca/Si ratio of carbonated materials. As the pH value increases, a reduction in the Ca/Si ratio facilitates the incorporation of Al into the CaO–SiO2–H2O model system, potentially leading to the formation of a denser and more stable gel structure.55 This enhanced structure serves to protect the material from further erosion. This was also confirmed by the more gradual change in the pH value of the CCBW-10 leaching solution in the later stage. It can also be observed that under the immersion of weakly alkaline mine water, both CCBW-0 and CCBW-10 exhibited a relatively slow change in the pH of the leaching solution. After 24 h, the pH of the leaching solution stabilized within a range of 9.5–10.0, which was significantly different from that of the other three groups. The phenomenon of stability maintenance may also be associated with the protective effects of suspended matter previously mentioned.
4.4. Evolution of Phase Composition Following Water Weakening
The X-ray diffraction (XRD) spectra of CCBW, following immersion in various exposure solutions, are presented in Figure 13.
Figure 13.

Variations of XRD spectra of CCBW-0 and CCBW-10 immersed in diverse solutions.
The XRD spectra exhibit diffraction peaks corresponding to mullite, quartz, calcite, silica gel, C-S-H gel, C-A-S-H gel (calcium aluminosilicate hydrate (xCaO·yAl2O3·zSi2O·H2O), a new gel formed after the pozzolanic reaction), gypsum, and N-A-S-H gel (sodium aluminosilicate hydrate (xNa2O·yAl2O3·zSi2O·H2O), a geopolymer gel formed in alkali-activated materials). Mullite and quartz primarily originate from fly ash. Calcite is largely a product of CO2 carbonation, with some contribution from coal mine waste rock present in the raw materials. Silica gel mainly arises from active SiO2 in fly ash and the hydration process of cement. C-S-H and C-A-S-H gels are predominantly products of hydration processes. Notably, the formation of the C-A-S-H gel provides evidence for the occurrence of the pozzolanic reaction. This phenomenon clarifies why the strength differential between CCBW-10 and CCBW-30 progressively diminishes with extended curing time. Compared to CCBW-0, a larger quantity of C-A-S-H gels is produced in CCBW-10. This increase can be attributed to the enhanced capacity of the carbonated material to facilitate the incorporation of Al into the CaO–SiO2–H2O model system, as previously noted. Additionally, samples from the Acid W group revealed a new phase—gypsum—and a novel gel phase identified as N-A-S-H was also detected within the Mine W group samples.
After immersion in the Tap W group, the phase composition of CCBW remained largely unchanged; however, an increased amount of gel was generated following hydration. In the Acid W group, the diffraction peak corresponding to calcite exhibited a significant reduction, primarily due to erosion caused by H+ in solution. Similarly, the decline in peak intensity of the C-(A)-S-H gel can also be attributed to this effect. Weak diffraction peaks for gypsum were observed at approximately 2θ = 32°, 34°, and 43°, indicating that gypsum formation occurred within samples exposed to sulfuric acid solution. The alterations induced by these phases will influence material pore filling and aggregate cementation, thereby diminishing the strength of the samples. Notably, CCBW-10 exhibits enhanced resistance to erosion, characterized by a reduction in gypsum production, the regeneration of C-S-H at various peak positions, and an increase in the intensity of the diffraction peaks associated with silica gel. Collectively, these phase characteristics clarify the underlying reason for the 21.28% enhancement in the strength of CCBW-10 within the Acid W group compared to CCBW-0.
The phase change of CCBW in the Alkaline W group is relatively minor, and the quantity of gel formation in CCBW shows an increase. However, the spectrograms of samples reveal a slight broad band within the range of 2θ = 15°–35°, along with some broader peaks observed around 2θ = 60°–70°. This indicates that an amorphous phase has been generated. It is likely that this amorphous phase significantly contributes to the erosion of CCBW by alkaline solutions.46 Notably, CCBW-10 exhibits a smoother broadband in this range, and several of its broad peaks display lower intensities, suggesting that it generates fewer amorphous phases. This may explain why the alkaline resistance of CCBW-10 is 22.41% higher than that of CCBW-0. In contrast, under identical alkaline conditions, the Mine W group produced less amorphous phase but synthesized a new gel known as N-A-S-H. Related studies indicate that the Si–O bond strength in N-A-S-H appears to be weaker than that found in C-A-S-H.56 As a result, the overall strength of N-A-S-H is consequently diminished. Nevertheless, the gel structure within the Mine W group remains well-preserved, which may be attributed to the protective effect provided by “white stains.″
4.5. Impact of Water-Induced Weakening on the Microstructural Evolution of CCBW
To fundamentally comprehend the impact of the mine water environmental effect on the durability of carbonated materials, the SEM and EDS of CCBW-10 after immersion in each solution were investigated and analyzed, as presented in Figure 14.
Figure 14.
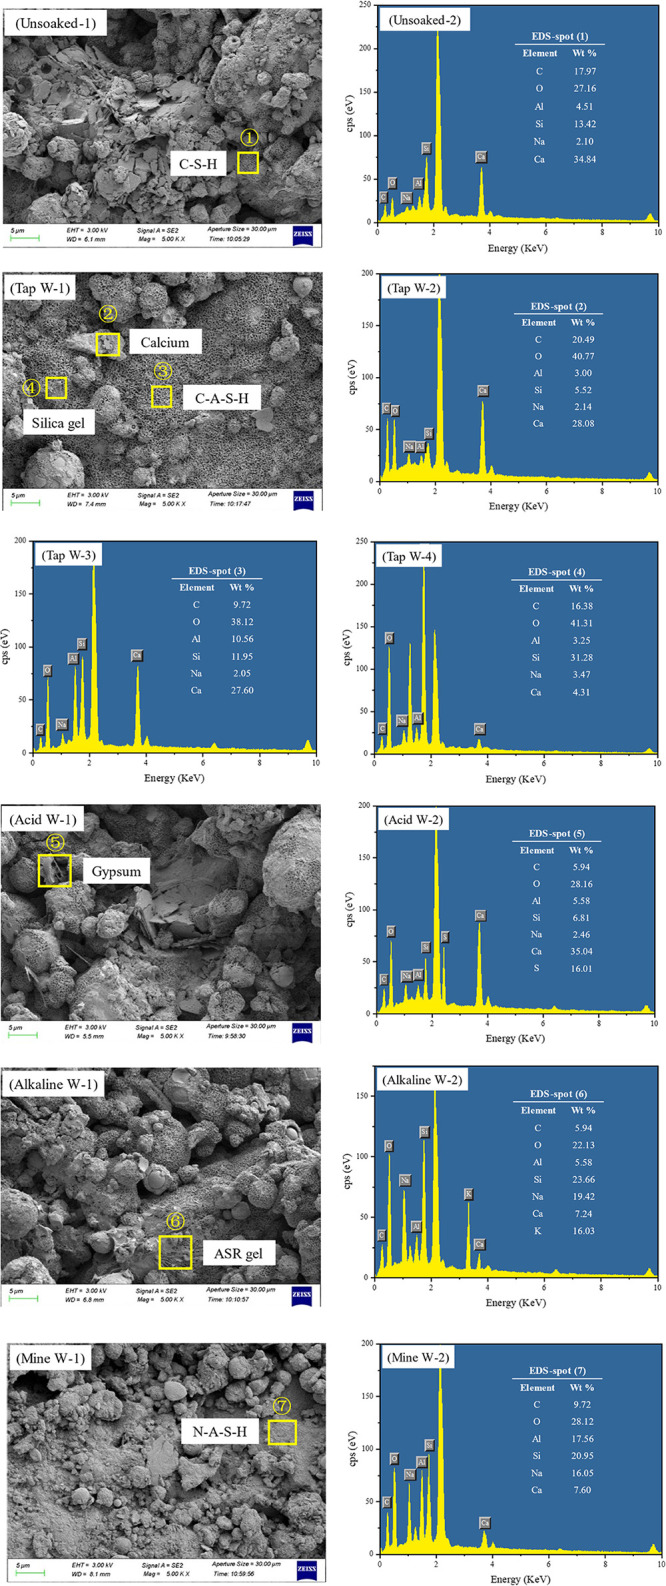
SEM and EDS analyses of CCBW-10 after erosion with different exposure solutions.
At point 1, a significant quantity of honeycomb flocculants was observed. The EDS analysis revealed elevated levels of Ca, Si, and O, allowing for the identification of the honeycomb-like morphology as C-S-H gel.53 At point 2, Ca, C, and O elements were found to be abundant, and the bulk morphology indicates that these are CaCO3 crystals formed postcarbonation.15 Similar to point 1, a considerable presence of honeycomb-like flocculants is noted at point 3. However, in addition to high concentrations of Ca, Si, and O, the Al content is also elevated here. Thus, this particular structure can be classified as C-A-S-H gel.38 The Si and O contents at point 4 are relatively high, with a smooth crystalline surface characterizing it as crystalline silica gel, formed by the gradual crystallization of CaCO3 along with other crystal nuclei during hydration processes.57 Point 5 features inclined columnar microcrystals rich in substantial amounts of Ca and O alongside some S. These have been identified as newly formed gypsum resulting from sulfuric acid erosion on carbonated materials.58 At point 6, irregularly shaped loose paste colloids were present. EDS results indicated high levels of Na and K in addition to Si and O. In the analysis of the XRD patterns presented in Section 4.4, it was determined that the Alkaline W group may exhibit the formation of an amorphous phase. This observation is consistent with the EDS results, which indicate that CCBW-10 generates an amorphous alkali–silica gel (ASR gel) upon immersion in the alkaline solution due to an alkali–silica reaction (ASR, a chemical process between alkalis and reactive silica in aggregates).59 A similar gel form exists at point 8 but exhibits a slightly looser structure. Combined EDS spectra show abundance in Al, Si, and O while indicating lower levels of Ca relative to higher Na content, leading to its classification as N-A-S-H gel.56
Statistical analysis of the EDS point scan results reveals the average values of the C-A-S-H Ca/Si ratio and Al/Si ratio for the different measurement points of CCBW-10 samples soaked in various solutions. The Ca/Si ratio ranged from 1.4 to 2.2 across all groups, with the lowest values observed in the Unsoaked group (1.53) and the Tap W group (1.49). The remaining three groups exhibited ratios between 2.0 and 2.2. Related research indicates that the Ca/Si ratio influences the gel strength by altering the size of gel pores. According to Jennings’ colloidal model (CM-II),60 gel pores can be categorized into small gel pores (SGP, aperture <3 nm) and large gel pores (LGP, aperture 3–12 nm). As the Ca/Si ratio increases, the proportion of LGP rises, thereby diminishing the bonding force of the gel and reducing material strength. A similar trend is observed for the Al/Si ratio. The pozzolanic reaction introduces Al into the C-S-H system. Studies demonstrate61 that the mechanical properties of the gel are optimal when the Al/Si ratio is 0.2, deteriorating at both higher and lower levels due to the impact of Al on the proportion of LGP. Based on EDS statistics, the Al/Si ratios for the Unsoaked, Tap W, Acid W, Alkaline W, and Mine W groups were 0.16, 0.24, 0.47, 0.43, and 0.35, respectively, aligning with the strength analysis presented earlier.
Figure 15 further shows the micromorphological characteristics of CCBW-10 after erosion with different exposure solutions in detail.
Figure 15.

Evolution of characteristic structures in CCBW-10 following erosion.
It is evident that following the degradation of the Acid W group (H2SO4) sample, a significant portion of the honeycomb flocculant on its surface detaches, leading to an increase in the pore size within the material. This phenomenon primarily results from H+ ion erosion. On the one hand, H+ ions compromise the gel structure by disrupting Al–O–Si bonds.62 On the other hand, they also destabilize CaCO3 crystals by altering their crystalline architecture.63 The corresponding reaction equations are presented in eqs 9 and 10. Consequently, the cementitious material within the sample progressively disintegrates, and essential aggregates dissolve as well, culminating in an overall enlargement of the pore size throughout the sample. Notably, leaching levels of Na, Al, and Si in samples from the Acid W group were found to be the highest among all groups, thereby substantiating this observation. Simultaneously, it is noteworthy that, in comparison to the other two sample groups, the presence of substantial CaCO3 crystals in the Acid W group is relatively scarce. However, a small quantity of inclined columnar crystals—gypsum—has been identified. It should be noted that gypsum generates expansion pressure during crystallization,64 which can lead to cracking of the specimen, evidenced by the two microcracks observed in Figure 15a-3. This phenomenon occurs because free SO42– infiltrating the pores binds with Ca2+ associated with C-A-S-H gel to form diagonal columns of gypsum (refer to eq 11), thereby filling internal voids within the material. Nevertheless, the expansion-induced damage from gypsum compromises the internal structure of the material and results in microcracking, ultimately achieving a sequence of initial densification, followed by subsequent cracking.
| 9 |
| 10 |
| 11 |
In the context of acid corrosion, a pronounced triple weakening effect is observed, leading to a substantial reduction in the inherent durability of the material. As previously discussed, the weakening coefficient Kf for CCBW-10 in the Acid W group is recorded at 91.75%, which is significantly lower than those of 97.04% in the Alkaline W group and 98.08% in the Mine W group.
In the Alkaline W group (KOH), it can be observed that CCBW-10 forms a denser gel, known as C-A-S-H, after immersion. This phenomenon occurs due to the low alkalinity condition (0.1 mol/L), which enhances reactivity and facilitates the binding of Ca2+ to the tetrahedral structures [SiO(OH)3]− and [Al(OH)4]−, as illustrated in eq 12.37 The resultant C-A-S-H gel is a critical component contributing to the durability of cement-based materials.65 It facilitates the establishment of an enhanced bridge effect within the material, enabling mutual support and bonding to create a three-dimensional network structure, thereby augmenting the overall strength of the composite.
Simultaneously, a greater quantity of loose paste colloid—ASR gel—was observed on the surface of the sample and within the interstices of the fly ash. The alkali metal ions M+ (specifically Na+ and K+) present in the solution adsorb onto the surfaces of active silica particles within the fly ash, disrupting Si–O bonds and reorganizing structures to produce ASR gel,66 as shown in eq 13. The participation of Na in this process elucidates why the leaching amount of Na in the Alkaline W group is 10.70%, lower than that observed in the Acid W group. ASR gel exhibits significant expansibility. Generally, its expansion primarily results from osmotic pressure and crystallization pressure. However, no crystalline phase of the ASR gel has been detected in the XRD patterns, indicating that crystallization has not commenced during short-term immersion processes. Consequently, its expansion can be attributed mainly to the osmotic pressure induced by water absorption. Due to a high concentration of ions within the gel (including alkali metal ions such as Na+ and K+), water molecules will continue to diffuse into it. As water absorption persists, there will be a gradual increase in gel volume, leading to specimen cracking.59 Additionally, it should be noted that under these pH conditions—after CO2 dissolves in water—the solution predominantly contains CO32–, which facilitates further formation of CaCO3 crystal clusters.67Figure 15b-3 illustrates CaCO3 clusters extruded by ASR gel following its absorption of water and subsequent expansion.
Furthermore, relevant literature indicates that the formation of CaCO3 contributes to the inhibition of ASR.68 Supporting this, experimental data reveal that the compressive strength of CCBW-10 after 28 days of curing is 2.95 MPa, representing a 22.41% increase compared to CCBW-0. This fundamentally elucidates why carbonation treatment enhances the durability of filling materials in alkaline environments. However, it is noteworthy that the alkaline environment facilitates the generation of additional C-A-S-H gels. This bridging effect reduces the erosive weakening impact of alkaline solutions on CCBW-10 when compared to that of acid solutions.
| 12 |
| 13 |
In comparison to the samples from other groups, the most pronounced distinction of the carbonated materials in the Mine W group is the presence of numerous dispersed white stains on their surfaces. These white stains are formed by suspended matter from mine water that settles on the surface. During coal mining, coal powder, rock particles, and other particulates also contain various ions, trace amounts of organic matter, and a significant population of bacteria. The properties of this adhered material are highly complex due to Brownian motion affecting these particles. Thus, it exhibits characteristics typical of both suspended and colloidal matter.69 The accumulation of such suspended matter significantly impedes ion exchange between the solution and the sample during the soaking processes. This phenomenon elucidates why leaching levels for Na, Al, and Si, as well as Ca adsorption in the Mine W group, are notably lower than those observed in all other groups. Generally speaking, such covered surfaces exhibit negative charge characteristics.70,71 As previously discussed in the mining area conditions part, mine water within this region predominantly contains cations such as K+, Na+, and Ca2+, alongside anions such as SO42– and HCO3–. Based on earlier elucidated CCBW erosion mechanisms identified in Acid W and Alkaline W groups, it becomes evident that mine water may exert a mitigating effect on CCBW—primarily through crystalline expansion damage inflicted upon gypsum by SO42–, along with moisture absorption-induced expansion damage resulting from the ASR triggered by alkaline environments. However, Figure 16 illustrates that negatively charged surfaces repel anions present in solution—including SO42–, OH–, and HCO3–—into deeper layers within material cracks. This process effectively mitigates potential erosive impacts posed by mine water on the samples. The integrity and density exhibited by CaCO3 clusters depicted in Figure 15c-3 further corroborate this protective mechanism. Consequently, the strength and durability attributes of CCBW within the Mine W group significantly surpass those found within Acid W and Alkaline W groups, as demonstrated in Section 4.1.
Figure 16.

Resistance of suspended matter in mine water to anion erosion (SO42–, OH–, and HCO3–).
Furthermore, it is evident that N-A-S-H gel with a slightly loose structure is regenerated on the surface of CCBW. This regeneration involves the transformation from C-A-S-H to N-A-S-H, primarily influenced by the elevated initial concentration of Na in mine water,56 as depicted ineq 14. The initial concentration of Na in mine water measures 669.76 mg/L, significantly surpassing that of other solution groups, which typically range between 50 and 60 mg/L. In contrast to C-A-S-H, Ca2+ can establish coordination bonds with oxygen atoms within the silica-oxygen tetrahedron. In N-A-S-H, Na+ ions are merely distributed within the pores of the silica–aluminate network for charge balance without forming any actual chemical bonds. Consequently, its strength is inferior to that of the three-dimensional gel network constructed by C-A-S-H.56 This phenomenon has led to an approximate 2% reduction in CCBW strength even after immersion in the mine water.
| 14 |
5. Conclusions
This study investigated the durability of solid backfilling based on CCBW under the erosive effects of mine water when used in filling engineering. The research examined CCBW with varying levels of CO2 absorption (ventilation durations of 0, 5, 10, and 30 min), while thoroughly simulating actual conditions encountered under mine through a controlled variable experiment. By manipulating parameters such as cation and ion types, we explored the water weakening behavior and mechanisms associated with short-term immersion in tap water, acid solutions, alkaline solutions, and weakly alkaline mine water. The overall findings are summarized as follows.
-
1.
The weakening effect of various contact solutions on carbonated materials is indeed present, with the overall weakening performance ranked as follows: Acid W > Alkaline W > Mine W > Tap W.
-
2.
Carbonated materials exhibit enhanced durability, with the average weakening coefficient of CCBW-5(10,30) over a 28-day period recorded at 94.76%, surpassing that of the noncarbonated sample CCBW-0, which stands at 92.44%. This improvement can be attributed to carbonation processes that yield increased amounts of CaCO3, thereby augmenting the strength of the aggregate. Furthermore, carbonated materials possess a lower Ca/Si ratio, facilitating the formation of C-A-S-H gel characterized by superior density and stability, which effectively mitigates ion erosion in solution.
-
3.
During the process of water-induced degradation, carbonated materials consistently exhibit leaching of Na, Al, and Si, alongside the adsorption of Ca. Notably, the quantities of these elements that were leached and adsorbed in the Mine W group were found to be minimal.
-
4.
The corrosion of CCBW by acid solutions is primarily manifested through the dissolution of CaCO3 crystals by H+ and the accelerated formation of expansive gypsum due to SO42–, which ultimately leads to initial densification, followed by cracking of the sample. Conversely, while alkaline solutions promote the formation and stability of gel structures, they also increase osmotic pressure during the ASR, causing the gel to absorb water and resulting in both expansion and cracking of the sample. However, under actual mine water conditions, C-A-S-H transforms into N-A-S-H with reduced strength due to elevated Na concentrations. Notably, suspended particles within the solution carry a negative charge. When these particles adhere to the surface of the sample, they significantly inhibit erosion from anions such as SO42– and OH–, thereby mitigating crystallization-induced expansion damage from gypsum and water absorption-related expansion damage stemming from the ASR. Consequently, this results in a Kf for the Mine W group reaching only 98.08%, markedly higher than 97.04% observed in the Alkaline W group and 91.75% in the Acid W group.
This study addresses the issue of the short-term stability of the carbonated material CCBW in engineering applications. However, it is crucial to emphasize that the long-term stability of this material must also be validated and addressed for CCBW to be effectively utilized in mining engineering practices. Given the variability of mine water, including acid mine water and high-salinity mine water, it is pertinent to explore whether CCBW can sustain its stability across these diverse types of mine water.
Acknowledgments
The authors appreciate the National Natural Science Foundation of China (Grant Numbers 52464015 and 52250410338), the Key Laboratory of Xinjiang Coal Resources Green Mining of Ministry of Education (Xinjiang Institute of Engineering, Grant Number, KLXGY-KA2403), the Key Laboratory of Mine Thermodynamic Disasters and Control of Ministry of Education (Liaoning Technical University, Grant Number JSK202208), the Foundation Research Funds of the Central Universities (Grant Number 2021ZDY0211), the Research and Engineering Demonstration of Low Cost Large Scale Purification and Cascade Utilization Technology for Mining Brackish Water in the Zhundong Region (Grant Number 2023B03009), and the China University of Mining and Technology Graduate Innovation Program (2024WLJCRCZL042) for financial support.
The authors declare no competing financial interest.
References
- Wang A.; Pan Y.; Zhao J.; Liu P.; Wang Y.; Chu Y.; Liu K.; Sun D. Research progress of resourceful and efficient utilization of coal gangue in the field of building materials. J. Build. Eng. 2025, 99, 111526 10.1016/j.jobe.2024.111526. [DOI] [Google Scholar]
- Chen K.; Lan R.; He T.; Heng P.; Xia J. Evaluation on reactivity of fly ash from different sources in alkali activated system-progressing environmentally construction through waste utilization. Constr. Build. Mater. 2024, 454, 139118 10.1016/j.conbuildmat.2024.139118. [DOI] [Google Scholar]
- Morseletto P. Restorative and regenerative: Exploring the concepts in the circular economy. J. Ind. Ecol. 2020, 24, 763–773. 10.1111/jiec.12987. [DOI] [Google Scholar]
- Liu W.; Teng L.; Rohani S.; Qin Z.; Zhao B.; Xu C. C.; Ren S.; Liu Q.; Liang B. CO2 mineral carbonation using industrial solid wastes: A review of recent developments. Chem. Eng. J. 2021, 416, 129093 10.1016/j.cej.2021.129093. [DOI] [Google Scholar]
- Hanson E.; Nwakile C.; Hammed V. O. Carbon capture, utilization, and storage (CCUS) technologies: Evaluating the effectiveness of advanced CCUS solutions for reducing CO2 emissions. Results in Surfaces and Interfaces 2025, 18, 100381 10.1016/j.rsurfi.2024.100381. [DOI] [Google Scholar]
- Lackner K. S.; Wendt C. H.; Butt D. P.; Joyce E. L.; Sharp D. H. Carbon dioxide disposal in carbonate minerals. Energy 1995, 20, 1153–1170. 10.1016/0360-5442(95)00071-N. [DOI] [Google Scholar]
- Kwak J. H.; Hu J. Z.; Hoyt D. W.; Sears J. A.; Wang C. M.; Rosso K. M.; Felmy A. R. Metal Carbonation of Forsterite in Supercritical CO2 and H2O Using Solid State 29Si, 13C NMR Spectroscopy. J. Phys. Chem. C 2010, 114, 4126–4134. 10.1021/jp1001308. [DOI] [Google Scholar]
- Mehdizadeh H.; Wu Y.; Mo K. H.; Ling T. Evaluation of carbonation conversion of recycled concrete fines using high-temperature CO2: Reaction kinetics and statistical method for parameters optimization. Journal of Environmental Chemical Engineering 2023, 11, 109796 10.1016/j.jece.2023.109796. [DOI] [Google Scholar]
- Huo Z.; Lu B.; Sun J. F.; Jiang R. Y.; Hou G. H.; Ji S. D.; Naguib H. M. Preparation of high flexural strength rankinite cement benefiting from formation of aragonite whisker during carbonation curing. J. Sustain. Cen.-Based Mater. 2024, 13, 738–753. 10.1080/21650373.2024.2302095. [DOI] [Google Scholar]
- Hernández-Rodríguez A.; Orlando A.; Montegrossi G.; Huet B.; Virgili G.; Vaselli O. Experimental analysis on the carbonation rate of Portland cement at room temperature and CO2 partial pressure from 1 to 51 bar. Cement and Concrete Composites 2021, 124, 104271 10.1016/j.cemconcomp.2021.104271. [DOI] [Google Scholar]
- Wang Z.; Zheng S.; Duan H.; Chen D.; Long M.; Li Y. Enhanced Carbonation of Free CaO in Basic Oxygen Furnace Slag Under High Temperature and Moderate Pressure and Its Kinetics. Jom 2024, 76, 3415–3426. 10.1007/s11837-024-06593-4. [DOI] [Google Scholar]
- Dubrovin D.; Sharonova O.; Dobrosmyslov S.; Anshits A.; Panarin I. Influence of different fractions of high-calcium fly ash on the density and strength of well Portland cement. Case Stud. Constr. Mater. 2023, 19, e02556 10.1016/j.cscm.2023.e02556. [DOI] [Google Scholar]
- Deng G.; Zhang N.; Liao W.; Ma H.; He Y.; Lu L.; Chi L. Pozzolanic reactivity of carbonated high-calcium fly ash: A mechanism study. Constr. Build. Mater. 2024, 446, 138015 10.1016/j.conbuildmat.2024.138015. [DOI] [Google Scholar]
- Wang M.; Chen D.; Wang H.; Gao W. A review on fly ash high-value synthesis utilization and its prospect. Green Energy and Resources 2024, 2, 100062 10.1016/j.gerr.2024.100062. [DOI] [Google Scholar]
- Ngo I.; Ma L.; Zhai J. T.; Wang Y. Y. Enhancing fly ash utilization in backfill materials treated with CO2 carbonation under ambient conditions. Int. J. Min. Sci. Technol. 2023, 33, 323–337. 10.1016/j.ijmst.2023.02.001. [DOI] [Google Scholar]
- Ma L.; Ghorbani Y.; Kongar-Syuryun C. B.; Khayrutdinov M. M.; Klyuev R. V.; Petenko A.; Brigida V. Dynamics of backfill compressive strength obtained from enrichment tails for the circular waste management. Resources, Conservation & Recycling Advances 2024, 23, 200224 10.1016/j.rcradv.2024.200224. [DOI] [Google Scholar]
- Zhao J.; Pan H.; Wang Z.; Duan J.; Wang P.; Wang F.; Leung C. K. Y. Bond durability of BFRP and GFRP bars in sulphoaluminate cement concrete under water immersion environment. Constr. Build. Mater. 2024, 432, 136521 10.1016/j.conbuildmat.2024.136521. [DOI] [Google Scholar]
- Wu Z.; Xu J.; Fan H.; Li L.; Ji Y.; Wang S. Experimental study on dry-wet durability and water stability properties of fiber-reinforced and geopolymer-stabilized loess. Constr. Build. Mater. 2024, 418, 135379 10.1016/j.conbuildmat.2024.135379. [DOI] [Google Scholar]
- Dang V. Q.; Ogawa Y.; Bui P. T.; Kawai K. Effects of chloride ions on the durability and mechanical properties of sea sand concrete incorporating supplementary cementitious materials under an accelerated carbonation condition. Constr. Build. Mater. 2021, 274, 122016 10.1016/j.conbuildmat.2020.122016. [DOI] [Google Scholar]
- Yang Z.; Wang K.; Zhang D.; Zhang J.; Jiao Y.; Fang C.; Tang W.; Zhao Z. Durability of geopolymer cementitious materials synergistically stimulated by Ca2+ and Na+. Case Stud. Constr. Mater. 2024, 21, e03514 10.1016/j.cscm.2024.e03514. [DOI] [Google Scholar]
- Liu Y.; Wang B.; Fan Y.; Yu J.; Shi T.; Zhou Y.; Song Y.; Xu G.; Xiong C.; Zhou X. Effects of reactive MgO on durability and microstructure of cement-based materials: Considering carbonation and pH value. Constr. Build. Mater. 2024, 426, 136216 10.1016/j.conbuildmat.2024.136216. [DOI] [Google Scholar]
- Hai W.; Meiling T. Water resources protection of mining area in Toutun river basin of Tianshan Mountains: a case study of Liuhuanggou Coal Mine. Environ. Earth Sci. 2022, 81, 372. 10.1007/s12665-022-10495-6. [DOI] [Google Scholar]
- Wang Y.; Hu L.; Zhang Y.; Dong L. Experimental study on the scaling law of the heat exchange tube surface in the process of low-temperature single-effect distillation of high-mineralized mine water. Desalin. Water Treat. 2024, 319, 100571 10.1016/j.dwt.2024.100571. [DOI] [Google Scholar]
- Luo A.; Dong S.; Wang H.; Cao H.; Wang T.; Hu X.; Wang C.; Zhang S.; Qu S. Application of the Data-Driven Method and Hydrochemistry Analysis to Predict Groundwater Level Change Induced by the Mining Activities: A Case Study of Yili Coalfield in Xinjiang. Norwest China. Water 2024, 16, 1611. 10.3390/w16111611. [DOI] [Google Scholar]
- Li P.; Wu J.; Tian R.; He S.; He X.; Xue C.; Zhang K. Geochemistry, Hydraulic Connectivity and Quality Appraisal of Multilayered Groundwater in the Hongdunzi Coal Mine. Northwest China. Mine Water Environ. 2018, 37, 222–237. 10.1007/s10230-017-0507-8. [DOI] [Google Scholar]
- Wang S.; Tang H.; Shi L.; Liu J.; Yang Z.; Zhu H.; Xu F.; Zhu K.; Fan J.; Fang G. Hydrogeochemical analysis and assessment of mine water quality in Tangjiahui mining area, Inner Mongolia. China Environ. Earth Sci. 2022, 81, 49. 10.1007/s12665-022-10205-2. [DOI] [Google Scholar]
- Li Y.; Zhang X. Characterization of the health and irrigation risks and hydrochemical properties of groundwater: a case study of the Selian coal mine area, Ordos, Inner Mongolia. Appl. Water Sci. 2022, 12, 236. 10.1007/s13201-022-01762-9. [DOI] [Google Scholar]
- Zhao D.; Zeng Y.; Wu Q.; Du X.; Gao S.; Mei A.; Zhao H.; Zhang Z.; Zhang X. Source Discrimination of Mine Gushing Water Using Self-Organizing Feature Maps: A Case Study in Ningtiaota Coal Mine, Shaanxi. China. Sustainability 2022, 14, 6551. 10.3390/su14116551. [DOI] [Google Scholar]
- Ma Y.; Lu Y.; Li F.; Liu Y.; He J. Creation of comprehensive utilization alternatives for coal mine water based on multi-criteria decision analysis: A case study of the Mengcun coal mine. J. Water Process. Eng. 2025, 69, 106714 10.1016/j.jwpe.2024.106714. [DOI] [Google Scholar]
- Liu D.; Sun X. Analysis of Water Inrush Characteristics and Patterns in the Chenjiashan Coal Mine. Shaanxi Coal 2012, 31, 4–6. [Google Scholar]
- State Administration for Market Regulation. Standardization Administration. Test method of cement mortar strength (ISO method); GB/T 17671—2021; SAMP: Beijing, 2021. [Google Scholar]
- Ministry of Transport PRC . Testing Methods of Cement and Concrete for Highway Engineering; JTG 3420—2020; MTPRC: Beijing, 2020. [Google Scholar]
- Ministry of Housing and Urban-Rural Development PRC.. Standard for test methods of long-term performance and durability of ordinary concrete; GB/T 50082–2009; MHURD: Beijing, 2009. [Google Scholar]
- Belayneh G. B.; Kim N.; Seo J.; Kim H.; Park S.; Son H. M.; Park S. Effect of fly ash on hydration and carbonation of carbonation-cured Portland cements. J. CO2 Util. 2024, 88, 102943 10.1016/j.jcou.2024.102943. [DOI] [Google Scholar]
- Xu J.; Balhoff M. T. Novel regimes of calcium carbonate dissolution in micron-scale confined spaces. Adv. Water Resour. 2022, 164, 104200 10.1016/j.advwatres.2022.104200. [DOI] [Google Scholar]
- Freeman C. L.; Harding J. H. The transformation of amorphous calcium carbonate to calcite and classical nucleation theory. J. Cryst. Growth 2023, 603, 126978 10.1016/j.jcrysgro.2022.126978. [DOI] [Google Scholar]
- Wang T.; Medepalli S.; Zheng Y.; Zhang W.; Ishida T.; Bishnoi S.; Hou D.; Shi Z. Retardation effect of the pozzolanic reaction of low-calcium supplementary cementitious materials on clinker hydration at later age: Effects of pore solution, foreign ions, and pH. Cem. Concr. Res. 2024, 177, 107416 10.1016/j.cemconres.2023.107416. [DOI] [Google Scholar]
- Haas J.; Nonat A. From C–S–H to C–A–S–H: Experimental study and thermodynamic modelling. Cem. Concr. Res. 2015, 68, 124–138. 10.1016/j.cemconres.2014.10.020. [DOI] [Google Scholar]
- Ye S.; Feng P.; Liu Y.; Liu J.; Bullard J. W. Dissolution and early hydration of tricalcium aluminate in aqueous sulfate solutions. Cem. Concr. Res. 2020, 137, 106191 10.1016/j.cemconres.2020.106191. [DOI] [Google Scholar]
- Wang B.; Cheng H.; Liu X.; Di Z.; Song H.; Zhang D.; Cheng F.. CO2 Mineralized Full Solid Waste Cementitious Material for Coal Mine Goaf Filling and Carbon Sequestration Potential Assessment. Engineering 2025. [Google Scholar]
- Ye J.; Fang J.; Sun Y.; Shi X.; Chen G.; Ma T.; Zhi X. CO2 mineralization of cement-based materials by accelerated CO2 mineralization and its mineralization degree: A review. Constr. Build. Mater. 2024, 444, 137712 10.1016/j.conbuildmat.2024.137712. [DOI] [Google Scholar]
- Zimoch I.; Parafiński J.; Filipek B. Analysis of the impact of domestic distribution systems on the dynamics of changes in tap water quality as a necessary element of risk management in the Warsaw Water Supply System - a case study. Poland. Desalin. Water Treat. 2023, 315, 205–219. 10.5004/dwt.2023.30127. [DOI] [Google Scholar]
- Chowdhury N.; Ghasemi-Fare O. Quantitative investigation of temperature-dependent bound water degeneration in bentonite clays. Eng. Geol. 2024, 342, 107737 10.1016/j.enggeo.2024.107737. [DOI] [Google Scholar]
- Wang H.; Long G.; Tang Z.; Xie Y.; Ma G.; Tang C.; Liu S.; Ren X. The volume stability of cement-based materials under different extreme environments in the plateau: Experimental evolution. J. Build. Eng. 2022, 62, 105370 10.1016/j.jobe.2022.105370. [DOI] [Google Scholar]
- Zou D.; Zhang M.; Qin S.; Zhang X.; Liu T. Mechanistic insights into two-stage expansion of concrete under external sulfate attack. Constr. Build. Mater. 2024, 446, 138027 10.1016/j.conbuildmat.2024.138027. [DOI] [Google Scholar]
- Zhang J.; Zhang Y.; Marani A.; Zhang L. A new understanding of the alkali-silica reaction expansion in concrete using a hybrid ensemble model. J. Build. Eng. 2024, 96, 110523 10.1016/j.jobe.2024.110523. [DOI] [Google Scholar]
- Yu S.; He J.; Sang G.; Yang S.; Liu G. Study on hydration process of alkali-activated slag cement activated by weakly alkaline components. Constr. Build. Mater. 2024, 413, 134716 10.1016/j.conbuildmat.2023.134716. [DOI] [Google Scholar]
- Wu J.; Wong H. S.; Zhang H.; Yin Q.; Jing H.; Ma D. Improvement of cemented rockfill by premixing low-alkalinity activator and fly ash for recycling gangue and partially replacing cement. Cement and Concrete Composites 2024, 145, 105345 10.1016/j.cemconcomp.2023.105345. [DOI] [Google Scholar]
- Kanchanason V.; Plank J. Role of pH on the structure, composition and morphology of C-S-H–PCE nanocomposites and their effect on early strength development of Portland cement. Cem. Concr. Res. 2017, 102, 90–98. 10.1016/j.cemconres.2017.09.002. [DOI] [Google Scholar]
- Zhang H.; Liu T.; Cui Y.; Wang W.; Yang X.; Huang X. Strength deterioration and damage mechanism of grout-reinforced fractured sandstone under the coupled effects of acidic erosion and freeze-thaw cycles. Constr. Build. Mater. 2024, 443, 137761 10.1016/j.conbuildmat.2024.137761. [DOI] [Google Scholar]
- Ngo I.; Ma L.; Zhai J.; Wang Y.; Wei T. Durability of CO2-fly ash-based backfill materials in cation water deterioration. Int. J. Min. Reclam. Environ. 2023, 37, 544–567. 10.1080/17480930.2023.2216498. [DOI] [Google Scholar]
- Ngo I.; Ma L.; Zhai J.; Wang Y.; Xu Y.; Wei T.; Yu K. Effect of the co-activation of sodium silicate and CO2 on setting and mechanical properties of coal gangue-fly ash backfill (CGFB). Environ. Earth Sci. 2023, 82, 190. 10.1007/s12665-023-10863-w. [DOI] [Google Scholar]
- Yu J.; Wang K.; Yang P.; Li M.; Dong B.; Jin Z.; Hong S.; Ma H. Simulation of calcium carbonate nucleation processes in confined C-S-H nanopores with different calcium-silicon ratios. Constr. Build. Mater. 2024, 438, 137157 10.1016/j.conbuildmat.2024.137157. [DOI] [Google Scholar]
- Sánchez-Mendieta C.; Galán-Díaz J. J.; Martinez-Lage I. Relationships between density, porosity, compressive strength and permeability in porous concretes: Optimization of properties through control of the water-cement ratio and aggregate type. J. Build. Eng. 2024, 97, 110858 10.1016/j.jobe.2024.110858. [DOI] [Google Scholar]
- Kapeluszna E.; Kotwica A.; Różycka A.; Gołek A. Incorporation of Al in C-A-S-H gels with various Ca/Si and Al/Si ratio: Microstructural and structural characteristics with DTA/TG, XRD, FTIR and TEM analysis. Constr. Build. Mater. 2017, 155, 643–653. 10.1016/j.conbuildmat.2017.08.091. [DOI] [Google Scholar]
- Wang Y.; Cao Y.; Zhang Z.; Zhang P.; Ma Y.; Wang A.; Wang H. Intrinsic sulfuric acid resistance of C-(N)-A-S-H and N-A-S-H gels produced by alkali-activation of synthetic calcium aluminosilicate precursors. Cem. Concr. Res. 2023, 165, 107068 10.1016/j.cemconres.2022.107068. [DOI] [Google Scholar]
- Ngo I.; Ma L.; Zhai J.; Wang Y.; Wei T.; Ni Y. Experimental Investigation of CO2-Induced Silica Gel as the Water Blocking Grout Effect of Aquifer Ions. ACS Omega 2022, 7, 27090–27101. 10.1021/acsomega.2c00019. [DOI] [PMC free article] [PubMed] [Google Scholar]
- Li Y.; Yao N.; Ye Y.; Wu M.; Chen G.; Guan W. Leaching toxicity and deformation failure characteristics of phosphogypsum-based cemented paste backfill under chemical solution erosion. Environmental Science and Pollution Research International 2023, 30, 92451–92468. 10.1007/s11356-023-28707-2. [DOI] [PubMed] [Google Scholar]
- Sinha A.; Wei J. Influences of composition and reaction conditions on molecular structure, hygroscopicity, and swelling behavior of alkali-silica reaction gels. Cement and Concrete Composites 2024, 150, 105537 10.1016/j.cemconcomp.2024.105537. [DOI] [Google Scholar]
- Jennings H. M. Refinements to colloid model of C-S-H in cement: CM-II. Cem. Concr. Res. 2008, 38, 275–289. 10.1016/j.cemconres.2007.10.006. [DOI] [Google Scholar]
- Wang J.; Hu Z.; Chen Y.; Huang J.; Ma Y.; Zhu W.; Liu J. Effect of Ca/Si and Al/Si on micromechanical properties of C(-A)-S-H. Cem. Concr. Res. 2022, 157, 106811 10.1016/j.cemconres.2022.106811. [DOI] [Google Scholar]
- Yang M.; Zheng Y.; Li X.; Yang X.; Rao F.; Zhong L. Durability of alkali-activated materials with different C–S–H and N-A-S-H gels in acid and alkaline environment. Journal of Materials Research and Technology 2022, 16, 619–630. 10.1016/j.jmrt.2021.12.031. [DOI] [Google Scholar]
- He S.; Zhao H.; Tontiwachwuthikul P.; Qiu Y.; Luo S.; Xia X. Investigation on corrosion behavior and mechanism of carbon steel under CaCO3 deposit in CO2-flooding environment. Int. J. Greenh. Gas Control 2022, 121, 103799 10.1016/j.ijggc.2022.103799. [DOI] [Google Scholar]
- Xu G. Z.; Fan K. G.; Wang K.; Ning J. G. Paste Backfill Corrosion Mechanisms in Chloride and Sulfate Environments. Minerals 2022, 12, 551. 10.3390/min12050551. [DOI] [Google Scholar]
- Puertas F.; Palacios M.; Manzano H.; Dolado J. S.; Rico A.; Rodríguez J. A model for the C-A-S-H gel formed in alkali-activated slag cements. J. Eur. Ceram. Soc. 2011, 31, 2043–2056. 10.1016/j.jeurceramsoc.2011.04.036. [DOI] [Google Scholar]
- Hasar U. C.; Ozturk H.; Korkmaz H.; Tasdemir A.; Bute M.; Nis A.; Karaaslan M.; Cevik A.; Ozkaya M. A. Detection and quantification of alkali-silica-reaction (ASR) gel in cement-based mortars using microwave spectral and temporal transmission properties. Measurement 2023, 214, 112800 10.1016/j.measurement.2023.112800. [DOI] [Google Scholar]
- Chen Z. X.; Zhang N. T.; Chu S. H. Role of alkalinity in CO2 sequestration of γ-belite. Constr. Build. Mater. 2024, 432, 136508 10.1016/j.conbuildmat.2024.136508. [DOI] [Google Scholar]
- Bu S.; Zheng Y.; Lu C.; Cheng L. Efficient inhibition of ASR by microbially induced calcium carbonate precipitation on aggregates at a low degree of saturation. J. Build. Eng. 2024, 84, 108516 10.1016/j.jobe.2024.108516. [DOI] [Google Scholar]
- Zelano I.; Sivry Y.; Quantin C.; Gélabert A.; Tharaud M.; Jouvin D.; Montarges-Pelletier E.; Garnier J.; Pichon R.; Nowak S.; et al. Colloids and suspended particulate matters influence on Ni availability in surface waters of impacted ultramafic systems in Brazil. Colloids and Surfaces a: Physicochemical and Engineering Aspects 2013, 435, 36–47. 10.1016/j.colsurfa.2013.02.051. [DOI] [Google Scholar]
- Sun Y.; Chen G.; Xu Z.; Yuan X.; Zhang Y.; Zhou L.; Wang X.; Zhang C.; Zheng J. Research progress of water environment, treatment and utilization in coal mining areas of China. J. China Coal Soc. 2020, 45, 304–316. 10.13225/j.cnki.jccs.YG19.1654. [DOI] [Google Scholar]
- Filella M.; Chanudet V.; Philippo S.; Quentel F. Particle size and mineralogical composition of inorganic colloids in waters draining the adit of an abandoned mine, Goesdorf. Luxembourg. Appl. Geochem. 2009, 24, 52–61. 10.1016/j.apgeochem.2008.11.010. [DOI] [Google Scholar]