

Abstract
Purpose
To evaluate machine learning–based survival model roles in predicting rehospitalization after hip fractures to improve reduce the burden on the healthcare system.
Methods
This retrospective cohort study examined 718 patients with hip fractures hospitalized at the Daejeon Eulji Medical Center between January 2020 and June 2022. Demographic and clinical variables, and rehospitalization data were collected at 6 weeks and 3, 6, 12, and 24 months. Cox proportional hazards (CoxPH), random survival forest (RSF), gradient boosting (GB), and fast survival support vector machine (SVM) models were developed.
Model performance was assessed using the concordance index (c-index), area under the curve (AUC), and Kaplan–Meier survival curves. Feature importance was analyzed using permutation importance, with the best model selected based on overall performance.
Results
Hyperparameter tuning optimized the models. The GB model had the highest mean AUC of 0.868, followed by the RSF (0.785), SVM (0.763), and CoxPH (0.736) models. Feature importance analysis highlighted femoral neck T-score, age, body mass index, operation time, compression fracture, and total calcium as significant predictors. Feature selection improved the c-index for the RSF model from 0.742 to 0.874 and CoxPH model from 0.717 to 0.915; the GB and SVM models exhibited a c-index decline post-feature selection. The GB and RSF models predicted lower rehospitalization probabilities than Kaplan–Meier estimates; the CoxPH model’s predictions were closely aligned with the observed data.
Conclusions
The effect of feature selection on model performance highlights the need for comprehensive variable selection and model evaluation strategies to improve predictive accuracy.
Supplementary Information
The online version contains supplementary material available at 10.1186/s12891-025-08710-z
Keywords: Hip fracture, Rehospitalization, Machine learning, Survival analysis, Gradient boosting, Cox proportional hazards, Random survival forest, Support vector machines, Feature importance, Predictive modeling
Introduction
Hip fractures in older adults present significant challenges for healthcare systems by increasing morbidity, mortality, and rehospitalization rates. With the aging global population, the incidence of hip fractures is increasing, placing additional pressure on healthcare resources. Rehospitalization not only hinders patient recovery but also strains the financial sustainability of healthcare systems, underscoring the need for accurate predictive models to guide targeted interventions [1, 2]. Therefore, finding out features affecting rehabilitation rate and modeling prediction is important.
Traditional prognostic methods for predicting rehabilitation rate, while important, often lack the complexity to accurately predict rehospitalization risks owing to limitations in handling censored data and dynamic risk factors [3]. In contrast, machine learning (ML)–based survival models, such as gradient boosting (GB), fast survival support vector machines (SVM), random survival forest (RSF), and Cox proportional hazards (CoxPH), manage censored data and provide precise time-to-event predictions. These models offer a deeper understanding of rehospitalization risks and enhance their clinical relevance [4–6].
There are few strengths for using ML models over deep learning. First, deep learning models typically require large-scale datasets to avoid overfitting, particularly in high-dimensional low-sample-size (HDLSS) settings common in clinical research. Training deep networks with HDLSS data often leads to unstable gradient estimates and model overfitting, necessitating additional feature selection or dimensionality reduction techniques, which can undermine the original motivation of using deep models [7]. Furthermore, deep neural networks, especially fully connected architectures, lack transparency and make it difficult to interpret individual predictor contributions—an important limitation in survival analysis where identifying key prognostic factors is as critical as risk prediction. In contrast, CoxPH and RSF provide interpretable outputs, and GB and SVM models offer stable performance with limited data and clearer variable importance. Given the moderate sample size and the need for clinically interpretable models, traditional survival modeling methods were more suitable for this study's objectives [8].
This study aimed to compare the effectiveness of these advanced ML models in predicting rehospitalization of older hip fracture patients. By identifying the key factors contributing to rehospitalization, the goal was to develop predictive protocols that can improve patient outcomes and reduce the strain of recurrent hospitalizations on the healthcare system. This will not only enhance patient outcomes but also alleviate the broader economic and operational strain imposed on healthcare systems by recurrent hospitalizations [9]. This represents a pivotal step forward in improving care for older patients with hip fractures and provides a blueprint for enhancing the efficacy of healthcare delivery in the face of an aging population.
Methods
Study Design and Participants
This retrospective cohort study was conducted at the Daejeon Eulji Medical Center, South Korea, focusing on patients hospitalized for hip fractures between January 2020 and June 2022. In total, 1,046 patients were initially included in this study. Of the initial patients, 718 were included in the final analysis after excluding those with missing values in key clinical variables. Cohort data were collected every 6 weeks and 3, 6, 12, and 24 months. The follow-up intervals (6 weeks, 3, 6, 12, and 24 months) were selected based on common clinical milestones following hip fracture surgery. These time points align with periods of elevated risk for postoperative complications, re-fracture, and rehabilitation-related readmissions, as supported by previous studies[10]. Rehospitalization dates were also recorded to develop and validate a predictive model for the rehospitalization of hip fracture patients during 24 months using real-world data (Fig. 1).
Fig. 1.

Workflow of a Retrospective Cohort Study for Predicting Outcomes of Hip Fracture Patients
Data collection
Data collected included demographic information, clinical characteristics, and follow-up outcomes. The variables analyzed were sex; age; body mass index (BMI); blood urea nitrogen (BUN); fracture type; concomitant fracture; history of hip fracture; American Society of Anesthesiologists (ASA) score; number of compression fractures; total calcium; type of surgery; lumbar spine/T-score; femoral neck/T-score; post-surgery osteoporosis treatment; and presence of disorders such as neuropsychiatric, cardiovascular, endocrine, respiratory, renal, ophthalmic, spinal, gastrointestinal, hematologic, and connective tissue [11–25].
Data synthesis and preprocessing
To augment the dataset and generate robust predictive models while ensuring patient data privacy, a synthetic dataset was generated based on the original cohort data. This synthetic dataset replicates the statistical properties of the original dataset without representing real patients. To assess the synthetic data’s validity, we compared key variable distributions between the original and synthetic datasets using the Kolmogorov–Smirnov (KS) test and histogram overlays. BMI, femoral neck T-score, and lumbar spine T-score showed no significant differences (p > 0.7), indicating high similarity. However, the KS test revealed a significant difference in age distribution (Supplementary Figure S1 and Supplementary Table S1). Continuous variables such as age, BMI, BUN, total calcium, operation time, lumbar spine T-score, and femoral neck T-score were normalized using minimum–maximum scaling. Categorical variables such as sex, fracture type, ASA score, and presence of disorders were encoded using standard scaling techniques.
Survival analysis
Survival analysis was conducted to estimate the duration between hip fracture and rehospitalization [10]. Cohort data were collected every 6 weeks and at 3, 6, 12, and 24 months. The duration from discharge to rehospitalization was defined as the event period. If rehospitalization did not occur, the duration was considered as the period until the end of the study.
Model development
The dataset was randomly divided into training (80%) and test (20%) sets. We employed the following ML models to develop a predictive model: CoxPH, RSF, GB, and fast survival SVM. Hyperparameter tuning was conducted using three-fold cross-validation with 50 repetitions on the training set to ensure robust performance estimates and minimize overfitting [26].
CoxPH: A widely used semiparametric model that estimates the effect of variables on the risk of an event without specifying the baseline hazard function. This is particularly useful when evaluating the impact of covariates on survival outcomes [27–29].
RSF: An ensemble method tailored for survival data that builds multiple decision trees using bootstrapped samples and random subsets of variables. It is suitable for right-censored data and captures complex variable interactions to improve survival predictions [30, 31].
GB: As a powerful tool for predicting survival, this method extends gradient boosting for time-to-event data by sequentially constructing decision trees that minimize prediction errors, effectively capturing non-linear relationships [32, 33].
Fast survival SVM: This model applies SVM principles to survival data, optimizing a hyperplane that separates data based on survival times while accounting for censored observations. It is particularly useful for high-dimensional datasets [34].
Model selection and performance evaluation with statistical analysis
Model selection was based on multiple performance metrics, including the concordance index (C-index), area under the curve (AUC), and predicted survival curves compared with the Kaplan–Meier (KM) survival curve. Statistical analyses were conducted using the scikit-survival and scikit-learn libraries. The optimal model was selected based on the highest cumulative performance of metrics. In addition to conventional survival metrics such as AUC and c-index, we also evaluated each model’s binary classification performance at a 12-month threshold using confusion matrices, sensitivity, specificity, precision, and F1-score.
Explainability and feature importance
To enhance interpretability, explainability was addressed using permutation importance [35], which identified the contribution of each feature to the model’s predictive performance. This approach highlights the most influential factors in predicting rehospitalization. For the GB model, feature importance was also measured.
Ethics committee approval statement
This study was reviewed and approved by the Daejeon Eulji Medical Center Institutional Review Board (IRB number: EMC IRB 2023–01–015–003) and adheres to the tenets of the Declaration of Helsinki. Written informed consent was obtained from all subjects before being included.
Results
Study flow and cohort data
Data from 1,046 patients were initially collected, including 25 features. Based on correlation coefficients, features > 0.6 were excluded to reduce multicollinearity and improve model stability, and after excluding highly correlated variables (r > 0.6) and those with excessive missing values, 19 variables were retained (Fig. 2). A threshold of 0.6 for the Pearson correlation coefficient was selected to identify moderate to strong multicollinearity, following recommendations in the literature [36]. Features were categorized as either continuous or categorical. The femoral neck T-score had the highest null count (n = 325) and was excluded, ultimately resulting in data from 718 patients for the model training. Although this exclusion was necessary to maintain data integrity, it may have introduced selection bias and reduced sample representativeness—a limitation addressed in the Discussion section.
Fig. 2.

Correlation Coefficients Among Selected Features
Descriptive statistics (mean, standard deviation, maximum, and minimum) for the continuous variables—age, BMI, BUN, compression fracture number, total calcium, operation time, lumbar spine-T-score, and femoral neck-T-score—are presented in Table 1. The demographic of 718 patients are followings: female sex (n = 502), a typical type of hip fracture (n = 686), no history of hip fracture (n = 659), and internal fixation surgery (n = 369) were the most common categorical features (Table 2). The presence of eight different disorder types was analyzed; cardiovascular disorders were most common (n = 494), whereas renal disorders were the rarest (n = 65) (for demographic of 1,046 patients see Supplementary Table S2, S3).
Table 1.
Descriptive statistics of the continuous variables
| Variables | Mean | Standard deviation | Minimum | Maximum |
|---|---|---|---|---|
| Age | 78.7200557 | 9.6608262 | 50 | 103 |
| BMI | 22.0647374 | 3.5281853 | 12.02 | 35.37 |
| BUN | 16.9574275 | 9.5637096 | 5 | 140 |
| Number of compression fracture | 0.2691218 | 0.4441329 | 0 | 6 |
| Total calcium | 9.14863509 | 4.3514252 | 0.1 | 92 |
| Operation time | 59.0334262 | 42.2271403 | 10 | 600 |
| Lumbar spine T-score | −2.3640961 | 1.8542567 | −18 | 5.8 |
| Femur neck T-score | −2.8720474 | 1.8795033 | −43 | 2.47 |
BMI body mass index; BUN blood urea nitrogen
Table 2.
Descriptive statistics of the categorical variables
| Variables | Total | |
|---|---|---|
| N | % | |
| Total (n = 718) | 718 | 100 |
| Sex | ||
| Male | 216 | 30.0 |
| Female | 502 | 70.0 |
| History of previous hip fracture | ||
| No | 659 | 91.8 |
| Yes | 59 | 8.2 |
| Fracture type | ||
| Typical | 686 | 95.5 |
| Atypical | 31 | 4.5 |
| Both | 1 | 0.0 |
| Surgery type | ||
| Internal fixation | 369 | 51.4 |
| Artificial joint | 349 | 48.6 |
| Neuro-psychiatric disorders | ||
| No | 439 | 61.1 |
| Yes | 279 | 38.9 |
| Cardiovascular disorders | ||
| No | 224 | 31.2 |
| Yes | 494 | 68.8 |
| Endocrine disorders | ||
| No | 409 | 57.0 |
| Yes | 309 | 43.0 |
| Respiratory disorders | ||
| No | 636 | 88.6 |
| Yes | 82 | 11.4 |
| Spinal disorders | ||
| No | 567 | 79.0 |
| Yes | 151 | 21.0 |
| Gastrointestinal disorders | ||
| No | 624 | 86.9 |
| Yes | 94 | 13.0 |
| Hematologic disorders | ||
| No | 621 | 86.5 |
| Yes | 97 | 13.5 |
| Renal disorders | ||
| No | 647 | 90.1 |
| Yes | 71 | 9.9 |
Hyperparameter tuning
Hyperparameter tuning was conducted to optimize ML models, and the results are presented in Table 3. This process involved adjusting various hyperparameters to enhance the performance of each model. The c-index, calculated as the mean of three-fold cross-validation with 50 repetitions, was used to evaluate model performance.
Table 3.
Results of hyperparameter tuning
| Model | Hyperparameter | Optimal value |
|---|---|---|
| Gradient Boosting | learning rate | 0.1 |
| max_depth | 2 | |
| min_sample leaf | 5 | |
| RSF | max_depth | 2 |
| min_sample leaf | 10 | |
| min_sample split | 10 | |
| CoxPH | alpha | 256 |
| Fast Survival SVM | alpha | 0.00024414 |
RSF random survival forest, CoxPH Cox proportional hazards; SVM fast survival support vector machine
For the GB model, the optimal values were a learning rate of 0.1, maximum depth of 2, and minimum sample per leaf of 5. For the RSF model, the optimal parameters were a maximum depth of 2, minimum samples per leaf of 10, and minimum samples per split of 10. The CoxPH model was optimized with an alpha value of 256, whereas the Fast Survival SVM model was tuned with an alpha value of 0.00024414. The optimal values were determined to maximize the predictive performance of each model (Table 3).
Time-dependent AUC for Different Models
The models were evaluated based on their cumulative AUC over a 472-day period, providing insight into their time-dependent accuracy in predicting outcomes. Figure 3 shows the cumulative AUC of each model. The GB model consistently outperformed the other models with a mean AUC of 0.868. It maintained a high AUC throughout the study period, demonstrating its reliability in predicting outcomes over time. The RSF model followed with a mean AUC of 0.785, showing steady performance, but with more fluctuations than the GB model. The Fast Survival SVM model, with a mean AUC of 0.763, showed a performance comparable with that of the RSF model but slightly lower, indicating its moderate predictive ability. In contrast, the CoxPH model had the lowest mean AUC of 0.736, with significant variability throughout the follow-up period, suggesting poor reliability in maintaining predictive accuracy over time as the other models (Fig. 3).
Fig. 3.

Cumulative AUC Comparison of Different Models Over Time. AUC, area under the curve
Mean Permutation Importance and SHAP values in Predictive Models
Feature importance analysis across the GB, RSF, and CoxPH models revealed significant insights into the predictors of patient outcomes. Notably, the femoral neck T-score consistently emerged as a key predictor across all models, highlighting its substantial influence on the predictive performance of these models (Fig. 4).
Fig. 4.
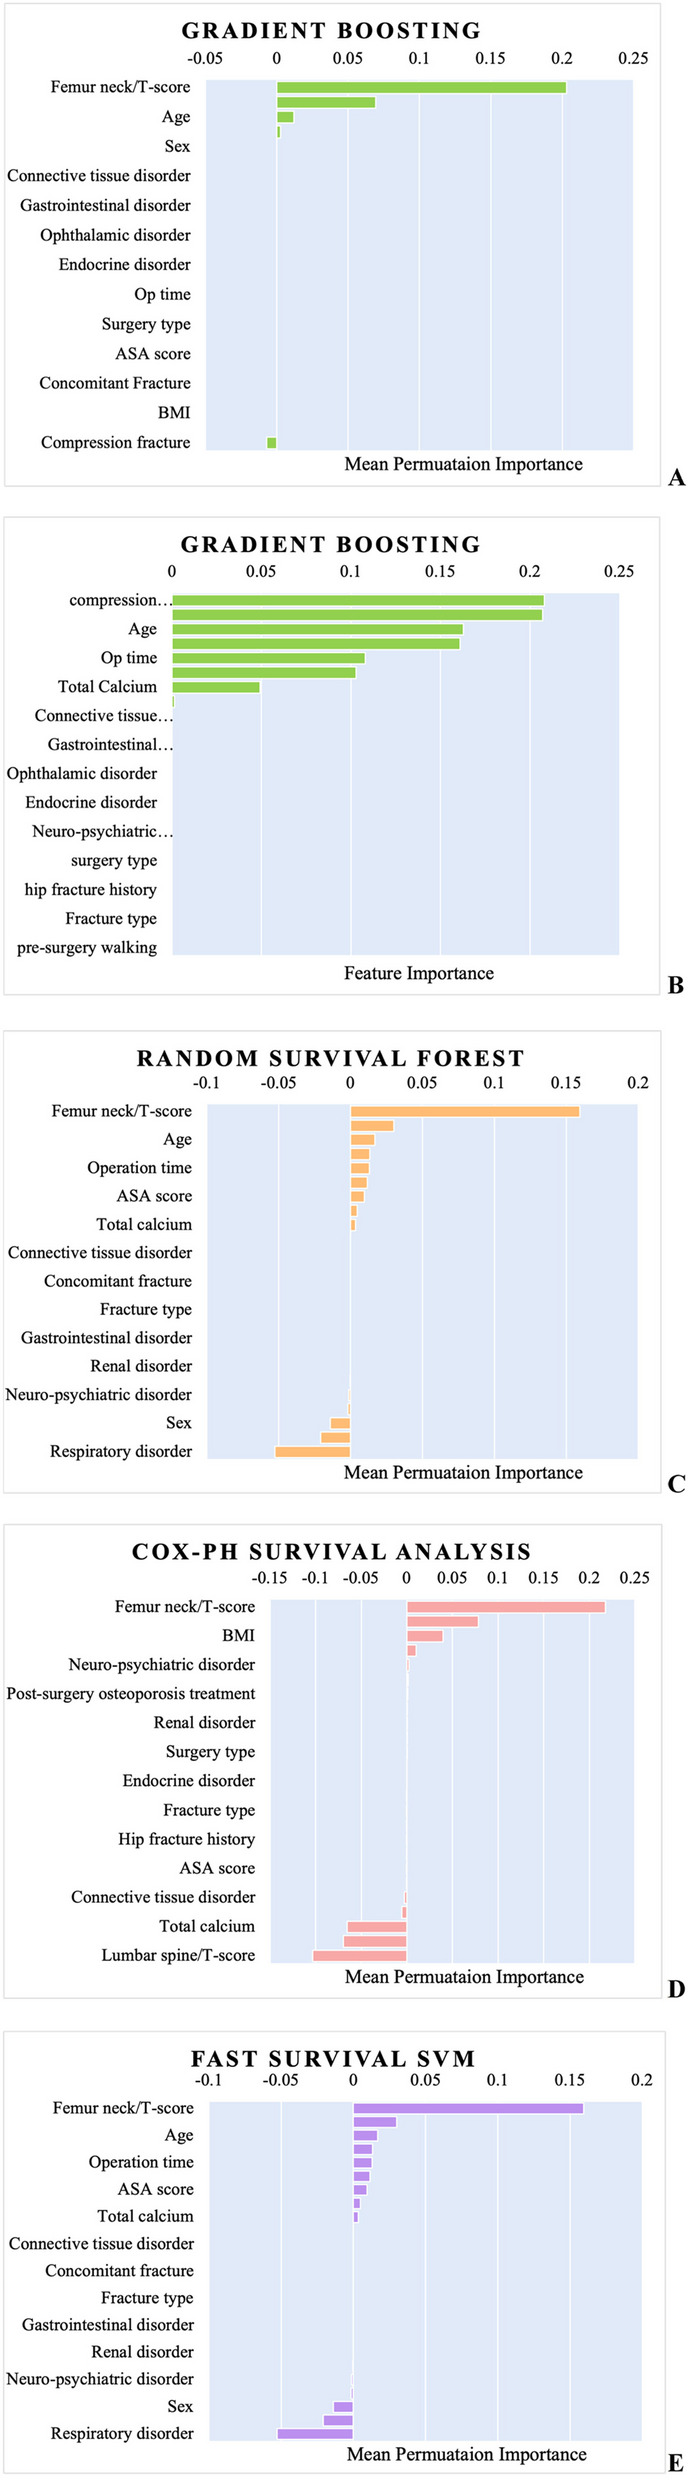
Feature Importance Comparisons Across Models (Gradient Boosting, Random Survival Forest, Cox Proportional Hazards) | A. Gradient Boosting: Mean Permutation Importance | B. Gradient Boosting: Direct Feature Importance | C. Random Survival Forest: Mean Permutation Importance | D. Cox Proportional Hazards: Mean Permutation Importance | E. Fast Survival Support Vector Machines (SVM): Mean Permutation Importance
The importance of other variables varied across the models; however, several features consistently demonstrated notable significance.
Age: This ranked high across multiple models, emphasizing its pivotal role in predicting patient outcomes.
BMI: Particularly significant in the CoxPH model, highlighting its relevance as a predictor. This finding aligns with existing literature that links BMI to various health outcomes [37].
Operation time: Highlighted in both the GB and RSF models, with the duration of the surgical procedure emerged as an important predictor of patient recovery and long-term outcomes [13].
Compression fracture: Notably significant in the GB model, where its presence is identified as a critical factor in patient prognosis.
Total calcium: Identified as important in both the GB and RSF models. Total calcium levels are relevant for predicting outcomes, likely because of their role in bone health and recovery [38].
Additional variables such as connective tissue disorder, neuro-psychiatric disorder, endocrine disorder, and surgery type also contributed to the predictive performance, although with varying degrees of importance across different models. To enhance interpretability beyond traditional permutation-based methods, we employed SHapley Additive exPlanations (SHAP) for the GB model. Figure 5 presents a SHAP summary plot, illustrating the magnitude and direction of each feature's contribution to model predictions across all patients. Among the top predictors, higher age and lower BMI values were associated with an increased risk of rehospitalization. Lower femoral neck T-scores, reflecting poorer bone density, also contributed strongly to higher predicted risk. The presence of hip fracture history showed a consistently positive influence on the prediction outcome, indicating higher risk when such history was present. Additionally, longer operative time and lower lumbar spine T-scores showed moderate but variable influence, whereas features such as pre-surgery walking ability and BUN levels had limited but directionally meaningful impact. Interestingly, higher total calcium levels were associated with increased rehospitalization risk in our SHAP analysis.
Fig. 5.

SHAP summary plot for the gradient boosting model
Model Performance with feature selection
Table 4 compares the C-index of each model when trained with the full set of features versus only those features with positive permutation importance. This analysis evaluated the impact of feature selection on model performance. For the GB model, the C-index decreased from 0.84277 to 0.67066 after feature selection, indicating a reduction in the predictive performance when only features with positive importance were used.
Table 4.
Cox index of each model trained before and after feature selection
| Model | Cox index (trained with full features) | Cox index (trained on only positive importance features) |
|---|---|---|
| Gradient Boosting | 0.84277 | 0.67066 |
| RSF | 0.74214 | 0.87421 |
| CoxPH | 0.71698 | 0.91509 |
| Fast Survival SVM | 0.77358 | 0.73899 |
RSF random survival forest; CoxPH Cox proportional hazards; SVM support vector machine
By contrast, the RSF model showed a significant improvement, with the C-index increasing from 0.74214 to 0.87421 after feature selection, suggesting better performance with a more focused feature set. The CoxPH survival analysis model also showed a substantial improvement, with the C-index increasing from 0.71698 to 0.91509 after feature selection. For the fast survival SVM model, the C-index decreased slightly from 0.77358 to 0.73899 after feature selection, reflecting a marginal reduction in the predictive performance (Table 4).
Survival curves
Figure 6 shows the KM curve in black as a reference, while the predicted survival curves from the GB, RSF, and CoxPH models are shown in red. The GB model predicted a lower probability of rehospitalization than the KM curve, particularly after the first 100 days. Similarly, the RSF model also predicted a lower risk, closely following the GB line until approximately 300 days, where it began to diverge. Conversely, the CoxPH model’s predictions closely aligned with the KM estimate, indicating a more conservative and accurate prediction.
Fig. 6.

Survival curve comparisons for rehospitalization prediction | A. Gradient Boosting | B. Random Survival Forest | C. Cox Proportional Hazards
Overall, the GB and RSF models showed lower rehospitalization probabilities than the KM estimate, with the GB model diverging earlier. However, the CoxPH model’s predictions remained closely aligned with the KM curve, reflecting a more conservative and accurate approach.
Binary classification evaluation
To further assess the clinical relevance of the models, we evaluated their predictive performance based on binary classification of 12-month rehospitalization using the average predicted survival probabilities at day 365. Based on each model's average, patients were classified as high risk for rehospitalization if their predicted survival probability at 365 days was below 0.875 for GB, 0.888 for RSF, or 0.916 for CoxPH.
Under this classification approach, all three models correctly identified all 34 actual rehospitalizations within 12 months (sensitivity = 1.00). However, precision and specificity varied owing to differences in false positive rates. The GB model yielded a specificity of 0.92 and a precision of 0.382, while the RSF achieved 0.931 and 0.420, respectively. The CoxPH model demonstrated the best overall performance, with a specificity of 0.962, precision of 0.567, and the highest F1-score of 0.723. (Table 5).
Table 5.
Performance comparison of survival models for 12-month rehospitalization prediction based on day-365 survival probabilities
| Model | TP | FP | TN | FN | Sensitivity | Specificity | Precision | F1-score |
|---|---|---|---|---|---|---|---|---|
| Gradient Boosting | 34 | 55 | 629 | 0 | 1.000 | 0.920 | 0.382 | 0.553 |
| RSF | 34 | 47 | 637 | 0 | 1.000 | 0.931 | 0.420 | 0.591 |
| CoxPH | 34 | 26 | 658 | 0 | 1.000 | 0.961 | 0.567 | 0.7223 |
RSF random survival forest; CoxPH Cox proportional hazards; TP true positive; FP false positive; TN true negative; FN false negative
These results highlight the trade-off between sensitivity and specificity when using survival probabilities for binary risk classification, with the CoxPH model providing more balanced predictive performance in this context.
Discussion
This study predicted the rehospitalization of patients with hip fracture using a dataset from 718 patients treated between January 2020 and June 2022. Although the KS test indicated a significant difference in age distribution between the original and synthetic datasets (p < 0.001), the reshaped distribution in the synthetic data resulted in a more binary-like structure. This transformation may have facilitated clearer decision boundaries in model training and improved classification performance. Thus, while the deviation in age distribution was statistically significant, it may have contributed positively to model generalization and robustness (Supplementary Figure S1 and Table S1) [39].
Our study focused on time-to-rehospitalization as a single clinical event, without separately modeling competing risks such as death. Therefore, we applied the standard survival analysis ML models, which are suitable for right-censored survival data involving a single type of event. While RSF can be extended to accommodate competing risks through the RSF for Competing Risks (RSFCR) framework, this approach is suitable only when distinct, mutually exclusive outcomes are explicitly modeled [40]. As our outcome of interest did not involve such competing events, the use of RSF was considered appropriate for this analysis [41].
Overall, the AUC and C-index indicated that the GB model was most effective in predicting outcomes, followed by the RSF and fast survival SVM models, with the CoxPH model showing the lowest performance. However, the GB model showed the most significant divergence when considering the survival curve of each model compared with the KM standard. The CoxPH model provided predictions closely aligned with the KM estimate, suggesting a more conservative prediction. Additionally, CoxPH had the highest specificity, precision, and F1 score for 12-month rehospitalization, indicating superior performance within a defined period. These differences in model performance evaluations based on different standards highlight the varying predictive capabilities and tendencies of each model, offering valuable insights into selecting appropriate models for time-dependent clinical predictions of rehospitalization risk [42].
The alignment of the C-index and AUC across ML models, despite differences in survival curves, can be explained as follows: Both the C-index and AUC measure a model’s ability to discriminate between higher- and lower-risk patients, focusing on the overall ranking across the dataset. However, the survival curves evaluate the model’s performance over time and assess its accuracy in predicting the timing of events. Therefore, a model with a high C-index or AUC may still misestimate survival if it does not accurately predict event timing. This contrast highlights the need for multiple evaluation metrics. While the C-index and AUC focus on risk discrimination, survival curves are crucial for time-based predictions. The choice of metrics depends on whether the priority is to identify high-risk patients or predict the timing of events [43, 44].
The permutation importance of each model suggests that the femoral neck T-score is a primary factor in rehospitalization prediction for patients with hip fracture. Low T-scores, indicative of osteoporosis, are associated with a higher risk of postsurgical complications such as nonunion, femoral head necrosis, and increased incidence of falls, all of which contribute to higher rates of rehospitalization. Studies have shown that patients with poor bone quality often experience prolonged recovery times and complications such as implant failure or surgical revision, which increases the likelihood of rehospitalization [45, 46]. Therefore, femoral neck T-score should be a primary consideration in managing patients with hip fracture, as it is a key predictor of both immediate post-surgical outcomes and long-term risk of rehospitalization. Moreover, the distribution of SHAP values highlights both the average importance of each variable and the heterogeneity of its impact across individual predictions. This analysis provides an interpretable, patient-level perspective on model behavior, supporting clinical insight and transparency in the predictive process.
Model features and clinical usage
However, several other features differed significantly. This result reflects the multifaceted nature of determining the most impactful predictors and underscores the necessity for a comprehensive approach to variable selection and model evaluation. Moreover, this study illustrated that feature selection can significantly affect the performance of survival analysis models. Notably, the CoxPH and RSF models showed considerable improvements in their predictive capabilities when trained on a refined set of features with positive importance. In contrast, the GB and Fast Survival SVM models exhibited decreased performance, highlighting the need for a comprehensive feature set to achieve optimal accuracy [36].
The GB and Fast Survival SVM models rely on the identification of complex patterns in the data, which makes them sensitive to feature selection. When relevant but subtle features are removed, these models struggle to capture intricate relationships, leading to poor performance. They generally perform better with a larger set of features, although some were less important. In contrast, simpler models, such as CoxPH and RSF, handle reduced feature sets better. CoxPH survival analysis benefits from fewer features by avoiding overfitting, whereas the RSF ensemble approach allows it to handle fewer or noisy features effectively. Thus, the decline in GB and Fast Survival SVM performance after feature selection likely stems from their dependence on capturing complex, high-dimensional interactions, whereas the CoxPH and RSF models thrive with a more streamlined input [29, 31, 33–35, 47].
From a clinical standpoint, the divergent performance of these models following feature selection has important implications in orthopedic care. For example, in high-volume tertiary hospitals managing older patients with hip fractures, comprehensive data such as femoral neck T-score, operative time, BMI, and preoperative mobility status are routinely collected and digitized. In these settings, complex models like GB can effectively utilize the diverse available information to detect nonlinear interactions—such as the compounded risk of early rehospitalization in patients with both low T-scores and prolonged surgery duration. These models are particularly valuable in developing personalized care plans or identifying patients who may benefit from early rehabilitation interventions or pharmacological optimization.
By contrast, in smaller orthopedic centers or during the early triage phase—where only basic demographic data (e.g., age, sex), fracture type, and ASA classification are readily accessible—simpler models like CoxPH or RSF provide more robust and interpretable predictions. For instance, those models may help quickly identify high-risk patients based on a small number of core features without relying on more granular lab. Moreover, these models are less prone to overfitting when used in limited-data environments, making them practical for real-time clinical decision-making in resource-constrained settings.
Thus, the selection of a survival model should be aligned with statistical performance and the clinical workflow and data infrastructure. GB may excel in feature-rich environments typical of academic centers, while CoxPH and RSF models offer resilience and interpretability in lower-resource orthopedic settings. This flexibility supports context-specific model deployment, ultimately enhancing the translational utility of predictive modeling in orthopedic care.
Features affecting rehospitalization rate
Low BMI has been linked to poorer outcomes in older patients with hip fracture. Underweight individuals (BMI < 18.5) experience significantly higher mortality after hip fracture surgery than those of normal weight, whereas overweight patients often fare better (an “obesity paradox”) [48]. Mechanistically, a low BMI often reflects frailty with poor nutritional reserves and sarcopenia. Individuals who are malnourished have diminished energy and protein stores to support healing, leading to muscle wasting (sarcopenia), impaired immunity, and reduced strength for rehabilitation [49]. Consistent with this finding, malnutrition in patients with hip fracture is associated with increased mortality and loss of independence, and low muscle mass has been shown to independently predict worse functional recovery and higher one-year mortality. Consequently, low BMI serves as an indicator of vulnerability that predisposes these patients to complications and rehospitalization, supporting its inclusion as a predictor in survival models [50].
Operation time (operative duration) emerged as one of the key predictors of rehospitalization in our analysis. Prolonged surgery often reflects greater surgical complexity, comorbid patient conditions, or intraoperative complications. These factors are known to increase the risk of postoperative complications such as surgical site infections, delirium, or cardiopulmonary events, all of which may lead to early readmission. Moreover, longer operation time can delay functional recovery and hinder participation in early rehabilitation, further increasing the risk of unfavorable outcomes [51]. This finding aligns with previous reports suggesting that extended surgical time is independently associated with higher rates of rehospitalization and adverse postoperative events in orthopedic patients. Longer surgeries may indicate more complex fractures or intraoperative difficulties, increasing the risk of infection, delayed healing, and rehospitalization [13].
In older patients with hip fracture, higher total calcium levels may reflect underlying hypercalcemia-causing disorders (such as primary hyperparathyroidism or occult malignancy) that predispose to complications and hinder recovery [52]. Hypercalcemia can induce multisystem disturbances—even mild elevations are associated with cognitive impairment, dehydration, and muscle weakness in older adults, while more severe hypercalcemia can trigger delirium and cardiac arrhythmias [53]. These effects (e.g., confusion, neuromuscular weakness, renal impairment) can significantly impede postoperative rehabilitation and increase the risk of medical complications, thereby raising the likelihood of rehospitalization. Hypercalcemia in this setting has also been associated with higher mortality rates [54]. Furthermore, hypercalcemia of malignancy often indicates advanced cancer and is itself linked to frequent hospital readmissions in this population. Overall, an elevated calcium level may serve as a marker for comorbid conditions—such as hyperparathyroidism, malignancy, dehydration, or other metabolic derangements—that contribute to poorer postoperative outcomes and higher rehospitalization rates.
Limitations and Strengths
This study has some limitations. First, its retrospective design may introduce bias owing to inconsistent data collection and patient selection. Missing data, particularly for key features such as the femoral neck T-score, reduced the sample size and the exclusion of cases with missing femoral neck T-scores may have introduced selection bias, potentially limiting the generalizability of our findings. However, we minimized it by testing KS scores and histogram analysis. Future work should consider imputation techniques to reduce data loss. Furthermore, the use of synthetic data raises concerns regarding model performance in real-world applications, as it may not fully replicate actual patient data. Its impact on the external validity of the model remains a limitation. The absence of validation using real-world external cohorts restricts the generalizability of the findings. Future research should aim to validate these models on external datasets and assess whether patterns learned from synthetic data hold true in different clinical settings. Second, the single-center nature of this study limits its external validity, as the findings may not be generalizable to other regions or healthcare systems. Moreover, detailed cause-of-rehospitalization data were not available for this retrospective cohort. Future research should involve a multicenter study that assesses the reasons for readmission and integrates them into the predictive model to enhance the generalizability of the findings. Third, more advanced models, such as deep learning–based techniques, were not explored, which could further enhance the prediction accuracy. ML models were more fitted to this type of prediction while deep-learning can decrease the prediction rate due to overfitting.
Future studies should focus on multicenter data, advanced imputation methods, and the incorporation of more sophisticated models for better generalization and accuracy. Furthermore, we acknowledge that calibration curves, decision curve analysis (DCA), and precision-recall (PR) curves were not included in this version of the study. Although this study provides a robust framework for predictive modeling in the context of rehospitalization among patients with hip fracture, we have identified this as a limitation and plan to explore these evaluation tools in future work to further strengthen the model’s applicability in clinical settings. Moreover, in future research, we emphasize the need for the use of advanced imputation strategies, such as multiple imputation, which can reduce potential bias and improve model robustness by addressing missing data more comprehensively. This method has been successfully applied in geriatric and orthopedic research to preserve statistical power, minimize selection bias, and maintain representativeness of vulnerable populations, particularly when key variables like femoral neck T-scores are frequently missing [55].
However, this study is among the first to demonstrate the clinical utility of survival-based ML models in the field of orthopedic surgery. Specifically, we applied these methods to predict the risk and timing of rehospitalization after hip fracture—an outcome of significant concern in aging populations. While survival analysis using ML has been widely applied in oncology and neurology, its adoption in orthopedics has been limited. Our findings provide strong predictive performance and practical, interpretable results that highlight key clinical risk factors, such as femoral neck T-score, operative time, and BMI. Identifying these modifiable predictors may support clinicians in tailoring perioperative management strategies to reduce preventable readmissions.
Beyond predictive accuracy, this study also serves as a methodological foundation for future research in orthopedic populations. To our knowledge, it is the first to demonstrate the feasibility, interpretability, and clinical utility of survival-based ML models in this setting. Consequently, it offers a reproducible framework for subsequent orthopedic studies to monitor long-term outcomes. By bridging the gap between advanced analytics and real-world surgical care, this study supports the broader integration of survival-based ML in orthopedics and highlights its potential to improve patient outcomes and optimize care pathways.
Conclusion
In conclusion, the results show that the GB model performs best in predicting rehospitalization risk, although further prospective validation is needed. However, the CoxPH model showed the closest alignment with KM survival curves, while the GB model diverged the most. This highlights the need for multiple metrics when assessing survival models, as AUC and C-index evaluate risk ranking, whereas survival curves focus on timing accuracy. The choice of the metric depends on whether the priority is risk differentiation or timing accuracy. This study also highlights the importance of factors such as femoral neck T-score, age, BMI, operation time, compression fractures, and total calcium in predicting rehospitalization.
Supplementary Information
Acknowledgements
Not applicable.
Authors' contributions
SHK and JO designed the work. YC acquired the data. JO analyzed data. SHK and JO Interpreted of data. JO wrote the original manuscript. All authors reviewed the manuscript.
Funding
This research was supported by a grant from the Patient-Centered Clinical Research Coordinating Center (PACEN) funded by the Ministry of Health & Welfare, Republic of Korea (grant number: HC23 C0042) and the Soonchunhyang University Research Fund. The funding source has no involvement.
Data availability
The datasets generated and/or analyzed during this study are not publicly available due to the presence of personal health information, but they are available from the corresponding author on reasonable request.
Declarations
Ethics approval and consent to participate
This study was reviewed and approved by the Daejeon Eulji Medical Center Institutional Review Board (IRB number: EMC IRB 2023–01–015–003) and adheres to the tenets of the Declaration of Helsinki. Written informed consent was obtained from all subjects before being included.
Consent for publication
This manuscript does not contain any individual identifiable information; therefore, consent for publication is not applicable.
Competing interests
The authors declare no competing interests.
Footnotes
"The original version of this article was revised: the author’s name Juahn Oh was incorrectly written as Juhan Oh."
Publisher's Note
Springer Nature remains neutral with regard to jurisdictional claims in published maps and institutional affiliations.
Change history
6/12/2025
The original version of this article was revised: the author’s name Juahn Oh was incorrectly written as Juhan Oh.
Change history
6/18/2025
A Correction to this paper has been published: 10.1186/s12891-025-08829-z
References
- 1.Magaziner J, Mangione KK, Orwig D, Baumgarten M, Magder L, Terrin M, Fortinsky RH, Gruber-Baldini AL, Beamer BA, Tosteson ANA, et al. Effect of a Multicomponent Home-Based Physical Therapy Intervention on Ambulation After Hip Fracture in Older Adults: The CAP Randomized Clinical Trial. JAMA. 2019;322(10):946–56. [DOI] [PMC free article] [PubMed] [Google Scholar]
- 2.Sheehan KJ, Sobolev B, Villán Villán YF, Guy P. Patient and system factors of time to surgery after hip fracture: a scoping review. BMJ Open. 2017;7(8): e016939. [DOI] [PMC free article] [PubMed] [Google Scholar]
- 3.Sabouri M, Rajabi AB, Hajianfar G, Gharibi O, Mohebi M, Avval AH, Naderi N, Shiri I. Machine learning based readmission and mortality prediction in heart failure patients. Sci Rep. 2023;13(1):18671. [DOI] [PMC free article] [PubMed] [Google Scholar]
- 4.Goldstein BA, Navar AM, Carter RE. Moving beyond regression techniques in cardiovascular risk prediction: applying machine learning to address analytic challenges. Eur Heart J. 2016;38(23):1805–14. [DOI] [PMC free article] [PubMed] [Google Scholar]
- 5.Wang P, Li Y, Reddy CK: Machine Learning for Survival Analysis: A Survey. ACM Comput Surv 2019, 51(6):Article 110.
- 6.Zhang Z, Beck MW, Winkler DA, Huang B, Sibanda W, Goyal H. AME Big-Data Clinical Trial Collaborative Group wobo: Opening the black box of neural networks: methods for interpreting neural network models in clinical applications. Annals of Translational Medicine. 2018;6(11):216. [DOI] [PMC free article] [PubMed] [Google Scholar]
- 7.Hao J, Kim Y, Mallavarapu T, Oh JH, Kang M. Interpretable deep neural network for cancer survival analysis by integrating genomic and clinical data. BMC Med Genomics. 2019;12(10):189. [DOI] [PMC free article] [PubMed] [Google Scholar]
- 8.Musto H, Stamate D, Logofătu D, Stahl D: Predicting Deterioration in Mild Cognitive Impairment with Survival Transformers, Extreme Gradient Boosting and Cox Proportional Hazard Modelling. In: International Conference on Artificial Neural Networks: 2024; 2024.
- 9.Chen Y-C, Chung J-H, Yeh Y-J, Lou S-J, Lin H-F, Lin C-H, Hsien H-H, Hung K-W, Yeh S-CJ, Shi H-Y: Predicting 30-Day Readmission for Stroke Using Machine Learning Algorithms: A Prospective Cohort Study. Frontiers in Neurology 2022, 13. [DOI] [PMC free article] [PubMed]
- 10.Lee T-C, Ho P-S, Lin H-T, Ho M-L, Huang H-T, Chang J-K. One-Year Readmission Risk and Mortality after Hip Fracture Surgery: A National Population-Based Study in Taiwan. Aging Dis. 2017;8(4):402–9. [DOI] [PMC free article] [PubMed] [Google Scholar]
- 11.Arcolin I, Godi M, Giardini M, Guglielmetti S, Corna S. Does the type of hip fracture affect functional recovery in elderly patients undergoing inpatient rehabilitation? Injury. 2021;52(8):2373–8. [DOI] [PubMed] [Google Scholar]
- 12.Ariie T, Yamamoto N, Tsutsumi Y, Nakao S, Saitsu A, Tsuge T, Tsuda H, Nakashima Y, Miura T, Bandai Y, et al. Association between a history of major osteoporotic fractures and subsequent hip fracture: a systematic review and meta-analysis. Arch Osteoporos. 2024;19(1):44. [DOI] [PubMed] [Google Scholar]
- 13.Barinaga G, Wright E, Cagle PJJ, Anoushiravani AA, Sayeed Z, Chambers MC, El-Othmani MM, Saleh KJ. Effect of Time of Operation on Hip Fracture Outcomes: A Retrospective Analysis. JAAOS - Journal of the American Academy of Orthopaedic Surgeons. 2017;25(1):55–60. [DOI] [PubMed] [Google Scholar]
- 14.Cianferotti L, Bifolco G, Caffarelli C, Mazziotti G, Migliaccio S, Napoli N, Ruggiero C, Cipriani C. Nutrition, Vitamin D, and Calcium in Elderly Patients before and after a Hip Fracture and Their Impact on the Musculoskeletal System: A Narrative Review. Nutrients. 2024;16(11):1773. [DOI] [PMC free article] [PubMed] [Google Scholar]
- 15.Colón-Emeric CS, Lyles KW, Su G, Pieper CF, Magaziner JS, Adachi JD, Bucci-Rechtweg CM, Haentjens P, Boonen S. for the HRFT: Clinical Risk Factors for Recurrent Fracture after Hip Fracture: A Prospective Study. Calcif Tissue Int. 2011;88(5):425–31. [DOI] [PubMed] [Google Scholar]
- 16.De Vincentis A, Behr AU, Bellelli G, Bravi M, Castaldo A, Cricelli C, Galluzzo L, Iolascon G, Maggi S, Martini E, et al. Management of hip fracture in the older people: rationale and design of the Italian consensus on the orthogeriatric co-management. Aging Clin Exp Res. 2020;32(7):1393–9. [DOI] [PubMed] [Google Scholar]
- 17.Di Monaco M, Castiglioni C, Vallero F, Di Monaco R, Tappero R. Concomitant Upper Limb Fractures and Short-Term Functional Recovery in Hip Fracture Patients: Does the Site of Upper Limb Injury Matter? Am J Phys Med Rehabil. 2015;94(5):366–72. [DOI] [PubMed] [Google Scholar]
- 18.Fox KM, Hawkes WG, Magaziner J, Zimmerman SI, Hebel JR. Markers of Failure to Thrive Among Older Hip Fracture Patients. J Am Geriatr Soc. 1996;44(4):371–6. [DOI] [PubMed] [Google Scholar]
- 19.Imai N, Endo N, Hoshino T, Suda K, Miyasaka D, Ito T. Mortality after hip fracture with vertebral compression fracture is poor. J Bone Miner Metab. 2016;34(1):51–4. [DOI] [PubMed] [Google Scholar]
- 20.Juby AG, De Geus-Wenceslau CM. Evaluation of Osteoporosis Treatment in Seniors after Hip Fracture. Osteoporos Int. 2002;13(3):205–10. [DOI] [PubMed] [Google Scholar]
- 21.Kirilov N, Vladeva S, Bischoff F, Batalov Z, Batalov A, Bischoff E. Effect of the body mass index, basal metabolic rate, and body fat on the radiofrequency echographic multi-spectrometry (REMS)-based bone mineral density and fracture risk: a cross-sectional study. Rheumatol Int. 2023;43(12):2271–9. [DOI] [PubMed] [Google Scholar]
- 22.Meyer AC, Eklund H, Hedström M, Modig K. The ASA score predicts infections, cardiovascular complications, and hospital readmissions after hip fracture - A nationwide cohort study. Osteoporos Int. 2021;32(11):2185–92. [DOI] [PMC free article] [PubMed] [Google Scholar]
- 23.Salpakoski A, Kallinen M, Kiviranta I, Alen M, Portegijs E, Jämsen E, Ylinen J, Rantanen T, Sipilä S. Type of surgery is associated with pain and walking difficulties among older people with previous hip fracture. Geriatr Gerontol Int. 2016;16(6):754–61. [DOI] [PubMed] [Google Scholar]
- 24.Shigemoto K, Sawaguchi T, Higashikawa T, Okuro M. Differences in age-related characteristics among elderly patients with hip fractures. J Orthop Sci. 2023;28(5):1131–5. [DOI] [PubMed] [Google Scholar]
- 25.Sterling RS: Gender and Race/Ethnicity Differences in Hip Fracture Incidence, Morbidity, Mortality, and Function. Clinical Orthopaedics and Related Research® 2011, 469(7):1913–1918. [DOI] [PMC free article] [PubMed]
- 26.Feurer M, Hutter F. Hyperparameter Optimization. In: Hutter F, Kotthoff L, Vanschoren J, editors. Automated Machine Learning: Methods, Systems. Challenges. Cham: Springer International Publishing; 2019. p. 3–33. [Google Scholar]
- 27.Breslow N. Covariance Analysis of Censored Survival Data. Biometrics. 1974;30(1):89–99. [PubMed] [Google Scholar]
- 28.Cox DR. Regression Models and Life-Tables. J Roy Stat Soc: Ser B (Methodol). 1972;34(2):187–202. [Google Scholar]
- 29.Efron B. The Efficiency of Cox’s Likelihood Function for Censored Data. J Am Stat Assoc. 1977;72(359):557–65. [Google Scholar]
- 30.Ishwaran H, Kogalur UB, Blackstone EH, Lauer MS: Random survival forests. The Annals of Applied Statistics 2008, 2(3):841–860, 820.
- 31.LeBlanc M, Crowley J. Survival Trees by Goodness of Split. J Am Stat Assoc. 1993;88(422):457–67. [Google Scholar]
- 32.Friedman JH. Stochastic gradient boosting. Comput Stat Data Anal. 2002;38(4):367–78. [Google Scholar]
- 33.Jerome HF. Greedy function approximation: A gradient boosting machine. Ann Stat. 2001;29(5):1189–232. [Google Scholar]
- 34.Pölsterl S, Navab N, Katouzian A: Fast Training of Support Vector Machines for Survival Analysis. In: Machine Learning and Knowledge Discovery in Databases: 2015// 2015; Cham: Springer International Publishing; 2015: 243–259.
- 35.Breiman L. Random Forests. Mach Learn. 2001;45(1):5–32. [Google Scholar]
- 36.Guyon I, Elisseeff A: An introduction to variable and feature selection. J Mach Learn Res 2003, 3(null):1157–1182.
- 37.Bhaskaran K, Dos-Santos-Silva I, Leon DA, Douglas IJ, Smeeth L. Association of BMI with overall and cause-specific mortality: a population-based cohort study of 3·6 million adults in the UK. Lancet Diabetes Endocrinol. 2018;6(12):944–53. [DOI] [PMC free article] [PubMed] [Google Scholar]
- 38.Kovacs CS. Maternal Mineral and Bone Metabolism During Pregnancy, Lactation, and Post-Weaning Recovery. Physiol Rev. 2016;96(2):449–547. [DOI] [PubMed] [Google Scholar]
- 39.Goncalves A, Ray P, Soper B, Stevens J, Coyle L, Sales AP. Generation and evaluation of synthetic patient data. BMC Med Res Methodol. 2020;20(1):108. [DOI] [PMC free article] [PubMed] [Google Scholar]
- 40.Ishwaran H, Gerds TA, Kogalur UB, Moore RD, Gange SJ, Lau BM. Random survival forests for competing risks. Biostatistics. 2014;15(4):757–73. [DOI] [PMC free article] [PubMed] [Google Scholar]
- 41.Kantidakis G, Putter H, Litière S, Fiocco M. Statistical models versus machine learning for competing risks: development and validation of prognostic models. BMC Med Res Methodol. 2023;23(1):51. [DOI] [PMC free article] [PubMed] [Google Scholar]
- 42.Mathew Biju S: Analyzing the predictive capacity of various machine learning algorithms. International Journal of Engineering and Technology(UAE) 2018, 7:266–270.
- 43.Hand DJ, Till RJ. A Simple Generalisation of the Area Under the ROC Curve for Multiple Class Classification Problems. Mach Learn. 2001;45(2):171–86. [Google Scholar]
- 44.Uno H, Cai T, Pencina MJ, D’Agostino RB, Wei LJ. On the C-statistics for evaluating overall adequacy of risk prediction procedures with censored survival data. Stat Med. 2011;30(10):1105–17. [DOI] [PMC free article] [PubMed] [Google Scholar]
- 45.Beaupre LA, Binder EF, Cameron ID, Jones CA, Orwig D, Sherrington C, Magaziner J. Maximising functional recovery following hip fracture in frail seniors. Best Pract Res Clin Rheumatol. 2013;27(6):771–88. [DOI] [PMC free article] [PubMed] [Google Scholar]
- 46.Dyer SM, Perracini MR, Smith T, Fairhall NJ, Cameron ID, Sherrington C, Crotty M: Rehabilitation Following Hip Fracture. In: Orthogeriatrics: The Management of Older Patients with Fragility Fractures. edn. Edited by Falaschi P, Marsh D. Cham (CH): Springer Copyright 2021, The Author(s). 2021: 183–222.
- 47.Kaliappan J, Srinivasan K, Mian Qaisar S, Sundararajan K, Chang C-Y, C S: Performance Evaluation of Regression Models for the Prediction of the COVID-19 Reproduction Rate. Frontiers in Public Health 2021, 9. [DOI] [PMC free article] [PubMed]
- 48.Yang TI, Chen YH, Chiang MH, Kuo YJ, Chen YP. Inverse relation of body weight with short-term and long-term mortality following hip fracture surgery: a meta-analysis. J Orthop Surg Res. 2022;17(1):249. [DOI] [PMC free article] [PubMed] [Google Scholar]
- 49.Millrose M, Schmidt W, Krickl J, Ittermann T, Ruether J, Bail HJ, Gesslein M: Influence of Malnutrition on Outcome after Hip Fractures in Older Patients. J Pers Med 2023, 13(1). [DOI] [PMC free article] [PubMed]
- 50.Iida H, Seki T, Sakai Y, Watanabe T, Wakao N, Matsui H, Imagama S. Low muscle mass affect hip fracture treatment outcomes in older individuals: a single-institution case-control study. BMC Musculoskelet Disord. 2021;22(1):259. [DOI] [PMC free article] [PubMed] [Google Scholar]
- 51.Cheng H, Chen BP, Soleas IM, Ferko NC, Cameron CG, Hinoul P. Prolonged Operative Duration Increases Risk of Surgical Site Infections: A Systematic Review. Surg Infect (Larchmt). 2017;18(6):722–35. [DOI] [PMC free article] [PubMed] [Google Scholar]
- 52.Rizk Y, Saad N, Arnaout W, Chalah MA, Farah S. Primary Hyperparathyroidism in Older Adults: A Narrative Review of the Most Recent Literature on Epidemiology, Diagnosis and Management. J Clin Med. 2023;12(19):6321. [DOI] [PMC free article] [PubMed] [Google Scholar]
- 53.Demidowich AP, Motevalli M, Yi K, Kamali A, Batty K, Moseley KF, Buber RR, Hashemipour M, Zilbermint M. Severe Hypercalcemia Following Hip Joint Implantation of Calcium Sulfate Antibiotic Beads: Case Series and Review of Literature. J Community Hosp Intern Med Perspect. 2025;15(1):107–10. [DOI] [PMC free article] [PubMed] [Google Scholar]
- 54.Pehkonen M, Luukkaala TH, Hongisto MT, Nuotio MS: Elevated Albumin-Corrected Calcium Predicts Mortality in Older Hip Fracture Patients. Journal of the American Medical Directors Association 2024, 25(9). [DOI] [PubMed]
- 55.Pedersen AB, Mikkelsen EM, Cronin-Fenton D, Kristensen NR, Pham TM, Pedersen L, Petersen I. Missing data and multiple imputation in clinical epidemiological research. Clin Epidemiol. 2017;9:157–66. [DOI] [PMC free article] [PubMed] [Google Scholar]
Associated Data
This section collects any data citations, data availability statements, or supplementary materials included in this article.
Supplementary Materials
Data Availability Statement
The datasets generated and/or analyzed during this study are not publicly available due to the presence of personal health information, but they are available from the corresponding author on reasonable request.