

Abstract
The dynamic response of twin parallel tunnels in unsaturated soil under metro train loadings was investigated using analytical methods. In the analysis, the tunnel was simulated as a linear elastic thin cylindrical shell, while the surrounding soil was treated as an unsaturated porous medium containing two cylindrical cavities. The analytical generalized solutions were deduced by solving the governing equations for the coupled tunnel-soil system using the separation of variables method and the Helmholtz decomposition method combined with the Fourier transform technique. Mixed boundary conditions were applied to determine unknown coefficients in the general solutions, yielding closed-form analytical solutions for dynamic displacement fields, as well as pore water/air pressure fields of the tunnel linings and soil. The validity and correctness of the proposed method were confirmed by comparisons with existing theoretical solutions. The parameter sensitivity analysis revealed that the presence of pore fluids (water/air) significantly affects the dynamic response of tunnels and surrounding soil. Increasing the tunnel spacing can effectively reduce the dynamic coupling effect between parallel tunnels. The traditional elastic or saturated medium models, which don’t consider the gas phase and the liquid phase, have a significant bias in the prediction of the dynamic interaction of the tunnel-soil system. The study reveals that variations in saturation degree significantly influence the displacement responses and pore pressure distributions of double-line parallel tunnels. Near-field displacement responses induced by saturated soils are substantially larger than those in unsaturated soils, whereas far-field displacements in saturated soils are smaller compared to unsaturated soils with higher saturation degrees. Moreover, a decrease in saturation degree leads to a rapid reduction in the bulk modulus of pore fluids, thereby amplifying the influence of the second tunnel on pore pressure. Analyzing the dynamic responses of double-line parallel tunnels under arbitrary saturation conditions facilitates more accurate prediction of metro train loading effects on soil behavior and provides critical guidance for tunnel design optimization.
Keywords: Twin parallel tunnels, Unsaturated soil, Dynamic response, Displacement, Pore pressure, Analytical solution
Subject terms: Civil engineering, Computational science
Introduction
With the acceleration of urbanization, urban rail transit systems with large capacity, high efficiency and low congestion can completely alleviate urban traffic pressure. However, environmental vibrations and secondary noise radiation caused by subway lines crossing urban areas are becoming increasingly serious, with related complaints showing a significant upward trend. Additionally, the long-term operation of subway trains induces settlements of 15–30 mm/year, posing a serious threat to the safety of adjacent buildings1,2. Therefore, establishing a high-precision tunnel-strata dynamic analysis model is theoretically and practically significant to reveal the soil-structure interaction mechanism under metro traffic loads, assess the long-term operational safety of tunnel structures, and achieve coordinated development of rail transit and the environment.
Currently, scholars worldwide have conducted extensive research on the dynamic tunnel-soil interaction under train loadings. In numerical simulations, commonly used methods include the finite element (FE) method3,4, finite difference method5, and finite element-boundary element coupled (FE-BE) method6. However, three-dimensional (3-D) numerical models require substantial computational resources. To improve efficiency, the 2.5-dimensional (2.5-D) numerical analysis method can be employed. Clouteau et al. (2005) use the Floquet transform in the longitudinal coordinate direction to represent 3-D dynamic responses on a single-boundary reference grid and proposed a periodic FE-BE method to predict ground vibrations induced by underground railways7. Zhou et al. (2016) and He et al. (2018) proposed an enhanced 2.5-D FE-BE method based on Biot theory to efficiently simulate the dynamic soil-tunnel interactions8,9.
Compared with numerical method, analytical approaches provide closed-form solutions derived directly from governing equations and boundary conditions, offering clear physical meaning and mathematical rigor. Metrikine and Vrouwenvelder (2000) and Koziol et al. (2008) derived analytical solutions for tunnel-soil interactions using simplified two-dimensional (2-D) model10,11. However, 2-D models cannot simulate wave propagation in the third dimension or tunnel-induced waveguide effect12. Andersen and Jones (2006) derived closed-form solutions for 2-D and 3-D tunnel-soil interaction models, respectively. Their comparative analysis concluded that a fully 3-D analytical model is necessary for quantitatively predicting of absolute vibrations caused by dynamic loads13. Forrest and Hunt (2006) proposed the Pipe-in-Pipe (PiP) model, simplifying the tunnel as a cylindrical shell and treating the soil as a 3-D elastic continuum14. However, real-world soil around tunnels are typically multiphase media. It would be more realistic to use multiphase theory to simulate the soil around the tunnel. Lu and Jeng (2006) studied dynamic responses of cylindrical cavities in saturated porous media under axisymmetric loading15. Yuan et al. (2015) and Di et al. (2016) investigated cylindrical tunnel in fluid-saturated media under moving loads using analytical methods16,17. Liang et al. (2024) employed a semi-analytical method to investigate the effects of elastic modulus and permeability coefficient in layered strata on the longitudinal response of tunnels18. Wei et al. (2025) performed full-scale loading tests on three-ring staggered assembled shield tunnel segments using a hydraulic loading system, analyzing the residual bearing capacity of the shield tunnel at each loading stage19.
Most existing studies focus on single tunnels, neglecting the effects of adjacent tunnels. In practice, twin parallel tunnels are widely adopted for bidirectional subway traffic. Kuo et al. (2011) developed a twin-tunnel superposition model based on the PiP framework, but its requirement for tunnel-soil interface discretization reduces computational efficiency20. He et al. (2018) constructed a twin-tunnel model using wavefunction transformations but faced challenges in calculating transverse wave number integrals due to the transformation between cylindrical and plane waves21. To address this, Yuan et al. (2019) proposed a semi-analytical wave function method for dual cylindrical cavities in elastic full space, accounting for multiple scattering between tunnels22,23,31,32. However, engineering practices often involve unsaturated strata due to deep groundwater levels influenced by underground development and regional groundwater extraction. Traditional single-/two-phase models fail to capture unsaturated soil’s three-phase coupling, leading to significant deviations between theoretical predictions and field measurements. Chen et al. (2024) conducted a series of suction-controlled triaxial tests to investigate the critical state behavior and swelling characteristics of soils by systematically varying mean net stress, suction, and initial dry density24,25.
Based on existing literature, no analytical solutions for twin tunnel-soil systems in unsaturated strata have been reported. The main objective of this paper is to establish a 3-D analytical solution for the dynamic response of twin tunnel-soil systems in unsaturated media under cyclic rail transit loads. Compared to numerical methods, the proposed semi-analytical approach offers high computational efficiency and accuracy, enabling dynamic reliability assessments and long-term performance predictions of tunnel structures. The new contributions of this paper are as follows:
(1) A coupled tunnel-unsaturated soil model is developed by integrating Fredlund unsaturated soil theory, Flügge shell theory, and wave function transformation equations. Closed-form expressions for tunnel displacements, soil displacements, and excess pore water/air pressures are derived, enabling quantitative analysis of unsaturated soil displacement responses and pore pressures induced by double-line parallel tunnels under train loading.
(2) The proposed methodology is validated against published results for analogous problems. The dynamic interactions between tunnels and unsaturated soils are systematically analyzed. Key parametric influences, including tunnel spacing, soil saturation degree, and vibration frequency, on dynamic displacements and pore pressures are rigorously investigated and discussed.
(3) The effects of adjacent tunnels and gas-phase dynamics in unsaturated soils on system responses are explicitly characterized, with excess pore pressure evolution mechanisms clarified. These findings provide a theoretical foundation for optimized seismic design of metro tunnels in complex geological conditions.
The structure of this paper is organized as follows: First, governing equations for unsaturated soil-tunnel coupling are listed, and boundary/interface conditions are defined. Next, closed-form analytical solutions are derived using cylindrical wave function expansion. The proposed solution is then validated via parameter degradation; Sensitivity analyses of key parameters (e.g., tunnel spacing, soil saturation, frequency) are conducted and discussed. Finally, conclusions are summarized.
Computational model
Figure 1 illustrates the schematic of twin parallel tunnels embedded in an unsaturated porous medium. Both tunnels have circular cross-sections with radii  and
and  , lining thicknesses
  and
and  , and center-to-center spacing
  . For simplicity, the tunnel linings are modeled as infinitely long Flügge thin-walled cylindrical shells composed of homogeneous, isotropic, linear elastic materials. The surrounding soil is treated as a three-phase unsaturated medium comprising solid, fluid (water), and gas. Two cylindrical coordinate systems- left
  and right
  - are adopted, with the
  -axis aligned parallel to the tunnel axis (see Fig. 1).
Fig. 1.

Computational model of twin parallel tunnels in cylindrical coordinate systems.
Governing equations for tunnels
Based on Flügge shell theory14, the dynamic governing equations for the tunnel lining in the  ,
,  , and
, and  -directions are:
 |
1 |
 |
2 |
 |
3 |
where  ,
,  , and
, and  are the displacement components of the tunnel lining in the
  ,
,  , and
, and  -directions, respectively;
  and
and  are the mid-surface radius and thickness of the lining, respectively;
  ,
,  , and
, and  represent Young’s modulus, Poisson’s ratio, and mass density of the lining, respectively;
  ,
,  ,
,  are respectively the net stresses on the mid-surface of lining in the
  ,
,  , and
, and  -directions.
Dynamic governing equations for unsaturated soil
Neglecting body forces, the governing equation for unsaturated soil can be expressed as26,27:
 |
4 |
 |
5 |
 |
6 |
where  ,
,  and
and  are displacement vectors of the soil skeleton, pore water and pore gas relative to the solid phase, respectively;
  and
and  denote the pore water and gas pressure, respectively;
  , is the average density of the unsaturated soil, in which
  ,
,  , and
, and  are the mass density of solid skeleton, pore water, and pore gas, respectively;
  is porosity, and
  is water saturation.
  ,
,  and
and  are Lamé constants, bulk compression modulus of soil particles, respectively;
  , is the Biot coefficient;
  is acceleration of gravity;
  and
and  are permeability coefficients of water and gas, respectively. A dot over a symbol denotes the first-order derivative with respect to time.
The continuity equations for pore water and gas flow in unsaturated soils are as follows:
 |
7 |
 |
8 |
where the coefficients  are listed in Appendix A.
According to the Bishop’s effective stress principle, the stress-strain relationship for unsaturated soil can be written as:
 |
9 |
where  is the total stress;
  is the strain component;
  is the Kronecker notation;
  is the equivalent pore pressure;
  is the effective stress coefficient, which can be approximated as
  .
.
Boundary conditions
The dynamic tunnel-soil interaction under train loads constitutes a mixed boundary value problem in elastodynamics. Assuming perfect bonding at the tunnel-soil interface, the continuity conditions for displacements and stresses are expressed as
 |
10 |
 |
11 |
Let  and
and  denote the external forces applied to the inner surfaces of the left and right tunnels, respectively. The stress continuity conditions at the tunnel inner surfaces (
 ) can be written as
 |
12 |
For completely permeable tunnel-soil interface, the excess pore pressures vanish at the interface:
 |
13 |
If the tunnel-soil interface is completely impermeable, the radial displacements of pore fluids at the interface are zero, i.e.,
 |
14 |
 |
15 |
Fundamental solutions for Tunnel-Soil system
Assuming harmonic spatiotemporal distributions of net stresses on the midplane of tunnel lining:
 |
16 |
The corresponding midplane displacements are:
 |
17 |
where  is the angular frequency,
  is the axial wavenumber,
  is the circumferential mode number;
  , and
, and  are the stress and displacement amplitudes in the wave spatiotemporal domain, respectively.
Substituting Eqs. (16)-(17) into Eqs. (1)-(3) yields the modal displacement-stress relationship of tunnel:
 |
18 |
where the elements in matrix  are given in Appendix B.
By virtue of Helmholtz decomposition, the displacement vectors  ,
,  ,
,  appeared in Eqs. (4)-(6) can be expressed as14:
 |
 |
19 |
where  ,
,  , and
, and  represent potential functions for the soil skeleton, pore water, and pore gas, respectively; Subscripts SH, SV, and P denote shear-horizontal (SH), shear-vertical (SV), and compressional (P) waves, respectively.
For steady-state analysis, substituting the potential functions defined in Eq. (19) into Eqs. (4)-(6) and applying the temporal Fourier transform yields:
 |
20 |
 |
21 |
where  ,
,  ,
,  ,
,  ,
,  ;
;  ,
,  .
.
To ensure that Eqs. (20) and (21) have nontrivial solutions, the determinant of the coefficient matrices of Eqs. (20) and (21) must be zero, yielding
 |
22 |
 |
23 |
where  (
( =1, 2, 3) and
  are the complex wavenumbers for compressional and shear waves in unsaturated soils, respectively.
Substituting Eqs. (22)-(23) into Eqs. (20)-(21) yields
 |
24 |
 |
25 |
 |
26 |
 |
27 |
 |
28 |
where the expressions of  ,
,  ,
,  ,
,  are listed in Appendix C.
In the twin parallel tunnels (Fig. 1), external loads applied at the tunnel invert induce outgoing waves at both tunnel-soil surfaces. Given the wave propagation symmetry between the left ( ) and right (
 ) coordinate systems, the left/right identifiers are omitted for conciseness. The outgoing vector wave functions generated SV, SH and P1-P3 waves are expressed as:
 |
29 |
 |
30 |
 |
31 |
 |
32 |
 |
33 |
where  is the outgoing vector wave function of shear (
 =1 for SV waves and
  =2 for SH waves) and compressional (
 =3, 4, 5 for P waves) waves, which are products of Hankel and exponential functions;
  =0, 1,,… denotes the mode number of the circumferential modes;
  is the wavenumber in the radial direction and
  ≥0 is required to satisfy the radiation condition as the wave propagates outward. The displacement
  (
( =1, 2, 3, 4, 5) generated by non-singular waves can be obtained if the Hankel functions of the first kind in Eqs. (29)-(33) are replaced by Bessel function.
Substituting Eqs. (29–35) into Eq. (9) yields the stress component on the cylindrical surface with normal vector  :
:
 |
34 |
 |
35 |
 |
36 |
 |
37 |
 |
38 |
where  ,
,  ,
,  ;
;  denotes the stress component generated by outgoing waves. The stress
  generated by non-singular waves can be obtained if the Hankel function of the first kind in Eqs. (34)-(38) is replaced by Bessel function.
Substituting Eqs. (29)-(33) into Eqs. (7)-(8), an expression for pore pressure can be obtained:
 |
39 |
 |
40 |
where  and
and  denote the excess pore water and gas pressures generated by the outgoing waves, respectively. Similarly, the excess pore pressures
  and
and  generated by non-singular waves can be obtained if the Hankel functions of the first kind in Eqs. (41)-(40) are replaced by Bessel function.
The wave, stress and displacement fields in the soil surrounding the two parallel tunnels are the superposition of the outgoing waves outside the two cylindrical surfaces. Therefore, from Eqs. (29)-(40), the total displacement field, stress field and pore pressure field in the soil surrounding the two tunnels can be obtained:
 |
41 |
 |
42 |
 |
43 |
where the superscripts  and
and  denote tunnel 1 and tunnel 2, respectively;
  and
and  are unknown coefficients depending on the boundary conditions; and
  .
.
Generally speaking, most of the random dynamic loads can be superimposed by simple harmonic point loads. Therefore, in this paper, the train axle loads in the twin parallel tunnels can be simulated by point loads. When the unit harmonic point load with frequency  is applied to Tunnel 1 at any angle
  and any velocity
  , and to Tunnel 2 at any angle
  and any velocity
  , the expressions for
  and
and  can be written as:
 |
44 |
Combining the stress-displacement continuity condition on the tunnel-soil contact surface expressed in Eq. (18), the displacement-stress relationship in each mode in the frequency-wave number domain can be obtained:
 |
45 |
In order to accommodate the boundary conditions at  , a transformation of the outgoing wave function is required28,29 (Fig. 2). For this purpose, the waves scattered by the l-th cylinder are represented as the incident waves on the j-th cylindrical scatterer:
 |
46 |
Fig. 2.
Conversion between two different column surface waves.
From Eq. (56), the translation between cylindrical waves scattered by the cavities in twin parallel tunnels is given by:
 |
47 |
 |
48 |
 |
Substituting Eqs. (47)-(48) into Eqs. (41)-(43) yields the total wavefield expressed in the first set of column coordinates,  , as:
, as:
 |
49 |
 |
50 |
 |
51 |
Following the same approach, the outgoing waves outside the tunnel-soil interface of Tunnel 1 are described using the second cylindrical coordinate system  to satisfy the boundary conditions at
  :
:
 |
52 |
 |
53 |
 |
54 |
Combining Eqs. (12)-(15), Eq. (45), and Eqs. (49)-(54), a system of linear equations consisting of  equations can be established, which can be solved for the unknowns
  and
and  . Once
  and
and  are determined, the solutions in the spatial-time domain of the tunnel-soil dynamic interaction can be obtained based on Eqs. (41)-(43) with the inverse Fourier transform.
Numerical results and discussion
In the following numerical examples, the parameters of the tunnels and unsaturated soils are taken to the same values as Di et al.30 (Table 1), unless otherwise specified. To align the soil environment with practical engineering applications, the saturation degree ranges from 0.3 to 1, based on the scope defined by Di et al.30 (2021). The tunnel spacing references the values in Yuan et al.22 (2019). For loading frequency, since periodic wheel-rail contact and track irregularity-induced random vibrations predominantly occur at 1–40 Hz, while high-frequency vibrations caused by localized wheel/rail wear typically fall within 50–100 Hz, the present study adopts a comprehensive range of 1–80 Hz to investigate the effects of loading frequency on soil behavior.
Table 1.
Parameters for lining and unsaturated soil.
| Parameter | Value |
|---|---|
| Tunnel lining | |
Modulus of elasticity,  (Pa) (Pa) |
5 × 10¹⁰ |
Poisson’s ratio, 
|
0.3 |
Density,  (kg/m3) (kg/m3) |
2500 |
Inner radius,  (m) (m) |
3 |
Thickness,  (m) (m) |
0.25 |
| Soil | |
Bulk modulus of soil particles,  (GPa) (GPa) |
35 |
Density of soil grains,  (kg/m3) (kg/m3) |
2650 |
Low-amplitude dynamic shear modulus of dry soil,  (GPa) (GPa) |
1.44 |
Bulk modulus of soil mass,  (GPa) (GPa) |
1.02 |
Porosity, 
|
0.4 |
Saturation, 
|
0–1.0 |
Residual saturation of wetting fluid, 
|
0.05 |
Intrinsic permeability,  (m2) (m2) |
10−11 |
Fitting parameter for V-G model, 
|
5.0 × 10⁻⁴ |
Fitting parameter for V-G model, 
|
2.0 |
Fitting parameter for V-G model, 
|
0.5 |
Maximum shear modulus ratio, 
|
1.6 |
Optimal saturation, 
|
0.18 |
Bulk modulus of water,  (GPa) (GPa) |
2.25 |
Density of water,  (kg/m3) (kg/m3) |
1000 |
Viscosity coefficient of water,  (mPa (mPa s) s) |
1.0 |
Bulk modulus of gas,  (kPa) (kPa) |
145 |
Density of gas,  (kg/m3) (kg/m3) |
1.29 |
Viscosity coefficient of gas,  (mPa (mPa s) s) |
0.0162 |
Comparison with existing results
In order to verify the correctness of the present solution, the degenerated solution in this paper is firstly compared with the solution of the PiP model for a single-line tunnel proposed by Forrest et al.14. Since Forrest’s model is based on a single-phase elastic medium and only considers the single-line tunnel case, for this reason, the three-phase parameters of the soil, saturation  and porosity
  , in the present solution are converged to 0, so that the saturated soil is degraded to a single-phase elastic medium; and then the spacing of the tunnels is extended to
  =200 m to ensure that the mechanical response of Tunnel 2 to Tunnel 1 is negligible (less than 0.1%). Therefore, in the calculation, the soil parameters were taken as those of Forrest:
  =10−3,
  =10−3,
  =28.85 GPa,
  =29.23 GPa, and
  =2500 kg/m3. The location of load was set to be at the invert of Tunnel 1 (
 =3 m,
=3 m,  =0°,
=0°,  =0 m), and the rest of the parameters were the same as those in with Table 1.
Figure 3 shows the results obtained by using the degenerated solution of the present work and the Forrest method, in which the dynamic response amplitude adopts the decibel scale:  , in which
  is the computed value, and
  =1 N/m, is the benchmark reference value. As can be seen from the figure, the maximum relative differences of the present solution with those of Forrest method (2018) is 0.16%, which verifies the correctness of the present theory.
Fig. 3.

Comparison of present solution with those of Foresst (2006).
In order to further verify the correctness of the present solution, the degenerated solutions of this paper are also compared with those of He21and Yuan22. Given that the He and Yuan models are based on the two-phase saturated medium case, for this reason, the saturation of the three-phase parameters of the soil  in the present solution is made to converge to 1, so that the unsaturated soil is degraded to a two-phase saturated porous medium. In the calculation, the values of soil parameters are consistent with Yuan22:
  =1,
=1,  =5.4 × 10⁷ Pa,
  =1.8 × 10⁷ Pa, and
  =1800 kg/m3. The tunnel spacing is taken to be two times of the tunnel diameter, and the load is applied at the invert of Tunnel 1 (
 =3 m,
=3 m,  =0°,
=0°,  =0 m), and the rest of the parameters are consistent with Table 1. The results obtained from the three calculations at 10 m directly above the tunnel are given in Fig. 4. As can be seen from the figure, the maximum relative differences of the present solution with those of He et al. (2018) and Yuan et al. (2019) are 0.57% and 0.23%, respectively, which further verifies the correctness of the theory in this paper.
Fig. 4.

Comparison between the present solution and the solutions of He (2018) and Yuan (2019).
Parametric analysis
This section focuses on the effects of soil saturation and tunnel spacing on the dynamic responses of soil. In the analysis, the tunnels are twin parallel tunnels with a spacing of  =10 m. A unit harmonic moving load with frequency
  =40 Hz and velocity 10 m/s is applied at the invert of Tunnel 1, while no load is applied to Tunnel 2. The maximum design speed of metro trains typically ranges from 80 to 120 km/h, but this speed is only briefly attained during operation in long-interval or suburban sections. Due to the combined effects of frequent station stops and small station spacing (generally 1–2 km), the average operating speed of most metro systems approximates 30–45 km/h. In this study, an average metro speed of 10 m/s (equivalent to 36 km/h) is adopted for analytical modeling. Response observation points include A, B, and C (as shown in Fig. 5). Unless specified otherwise, parameters from Table 1 are adopted for the parametric analysis.
Fig. 5.
Computational model of twin parallel tunnels and observation points.
Influence of saturation
Fig. 6 shows the variations of vertical displacement and insertion gain at Point A against loading frequency for single tunnel and twin parallel tunnels under different degree of saturation of unsaturated soil. To quantify the influence of Tunnel 2 on the dynamic response of Tunnel 1, the insertion gain (IG) is defined as:
 |
55 |
Fig. 6.

Variations of vertical displacements at Point A against loading frequency under different degrees of saturation of unsaturated soil: (a) Single tunnel; (b) Twin parallel tunnels; (c) Insertion gain.
where  and
and  are the displacement amplitudes for twin-parallel- and single-tunnel cases, respectively.
It can be seen that from Fig. 6(a) for the single-tunnel case, the vertical displacement at Point A increases with the decreasing of  but remains smaller than that under fully saturation (
 =1). When
  <0.9, the displacement curves nearly overlap, indicating negligible effects of further saturation reduction. Figure 6(b) presents vertical displacements at Point A for the twin-tunnels case under varying
  . Comparing Figs. 6(a) and 6(b), saturation reduction amplifies vertical displacements in single-tunnel case, while the second tunnel introduces frequency-dependent influences in the low-frequency range. Figure 6(c) reveals that at
  =1 (saturated case), the second tunnel has the most pronounced effect on vertical displacement. As soil saturation decreases, this influence stabilizes due to enhanced viscous coupling within the soil matrix as it transfers from saturated to water-sealed and funicular saturation states. Additionally, higher frequencies amplify viscous coupling among solid-liquid-gas phases, increasing energy dissipation.
Figure 7 illustrates the variations of equivalent pore pressure and insertion gain at Point A against loading frequency under different saturation degrees. As shown in Figs. 7(a) and 7(b), the maximum equivalent pore pressure occurs in saturated media ( =1) and rapidly decreases with lower saturation, reaching a minimum at
  =0.3. Figure 7(c) highlights the frequency sensitivity of IG. At low frequencies, IG is smaller for high saturation (
 ≥0.9) but increases with lower saturation. At high frequencies, IG approaches zero for low saturation and decreases for high saturation. This behavior arises from gas effects in unsaturated media. When
  ≈1, gas exists as closed bubbles in the liquid phase. The gas’s lower bulk modulus reduces the excess pore fluid bulk modulus, diminishing pore pressure and enhancing IG sensitivity to Tunnel 2 at low frequencies.
Fig. 7.
Variations of equivalent pore pressure and insertion gain at Point A against loading frequency under different degrees of saturation: (a) Single tunnel; (b) Twin parallel tunnels; (c) Insertion gain.
Figure 8 displays vertical displacements of soil and insertion gain (IG) on an observation plane 15 m above the tunnels for single- and twin-parallel tunnels ( =10 m). The observation plane spans a 60 m×60 m transverse-longitudinal domain, with the origin (0,0) located directly above the load center of Tunnel 1. For the single-tunnel case, vertical displacements exhibit symmetry about the tunnel centerline and load axis, decaying elliptically outward. attenuating radially from the load application point and forming elliptical wavefront (Fig. 8). This pattern arises because elastic waves propagate faster in tunnel lining concrete than in the surrounding soil. Comparative analysis across saturation degrees reveals that soil vibrations on the observation plane are predominantly composed of P1 and S wavefronts, with P1 waves exhibiting lower energy density and S waves higher energy density. As P1 wave attenuation increases with rising saturation and S wave attenuation decreases, the wavefield at
  =1 is dominated by the higher-density S wavefront. When saturation decreases, P1 wave attenuation diminishes while S wave attenuation intensifies, shifting wavefield dominance to the P1 wavefront. Based on the wave velocity expression for unsaturated soils
  , the velocities of P1 and S waves increase with decreasing saturation. Consequently, the density of the P1 wavefront progressively grows as
  reduces from 0.99 to 0.7. Comparison of insertion gains (IG) for
  <1 (unsaturated media) shows that at high saturation (
 =0.99), the presence of Tunnel 2 generates the maximum IG, reaching
  near
near  =10 m. The IG gradually diminishes with decreasing saturation due to the increased dynamic shear modulus of unsaturated soil, which weakens load-induced soil disturbances.
Fig. 8.

Variations of vertical displacement and insertion gain on the observation plane 15 m above the tunnels under different degrees of saturation: (a)  =1; (b)
  =0.99; (c)
  =0.9; (d)
  =0.7.
=0.7.
Figures 9 and 10 shows the time-history curves of vertical displacements at Points A and B under different degrees of saturation of unsaturated soil. It can be seen from the figures that the magnitude of vertical displacements differs significantly between saturated and unsaturated soils. In the near field (Point A), the vibration magnitude at saturated soil ( =1) is larger than that at unsaturated soil (
 <1), and the effect of adding a second tunnel on the near field is also larger at
  =1 than
  <1. In the far field (Point B), the opposite is true. It can be seen that saturation greatly affects the dynamic response of twin parallel tunnels, triggering certain differences in both the near and far fields, and treating the soil as a saturated medium only inevitably leads to inaccurate results.
Fig. 9.
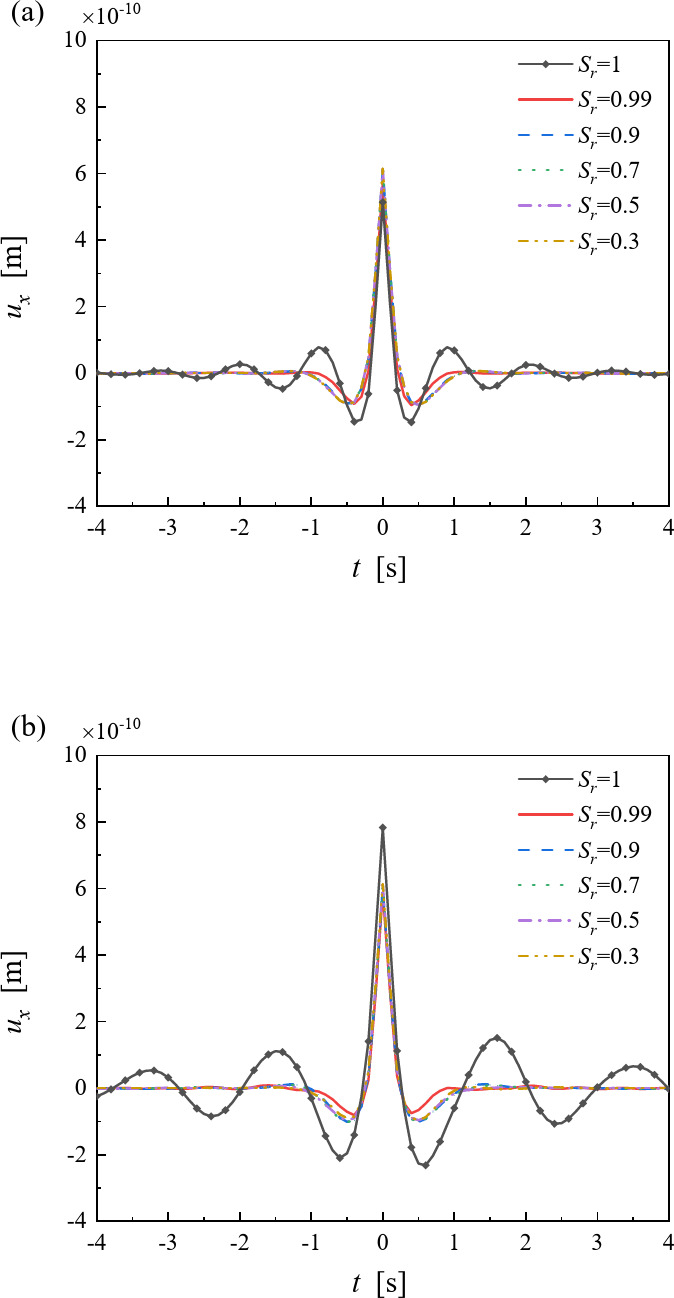
Vertical displacement time-history curves at Point A under different saturation degrees: (a) Single-line tunnel; (b) Twin parallel tunnels.
Fig. 10.
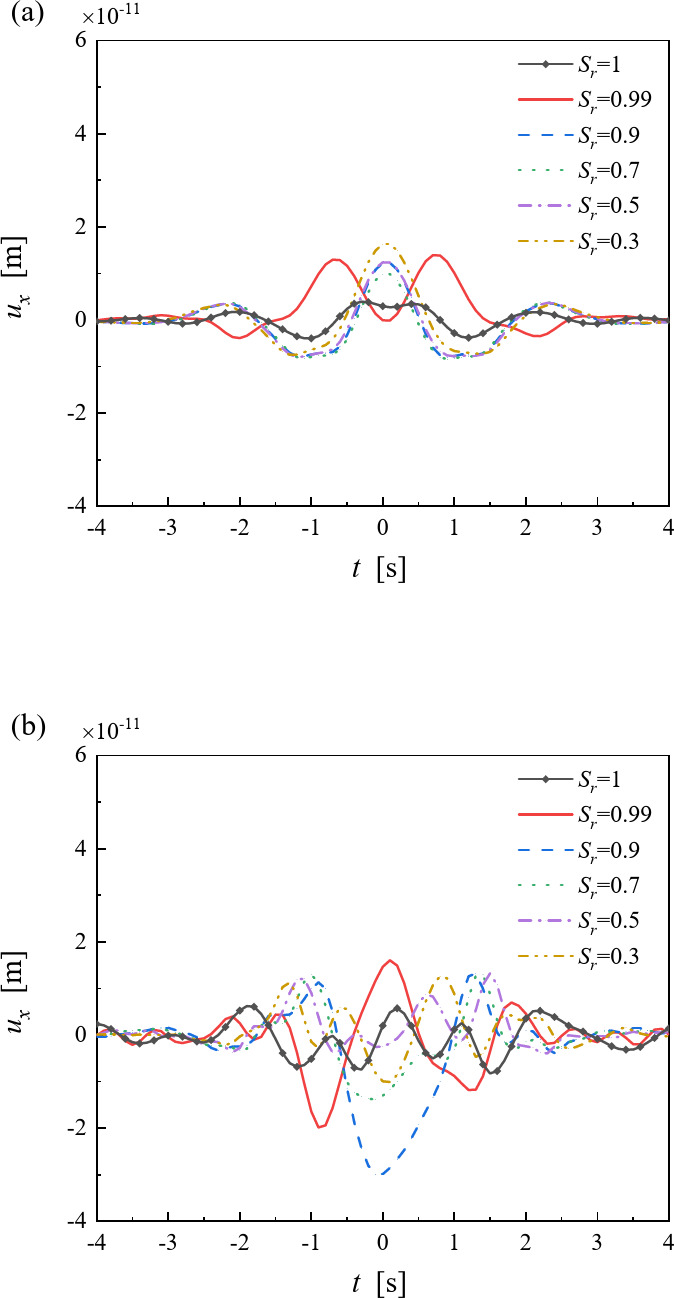
Vertical displacement time-history curves at Point B under different saturation degrees: (a) Single-line tunnel; (b) Twin parallel tunnels.
Effect of tunnel spacing on dynamic responses
In the design of twin parallel tunnels, the center-to-center spacing between tunnels is a critical parameter controlling the influence of adjacent tunnel interactions on free-field responses. By optimizing the tunnel spacing, the dynamic coupling effects between the tunnels can be minimized.
Figure 11 presents the vertical and transverse displacements at near-field Point A under different tunnel spacings compared with the single tunnel case. It can be seen from the figure that at low loading frequencies ( <16 Hz), the addition of the second tunnel significantly affects near-field displacements, but this influence diminishes as the spacing between the two tunnels increases. At higher frequencies, the vertical displacements at the tunnel invert under both single-line and twin tunnel conditions align closely, even for closely spaced tunnels (
 =7.5 m). This indicates that the scattered wavefields generated by Tunnel 2 have limited impact on ear-field displacements around Tunnel 1. Due to symmetry about
  =0°, the horizontal displacements vanish at the invert in single-tunnel case. However, the horizontal components decrease as the tunnel spacing increases in the twin tunnel case.
Fig. 11.
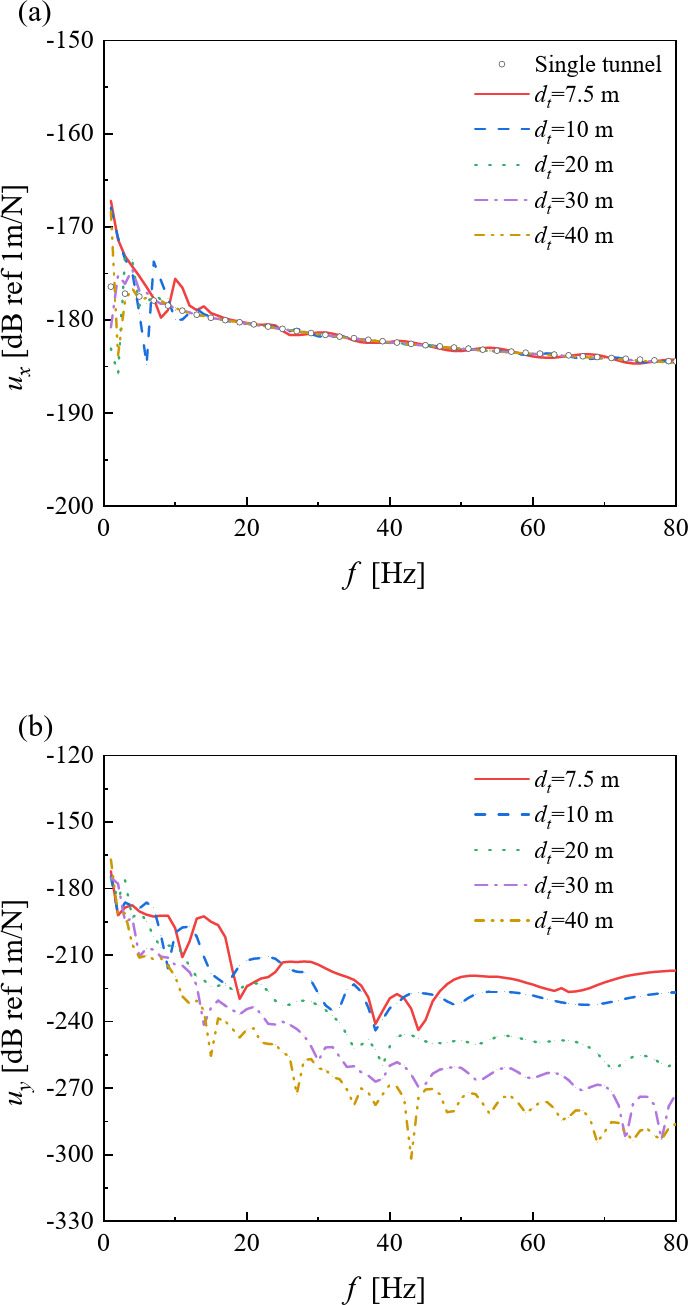
Variations of displacements against loading frequency at Point A below the tunnel under different tunnel spacing: (a) Vertical displacement; (b) Horizontal displacement.
Figure 12 illustrates the variation in pore pressure at near-field Point A with loading frequency under different tunnel spacing, compared with the single-tunnel case (saturation degree  =0.9). It can be seen from Fig. 12 that the addition of the second tunnel has a much greater influence on near-field pore pressure than on displacements. The magnitude of pore pressure variation is closely related to tunnel spacing. For
  =7.5 m, the twin-tunnel configuration significantly affects pore pressure amplitudes, while negligible effects are observed when
  ≥40 m. This is due to that the impermeable and air-tight boundaries between the tunnels and soil restrict lateral dissipation of pore pressure, forcing vertical dissipation only. Closer tunnel spacing leads to more pronounced pore pressure accumulation.
Fig. 12.

Variation of excess pore pressure against loading frequency at Point A under different tunnel spacing.
Figures 13 and 14 depict the vertical and horizontal displacements at far-field Points B and C, respectively, under varying tunnel spacing and loading frequencies. As shown in Fig. 13(a), at high frequencies, the second tunnel has a minimal influence on far-field displacements due to strong internal damping effects in the soil, which attenuate elastic wave propagating from Tunnel 1 to Tunnel 2 and scattered waves from Tunnel 2. For  ≥20 m, vertical displacements in the twin-tunnel case nearly coincide with those of the single-tunnel case. As frequency decreases, soil damping weakens, amplifying the influence of the second tunnel. Figure 13(b) demonstrates that increasing
  reduces horizontal displacements, consistent with results in Fig. 11(b). Figure 14 further shows that at far-field Point C (far from the vibration source), displacements decrease both in vertical and transverse components. However, the presence of the second tunnel still induces frequency-dependent oscillations in soil displacements at Point C, particularly in the vertical component.
Fig. 13.

Variations of displacement against loading frequency at Point B under different tunnel spacing: (a) Vertical displacement; (b) Horizontal displacement.
Fig. 14.

Variations of displacement against loading frequency at Point C under different tunnel spacing: (a) Vertical displacement; (b) Horizontal displacement.
Figs. 15-17 present the responses on an observation plane 15 m above Tunnel 1 under different loading frequencies  =20 H, 40 Hz, and 80 Hz, respectively, for varying tunnel spacings. Compared to the single tunnel, the addition of the second tunnel disrupts the symmetry of vertical displacements in the overlying soil. At closer spacing (
 ≤10 m), the surface vibration differences between single-line and twin tunnel cases are most pronounced, as the refracted wave field from Tunnel 2 transmit more energy upward, distorting wavefronts and amplifying displacements. Compared to the single-tunnel results, wavefront distortion on the observation plane is minor to the left of Tunnel 1 but concentrates between the right side of Tunnel 1 and the left side of Tunnel 2. As Tunnel 2 moves away from the vibration source, wavefronts gradually recover symmetry. Scattering effects remain significant until
  >80 m, beyond which the wavefield aligns with the single-tunnel scenario. Thus, neglecting one tunnel in twin-tunnel analysis leads to inaccuracies in surface vibration predictions, especially at small spacings. When
  ≥80 m, dynamic interactions between tunnels become negligible. Figures 15–17 also show that at low frequencies (
 ≤20 Hz), wavefronts diffracted by Tunnel 2 are visible even at
  =80 m. At higher frequencies (
 ≥80 Hz), the influence of Tunnel 2 on wavefronts near Tunnel 1 diminishes, with effects localized near Tunnel 2.
Figs. 15.

Vertical displacement on the observation plane 15 m above the tunnel under load frequency of =20 Hz: (a) Single tunnel; (b) =10 m; (c) =20 m; (d) =40 m; (e) =80 m.
Fig. 17.

Vertical displacement on the observation plane 15 m above the tunnel under load frequency of  =40 Hz: (a) Single tunnel; (b)
  =10 m; (c)
  =20 m; (d)
  =40 m; (e)
  =80 m.
Fig. 16.

Vertical displacement on the observation plane 15 m above the tunnel under load frequency of  =20 Hz: (a) Single tunnel; (b)
  =10 m; (c)
  =20 m; (d)
  =40 m; (e)
  =80 m.
Conclusions
This paper investigated the dynamic response of twin parallel tunnels in unsaturated soil by establishing a three-dimensional analytical model of tunnel-unsaturated soil interaction. The analytical methods for the dynamic interaction between twin parallel tunnels and unsaturated soil. The effects of the water saturation degree of soil, tunnel spacing, and vibration frequency on dynamic responses were systematically analyzed. A comparative analysis was conducted with the dynamic responses of tunnels in saturated soils. The main conclusions are as follows:
(1) In the near field, the addition of the second tunnel has a more significant impact on saturated soil compared to unsaturated soil. In the far field, wave attenuation effects vary with saturation. Differences exist in wavefront characteristics between saturated and unsaturated soils. The presence of the second tunnel notably influences highly saturated unsaturated soil but shows minimal effects on saturated soil or low-saturation unsaturated soil.
(2) At high degrees of saturation, where internal pore pressure is substantial, the addition of the second tunnel exerts limited influence on pore pressure variations. As saturation decreases and gas content increases, pore pressure in low-saturation soil diminishes, amplifying the impact of the second tunnel on pore pressure.
(3) Variations in tunnel spacing and vibration frequency have minor effects on soil displacements near Tunnel 1. However, the addition of the second tunnel significantly alters soil responses in different frequency ranges. Tunnel spacing strongly affects near-field pore pressure, and substantially mitigates its influence on pore pressure by increasing tunnel spacing.
(4) Traditional saturated soil-tunnel interaction models underestimate the dynamic responses of tunnels in unsaturated soils, as they fail to adequately account for the effects of gas phase, matrix suction, viscous coupling, and vibration frequency, etc.
The present research and its conclusions can provide valuable references for the design and analysis of twin metro tunnels in unsaturated full-space environments, and can contribute to more accurate assessments of the dynamic responses and optimization designs of tunnels.
However, the present study still has several limitations. The current research only considers the interaction between the double-line tunnels and lacks necessary investigation into ground surface reflections, thus being applicable solely to deeply buried double-line tunnels. Future studies should incorporate soil vibrations induced by ground surface reflections. Additionally, while the Flügge shell theory adopted in the present study models the tunnel as an infinitely long thin-walled shell, a more sophisticated segmented lining ring model - periodically connected along the longitudinal direction via annular joints - should be employed to achieve higher precision in displacement and pore pressure responses.
Appendix A
 |
 |
where  ,
,  ,
,  ,
,  ,
,  ,
,  .
.
Appendix B
 |
 |
 |
Appendix C
 |
 |
 |
where  ,
,  =1, 2, 3;
  ,
,  .
.
Author contributions
L.Y.Y., W.G.C., and J.Y.E. conceived the project; L.Y.Y. and W.G.C. carried out the theoretical derivation; L.Y.Y and W.G.C. compiled the code and analyzed the results; and L.Y.Y., W.G.C., J. Y.E., W. T. S. and J.S.Y. wrote the manuscript. All authors reviewed the manuscript.
Funding
National Natural Science Foundation of China (52178364).
Data availability
Data is provided within the manuscript.
Declarations
Competing interests
The authors declare no competing interests.
Footnotes
Publisher’s note
Springer Nature remains neutral with regard to jurisdictional claims in published maps and institutional affiliations.
References
- 1.Sanayei, M., Maurya, P. & Moore, J. A. Measurement of Building foundation and ground-borne vibrations due to surface trains and subways. Eng. Struct.53, 102–111. 10.1016/j.engstruct.2013.03.038 (2013). [Google Scholar]
- 2.Sheng, X. A review on modelling ground vibrations generated by underground trains. Int. J. Rail Transp.7 (4), 241–261. 10.1080/23248378.2019.1591312 (2019). [Google Scholar]
- 3.Andersen, L., Nielsen, S. R. K. & Iwankiewicz, R. Vehicle moving along an infinite beam with random surface irregularities on a Kelvin foundation. J. Appl. Mech.69 (1), 69–75. 10.1115/1.1427339 (2002). [Google Scholar]
- 4.Bian, X., Jin, W. & Jiang, H. Ground-borne vibrations due to dynamic loadings from moving trains in subway tunnels. J. Zhejiang Univ. Sci. A. 13 (11), 870–876. 10.1631/jzus.a12isgt5 (2012). [Google Scholar]
- 5.Wenzlau, F. & Müller, T. M. Finite-difference modeling of wave propagation and diffusion in poroelastic media. Geophysics74 (4), T55–T66. 10.1190/1.3122928 (2009). [Google Scholar]
- 6.Sheng, X., Jones, C. J. C. & Thompson, D. J. Modelling ground vibration from railways using wavenumber finite- and boundary-element methods. Proc. R Soc. Math. Phys. Eng. Sci.461 (2059), 2043–2070. 10.1098/rspa.2005.1450 (2005). [Google Scholar]
- 7.Clouteau, D., Arnst, M., Al-Hussaini, T. M. & Degrande, G. Freefield vibrations due to dynamic loading on a tunnel embedded in a stratified medium. J. Sound Vib.283 (1), 173–199. 10.1016/j.jsv.2004.04.010 (2005). [Google Scholar]
- 8.Zhou, S., He, C. & Di, H. Dynamic 2.5-D green׳s function for a poroelastic half-space. Eng. Anal. Bound. Elem.67, 96–107. 10.1016/j.enganabound.2016.03.011 (2016). [Google Scholar]
- 9.He, C., Zhou, S., Guo, P., Di, H. & Zhang, X. Modelling of ground vibration from tunnels in a poroelastic half-space using a 2.5-D FE-BE formulation. Tunn. Undergr. Space Technol.82, 211–221. 10.1016/j.tust.2018.08.043 (2018). [Google Scholar]
- 10.Metrikine, A. V. & Vrouwenvelder, A. C. W. M. Surface ground vibration due to a moving train in a tunnel: Two-Dimensional model. J. Sound Vib.234 (1), 43–66. 10.1006/jsvi.1999.2853 (2000). [Google Scholar]
- 11.Koziol, P., Mares, C. & Esat, I. Wavelet approach to vibratory analysis of surface due to a load moving in the layer. Int. J. Solids Struct.45 (7–8), 2140–2159. 10.1016/j.ijsolstr.2007.11.008 (2008). [Google Scholar]
- 12.Sheng, X., Jones, C. J. C. & Thompson, D. J. Ground vibration generated by a harmonic load moving in a circular tunnel in a layered ground. J. Low Freq. Noise Vib. Act. Control. 22 (2), 83–96. 10.1260/026309203322770338 (2003). [Google Scholar]
- 13.Andersen, L. & Jones, C. J. C. Coupled boundary and finite element analysis of vibration from railway tunnels-a comparison of two- and three-dimensional models. J. Sound Vib.293 (3–5), 611–625. 10.1016/j.jsv.2005.08.044 (2006). [Google Scholar]
- 14.Forrest, J. A. & Hunt, H. E. M. A three-dimensional tunnel model for calculation of train-induced ground vibration. J. Sound Vib.294 (4–5), 678–705. 10.1016/j.jsv.2005.12.032 (2006). [Google Scholar]
- 15.Lu, J. F. & Jeng, D. S. Dynamic analysis of an infinite cylindrical hole in a saturated poroelastic medium. Arch. Appl. Mech.76 (5–6), 263–276. 10.1007/s00419-006-0025-9 (2006). [Google Scholar]
- 16.Yuan, Z. et al. Dynamic response of a tunnel buried in a saturated poroelastic soil layer to a moving point load. Soil. Dyn. Earthq. Eng.77, 348–359. 10.1016/j.soildyn.2015.05.004 (2015). [Google Scholar]
- 17.Di, H. et al. Three-dimensional multilayer cylindrical tunnel model for calculating train-induced dynamic stress in saturated soils. Comput. Geotech.80, 333–345. 10.1016/j.soildyn.2015.05.004 (2016). [Google Scholar]
- 18.Liang, F., Jiang, Z., Yuan, Q., Li, L. & Wang, R. Time-dependent longitudinal responses of a shield tunnel induced by surcharge load: theoretical prediction and analysis. Undergr. Space. 14, 219–238. 10.1016/j.undsp.2023.05.013 (2024). [Google Scholar]
- 19.Wei, G. et al. Full-scale loading test for shield tunnel segments: Load-bearing performance and failure patterns of lining structures. Undergr. Space. 20, 197–217. 10.1016/j.undsp.2024.05.003 (2025). [Google Scholar]
- 20.Kuo, K. A., Hunt, H. E. M. & Hussein, M. F. M. The effect of a twin tunnel on the propagation of ground-borne vibration from an underground railway. J. Sound Vib.330 (25), 6203–6222. 10.1016/j.jsv.2011.07.035 (2011). [Google Scholar]
- 21.He, C. et al. Analytical model for vibration prediction of two parallel tunnels in a full-space. J. Sound Vib.423, 306–321. 10.1016/j.jsv.2018.02.050 (2018). [Google Scholar]
- 22.Yuan, Z. et al. Analytical solution for calculating vibrations from twin circular tunnels. Soil. Dyn. Earthq. Eng.117, 312–327. 10.1016/j.soildyn.2018.11.033 (2019). [Google Scholar]
- 23.Yuan, Z. et al. The wave function method for calculation of vibrations from a twin tunnel in a multi-layered half-space. Soil. Dyn. Earthq. Eng.125, 105716. 10.1016/j.soildyn.2019.105716 (2019). [Google Scholar]
- 24.Chen, K., He, X., Liang, F. & Sheng, D. Critical state behaviour of an unsaturated Kaolin mixture. Eng. Geol.338, 107606. 10.1016/j.enggeo.2024.107606 (2024). [Google Scholar]
- 25.Chen, K. & Liang, F. Experimental investigation on the dynamic shear behavior of the unsaturated soil-concrete interface under Cyclic loading. Soil. Dyn. Earthq. Eng.176, 108325. 10.1016/j.soildyn.2023.108325 (2024). [Google Scholar]
- 26.Fredlund, D. G. & Rahardjo, H. Soil Mechanics for Unsaturated Soils (John Wiley & Sons, Inc., 1993).
- 27.Lu, N. & Likos, W. J. Unsaturated Soil Mechanics (John Wiley & Sons, Inc., 2008).
- 28.Bose, S. K. & Mal, A. K. Longitudinal shear waves in a fiber-reinforced composite. Int. J. Solids Struct.9 (9), 1075–1085. 10.1016/0020-7683(73)90016-4 (1973). [Google Scholar]
- 29.He, C. et al. Three-dimensional analytical model for the dynamic interaction of twin tunnels in a homogeneous half-space. Acta Mech.230 (3), 1159–1179. 10.1007/s00707-018-2330-0 (2019). [Google Scholar]
- 30.Di, H. et al. Three-dimensional analytical model for vibrations from a tunnel embedded in an unsaturated half-space. Acta Mech.232 (4), 1543–1562. 10.1007/s00707-020-02892-4 (2021). [Google Scholar]
- 31.Yuan, B., Liang, X. & Zhang, J. K. Optimized reinforcement of granite residual soil using a cement and alkaline solution: A coupling effect. J. Rock. Mech. Geo Tech.17 (1), 509–523. 10.1016/j.jrmge.2024.01.009 (2025). [Google Scholar]
- 32.Yuan, B., Chen, X. & Li, W. J. Sustainability of the polymer SH reinforced recycled granite residual soil: properties, physicochemical mechanism and applications. J. Soils Sediments. 23, 246–262. 10.1007/s11368-022-03294-w (2023). [Google Scholar]
Associated Data
This section collects any data citations, data availability statements, or supplementary materials included in this article.
Data Availability Statement
Data is provided within the manuscript.