

Abstract
Open discectomy remains the standard procedure for decompressing neural structures in cases of intervertebral disc herniation. Early postoperative rehabilitation emphasizes protecting the surgical site while restoring functional independence in daily activities. In the absence of possibilities for performing any spinal control tests within the first few days post-surgery, the dynamism of curvature changes may be the sole criterion for evaluating rehabilitation progress. This study aims to evaluate the feasibility of utilizing the non-invasive KINEOD device to measure the dynamics of lumbosacral spinal alignment parameters in the sagittal plane before and immediately after surgical intervention. The study involved 30 patients (14 women [46.67%] and 16 men [53.33%]) from the Neurosurgical Department of the Wojewódzki Szpital Specjalistyczny in Słupsk, Poland. Data were collected using a custom questionnaire and KINEOD 3D posturography to assess body posture. The following parameters were analyzed: Sagittal Inclination Angle (Sagittal IA), Kyphosis Angle (KA), Lordosis Angle (LA), Sacral Inclination Angle (Sacral IA), Lordosis Measure (LM), Inflection Point (IP), and the Angle of Acromion-Posterior Superior Iliac Spine Rotation (A-PSIS). Measurements were conducted at three stages: Stage I - one day before surgery (2:00 PM); Stage II - on the third postoperative day (7:00 AM); and Stage III - on the third postoperative day (2:00 PM). Measurements utilizing the KINEOD device revealed statistically significant changes between Stage I and Stage II for the following parameters: Sagittal IA, KA, LA, Sacral IA, LM, IP, and A-PSIS. Significant changes were also noted between Stage I and Stage III for KA, LA, Sacral IA, LM, A-PSIS, and VAS. The study highlights that the reliability of KINEOD 3D assessment diminishes when relying solely on parameters such as Sacral IA and IP for postoperative lordosis evaluation. For rapid, non-invasive assessment of the lumbosacral spine post-surgery, Sacral IA may serve as a more accurate indicator of dynamic changes in the lower lumbar region. Postoperative alterations in all sagittal plane angles are influenced by both surgical intervention and, to a lesser extent, the diurnal adaptation rhythm.
Keywords: 3D posturography, Lumbosacral spine, Spinal curvatures, Diurnal variation, Surgery, Discectomy
Subject terms: Rehabilitation, Neurology
Background
Open discectomy remains the primary decompressive procedure for treating lumbar intervertebral disc herniation. In addition to relieving nerve root impingement, it stabilizes the lumbosacral segment by enhancing lumbar lordosis and increasing sagittal canal height1. The procedure also positively impacts motor control in the deep trunk muscles, potentially leading to reduced pain and improved functionality during rehabilitation2.
Rehabilitation plays a pivotal role in the recovery process and must account for changes in spinal geometry caused by surgery, pre-existing deformities, and natural diurnal variations. The specific structure of the spine, composed of intervertebral discs that change volume diurnally, leads to a series of changes impacting spinal function. The decreasing disc height throughout the day influences the lordosis angle alteration, and intra-facet joint pressure values also shift. Consequently, the spine exhibits increased elasticity in the evening hours3. This necessitates incorporating this diurnal process into rehabilitation planning, determining optimal timing and intensity of training loads for postoperative recovery. In the immediate postoperative period, patients often adopt compensatory postures that may contribute to pain and complications. Musculoskeletal instability and deficits in postural control can lead to deviations in all anatomical planes4. Therefore, a well-structured rehabilitation program is essential, with the primary aim of improving spinal alignment in the sagittal plane by addressing the degree of curvature and its reversal. Typical rehabilitation approaches include back muscle strengthening exercises, physiotherapy, and pharmacological treatments2,5,6.
Despite the existence of general rehabilitation guidelines, there is a lack of standardized recommendations for post-spinal surgery recovery. No universal protocols exist that apply to all patients, nor is there sufficient data on the impact of rehabilitation type or duration on clinical outcomes7. Publications proposing various postoperative rehabilitation models often lack detailed information about the optimal timing for initiation and the objective criteria for their application2,8.
A comparative biomechanical analysis of diurnal changes in physiological and pathological spinal curvatures before and after surgery is essential to inform better rehabilitation strategies. Certain surgical procedures, such as anterior lumbar interbody fusion (ALIF), provide not only immediate benefits but also long-term improvements in lumbar lordosis and canal height1. Functional assessment of a patient post-surgery precludes any measurements of lumbar segment mobility (Maxey 2018). This limitation significantly hinders monitoring patient status and assessing rehabilitation progress. The lack of scientific research on changes in spinal geometry at different times of the day in the early postoperative period underscores the need for such comparative studies.
The KINEOD 3D posturograph, a non-invasive device capable of analyzing spinal curvatures in three planes, presents a promising solution5. This tool assesses parameters such as lumbar lordosis and thoracic kyphosis angles, trunk and sacral inclination angles, and the inflection point between thoracic kyphosis and lumbar lordosis and measure of lordosis in the sagittal plane. In the transverse plane, it measures pelvic rotation relative to the shoulder girdle, while in the frontal plane it evaluates lateral deviations.
Multiple non-invasive assessments conducted throughout the day can reveal the natural progression of diurnal fluctuations in spinal curvatures relative to preoperative baseline values. This approach enables continuous monitoring of patient status without the risk of mechanical overload associated with diurnal variations in spinal mobility, facilitating effective control of the return to full functionality immediately after surgery - even through multiple daily evaluations.
Methods
Aim
This study aims to demonstrate the feasibility of utilizing non-invasive KINEOD system measurements to evaluate trends in the changes of lumbosacral spine alignment parameters in the sagittal plane before and immediately after discectomy.
Specific objectives
To analyze changes in spinal alignment in the sagittal plane before discectomy and on the third postoperative day at the same time (2:00 PM).
To examine temporal adaptation in lumbosacral spine alignment on the third postoperative day by comparing measurements taken at 7:00 AM (after sleep) and 2:00 PM (after activity).
Participants
Of the 118 patients initially screened for eligibility, 49 did not meet the inclusion and exclusion criteria. An additional 19 declined to participate, and 20 withdrew during the study: 11 due to early discharge at their own request, 7 due to transfer to a different ward for medical reasons, and 2 for other reasons (Fig. 1).
Fig. 1.

Participant flowchart.
The final study cohort consisted of 30 patients from the Neurosurgery Department of the Wojewódzki Szpital Specjalistyczny in Słupsk, including 14 women (46.7%) and 16 men (53.3%). Before participation, all patients received detailed information about the study protocol, including its indications, contraindications, and objectives. Written informed consent was obtained from all participants. The mean age of the participants was 51.8 years (SD 14.1). Data collection occurred between February 28, 2024, and May 15, 2024.
This study did not assess the safety or efficacy of any new drugs or treatment methods. It was approved by the Bioethics Committee at the District Medical Chambers in Gdańsk (KB-13/24). All methods were performed in accordance with the relevant guidelines and regulations, including the Declaration of Helsinki. Informed consent was obtained from all participants.
Selection criteria
This study included participants aged 18 years or older who were admitted to the Neurosurgery Department of the Wojewódzki Szpital Specjalistyczny in Słupsk, underwent lumbar discectomy, and provided written informed consent. Exclusion criteria included: age under 18 years, postoperative complications within the first few days after surgery, difficulty ambulating during early inpatient rehabilitation, the presence of yellow or red flags in the postoperative period, spinal and/or lower limb deformities, and failure to provide informed oral and written consent.
Research instrument
Postural assessment was performed using the KINEOD 3D posturograph (AXS MEDICAL SAS, 3 Rue Saint-Nicolas BP 41264, F-76068 Le Havre Cedex, France), which employs infrared acquisition technology for comprehensive three-dimensional postural analysis. The following parameters were evaluated:
Sagittal Inclination Angle (Sagittal IA) (Fig. 2): This angle represents the global inclination of the torso axis in the sagittal plane. It is defined by the angle between two lines: one connecting the C7 spinous process to the superior aspect of the median crest of the sacrum at the S1 level, and the other passing through the superior aspect of the median crest of the sacrum at S1 and the deepest point of thoracic kyphosis (Fig. 2A-D).
Fig. 2.

Spinal Curvature Analysis Using KINEOD System. The figure highlights key parameters related to spinal alignment, employing four reference points: (A) denoting the spinous process of the C7 vertebra; (B) representing the inflection point; (C) indicating the superior aspect of the median crest of the sacrum at the S1 level; and (D) marking a point along a line drawn from point C to the deepest point of thoracic kyphosis at the level of point A. These anatomical landmarks facilitate determination of angles critical in biomechanical and anthropometric analyses conducted in this study. Calculated angles include sagittal inclination angle (Sagital IA), kyphosis angle (KA), lumbar lordosis angle (LA), and sacral inclination angle (Sacral IA). Additionally, LM represents the lordosis measure.
Kyphosis Angle (KA) (Fig. 2): This angle is formed at the intersection of two lines: one normal to the anthropometric point at the C7 spinous process along the spinal curvature in the sagittal plane, and another normal to the transition point between kyphosis and lordosis. The transition point is identified by the intersection of the line connecting the C7 spinous process to the superior aspect of the median crest of the sacrum at S1 with the sagittal plane representation of the spinal curve.
Lordosis Angle (LA) (Fig. 2): This angle is formed at the intersection of two lines: one normal to the anthropometric point at the superior aspect of the median crest of the sacrum at S1 along the spinal curvature in the sagittal plane, and another normal to the spinal curve at the transition point between kyphosis and lordosis. The transition point is determined as described above. In the model used to determine lumbar lordosis and thoracic kyphosis angles, increasing the angle values flattens the curves, reducing both lumbar lordosis and thoracic kyphosis. Conversely, decreasing the angle values indicates increased lordotisation of lumbar lordosis or kyphotisation of thoracic kyphosis.
Sacral Inclination Angle (Sacral IA) (Fig. 2): Also referred to as the pseudo sacral slope by the manufacturer, this parameter defines the inclination of the lumbar spine relative to the horizontal plane. It is measured as the angle between the normal to the anthropometric point at the superior aspect of the median crest of the sacrum at S1 along the spinal curve and a line perpendicular to the one connecting the superior aspect of the median crest of the sacrum at S1 to the deepest point of thoracic kyphosis in the sagittal plane (Fig. 1C-D).
Lordosis Measure (LM) (Fig. 2): This parameter represents the distance between the most prominent point of lumbar lordosis and a virtual vertical line passing through the deepest point of thoracic kyphosis at point A (Fig. 2C) and a point along a line drawn from point C to the deepest point of thoracic kyphosis at the level of point A (Fig. 2D).
Inflection Point (IP) (Fig. 2B): The inflection point marks the transition from lumbar lordosis to thoracic kyphosis. It is defined as the intersection of a line connecting the C7 spinous process to the superior aspect of the median crest of the sacrum at S1 with the sagittal plane representation of the spinal curve. This “transition point” divides the segment along a line extending from the superior aspect of the median crest of the sacrum at S1 (Fig. 2C) to the deepest point of thoracic kyphosis at the level of the C7 spinous process (Fig. 2A). This division allows for the percentage contribution of kyphosis and lordosis to the total length of the spinal curve in the sagittal plane to be determined (Fig. 3), enabling the calculation of their relative proportions.
Fig. 3.

Sagittal plane analysis of whole spine curvature. The thoracic kyphosis region is highlighted in red, while the lumbar lordosis region is depicted in green. A scale on the right-hand side indicates the inflection point, delineating the transition between these regions. This scale also displays the percentage distribution of spinal curvature along the total spinal length
Angle of Acromion-Posterior Superior Iliac Spines Rotation (A-PSIS) (Fig. 4): This angle is formed by the lines connecting the acromions to the posterior superior iliac spines (PSISs). The direction of rotation is determined by the angular orientation in space. Measured in the transverse plane, this angle represents the rotation of the shoulder line relative to the pelvis.
Fig. 4.

Analysis of Gibbosity. The “A-A Line” represents a line passing through the acromions, while the “P-P Line” denotes the line connecting the Posterior Superior Iliac Spines (PSIS). The angle of Acromion-PSIS Rotation is indicated on the left side of the figure. The central region displays the percentage distribution of gibbosity surface area, with corresponding areas highlighted.
The study employed a custom-developed questionnaire to gather data on the type and location of spinal surgery, along with findings from neurological examinations. Additional information regarding participants’ occupation, lifestyle, and prior treatments was also collected. Demographic data, including gender, age, weight, and height, were recorded, and Body Mass Index (BMI) was calculated by dividing weight (kg) by height squared (m2). Participants provided details about comorbidities and assessed their pain intensity using a Visual Analogue Scale (VAS), a 10-cm linear scale ranging from 0 (no pain) to 10 (the most intense pain imaginable).
Procedure
Upon admission, patients were informed about the study’s objectives and provided written informed consent using a dedicated information sheet and consent form. Postural assessments and interviews were conducted in a room with natural lighting, ensuring privacy to minimize external influences. Each participant was assessed individually under standardized conditions (ambient temperature: 22 °C).
Measurement protocol
Measurements were taken three times, as shown in Fig. 5. The initial assessment was performed on the day of admission, the one day before surgery, at 2:00 PM. The second measurement took place on the third postoperative day at 07:00 AM, following a prolonged period of bed rest. The third measurement was conducted on the same postoperative day at 2:00 PM, after a period of activity (physiotherapy and non-physiotherapy activities).
Fig. 5.

Experimental procedure flowchart.
Physiotherapy commenced on the first postoperative day and included in-bed exercises such as active free movements, basic exercises preparing for physical activity, muscle pump activation exercises, and range of motion (ROM) maintenance exercises. Assisted standing using a walking frame was also incorporated into the exercise regimen. Patients were instructed to perform these exercises twice daily. On the second day, they continued with exercises from day one but with longer durations of standing and walking without orthopedic support. On the third day, between 07:00 AM and 02:00 PM, patients performed exercises assigned on days one and two with increasing difficulty The difficulty level of exercises was increased by incrementing repetitions, adding external load, extending duration, and introducing more complex activities. Loading progression was tailored to the individual capabilities of each patient.
At the beginning of each assessment stage, a standardized interview was conducted with the patient to gather essential information. Anatomical reference points were then marked on the patient’s body using a marker, including C7 prominence, spinal line (spinous processes), inferior angles of the scapulae, posterior superior iliac spines, and S1. The starting position for assessments involved standing freely facing a uniform background while facing away from the measurement device. Arms were allowed to hang freely alongside the torso (Fig. 6).
Fig. 6.
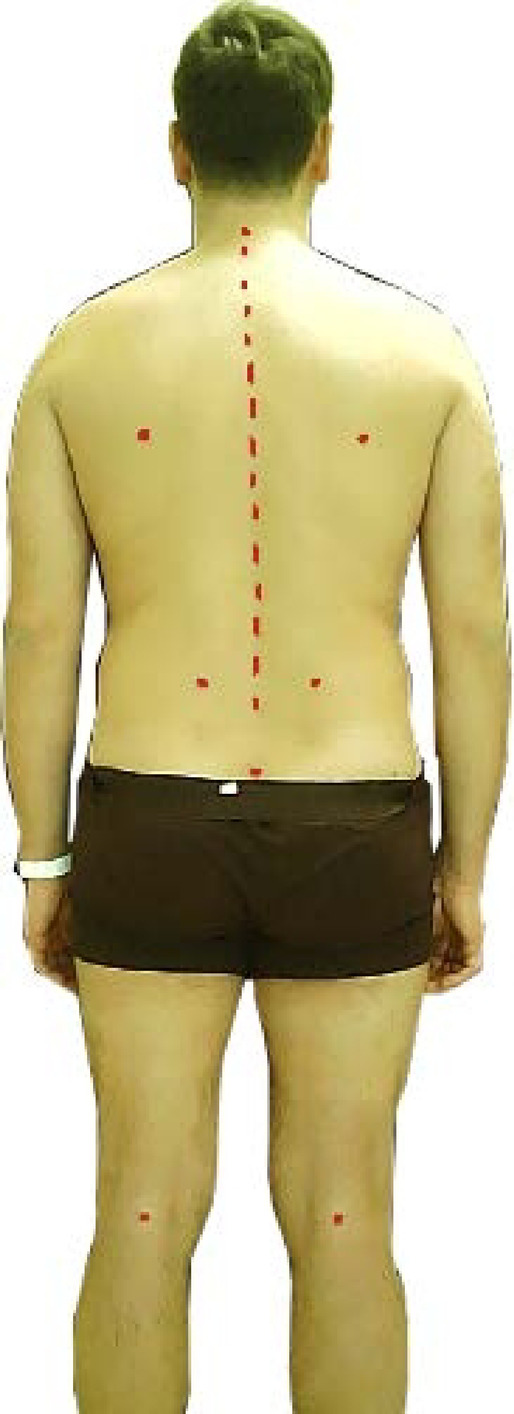
Image illustrating anatomical reference points on a patient. The figure depicts the following anatomical landmarks: the spinous process of the C7 vertebra, inferior angles of the scapulae, vertebral positions along the spinal column (marked with dots on spinous processes), posterior superior iliac spines (PSIS) and the superior aspect of the median sacral crest at the S1 level.
The final step involved scanning the body using infrared imaging technology with the KINEOD 3D posture measurement device. The obtained data was subsequently processed and analyzed.
Statistical analysis
Statistical analysis was conducted using Statistica 13.3 software. Quantitative variables were described by the arithmetic mean, standard deviation, 95% confidence intervals (CI), median and minimum and maximum values (range). Qualitative variables were presented as frequencies and percentages. Initially, the Grubbs test was applied to identify outliers. The normality of the variable distributions was then assessed using the Shapiro-Wilk test, Lilliefors test, Kolmogorov-Smirnov test, and Jarque-Bera test. The Levene test was used to assess the assumption of equal variances. The significance of differences between two independent groups was evaluated using the Student’s t-test for homogeneous variances or the Mann-Whitney U-test when the t-test assumptions were not met. Differences in the same variable across multiple groups, in the absence of normal distribution, were assessed using the Kruskal-Wallis test, followed by a post-hoc test if significant differences were found. For dependent variables, the Wilcoxon signed-rank test was applied when appropriate conditions were satisfied9. Qualitative variables were analyzed using the Chi-square test, Pearson’s Chi-square test, and Fisher’s exact test. Graphs were plotted to illustrate the strength and direction of relationships between variables, aiding in the identification of outliers. A significance level of p = 0.05 was employed in all calculations, and p-values were annotated on the graphs.
Results
The study group consisted of 30 individuals, including 14 females (46.67%) and 16 males (53.33%). Within the age range of the participants, 5 individuals (16.7%) were between 30 and 39 years old, 10 (33.3%) were between 40 and 49 years old, and 15 (50.0%) were aged 50 or older. To determine the sample size, a power analysis was conducted. The most representative variable selected was the Lordosis measure. For this purpose, a one-sample t-test was used. The power analysis revealed that for 30 measurements, the test power was 0.9996. In the next stage, an analysis was performed to determine the sufficient sample size for this variable. The results indicated that to achieve a test power of at least 0.8, a sample of only 10 patients would be sufficient. Table 1 presents the characteristics of the study group. It is noteworthy that there was no statistically significant difference between females and males (p = 0.9529).
Table 1.
Demographic characteristics of the study group.
| Age (Entire Group) [years] (N = 30) |
Age (Females) (n = 14) |
Age (Males) (n = 16) |
|---|---|---|
|
51.83 (14.07) [46.58; 57.09] 48.5 32–82 |
52.00 (14.49) [43.63; 60.37] 48.50 32–82 |
51.69 (14.16) [44.14; 59.23] 48.00 34–73 |
| p-value = 0.95291 | ||
| Height [cm] | Weight [kg] | BMI |
|
172.83 (9.57) [169.26; 176.41] 174 150–189 |
82.13 (17.74) [75.51; 88.76] 81.5 42–130 |
27.39 (5.15) [25.47; 29.32] 26.35 18.67–41.59 |
1 - t-Student test
(N = 30): Mean (SD); [95% CI] of the mean; Median; Range.
Occupation types in the study group included: 4 individuals (13.3%) who reported standing work, 5 individuals (16.7%) with sedentary jobs, 13 individuals (43.3%) with mixed work activities, 7 individuals (23.3%) who were retired or pensioners, and 1 individual (3.3%) who identified as an athlete. Lifestyle was categorized as follows: 11 individuals (36.7%) described themselves as sedentary, 14 individuals (46.7%) as actively moderately engaged, 3 individuals (10.00%) as actively significantly engaged, and 2 individuals (6.7%) as highly active. Previous long-term conservative treatment was utilized by 18 individuals (60%), while 12 individuals (40%) had not undergone such treatment.
Analyzing the type of surgical procedure performed, discectomy with posterior lumbar interbody fusion (PLIF)10 was performed on 3 individuals (10.0%), anterior lumbar interbody fusion (ALIF)10 on 5 individuals (16.7%), transpedicular percutaneous fixation TPF11 on 1 individual (3.3%), and discectomy alone on 21 individuals (70%). Comorbidities were reported by 14 individuals (46.7%) including conditions such as hypertension, diabetes, and others.
Neuroimaging revealed changes at the L3/L4 level in 1 individual (3.3%), at the L4/L5 level in 6 individuals (20.0%), and at the L5/S1 level in 25 individuals (83.3%). Table 2 presents the location of pain complaints within the study group.
Table 2.
Characteristics of the study group regarding pain location.
| Pain location | Pain location |
|---|---|
| Lumbosacral Region Centrally |
Yes 3 (10.00%) No 27 (90.00%) |
| Lumbosacral Region with Radiation to Both Lower Limbs |
Yes 2 (6.67%) No 28 (93.33%) |
| Lumbosacral Region with Radiation to Lower Limb to Knee (Left/Right) |
Yes 8 (26.67%) No 22 (73.33%) |
| Lumbosacral Region with Radiation to Lower Limb Below Knee (Left/Right) |
Yes 14 (46.67%) No 16 (53.33%) |
| Radiation to Both Lower Limbs |
Yes 4 (13.633%) No 26 (86.67%) |
Table 3 presents a comparison between parameters obtained during the first stage of the study, on the day of admission to the ward one day before surgery at 2:00 PM, and parameters obtained three days after the surgical procedure during the second stage of the study at 7:00 AM and the third stage at 2:00 PM.
Table 3.
Comparison of analyzed parameters at three stages of the study. Mean (SD); [95% CI] of the mean; median; range.
| I stage 2:00 (PM) |
II stage 7:00 (AM) |
III stage 2:00 (PM) |
p-value | |
|---|---|---|---|---|
| Sagittal inclination angle [deg] |
5.06 (3.57) [3.73; 6.40] 5.0 -2.0–11.0 |
6.40 (3.66) [5.03; 7.77] 7.0 -1.0 - +13.0 |
5.33 (2.84) [4.27; 6.40] 6.0 0.0–10.0 |
0.0225* 0.6409* 0.0658* |
| Kyphosis angle [deg] |
33.90 (7.18) [31.22; 36.58] 34.5 15.0–46.0 |
25.23 (8.26) [22.15; 28.32] 25.0 3.0–43.0 |
27.77 (7.78) [24.86; 30.67] 28.5 11.0–51.0 |
< 0.0001* < 0.0001* 0.9169* |
| Lordosis angle [deg] |
22.60 (14.50) [17.19; 28.01] 23.0 0.0–52.0 |
12.53 (11.99) [8.05; 17.01] 10.5 0.0–47.0 |
14.57 (12.43) [9.93; 19.2] 12.5 0.0–47.0 |
< 0.0001* < 0.0001* 0.2699* |
| Lordosis measure [mm] |
41.47 (16.26) [35.40; 47.54] 38.0 20.0–82.0 |
25.23 (12.41) [20.60; 29.87] 22.0 0.0–56.0 |
29.83 (14.91) [24.27; 35.40] 25.5 5.0–75.0 |
< 0.0001* < 0.0001* 0.0533* |
| Sacral inclination angle [deg] |
17.30 (10.43) [13.41; 21.19] 16.5 1.0–47.0 |
7.37 (7.93) [4.41; 10.33] 5.5 -5.0 - +33.0 |
6.37 (7.33) [3.63; 9.10] 3.0 -2.0 - +23.0 |
< 0.0001* < 0.0001* 0.5572* |
| Inflection point [deg] |
28.90 (12.66) [24.17; 33.63] 30.0 0.0–48.0 |
21.47 (12.40) [16.84; 26.09] 22.0 0.0–49.0 |
24.53 (13.04) [19.66; 29.40] 26.0 0.0–48.0 |
0.0016* 0.0574* 0.1786* |
| Acromion-PSIS rotation [deg] |
-0.43 (2.74) [-1.46; 0.59] 0.0 -5.0 - +4.0 |
-2.23 (5.07) [-4.13; -0.34] -2.0 -17.0 - +6.0 |
-0.27 (4.29) [-1.87; 1.34] 0.0 -12.0 - +8.0 |
0.0062* 0.0029* 0.7933* |
| VAS |
5.93 (2.26) [5.09; 6.78] 6.0 1.0–10.0 |
— |
4.17 (2.10) [3.38; 4.95] 4.0 1.0–10.0 |
0.0008 1 |
1 – Paired t-test;
* − 1) Stage I (2:00PM) vs. Stage II (7:00AM); 2) Stage I (2:00PM) vs. Stage III (2:00PM) 3) Stage II (7:00AM) vs. Stage III (2:00PM)
Figure 7A illustrates changes in the average lordosis angle at three stages: pre-operative measurement at 2 PM (Fig. 7AI), post-operative day three at 7 AM (Fig. 7AII), and post-operative day three at 2 PM (Fig. 7AIII). Vertical bars represent 95% confidence intervals of the mean. The average pre-operative lordosis angle measured at 2 PM was 22.60 [deg] (Fig. 7AI), which significantly decreased to 12.53 [deg] by day three at 7 AM (p < 0.0001) (Fig. 7AII). On day three, a slight increase occurred from 7 AM to 2 PM, reaching an average of 14.57 [deg] (p = 0.2699) (Fig. 7III). The difference between the lordosis angle measured pre-operatively at 2 PM (Fig. 7AI) and post-operatively on day three at 2 PM is statistically significant (p < 0.0001) (Fig. 7AIII).
Fig. 7.

A Lordosis angle [deg]; B - Lordosis measure [mm]; C - Sacral inclination angle [deg], D - Inflection point [%]: I–I stage, II–II stage; III–III stage. Interaction chart (****: p < 0.0001; ***: p < 0.001; ns p > 0.05).
Figure 7B displays changes in lordosis measure, where the average value before surgery measured at 2 PM (Fig. 7BI) was 41.47 [mm]. On post-operative day three at 7 AM, the average lordosis measure significantly differed from pre-operative values, standing at 25.23 [mm] (p < 0.0001) (Fig. 7BII). A slight increase occurred on day three between 7 AM and 2 PM, reaching an average of 29.00 [mm] (p = 0.0533) (Fig. 7BIII). The difference between the lordosis measure at pre-operative measurement (Fig. 7BI), and post-operative measurement on day three (Fig. 7BIII) is statistically significant (p < 0.0001).
Figure 7C depicts changes in sacral inclination angle across all three stages. Angle values are expressed in [deg]. The average values of this angle decrease with each successive stage. Pre-operatively, the average value was 17.30 [deg] (Fig. 7CI) within a 95% confidence interval ranging from 13.41 to 21.19 [deg]. On post-operative day three, the range of values within the confidence interval slightly decreased while the mean value dropped to 7.37 [deg] (Fig. 7CII). On day three, the confidence interval remained close to that of stage two, and the average value further decreased to 6.37 [deg] (Fig. 7CIII). The difference between stages I and II, as well as stages I and III, is statistically significant (p < 0.0001).
Figure 7D shows changes in inflection point across all three study stages. At the pre-operative stage, the average inflection point value was 28.90 [%] (Fig. 7DI). On post-operative day three, it significantly decreased (p = 0.0016) to 21.47 [%] (Fig. 7DII). By day three, there was a tendency for the inflection point to return towards its initial value, increasing to 24.53 [%] (Fig. 7DIII).
Figure 8A presents the average values of sagittal inclination angle in [deg]. Pre-operatively, the average value of this angle was 5.07 [deg] (Fig. 8AI). On post-operative day three, it increased to 6.40 [deg] (p = 0.0225) (Fig. 8AII), and then decreased on day three to an average of 5.33 [deg] (Fig. 8AIII).
Fig. 8.

(A) Sagital inclination angle [deg]; (B) Acromion-PSIS rotation [deg]; (C) Kyphhosis angle [deg]; (D) VAS Scale: I - I stage, II - II stage; III - III stage. Interaction chart (****: p < 0.0001; ***: p < 0.001; **: p < 0.01; ; *: p < 0.05; ns p > 0.05).
Figure 8B shows the acromion-PSIS rotation in [deg]. Pre-operatively, the average value was − 0.43 [deg] with a standard deviation ranging from − 1.46 to 0.59 [deg] (Fig. 8BI). On post-operative day three, this value significantly changed (p = 0.0062) and reached an average of -2.23 [deg] (Fig. 8BII) with a range from − 4.13 to -0.34. By day three, the value shifted closer to its initial value at 0.27 [deg] (Fig. 8BIII), within a slightly wider range of -1.87 to 1.34. Statistically significant differences were observed between stages I and II as well as stages II and III (Fig. 8B).
Figure 8C illustrates changes in kyphosis angle across all three study stages. Pre-operatively, the average kyphosis angle was approximately 33.90 [deg] (Fig. 8CI). On post-operative day three, the average value decreased to 25.23 [deg] (Fig. 8BII), and by day three it increased again to 27.77 [deg] (Fig. 8BIII). Statistically significant differences were observed between stages I and II as well as stages I and III.
Figure 8D compares the intensity of pain measured using the VAS at stages I and III. A statistically significant decrease (p < 0.001) was observed in reported pain levels from 5.93 (Fig. 8DI) to 4.17 (Fig. 8DIII).
Discussion
This study aimed to elucidate the trends in lumbosacral spine alignment parameter changes within the sagittal plane before and immediately following discectomy, as well as analyze the variability of these parameters throughout the day. Restoring physiological spinal alignment postoperatively across all planes enables individuals to perform basic activities with minimal energy expenditure. Physiologically, sagittal curvatures, a straight spine in the frontal plane, balanced tension within spinal ligaments, and activation of internal anterior and posterior muscular bands facilitate prolonged maintenance of a painless upright posture. However, progressive loss of lumbar lordosis may result in pain and disabilities reported by patients. As noted by Schwab F. et al. (2010), the maintenance of adequate lumbar lordosis is crucial for preventing adverse outcomes, such as chronic pain and postural instability12. Changes in intervertebral disc height are linked to the osmotic pressure of proteoglycans, which absorb water overnight when the spine experiences less load13. During the day, under loading, water is expelled from the discs, resulting in a height reduction of approximately 10%. Up to two-thirds of this height loss occurs within the first three hours after standing upright14,15. This phenomenon increases spinal mobility but simultaneously elevates the risk of lumbar disc and ligament injuries, particularly in the morning16–18. All these changes can be reflected in spinal curvatures. Their normative values exhibit significant variability across different authors. Schwab F. et al. (2010), based on radiographic image analysis, reported the following average values for spinal curvature angles: (1) Sagittal vertical axis (SVA): -20 to 35.2 ± 19.4 [deg]; (2) Thoracic kyphosis (T4-T12): 41–53 ± 8 [deg]; (3) Lumbar lordosis (L1-S5): 42.7 to 66.4 ± 5.4 [deg]; (4) Pelvic incidence (PI): 50.6 to 53.1 ± 5.3 [deg]; (5) Pelvic tilt (PT): 11.1 to 15 ± 3.2-7 [deg]; (6) Sacral slope: 30 to 41 ± 4.1-9 [deg]12.
Our study observed a significant decrease in the average lordosis measure on postoperative day three, indicating flattening from 41.4 [mm] (Stage I) to 25.23 [mm] (Stage II). However, this value increased over the subsequent 24 h, rising from 25.23 [mm] at 7:00 AM (Stage II) to 29.00 [mm] at 2:00 PM (Stage III). Although a return to pre-operative values was not observed on day three, an upward trend was evident in the daily analysis (7:00 AM-2:00 PM).
The conducted study reveals statistically significant changes in lordosis measurement, demonstrating its flattening. Although its value on the third postoperative day does not yet reach the baseline level, a noticeable increase in this parameter is evident in daily analysis. This pattern aligns with the previously discussed process of increased spinal mobility in the morning hours due to the diurnal dynamic dehydration of intervertebral discs. The frequency and timing of measurements were constrained by the neurosurgical ward’s schedule, limiting assessment to specific times throughout the day. The dynamic change in this parameter suggests it could potentially achieve even greater values by the end of the day.
When assessing lordosis angle at this stage of convalescence, it is crucial to consider the proper lordosis distribution index (LDI). LDI represents the ratio of the lower lordosis arc L4-S1 to global lordosis (L1-S1) and ranges from 0 to 100, characterizing increasing lordosis towards lower segments. In healthy individuals, LDI should range from 50 to 80%19.
Similar studies by Hirpara et al. demonstrate that the largest change in lordotic angle occurs in the L4-S1 segment for patients operated on at levels L4-L5 and L5-S1, with a value of 7.5 [deg] out of a total change of 10.7 [deg] measured approximately 1.5 years postoperatively20. Other studies demonstrate a statistically significant increase in lordosis in patients measured two years post-surgery, alongside its positive impact on functional quality assessed using the Oswestry Disability Index (ODI) and subjective pain rating21.
Changes in lordosis angle values translate into changes in sacral inclination angle, measured as 17.30 [deg] pre-operatively, 7.37 [deg] post-operatively in the morning, and 6.37 [deg] post-operatively in the afternoon on the same day. The relationship between pelvic alignment and the lumbar spine is a crucial determinant of sagittal balance22.
The highest correlation in healthy individuals was found between lumbar lordosis (global lordotic curvature) and sacral inclination angle, with an r-value of 0.85. This data led to a classification system considering sacral inclination. Four main types of lumbar lordosis were identified23. Type assignment relied on the interrelationship between parameters such as sacral inclination angle (IA), lordosis angle (LA), and inflection point (IP). The authors also present several biomechanical parameters associated with each type, which can significantly influence patient condition and contribute to generating local stresses in the lumbosacral spine.
While this study does not aim to establish individual correct curvature values for each patient – as determining such values would require considering all parameters individually according to their curvature model – it is worth noting that alongside changes in lordosis angle, statistically significant correlations (p < 0.001) with sacral inclination angle (Sacral IA) are observed24.
Figures 8 A-C demonstrate that these parameters simultaneously increase at each measurement stage, exhibiting a correlation coefficient. Changes in sacral inclination angle (Sacral IA) may better illustrate changes in the lower part of lordotic curvature. Thus, this parameter, in conjunction with the lordosis measure, could provide a more reliable method for quickly assessing lumbar spine parameters using the KINEOD 3D system. According to Caglar’s Y. et al. research, changes in this angle can indicate altered lordosis distribution leading to local overloads24. Detailed correlations of these two parameters are presented in Fig. 8 A-C, revealing statistically significant positive correlations ranging from 0.7658 to 0.8474. These figures demonstrate a simultaneous increase in lordosis angle (LA) and sacral inclination angle (Sacral IA) in each measurement.
A compensatory adjustment in sacral inclination angle (Sacral IA) is observed to counterbalance changes in lumbar lordosis. As Sun Z. et al. demonstrated, patients with type 1 and 2 Roussouly spine configurations might experience insufficient pelvic compensation if lumbar lordosis is excessively corrected. This imbalance can lead to difficulties in postural control during sitting, as the torso tends to uncontrollably lean backward25.
Lack of pre-operative measurements at 7:00 AM prevents comparative analysis before and after surgery. Understanding these baseline values could elucidate when and at what time of day the postoperative spine achieves lordosis angle (LA) and inclination angle (IA) values conducive to functional recovery without risking unnecessary strain. In this scenario, non-invasive analysis utilizing KINEOD 3D posturography could provide valuable data to mitigate potential rehabilitation complications associated with overloading in the early days following surgery.
Spinal rotation, alongside lateral bending and flexion-extension, constitutes a component of feedback mechanisms within the spine (Panjabi M.M., 1980). While reduced rotational values can be easily compensated by other spinal components, maintaining appropriate rotation is crucial for establishing a neutral position. According to Fryette laws, this refers to the alignment where articular surfaces reside in a resting state, situated between the beginning of flexion and the onset of extension26,27. Our findings reveal no statistically significant difference in rotational angle measurements between the acromion line and the PSIS line on stages I and III. However, we observe an average change of 2 [deg] in this angle during stage II measurements at 7:00 AM, following prolonged recumbency, compared to stage III at 14:00 after activity.
These fluctuations suggest potential spinal deformities arising from habitual sleeping positions. According to Fryette’s third law, movement within an intervertebral joint in one plane automatically reduces the range of motion in the other two planes26,27. Consequently, these deviations can contribute to overloading during certain postures and disrupt normal movement patterns during transfers, potentially leading to end-range joint loading and posing a risk to operated segments. Although results indicate a correction of this rotation throughout the day, it’s worth considering if conscious patient positioning postoperatively could prevent spontaneous compensations. Their presence might compromise treatment control and contribute to the development and reinforcement of pathological compensations28–30.
Another parameter closely linked to balanced force distribution in the sagittal plane, ensuring harmonious spinal function, is sagittal vertical axis (SVA), defined as the horizontal distance from the postero-superior corner of S1 to the vertebral midbody of C7 or SPI (Spino Pelvic inclination) defined as the angle between a vertical plumbline and a line drawn from the vertebral body center of Th1 to the center of the bicoxofemoral axis12. Dubousset’s concept of optimal posture in standing describes the “cone of economy,” a narrow range where the body can maintain equilibrium without external support and with minimal effort31.
This concept suggests that a standing individual ideally maintains their center of mass within a restricted range relative to their feet. It is postulated that spinal imbalance necessitates significantly increased energy expenditure for maintaining balance, leading to fatigue and pain32. In this study, the degree of spinal offset is expressed as Sagittal Inclination Angle (Sagittal IA), which demonstrates a statistically significant increase in median angular deviation between Stage I and Stage II. It’s noteworthy that its correction and gradual return towards baseline values occur when comparing morning and afternoon measurements. This implies daily variations in center of gravity, urging caution with morning activities that could further displace it (e.g., washing hair over a sink or applying makeup in a standing position, bringing the face closer to the mirror).
The study established that the lordosis measure (LM) on the third postoperative day decreases by an average of 16.24 mm. This value also undergoes diurnal changes, expressed as an increase of approximately 3.77 mm. However, these findings were not corroborated by measurements of median lordosis angle (LA) changes. It is hypothesized that the decrease in average LA values, signifying increased lordosis depth, resulted from changes in the inflection point (IP) and sacral inclination angle (Sacral IA). These values significantly influence lordosis angle; a reliable assessment of lordosis might require individual case analysis. Notably, a substantial decrease in IP could hinder lordosis angle determination (Fig. 9).
Fig. 9.

Correlations between Lordosis angle [deg] and Sacral inclination angle [deg]. (A) Stage I examination at 2 PM the day before surgery; (B) Stage II examination at 7:00 AM on postoperative day three; (C) Stage III examination at 2:00 PM on postoperative day three.
Therefore, authors suggest that for rapid non-invasive postoperative lumbar spine evaluations, the sacral inclination angle may offer a more accurate representation of dynamic changes occurring in the lower lumbar region (Fig. 10).
Fig. 10.

Example of inability to determine lordosis angle due to inflection point reduction to 0.
There is a lack of research in the literature on repeated measurements of spinal curvature angles in the sagittal plane in the first few days following surgery. The significant variability of the parameters demonstrated in this study could be used to develop a model for incorporating individual functional activities in the first few days after surgery based on an objective pattern, rather than relying on the patient’s subjective assessment of tolerance to exertion as is currently done.
The problem is not made any easier by the statistically significant (p = 0.0008) dynamic changes in the patient’s subjective assessment of pain measured using VAS, which decreased from 5.93 [deg] before surgery (stage I) to 4.17 [deg] after surgery (stage III). Furthermore, a number of biomechanical factors modeling curvatures both before surgery (e.g., assuming long-term unloading positions, significant compensations) and immediately after surgery (fear of damaging the operated segment, indications for limiting range of motion) create a completely new environment for spinal function.
The variability of the aforementioned parameters demonstrated in the study proves that the spine changes its alignment in the first days after surgery, and these parameters can vary even within one day. This phenomenon may influence continuous changes in tolerance to various loads, also considering changes within each day. This suggests the need for further research on loads in different curvature models, which could provide answers about which self-care activities to avoid in the first few days after surgery and which ones to postpone until the afternoon hours. In the longer term, analyzing the changing parameters in the sagittal plane could also contribute to developing a scheme to help identify critical points when introducing new self-care activities in the initial phase and developing a constantly monitored rehabilitation program in subsequent phases.
Clinical implications
The findings of this study hold several crucial clinical implications for postoperative rehabilitation following lumbar spine surgeries. Based on the observed parameters in Table 3, we propose the following practical recommendations: Rehabilitation timing should incorporate diurnal variations in spinal parameters. Morning sessions may necessitate modifications due to reduced lordosis angle and increased sagittal inclination, whereas afternoon sessions can safely encompass more demanding activities as spinal parameters approach preoperative values. Re-education of self-care activities requiring significant lumbar flexion (such as washing hair over a sink, tying shoelaces, or prolonged forward bending postures) should be scheduled for afternoon hours when sacral inclination and lordosis parameters are more favorable. The notable decrease in lordosis measure (approximately 16.24 mm) in the early postoperative period suggests advising patients to temporarily avoid positions demanding full lumbar flexion. Observed changes in acromion-PSIS rotation (particularly pronounced in the mornings after prolonged lying) indicate a need for careful positioning during sleep. Patients should be educated on optimal sleeping positions to prevent entrenchment of compensatory patterns that could jeopardize recovery. Physiotherapists should utilize the sacral inclination angle as a quick, reliable parameter to monitor dynamic changes in the lower lumbar spine, as it demonstrates consistent correlation with lordosis angle across all measurement stages. The gradual improvement in parameters between morning and afternoon measurements suggests that rehabilitation programs should incorporate a progressive increase in activity intensity throughout the day, with more demanding exercises scheduled for afternoons when spinal parameters naturally improve. These clinical applications can optimize postoperative management by providing objective criteria for activity progression and potentially reducing the risk of mechanical overload during the critical early recovery phase.
Strengths and weaknesses of the study
It is essential to consider both the strengths and weaknesses of this study. The conducted research demonstrated the possibility of continuously monitoring spinal curvatures during the rehabilitation of patients directly after surgery in the lumbosacral region. This short, non-invasive assessment provided a range of data allowing us to monitor the dynamics of postoperative curvature formation in all planes and the daily variability occurring on the third day after surgery in patients undergoing treatment.
The specificity of this study required the establishment of strict exclusion criteria, which resulted in a large number of patients being excluded both before and during the study. This precluded a comparison of the analyzed curvatures in patients divided into two groups: one undergoing stabilization surgery and another receiving only discectomy. It seems purposeful to supplement the database with additional data to enable an assessment of the influence of spondylodesis, which excludes stabilized segments from movement, on changes in individual parameters and a comparative analysis after 30 days from the date of surgery.
The diverse functional response resulting from structural changes following surgical procedures suggests expanding this research to include a detailed analysis of subjective sensory and functional changes at different times of the day before and after surgery.
While the non-invasive KINEOD 3D device used in this study, enabling multiple measurements within short intervals, presents significant advantages, it possesses notable limitations. It does not offer segmental analysis of upper and lower lumbar lordosis, restricting assessment of lordotic distribution index. Reliability diminishes with substantial inflection point (IP) reduction. Measurement accuracy can be compromised by anatomical variations among patients. The system solely provides a static postural evaluation without assessing internal spinal structures. Combining 3D posturography with other assessment methods is recommended in future research for a more comprehensive understanding.
Conclusions
This study aimed to evaluate trends in spinal curvature angle changes in patients undergoing surgery in the lumbosacral region to inform the development of targeted functional recommendations for optimizing postoperative rehabilitation and facilitating a quicker return to daily, professional, and social activities.
The findings indicate that all parameters assessed using the KINEOD 3D system are influenced by both the surgical procedure and, to a lesser extent, diurnal rhythms. While curvature measurements associated with lumbar lordosis, such as the Lordosis Angle, Sacral Inclination Angle, and Inflection Point, exhibited statistically significant postoperative changes, their interpretation must be individualized, accounting for the specific type of lordosis.
Significant correlations were also observed among selected parameters that largely influence trunk control in both static and dynamic contexts, highlighting shifts in angle values during the initial days following surgery. These results suggest that diurnal rhythms should be considered when evaluating spinal curvatures after lumbosacral procedures. By incorporating daily curvature measurements taken preoperatively, it may be possible to monitor and anticipate moments when postoperative curvature changes reach thresholds that could compromise spinal stability.
Abbreviations
- Sagittal IA
Sagittal inclination angle
- KA
Kyphosis angle
- LA
Lordosis angle
- Sacral IA
Sacral inclination angle
- LM
Lordosis measure
- IP
Inflection point
- A-PSIS
Angle of acromion-posterior superior iliac spine rotation
Author contributions
K.Ł., A.B., and S.G. wrote the main manuscript text; W.N-W. and S.G. prepared figures; A.G. and K.Ł. conceived the study; A.B. and K.Ł. designed the work; W.N-W. acquired the data; S.G. analyzed the data; K.Ł. and S.G. interpreted the data. All authors reviewed the manuscript.
Data availability
Data associated with this study can be found within the Related files section. The full dataset used and analyzed is also available from the corresponding authors upon request.
Declarations
Ethics approval and consent to participate
This study did not assess the safety or efficacy of any new drugs or treatment methods. It was approved by the Bioethics Committee at the District Medical Chambers in Gdańsk (KB-13/24). All methods were performed in accordance with the relevant guidelines and regulations, including the Declaration of Helsinki. Informed consent was obtained from all participants.
Competing interests
The authors declare no competing interests.
Footnotes
Publisher’s note
Springer Nature remains neutral with regard to jurisdictional claims in published maps and institutional affiliations.
Contributor Information
Karol Łosiński, Email: karol.losinski@upsl.edu.pl.
Aleksandra Bryndal, Email: aleksandra.bryndal@upsl.edu.pl.
Agnieszka Grochulska, Email: agnieszka.grochulska@upsl.edu.pl.
Wojciech Nawos-Wysocki, Email: wojciech.nawos-wysocki@upsl.edu.pl.
Sebastian Glowinski, Email: sebastian.glowinski@upsl.edu.pl.
References
- 1.Nguyen, A. Q. et al. Increased cage angle effects on radiographic outcomes after stand-alone anterior lumbar interbody fusion. J. Neurosurgery: Spine. 39, 254–262. 10.3171/2023.4.SPINE221283 (2023). [DOI] [PubMed] [Google Scholar]
- 2.Oosterhuis, T. et al. Rehabilitation after lumbar disc surgery. Cochrane Database Syst. Rev.2014 (Cd003007). 10.1002/14651858.CD003007.pub3 (2014). [DOI] [PMC free article] [PubMed]
- 3.Zander, T., Krishnakanth, P., Bergmann, G. & Rohlmann, A. Diurnal variations in intervertebral disc height affect spine flexibility, intradiscal pressure and contact compressive forces in the facet joints. Comput. Methods Biomech. Biomed. Engin. 13, 551–557. 10.1080/10255840903337855 (2010). [DOI] [PubMed] [Google Scholar]
- 4.Drzał-Grabiec, J. et al. The effect of spinal curvature on the photogrammetric assessment on static balance in elderly women. BMC Musculoskelet. Disord. 15, 186. 10.1186/1471-2474-15-186 (2014). [DOI] [PMC free article] [PubMed] [Google Scholar]
- 5.Cîtea, M. A. & Cordun, M. Posture correction for high school students using manual techniques. Sport Soc.2210.36836/2022/2/01 (2022).
- 6.Radziszewski, K. R. Physical exercise in treatment of patients with lumbar discopathy. Ortop. Traumatol. Rehabil. 9, 98–106 (2007). [PubMed] [Google Scholar]
- 7.Barbosa, T. P. et al. Rehabilitation after cervical and lumbar spine surgery. EFORT Open. Rev.8, 626–638. 10.1530/eor-23-0015 (2023). [DOI] [PMC free article] [PubMed] [Google Scholar]
- 8.Sakaguchi, T. et al. Use of a triaxial accelerometer to measure changes in gait sway and related motor function after corrective spinal fusion surgery for adult spinal deformity. J. Clin. Med.1310.3390/jcm13071923 (2024). [DOI] [PMC free article] [PubMed]
- 9.Glowinski, S., Bryndal, A. & Grochulska, A. Prevalence and risk of spinal pain among physiotherapists in Poland. PeerJ9, e11715. 10.7717/peerj.11715 (2021). [DOI] [PMC free article] [PubMed] [Google Scholar]
- 10.Mobbs, R. J., Phan, K., Malham, G., Seex, K. & Rao, P. J. Lumbar interbody fusion: Techniques, indications and comparison of interbody fusion options including PLIF, TLIF, MI-TLIF, OLIF/ATP, LLIF and ALIF. J. Spine Surg.1, 2–18. 10.3978/j.issn.2414-469X.2015.10.05 (2015). [DOI] [PMC free article] [PubMed] [Google Scholar]
- 11.Mohi Eldin, M. M. & Hassan, A. S. Percutaneous transpedicular fixation: Technical tips and pitfalls of sextant and pathfinder systems. Asian Spine J.10, 111–122. 10.4184/asj.2016.10.1.111 (2016). [DOI] [PMC free article] [PubMed] [Google Scholar]
- 12.Schwab, F., Patel, A., Ungar, B., Farcy, J. P. & Lafage, V. Adult spinal deformity-postoperative standing imbalance: How much can you tolerate? An overview of key parameters in assessing alignment and planning corrective surgery. Spine (Phila Pa. 1976). 35, 2224–2231. 10.1097/BRS.0b013e3181ee6bd4 (2010). [DOI] [PubMed] [Google Scholar]
- 13.Velnar, T. & Gradisnik, L. Endplate role in the degenerative disc disease: A brief review. World J. Clin. Cases. 11, 17–29. 10.12998/wjcc.v11.i1.17 (2023). [DOI] [PMC free article] [PubMed] [Google Scholar]
- 14.Hamaguchi, H. et al. Quantitative assessment of intervertebral disc composition by MRI: Sensitivity to diurnal variation. Tomography9, 1029–1040. 10.3390/tomography9030084 (2023). [DOI] [PMC free article] [PubMed] [Google Scholar]
- 15.Jentzsch, T. et al. Diurnal T2-changes of the intervertebral discs of the entire spine and the influence of weightlifting. Sci. Rep.10, 14395. 10.1038/s41598-020-71003-z (2020). [DOI] [PMC free article] [PubMed] [Google Scholar]
- 16.Liu, C. et al. Diurnal variation in hydration of the cervical intervertebral disc assessed using T2 mapping of magnetic resonance imaging. Korean J. Radiol.23, 638–648. 10.3348/kjr.2021.0950 (2022). [DOI] [PMC free article] [PubMed] [Google Scholar]
- 17.Liu, Z. & Fu, C. Application of single and cooperative different delivery systems for the treatment of intervertebral disc degeneration. Front. Bioeng. Biotechnol.10, 1058251. 10.3389/fbioe.2022.1058251 (2022). [DOI] [PMC free article] [PubMed] [Google Scholar]
- 18.Samanta, A., Lufkin, T. & Kraus, P. Intervertebral disc degeneration-current therapeutic options and challenges. Front. Public. Health. 11, 1156749. 10.3389/fpubh.2023.1156749 (2023). [DOI] [PMC free article] [PubMed] [Google Scholar]
- 19.Bari, T. J., Heegaard, M., Bech-Azeddine, R., Dahl, B. & Gehrchen, M. Lordosis distribution index in Short-Segment lumbar spine Fusion–Can ideal lordosis reduce revision surgery and iatrogenic deformity?? Neurospine18, 543–553. 10.14245/ns.2040744.372 (2021). [DOI] [PMC free article] [PubMed] [Google Scholar]
- 20.Hirpara, A., Koshak, C., Marty, E., Gallus, C. & Kleck, C. Outcomes and spinopelvic changes after anterior lumbar interbody fusion with a novel interbody fusion device: A retrospective study. Int. J. Spine Surg.18, 389–399. 10.14444/8621 (2024). [DOI] [PMC free article] [PubMed] [Google Scholar]
- 21.Åkerstedt, J. et al. Change in lumbar lordosis after decompressive surgery in lumbar spinal stenosis patients and associations with Patient-Related outcomes two years after surgery: Radiologic and clinical results from the NORDSTEN spinal stenosis trial. Spine (Phila Pa. 1976). 50, 40–45. 10.1097/brs.0000000000005037 (2025). [DOI] [PMC free article] [PubMed] [Google Scholar]
- 22.Roussouly, P., Gollogly, S., Berthonnaud, E. & Dimnet, J. Classification of the normal variation in the sagittal alignment of the human lumbar spine and pelvis in the standing position. Spine (Phila Pa. 1976). 30, 346–353. 10.1097/01.brs.0000152379.54463.65 (2005). [DOI] [PubMed] [Google Scholar]
- 23.Barrey, C., Jund, J., Noseda, O. & Roussouly, P. Sagittal balance of the pelvis-spine complex and lumbar degenerative diseases. A comparative study about 85 cases. Eur. Spine J.16, 1459–1467. 10.1007/s00586-006-0294-6 (2007). [DOI] [PMC free article] [PubMed] [Google Scholar]
- 24.Yilgor, C. et al. Relative lumbar lordosis and lordosis distribution index: Individualized pelvic incidence-based proportional parameters that quantify lumbar lordosis more precisely than the concept of pelvic incidence minus lumbar lordosis. Neurosurg. Focus. 43, E5. 10.3171/2017.8.Focus17498 (2017). [DOI] [PubMed] [Google Scholar]
- 25.Sun, Z. et al. Variations of sagittal alignment in standing versus sitting positions under the Roussouly classification in asymptomatic subjects. Global Spine J.12, 772–779. 10.1177/2192568220962436 (2022). [DOI] [PMC free article] [PubMed] [Google Scholar]
- 26.Gibbons, P. & Tehan, P. Manipulacje Kręgosłupa, Klatki Piersiowej I Obręczy Biodrowej W Osteopatii15–27 (Edra Urban & Partner, 2011).
- 27.Montanari, S. et al. Experimental ex vivo characterization of the Biomechanical effects of laminectomy and posterior fixation of the lumbo-sacral spine. Sci. Rep.14, 30001. 10.1038/s41598-024-80741-3 (2024). [DOI] [PMC free article] [PubMed] [Google Scholar]
- 28.Huang, X. et al. Risk factors and treatment strategies for adjacent segment disease following spinal fusion (Review). Mol. Med. Rep.3110.3892/mmr.2024.13398 (2025). [DOI] [PMC free article] [PubMed]
- 29.Kiwerski, J. E. & Włodarczyk, K. Fizjoterapia Ogólna (PZWL Wydawnictwo Lekarskie, 2024).
- 30.Wevling, A. & Linqvist Leonardsen, A. C. Positioning the surgical patient—roles, responsibilities and challenges. A qualitative study. J. Adv. Nurs.81, 968–977. 10.1111/jan.16278 (2025). [DOI] [PMC free article] [PubMed] [Google Scholar]
- 31.Dubousset, J. in Three-dimensional Analysis of the Scoliotic Deformity in the Pediatric Spine: Principles and Practice. 479–496 (eds Weinstein, S. L.) (Raven Press Ltd., 1994).
- 32.Schwab, F., Lafage, V., Boyce, R., Skalli, W. & Farcy, J. Gravity line analysis in adult volunteers: Age-related correlation with spinal parameters, pelvic parameters, and foot position. Spine (Phila Pa. 1976). 31, E959–967. 10.1097/01.brs.0000248126.96737.0f (2006). [DOI] [PubMed] [Google Scholar]
Associated Data
This section collects any data citations, data availability statements, or supplementary materials included in this article.
Data Availability Statement
Data associated with this study can be found within the Related files section. The full dataset used and analyzed is also available from the corresponding authors upon request.