

Abstract
Small extracellular vesicles (sEVs) are promising nanocarriers for drug delivery to treat a wide range of diseases due to their natural origin and innate homing properties. However, suboptimal therapeutic effects, attributed to ineffective targeting, limited lysosomal escape, and insufficient delivery, remain challenges in effectively delivering therapeutic cargo. Despite advances in sEV-based drug delivery systems, conventional approaches need improvement to address low drug-loading efficiency and to develop surface functionalization techniques for precise targeting of cells of interest, all while preserving the membrane integrity of sEVs. We report an enhanced gene delivery system using multifunctional sEVs for highly efficient siRNA loading and delivery. The integration of chiral graphene quantum dots enhanced the loading capacity while preserving the structural integrity of the sEVs. Additionally, lysosomal escape is facilitated by functionalizing sEVs with pH-responsive peptides, fully harnessing the inherent homing effect of sEVs for targeted and precise delivery. These sEVs achieved a 1.74-fold increase in cytosolic cargo delivery compared to unmodified sEVs, resulting in substantial gene silencing of around 73%. Our approach has significant potential to advance sEV-based gene delivery in order to accelerate clinical progress.
Keywords: lipid nanoparticles, lysosomal escape, gene delivery, graphene quantum dots, GALA
Graphical Abstract

1. INTRODUCTION
Small extracellular vesicles (sEVs) are lipid nanoparticles that are typically 50–150 nm in diameter and are secreted by most eukaryotic cells.1 sEVs contain various biomolecules on the surface of their lipid membranes or as cargo, with the identity of each corresponding to their cell of origin.1 Their main function is to transport cargo for cell-to-cell communication,2 facilitated by an innate targeting capacity enabled by surface ligands that coordinate site-specific interactions at the cellular level.1,3 This feature has highlighted their role as promising nanocarriers for drug delivery, further supported by their structural and physiological stability in vivo.3 While significant advancements have been made in gene delivery nanocarriers, such as polymeric self-assembly complexes,4 lipid nanoparticles,5 and nanoscale viral vectors,6 there is growing attention for sEVs due to their potential advantages, including their natural origin, and low immunogenicity.7 Therefore, sEVs have emerged as promising nanocarriers for drug delivery in treating a wide range of human diseases, demonstrating safety and therapeutic efficacy in preclinical models and early stage clinical trials.8
Despite recent advances in sEV-based drug delivery platforms, translating these systems into clinical applications entails several remaining challenges.9,10 These include (i) underdeveloped large-scale production and high-purity isolation of sEVs, limiting the availability of sufficient samples for clinical use; (ii) a limited understanding of sEV heterogeneity, resulting in unpredictable effects in the body; and (iii) unsatisfactory efficacy in therapeutic outcomes due to inefficient drug loading methods, coupled with suboptimal targeting to specific cells of interest.2,11-13 Toward addressing challenges with targeting, work has explored the incorporation of antibodies,12 peptides,14 affinity aptamers,15 and glycan ligands16 on sEVs. However, such modifications often result in undesired immune response, poor tissue penetration, and instability that further leads to off-targeting.17 Recent reports have shown that sEVs have preferential and enhanced uptake by their originating cell type, suggesting an opportunity to leverage this inherent homing effect.1 Yet, this homing effect primarily facilitates endocytosis1 and only 24% of endocytosed sEVs escape lysosomes to release their cargo into the cytoplasm18 with the remaining endocytosed sEVs are subject to degradation in the acidic and enzyme-rich lysosomal environment.19 On top of that, sEVs face further challenges in drug-loading efficiency, particularly for larger biomolecules like RNA, as they are naturally occruing lipid vesicles with intact structural integrity.10 Although various loading techniques, such as cell engineering to endogenously load biologic materials into sEVs, have been explored, the yield of biologic loaded sEVs is generally low (<30%) due to intricate biogenesis and cargo sorting mechanisms.10,20 Other techniques has been proposed through exogenous approaches, but often involve rupturing the sEV membrane and revesiculation which can potentially damage the integrity of the sEVs.20-22 Furthermore, the two main methods for RNA loading, sonication, and electroporation, can lead to degradation or structural deformation of RNA due to the heat generated by sonication and the electric shock from electroporation,23,24 which further diminish their therapeutic effect.
Our work aimed to fully harness inherent biological properties of sEVs, particularly their targeting ability, by leveraging two advanced strategies: chiral-assisted gene loading and pH-responsive peptide functionalization.10,25-27 The chiral-assisted loading approach via chiral graphene quantum dots (GQDs) enables effective cargo encapsulation while maintaining the integrity of the sEV membranes. Building on our prior study,10 here we expanded the chiral GQD loading technology by applying it to a new cell type and a different small interfering RNA (siRNA) sequence, demonstrating the adaptability of this method for different cellular sources and siRNA designs. Simultaneously, we introduced a pH-responsive peptide that was anchored onto the sEV surface via a hydrophobic cholesterol insertion in order to enhance lysosomal escape. This approach preserves the structural integrity and biological function of sEVs, particularly their inherent homing effect, to enable efficient siRNA loading, targeted delivery, and cytosolic cargo release. Considering the heterogeneous membrane properties inherent to sEVs depending on their cell of origin,10,28-31 we fine-tuned this system to achieve successful integration without compromising sEV bioactivity or structure. By carefully optimizing and integrating this passive, nondisruptive strategy, we preserves the inherent biological advantages of sEVs, allowing us to fully leverage their synergistic effects for enhanced gene delivery through the sEV homing effect (Figure 1).
Figure 1.

Schematic illustration of siR-DG/GALA-sEVs. (a) Preparation of siR-DG/GALA-sEV and surface charge conversion in response to pH changes. (b) Mechanism of lysosomal escape for siR-DG/GALA-sEVs to achieve cytoplasmic siRNA delivery.
In this study, we utilized sEVs derived from human breast cancer cells, MCF-7, to leverage their inherent homing effect for targeted breast cancer therapy.1 Chiral GQDs as an efficient platform for efficient loading of sEVs was further optimized for a different sequence of siRNA from the ones in prior work.10 Specifically, siTGF-β RNA was used for this work to address chemotherapeutic resistance in breast cancer associated with TGF-β, targeting cellular mechanisms such as migration and proliferation, as well as the stiffened extracellular matrix (ECM).32-35 By utilizing the chiral-specific interaction of GQDs with lipid bilayers,10 we achieved a loading efficiency for siTGF-β RNA of 66.75 ± 5.75%, which is 11.87 times higher than the efficiency obtained through the traditional sonication loading method. Additionally, this loading method preserves the inherent biological functions of sEVs and demonstrates retention and stability for up to 6 h. Furthermore, we synthesized a cholesterol-conjugated pH-responsive fusogenic peptide, GALA, to functionalize sEV membranes through hydrophobic incorporation of a pendant cholesterol attached to the GALA peptide.29,30 These GALA-functionalized sEVs demonstrated enhanced lysosomal escape via pH-responsive charge conversion, increasing cytosolic cargo delivery by 1.74-fold compared to nonfunctionalized sEV controls. As a result, we achieved 73.03 ± 1.57% reduction in TGF-β expression, leading to decreased stiffness of the ECM as evident by impaired scratch closure. This siRNA-mediated ECM disruption in breast cancer cells led to increased drug sensitivity, as supported by combination treatment with doxorubicin (Dox) in both 2D and 3D in vitro models, achieving a notable therapeutic effect. Overall, our work demonstrates synergistic effects of combining targeted uptake through the homing effect with enhanced siRNA loading and cytosolic delivery to cancer cells. This proof-of-concept study not only demonstrates enhanced gene delivery using functionalized sEVs but also inspires future design of engineered synthetic nanocarriers such as liposomes and polymersomes.
2. MATERIALS AND METHODS
2.1. Materials.
Carbon nanofibers (719803), hydrochloric acid (320331), BioTracker 488 Green Nuclear Dye (SCT120), PKH26 (MINI26–1KT), alginic acid sodium salt (180947), calcium chloride dihydrate (CaCl2; 223506), sodium hydroxide anhydrous (NaOH; S5881), and alginate lyase powder (A1603) were purchased from Sigma-Aldrich (MO, USA). Sulfuric acid (BDH3068-500MLP), nitric acid (BDH3044-500MLPC), syringe filter (; 76479-010), Fetal bovine serum (FBS; 1300-500), and SylgardTM 184 silicone elastomer (polydimethylsiloxane, PDMS; 102092-312) were purchased from VWR (PA, USA). Dialysis membrane tubing (MWCO, 1 kDa; 20060186) was purchased from Spectrum Chemical Manufacturing Co. (NJ, USA). 1-Ethyl-3-(3-dimethylaminopropyl) carbodiimide (EDC; 22980), Vybrant Multicolor Cell-Labeling Kit (DiI; V22889), Lipofectamine 2000 Transfection Reagent (11668027), Pierce BCA Protein Assay Kits (23225), Gibco trypsin-EDTA (25200072), and LIVE/DEAD Cell Imaging Kit (488/570) (R37601) were purchased from Thermofisher Scientific (MA, USA). N-Hydroxysuccinimide sodium salt (Sulfo-NHS; 56485), and d-cysteine (A110205-011) were purchased from AmBeed (IL, USA). Sodium hydroxide (1310-73-2) was purchased from Ward’s Science (NY, USA). Nitrocellulose membrane (1662807), UView 6x Loading Dye (1665111), and Clarity Max Western Enhanced Chemiluminescence (ECL) Substrate (1705060) were purchased from Bio-Rad (CA, USA). RIPA buffer (9806), antimouse horseradish peroxidase (HRP)-linked secondary antibody (7076), and antirabbit HRP-linked secondary antibody (7074) were purchased from Cell Signaling Technology (MA, USA). Antibeta-actin antibody (sc-47778), Anti-CD9 antibody (sc-13118), anti-CD63 antibody (sc-5275), anti-CD81 antibody (sc-166029), anti-HSP 70 antibody (sc-24), and TGFβ1 siRNA (sc-37192) were purchased from Santa Cruz Biotechnology (TX, USA). Customized Cy5-labeled TGFβ1 siRNA was purchased from BOC Sciences (NY, USA). Anti-TGF-beta1 antibody (21898-1-AP) was purchased from Proteintech (IL, USA). LysoView 594 (70084), and CellBrite Green Cytoplasmic Membrane Dye (30021) were purchased from Biotium (CA, USA). CytoTrace Red CMTPX (22015) and Cell Explorer Live Cell Tracking Kit (22620) were purchased from AAT Bioquest (CA, USA). Eagle’s Minimum Essential Medium (EMEM; 30-2003) was purchased from ATCC (VA, USA). Phosphate-buffered saline (PBS; 21-040-CM) was purchased from Corning (NY, USA). Antibiotic antimycotic (15240096) was purchased from Fisher Scientific (MA, USA). 4% Paraformaldehyde (PFA; 15735-50S), aqueous glutaraldehyde 25% Solution Biological grade (16400), Crystal Violet 1% aqueous (26088-10), UranyLess (22409), and 4% paraformaldehyde in 0.1 M phosphate buffer (15735-50S) were purchased from Electron Microscopy Sciences (PA, USA). Tween-20 (BTNM-0080) was purchased from G-Biosciences (MO, USA). Triton X-100 (25%; GTX30960) was purchased from GeneTex (CA, USA). Cell Counting Kit-8 (ALX-850-039-KI01) was purchased from Enzo Biochem (NY, USA). Cryopres dimethyl sulfoxide (DMSO; 092780148) was purchased from MP Biomedicals (CA). Certified low melt agarose (LM agarose; 161–3111) was purchased from Bio-Rad (CA). 5-[(4,6-Dichlorotriazin-2-yl)amino]fluorescein hydrochloride (5-DTAF; 21811-74-5) was purchased from Chemodex (Switzerland).
2.2. Instruments.
Transmission electron microscopy (TEM; Talos F200i (S), Thermofisher Scientific, MA, USA) was used to confirm the nanostructures. ζ potential values were characterized by a Zetasizer (Malvern Zetasizer Nano ZS, Malvern Instrument Ltd.; Worcestershire, U.K.). Nanoparticle Tracking Analysis (NTA; NanoSight LM10 system, Malvern Instrument Ltd.; Worcestershire, U.K.) was used to measure the size distribution and concentration of the nanoparticles. Confocal laser scanning microscopy (CLSM; A1R-MP laser scanning confocal microscopy, Nikon, Tokyo, Japan) was used to image the sEV and cell profile. Two-photon confocal microscopy (TP-CLSM; Leica Stellaris 8 DIVE Point scanning confocal microscope, Leica Microsystems, Wetzlar, Germany) was used to image 3D spheroid models. Fluorescence was measured by a plate reader (Infinite 200 PRO, Tecan, Männedorf, Switzerland). Circular dichroism (CD) spectrometry (Jasco J-1700 spectrometer, Jasco International Co., MD, USA) was used to measure the absorbance of polarized light. Bruker Tensor 27 Fourier transform infrared (FTIR) spectrometer (Bruker Optics International Co., MA, USA) was used to analyze the attenuated total reflectance (ATR)-FTIR. Mass spectrometer (MS; Thermo Q-Exactive HF, Thermo Fisher, MA, USA) was used to identify the proteins. Western blot and agarose gel images were acquired using two bioimaging systems (Azure 400 and Azure 600, Azure Biosystems, CA, USA). Humidified incubator (MCO-15AC, Osaka, Japan) was used to maintain and incubate all cell lines used in this study. SigmaPlot 10.0 (Systat Software Inc.; Palo Alto, CA, USA) was used to generate all plots of the analyzed data.
2.3. Cell Culture and CLSM Imaging.
Human breast cancer cells (MCF-7) were cultured in EMEM supplemented with 10% FBS and 1% antibiotic–antimycotic acid in a humidified incubator at 37 °C with 5% CO2. The cells were washed with 1× PBS, trypsinized with trypsin-EDTA for passages, and incubated for at least 1 day before any experiment. They were stained with several dyes for imaging under CLSM: CytoTrace Red CMTPX dye for cytosol area staining; CellBrite Green Cytoplasmic Membrane dye for membrane staining; LysoView 594 dye for lysosome staining; and BioTracker 488 Green Nuclear Dye for nuclei staining. The cells were fixed with 4% PFA for 15 min before CLSM imaging.
2.4. Isolation and Characterization of sEVs.
Once MCF-7 cells covered 70–80% of the flask, the cell culture media (EMEM with 10% FBS and 1% antibiotic–antimycotic) was changed to serum-free EMEM after washing three times with 1× PBS. A 1 L aliquot of serum-free EMEM was collected after 48 h and processed using vacuum filtration systems ( pore size; 10040-460; VWR, PA, USA) to remove undesired large debris. The filtered medium was then subjected to ultrafiltration using centrifugal devices (100 kDa cutoff; Spin-X UF Concentrator; Corning, NY, USA) and washed with 1× PBS buffer until a transparent 2 mL sEV suspension was collected. The nanostructure of sEVs was observed under TEM with negative staining by UranlyLess. NTA measurements were performed using diluted sEVs (5000 times dilution; in 1 mL of PBS buffer) and analyzed with the NTA 3.3 analytical software suite. The surface charge of sEVs was measured by a Zetasizer with the Hückel model. sEV marker expressions (CD9, CD63, CD81, and HSP70) were confirmed by Western blotting. sEV membranes were stained with PKH26 for imaging with CLSM.
2.5. Synthesis and Characterization of Chiral GQDs.
The GQDs were synthesized using a modified Hummers’ method based on our previous report as follows:36 A mixture of 0.45 g of carbon nanofiber and 90 mL of concentrated H2SO4 (98%) was stirred for 1.5 h. Then, 30 mL of concentrated HNO3 (68%) was added and sonicated for 1 h, followed by a reaction at 120 °C for 20 h. The reacted mixture was then neutralized using a sodium hydroxide solution. Afterward, the GQDs were purified through dialysis for 3 days in a dialysis bag (MWCO, 1 kDa). The surface modification of GQDs with d-cysteines was carried out through an EDC/NHS coupling reaction as follows:10,37 A 1 mL aliquot of EDC at a concentration of 100 mM was added to 25 mL of the as-synthesized GQDs, followed by stirring for 30 min. Then, 1 mL of NHS at a concentration of 500 mM was added to the mixture and stirred for 30 min. Next, 1 mL of d-cysteines at a concentration of 100 mM was added, and the mixture was allowed to react for 16 h. The final products were purified using a dialysis bag (MWCO = 1 kDa), followed by filtration with a syringe filter. These synthesized chiral GQDs were characterized as follows: The nanostructure and size of the chiral GQDs were analyzed by using TEM under an accelerating voltage of 200 kV. The fluorescence emission of the GQDs was analyzed with a plate reader. The absorption and chiroptical properties of the chiral GQDs were analyzed by using CD spectroscopy. The chemical composition was analyzed by using an FTIR spectrometer.
2.6. Synthesis of Gala and FAM-GALA Peptides.
A cysteine-modified GALA peptide with the sequence of Ac-WEAALAEALAEALAEHLAEALAEALEALAAC-NH24,5 was synthesized by solid-phase methods using a CEM Liberty Blue synthesizer. Fmoc-protected amino acids and TentaGel S RAM resin (0.24 equiv/g, ) were purchased from ChemImpex and used as received. Fmoc was first removed by 20% piperidine in DMF, followed by coupling reactions with diisopropylcarbodiimide (DIC) and Oxyma in DMF under microwave heating. The N-terminus of the peptide was acetylated using 50 equiv of acetic anhydride mixed with 10 equiv of diisopropyl ethyl amine in DMF for 1 h. For the FAM-labeled peptide, the same sequence was prepared, but the N-terminus was further modified with a 6-aminohexanoic acid (Ahx) group so as to yield a sequence of H-(Ahx)WEAALAEALAEALAEHLAEALAEALEALAAC-NH2. FAM was coupled to the N-terminal Ahx linker by mixing 8 equiv of FAM with 3.95 equiv of DIC and 6 equiv of HBTU in 15 mL of DMF and added into the peptide reaction vessel, shaking overnight. The synthesized peptides were cleaved from the resin by treatment with TFA/TIPs/H2O (95:2.5:2.5, v/v/v) for 2 h at room temperature. Following synthesis and cleavage, the solution was then concentrated under a vacuum to remove most of the TFA and the peptides were recovered by precipitation in cold diethyl ether. Crude material was collected after centrifugation and air-dried overnight before purification. The dried crude peptide was dissolved in 0.1% NH4OH DI water. Separation was performed on a reversed-phase bio-C18 flash cartridge (25 g) at a flow rate of 40 mL/min with a linear gradient from 0 to 100% (v/v) acetonitrile (+0.1% NH4OH) in water (+0.1% NH4OH) and monitored at 220 and 280 nm for fraction collection on a Biotage Isolera system. The collected fractions were then verified by electrospray ionization mass spectrometry (ESI-MS, Advion; Supporting Information Figures S3a and S4c). Fractions verified as pure products were combined and lyophilized, yielding a white powder product.
2.7. Synthesis of Cholesterol Linker.
A mixture of 309 mg of cholesterol (0.8 mmol, 1 equiv) and 122 mg of bromoacetic acid (0.88 mmol, 1.1 equiv) was dissolved in 30 mL of anhydrous dichloromethane. Then (0.88 mmol, 1.1 equiv) of DIC and 5 mg (0.04 mmol, 0.5 equiv) of 4-dimethylaminopyridine (DMAP) were added. The solution was left stirring at room temperature for 48 h. After the solvent was removed by rotary evaporation, the mixture was washed with ethanol and dried in a vacuum oven. The white powder product was collected (230 mg, 62%). 1H NMR (400 MHz, CDCl3; Figure S2b): δ 5.39 (d, J = 4.3 Hz, 1H), 4.68 (dtd, J = 12.2, 8.6, 4.2 Hz, 1H), 3.81 (s, 2H), 2.37 (d, J = 8.1 Hz, 2H), 1.56 (s, 3H), 1.03 (s, 3H), 1.77–2.04 (m, 5H), 1.57–1.68 (m, 2H), 1.42–1.54 (m, 5H), 1.04–1.41 (m, 11H), 0.93–1.00 (m, 2H), 0.91 (d, J = 6.5 Hz, 4H), 0.86 (dd, J = 6.6, 1.9 Hz, 7H), 0.68 (s, 3H).
2.8. Synthesis of GALA-Chol and FAM-Labeled GALA-Chol.
The GALA-chol conjugate was synthesized according to a previously reported protocol.6 The GALA peptide (Ac-WEAALAEALAEALAEHLAEALAEALEALAAC-NH2) and FAM-modified variant were conjugated to the cholesterol linker through thioether conjugation with the inserted C-terminal Cys residue. Specifically, 70 mg of purified GALA peptide () was dissolved in 3 mL of dimethyl sulfoxide (DMSO), and 13.4 mg of bromoacetate-cholesterol (1.2 equiv), dissolved in 1.5 mL tetrahydrofuran (THF), were mixed. Then (2% by volume) of DIPEA was added to the mixture, with stirring at room temperature for 1 h. The crude product was purified through a reversed-phase bio-C18 flash cartridge (25 g) at a flow rate of 40 mL/min with a linear gradient from 0 to 100% (v/v) acetonitrile (+0.1% NH4OH) in water (+0.1% NH4OH) and monitored at 220 and 280 nm for fraction collection on a Biotage Isolera system. The collected fractions were then verified by ESI-MS (Figure S3b). Fractions verified as pure products were combined and lyophilized, yielding a white powder product. Similarly to the synthesis of the GALA-Chol conjugate, a FAM-labeled GALA-Chol was prepared by the following steps: 72 mg of purified FAM-labeled GALA peptide () was dissolved in 3 mL of DMSO, and 13.8 mg of bromoacetate-cholesterol (1.36 equiv) was dissolved in 1.5 mL of THF and mixed. Then (2% by volume) of DIPEA was added to the mixture, stirring at room temperature for 1 h. Afterward, the resulting FAM-labeled GALA-Chol was purified as described above with verification and characterization by ESI-MS (Figure S4d). To insert these cholesterol-conjugated peptides, they were incubated with sEVs overnight at 4 °C. After sufficient time for hydrophobic interactions between the cholesterol moiety and the lipid membrane, the mixture was washed four times with 1× PBS buffer using a 100 kDa cellulose centrifugal filter.
2.9. Permeation Efficiency of Chiral GQDs and siRNA into sEVs.
A amount of D-GQDs and siR-DG (binding ratio of siRNA = 2:1) were incubated with 1 × 10⁹ particles/(mL of sEV) at room temperature. The incubated mixture was then washed four times with 1× PBS buffer in a 100 kDa cellulose centrifugal filter to remove excess D-GQDs or siR-DG. The washing times were determined experimentally by analyzing D-GQDs retention rate within the washed-out eluent (Figure S8e-g). The permeation efficiency of D-GQDs into sEVs (DG/sEVs) and siRNA into sEVs (siR-DG/sEVs) was determined using statistical analysis based on a formula from our previous report:10
| (1) |
A aliquot of DG/sEVs or siR-DG/sEVs was loaded on the poly-l-lysine coated slides (63410; Electron Microscopy Sciences, PA, USA) and was fully covered with square cover glasses (2845-18; Corning, NY, USA). The covered area was scanned under a 100× objective with a normal field size. Each scan contained around 30 z-stack images (step size of ) of appearing or disappearing blue (DG/sEV) or red (Cy5-siR-DG/sEV) fluorescent dots. A video showing the appearance and disappearance of blue (DG/sEV) fluorescent dots in one z-stack over 10 s is provided in Video S1. Four z-stack images were captured from random domains. The z-stack images were manually adjusted to set the thresholds and match the diameters of the sEVs (40–140 nm). By counting the blue or red fluorescent blinking sEVs (indicative of permeation) using ImageJ software, we estimated the total number of fluorescent sEV particles (TFEPs). Colocalized fluorescent sEV particles (CFEPs) in z-stack images, between successive image sets, were counted by using ImageJ software with the JACOPx plugin. The total sEVs concentration (TEC) was measured by NTA in particles/mL. For supportive validation, another fluorometric approach, the fluorescent recovery assay, was conducted by using a plate reader. The fluorescence intensity at 360 nm/510 nm (excitation/emission) for D-GQDs was measured and analyzed for intensity changes before and after lysis of sEVs with the biocompatible surfactant, Tween-20.
2.10. Loding Efficiency of siRNA into sEVs.
To determine the number of siRNA molecules carried by individual D-GQDs, we measured the fluorescence quenching in the presence of a fixed concentration of Cy5-siRNA () and varying concentrations of D-GQDs (). As siRNA was attached to D-GQDs, selfquenching occurred and reached a plateau. We used the concentration of D-GQDs as the point of complete (100%) binding to plot the binding efficiency from the quenching data. The loading efficiency of siRNA within sEVs was validated indirectly using agarose gel (1% TBE) quantification.38,39 We quantified siRNA loss by analyzing the washed-out eluent after removal of unbound siRNA from the sEVs. Subsequently, a reverse estimation was conducted to quantify siRNA loading within the sEVs. Data for each round were normalized to the expression level of the naked siRNA group.
2.11. Stability Test of siRNA.
To investigate the protective effect of sEV encapsulation against RNase, siRNA-loaded sEVs were incubated with FBS at 37 °C for 0, 1, 3, and 6 h. After incubation, the sEVs were filtered to remove FBS and treated with a very mild surfactant (0.2% Triton X-100) to induce leakage for siRNA extraction. The samples were mixed with 6× DNA loading buffer and loaded onto a 1% TBE agarose gel containing EtBr. Electrophoresis was performed at 120 V for 30 min. The protected siRNA was visualized in the bioimaging system by excitation at 365 nm.
2.12. Western Blot Analysis.
sEVs or cells transfected with siRNA were lysed with 1× RIPA buffer, and the total protein concentration was estimated using the BCA assay. A amount of protein from sEV lysates or of protein from cell lysates was separated by sodium dodecyl sulfate–polyacrylamide gel electrophoresis (SDS-PAGE). The separated proteins were transferred to nitrocellulose membranes and treated with primary antibodies (for sEVs: anti-CD9, anti-CD63, anti-CD81, anti-HSP70, and anti-β-actin; for cells: anti-TGF-β1 and anti-β-actin). Secondary antibodies (antimouse HRP-linked) were then blotted, and immunoreactive species were detected using an ECL substrate under the bioimaging system. All blot data were normalized to the expression level of β-actin for quantification.
2.13. Image Processing and Quantification.
All CLSM imaging processing and analytical quantification used ImageJ software. Prior to every analysis, the manual conversion of length units from pixels to by the scale bar on the CLSM images was set. The cellular uptake of D-GQD loaded sEVs into cells was quantified using the previously developed imaging process.1 In order to avoid overassessment of D-GQDs signal due to their diffraction, D-GQD signals were quantified as in fluorescence intensity per cell cytosol area. We collected the data of D-GQDs in RawInDen (RID; a.u.) from three z-stack-sets and divided by cytosol area (). Each step size was , ensuring that each D-GQD within each stack was sufficiently spaced apart to avoid redundancy and overcounting. The RID value, representing the sum of all fluorescent intensities in the region of interest (ROI), was measured from montages of three z-projected CLSM images in the blue D-GQD channel. The red area of the cellular cytosol was converted to monochrome (black and white), and the middle image of the z-stack was selected for quantification. The cell cytosol area was quantified using the following equation:
| (2) |
The maximum and minimum gray levels (, ; ) correspond to the maximum (black) and minimum (white) gray values, with set to zero. The fluorescence intensity (FI) per cell cytosol area was then calculated by using the following equation:
| (3) |
All colocalization analyses in this study were statistically quantified as follows: Pearson’s correlation coefficient (PCC) was used to quantify colocalization between two channels (green for GALA-chol and red for sEV membrane; blue for D-GQD within sEV and red for lysosomes within cells). PCC ranges from −1 to 1, with −1 indicating perfect negative correlation, 0 indicating no correlation, and 1 indicating perfect positive correlation, where a higher PCC value reflects greater colocalization.40 The scatter plots for the two channels were generated by using ImageJ software with the JACOPx Plugin. The PC linear plot was derived from these scatter plots followed by calculating the PCC using the following equation:
| (4) |
and denote the intensity values and the average intensity of one channel, respectively, while and denote the intensity values and the average intensity of the counterpart channel, respectively.
2.14. Scratch Assay.
MCF-7 cells were transfected with siRNA-loaded sEVs for 48 h in a 6-well plate. Sterilized pipet tips were used to make scratches. The scratched gaps were monitored at 0, 15, and 25 h postscratch under a light optical microscope. The closure of the scratched gaps was quantified by using ImageJ software. The relative scratched area was normalized to the control (ctrl) group.
2.15. Efficacy Test for Dox Combination Treatments.
For the short-term effect, a cell viability was assessed as follows (Figure S15a): MCF-7 cells were seeded into transparent 96-well plates at a concentration of 1 × 10⁴ cells/well. After 24 h, siRNA-loaded sEVs were added and transfected for 48 h at 37 °C. Dox was added at , and the cells were further incubated for 24 h at 37 °C. Cell Counting Kit-8 reagent was added, and the cells were incubated for 3 h at 37 °C. Relative cell viability was measured by absorbance at 460 nm. The relative cell viability (%) was normalized to the ctrl without the Dox group. For long-term effects, a clonogenic assay was conducted as follows (Figure S15b): MCF-7 cells were seeded into transparent 6-well plates at a concentration of 4 × 10⁴ cells/well. After 24 h, siRNA-loaded sEVs were added and transfected for 48 h at 37 °C. Dox was added at , and the cells were further incubated for 24 h at 37 °C. Cells were then washed, trypsinized, and reseeded into 6-well plates at 500 cells/well. Fresh medium was replaced every 2 days. After 1 week, the medium was aspirated and the cells were washed with ice-cold 1× PBS three times. Colonies were fixed with 6% glutaraldehyde for 5 min at room temperature and stained with 0.5% (w/v) crystal violet for 15 min at room temperature. Each well was photographed, and colony numbers were quantified by using ImageJ software. The relative colony formation (%) was normalized to that of the control group without Dox.
2.16. Cell Spheroids in a Hydrogel Framework and Dox Combination Treatments.
An inverted colloidal crystal (iCC) framework using low-melting agarose, as described in a previous study,41 was employed to form MCF-7 spheroids for Dox effect evaluation after siR-DG/GALA-sEVs treatment. Alginate microgels (e.g., 2.5%w/v, ) were packed via sonication and templated in a 5-DTAF-tagged agarose hydrogel (e.g., 15.6%w/v), with alginate subsequently degraded using alginate lyase and PBS. MCF-7 cells, at >80% confluency, were trypsinized, stained with Cell Explorer blue live cell tracker, and condensed to 1 × 10⁷ cells/mL for seeding. The previous centrifugal method41 was used to seed 5 × 10⁶ cells per run, totaling 1 × 10⁷ cells per framework. The culture medium was refreshed 72 h after cell seeding into the framework.
For DOX response testing after siR-DG/GALA-sEVs treatment, four sample groups were designated: (1) control (i.e., spheroid group without Dox and without sEV), (2) free Dox (i.e., spheroid group only treated with Dox), (3) siR-DG/sEVs (i.e., spheroid group treated with siR-DG/sEVs followed by Dox), and (4) siR-DG/GALA-sEVs (i.e., spheroid group treated with siR-DG/GALA-sEVs followed by Dox). After 96 h postseeding and PBS washing, MCF-7 spheroid frameworks were treated with each sEVs, with or without GALA-peptide, at an amount of 2500 sEVs in 2 mL of fresh medium (for groups (3) and (4)). Other groups received fresh media changes only. After 24 h of sEVs treatment, all samples were washed with PBS and treated with 2 mL of Dox where applicable (groups (2), (3), and (4)), while group (1) received another media change. After 48 h of Dox treatment, the BOBO-3 Iodide in LIVE/DEAD Cell Imaging Kit (488/570) (R37601) was dissolved in the fresh medium and incubated with spheroid-embedding framework for 15 min. Finally, the frameworks were immersed in 2 mL of PBS after being fixed with 2% PFA for 3 h and then washed with PBS.
The live and dead cell signals from spheroids were verified with multiphoton imaging from a point scanning confocal microscope (TP-CLSM; Leica Stellaris 8 DIVE, Leica; Germany). To quantitatively analyze fluorescent signals from Dox-treated spheroids within the framework, we implemented an automated Python-based image processing method for TP-CLSM images, building on previous work41 which is available on Github (https://github.com/HyunsuJeon-ND/BhiCC-Framework-Drug-Testing). Briefly, each channel (blue signal for live cells and red signal for dead cells) was binarized with representative signal ranges (blue, 10–255 in 8 bit scale; red, 50–255 in 8 bit scale), and the areas representing blue and red signals for each -plane were collected (i.e., from blue channel and from red channel). The spheroid viability was calculated following equation:
| (5) |
3. RESULTS AND DISCUSSION
3.1. Characterization of Constituents for Multifunctional sEVs.
To enhance breast cancer targeting and uptake, we selected the human MCF-7 breast cancer cell line as the source of sEVs, taking advantage of their inherent homing effect for preferential ligand–receptor mediated endocytosis.1 Using the size-based ultrafiltration technique, sEVs were isolated from 1 L of serum-free culture medium. The spherical shape and structural integrity of the sEVs were confirmed by transmission electron microscopy (TEM) (Figure 2a). A yield of (4.17 ± 0.26) × 1010 particles/mL and a narrow size distribution of 127.9 ± 47.0 nm were verified by nanoparticle tracking analysis (NTA) (Figure 2b). A distinct and narrow size distribution along with a surface charge of −12.93 ± 0.85 mV indicated the high colloidal stability of the isolated sEVs (Figures 2d and S6i). Furthermore, we observed clear immunoblotted bands for sEV markers CD9, CD63, CD81, and HSP70 in Western blot, confirming the existence of sEVs (Figure 2c). To confirm the homing effect of MCF-7 cell-derived sEVs toward their parent cells, we conducted mass spectrometry (MS)-based proteomics on isolated sEVs to identify ligands (Nucleolin, Neuropilin-1, Fibrinogen, TGF-β) that promote endocytic uptake by their parental cells (Table S1).1,42-45
Figure 2.

Constituents for multifunctional sEVs. Characterization of MCF-7 derived sEVs: (a) Spherical nanostructure analysis by transmission electron microscope (TEM). (b) Size distribution and particle number of sEV analysis by nanoparticle tracking analysis (NTA). (c) sEV marker analysis by Western blot. (d) Surface charge analysis by a Zetasizer (n = 4, mean ± s.e.). One-way ANOVA with Tukey’s post-test. ns, not significant. *p < 0.05; **p < 0.01; ***p < 0.001; ****p < 0.0001. Characterization of chiral graphene quantum dots (GQDs): (e) Nanostructure analysis by TEM. (f) Size distribution based on TEM images (n = 100, mean ± s.d.). (g) Chiroptical property analysis by circular dichroism (CD). (h) Fluorescence intensity (FI) spectra. (i) Chemical composition analysis by Fourier transform infrared (FTIR) spectra. (j) Chemical structures of pH-responsive GALA and cholesterol-conjugated GALA.
Chiral GQDs, a highly efficient platform for siRNA loading into sEVs, were developed by modifying GQDs with chiral amino acids such as cysteine in our previous reports.1,10 The size of D-GQDs (chiral GQDs functionalized with d-cysteine) was 6.88 ± 2.16 nm based on quantitative analysis of TEM images (Figures 2e,f and S1a). The chiroptical activity was demonstrated in circular dichroism (CD) spectra (Figure 2g). The shifts in both the fluorescence spectra (Figure 2h) and absorbance spectra (Figure S1b) further confirmed the chiral functionalization of GQDs. The chemical composition of D-GQDs was analyzed using Fourier transform infrared (FTIR) spectrometry with prominent peaks at 1706 cm−1 (C═O stretching) and 1250 cm−1 (C─N stretching attributed to d-cysteine), compared to GQDs (Figure 2i). It was demonstrated in our previous studies that D-GQDs enhance drug loading, including chemotherapeutic drugs and siRNA, into sEVs without any damage to their structural integrity,10 which is attributed to a selective nanoscale chiral interaction between twisted nanosheet-structured D-GQDs and sEVs lipid bilayers.1
In order to functionalize sEVs for pH-responsive lysosomal escape to facilitate cytoplasmic delivery, we designed the cysteine-modified GALA peptide with a sequence of Ac-WEAALAEALAEALAEHLAEALAEALEALAAC-NH2 and successfully conjugated a pendant cholesterol at the C-terminal Cys residue (GALA-chol) (Figures 2j and S3). By anchoring the cholesterol moiety into the lipid bilayer through hydrophobic interactions, the GALA peptide can be displayed on the outer surface of the sEVs. This spontaneous passive lipophilic interaction46 between cholesterol pendants on GALA and the sEV membrane retained membrane bioactivity of homing ability, while enabling a change in surface charge (Figure 3e) in response to pH reduction, promoting lysosomal escape (Figure 4).
Figure 3.

Optimization of multifunctional sEVs. (a) Confocal laser scanning microscopy (CLSM) images of FAM-GALA-chol functionalized sEVs (109 particles/mL). Each CLSM channel represents the following: green for FAM-GALA; red for PKH26-labeled sEV membrane. (b) Fluorescence recovery of FAM-labeled on GALA-chol before and after sEV membrane lysis (n = 4, mean ± s.d.). Excitation: 490 nm; Emission: 520 nm. (c) CLSM images of D-GQDs loaded sEVs (109 particles/mL). CLSM channel represents the following: blue for D-GQDs as sEV cargo. (d) Permeation efficiency quantified by counting D-GQDs loaded sEVs in CLSM images over the total number of sEVs measured by NTA (n = 4, mean ± s.d.). (e) Charge change comparison of sEVs, GALA-sEVs, and DG/GALA-sEVs in pH 4–7 (n = 4, mean ± s.e.). (f) CLSM images of Cy5-siRNA loaded sEVs (3.33 × 10⁸ particles/mL). CLSM channel represents the following: red for Cy5-labeled siRNA. (g) Permeation efficiency quantified by counting Cy5-siRNA loaded sEVs in CLSM images over the total number of sEVs measured by NTA (n = 4, mean ± s.d.). (h) Loading efficiency quantification based on loss efficiency from flow-through eluent analysis using agarose gel (n = 3, mean ± s.d.). Structural integrity of DG/GALA-sEVs confirmed with analysis using (i) TEM and (j) NTA. Arrows indicate D-GQDs within GALA-sEVs. (k) Agarose gel analysis of siRNA-loaded sEVs after incubation with FBS for 0, 1, 3, and 6 h. (l) Agarose gel analysis of washed-out eluent after siRNA loading into sEVs. One-way ANOVA with Tukey’s post-test. ns, not significant. *p < 0.05; **p < 0.01; ***p < 0.001; ****p < 0.0001.
Figure 4.
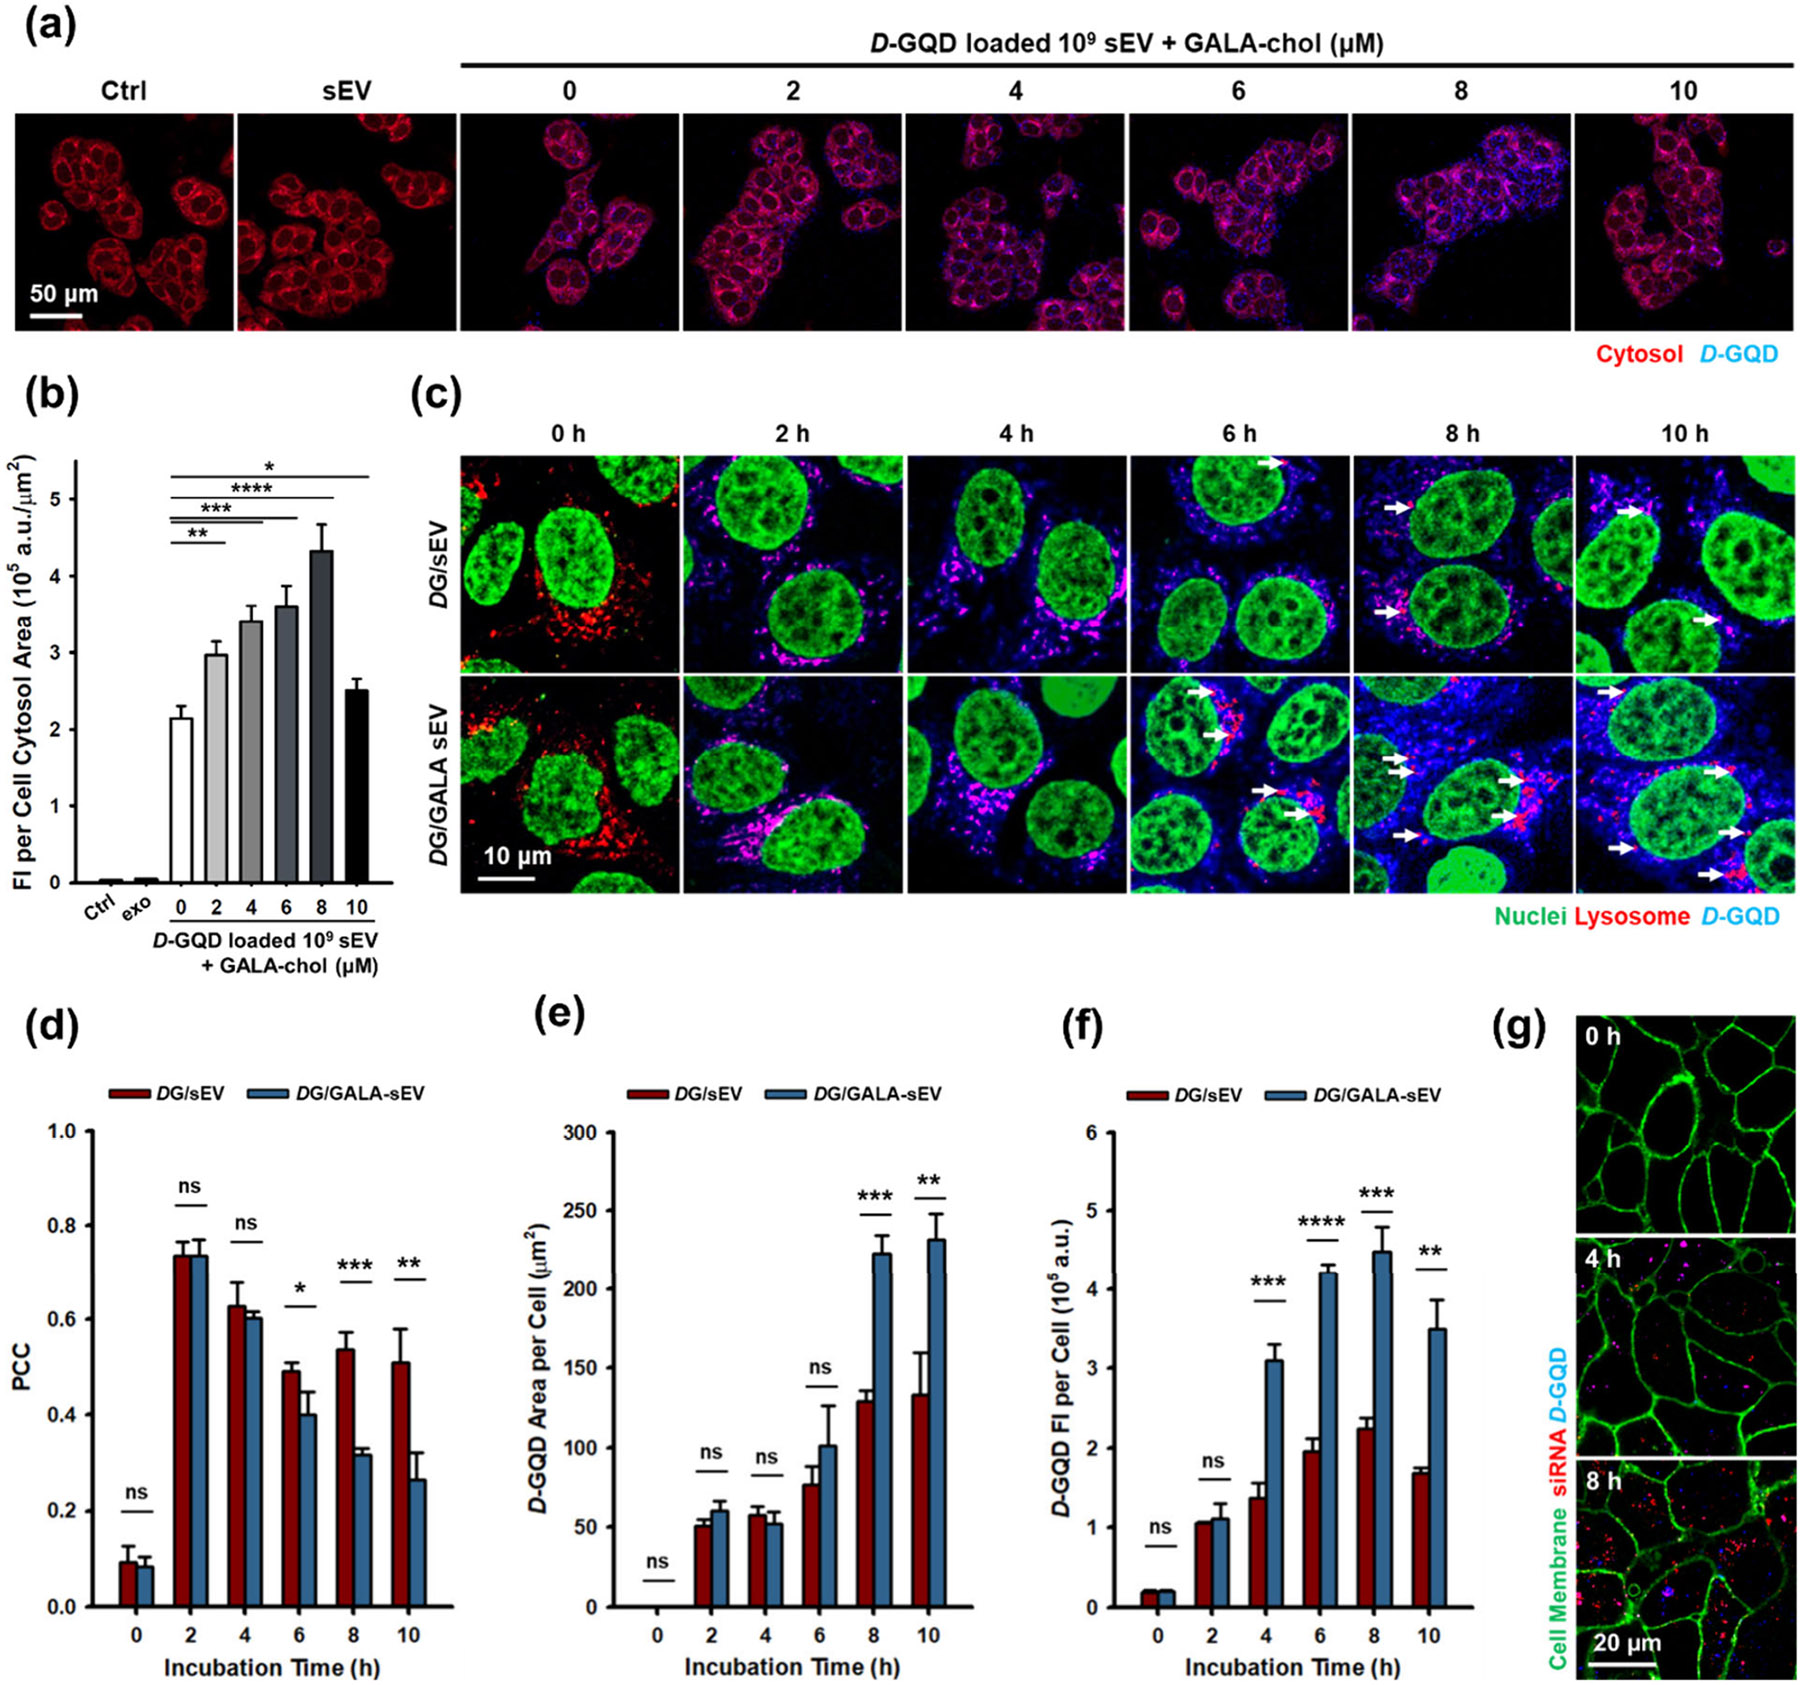
Cellular uptake and lysosomal escape of GALA-sEVs. GALA-chol per 109 sEVs. (a) Cytoplasmic cargo delivery analysis of DG/GALA-sEVs. Each CLSM channel represents: red for the cytosol of MCF-7 cells; blue for D-GQDs as sEV cargo. (b) Quantification of cytoplasmic delivery of DG/GALA-sEV cargo in GALA-chol concentration variants onto 109 sEVs (n = 3, mean ± s.d.). (c) Time-dependent lysosomal escape analysis of DG/GALA-sEVs. Each CLSM channel represents: red for lysosomes within MCF-7 cells; blue for D-GQDs as sEV cargo. Arrows indicate lysosomes without D-GQDs postescape. The quantification (n = 3, mean ± s.d.) of (d) Pearson’s correlation coefficient (PCC) between sEV cargo (D-GQDs; blue) and lysosomes (red), (e) sEV cargo area per cell, (f) sEV cargo FI per cell. (g) siRNA release analysis after cytoplasmic delivery of siR-DG/GALA-sEVs. Each CLSM channel represents: red for Cy5-labeled siRNA loaded within sEVs; blue for D-GQDs as sEV cargo; green for cellular membrane. One-way ANOVA with Tukey’s post-test. ns: not significant. *p < 0.05; **p < 0.01; ***p < 0.001; ****p < 0.0001.
3.2. Optimization of GALA Functionalization and siRNA Loading for sEV.
To confirm the successful hydrophobic insertion of GALA-chol in the sEVs, we further synthesized a fluorescein (FAM)-labeled GALA-chol (FAM-GALA-chol) (Figure S4). To analyze the colocalization with sEVs in confocal laser scanning microscopy (CLSM) images (Figures 3a and S5a), Pearson’s correlation coefficient (PCC) was estimated to be 0.94 ± 0.04, indicating a high correlation between the two channels of the PHK26-stained sEV membrane and FAM-GALA-chol. Additionally, we found that the fluorescence recovery before and after lysis of the sEV membrane exhibited saturation at a concentration ratio of FAM-GALA-chol per 109 sEVs (Figures 3b and S5b). Upon acidification, GALA undergoes a transition to an α-helical structure, exposing its ─NH groups on the surface and shifting its charge from negative to positive. Consequently, both the number of GALA peptides and the length of the exposed sequence on sEVs influence the charge variations across different pH levels.25,27 Additionally, high concentrations of positively charged nanoparticles can induce cytotoxicity.47,48 To address this, we investigated the concentration-dependent effects of GALA peptides on the sEV charge and examined whether GALA-chol efficiently integrates into sEV membranes, achieving a balance of exposure for controlled charge modulation. The findings showed that GALA-functionalized sEVs successfully adjusted their surface charge to neutral or slightly positive values at lysosomal pH conditions (pH 4–5)49 (Figure 3e), promoting lysosomal escape (Figure 4c-f) with minimal cytotoxicity (Figure S10). Notably, the trend in charge shifting remained stable even as the GALA-chol concentration on sEVs increased. Small standard errors (s.e.) were observed with higher GALA-chol concentrations and lower pH levels (Figure S6a-h), likely due to the formation of denser peptide layers that shield some exposed ─NH groups. TEM images showed membrane deformation and rupture at pH 3 in both sEVs and GALA sEVs, while maintaining a spherical shape with structural integrity at pH 4–7 (Figure S7). These results aligned with previous findings that ester linkages in phospholipid molecules can undergo hydrolysis under strong acidic conditions, thereby influencing the stability of the lipid bilayer and altering the structure and function of biological membranes.50 Consequently, the ζ potential distribution of sEVs exhibited very noisy and random peaks due to disrupted structure, unstable morphology, and possibly leakage of sEV cargo (Figure S6l).
To optimize siRNA loading via D-GQD, we compared the permeability of D-GQDs into sEVs before (Pre) and after (Post) GALA-chol functionalization (Figure S8a,b) using a previously reported counting method.10 Both approaches demonstrated high permeation efficiency under CLSM imaging (Figure 3c), yet pre-loading showed a higher permeation efficiency of 80.79 ± 5.19%, compared to 68.10 ± 7.55% for post-loading (Figure 3d). This result was further supported by 1.36 times higher fluorescence recovery in preloading (Figure S8c,d). In addition, the surface charge of GALA-sEVs post-loaded with D-GQD exhibited erratic behavior across different pH levels, whereas GALA-sEVs preloaded with D-GQD maintained consistent surface charge profiles (Figure S8i,j), nearly identical to control GALA-sEVs without D-GQDs (Figure 3e). This is potentially due to the interaction between D-GQDs and GALA peptide,36 thereby inhibiting the pH-response of the GALA peptide. Altogether, we confirmed that pre-loading D-GQDs into sEVs and subsequent functionalization with GALA-chol were preferable techniques. Both approaches are non-aggressive and passive, preserving the innate biological integrity of the sEVs,10,46 as further evidently demonstrated by NTA and TEM analysis (Figure 3i,j).
D-GQDs interact with siRNA via pi stacking and thus enhance siRNA loading into sEVs due to high permeation efficiency of siRNA/D-GQD complex (siR-DG) into sEVs.10,51 In this work, we utilized siTGF-β RNA (Table S2) as a proof-of-concept for our sEV-based gene delivery system to overcome drug resistance in combination with chemotherapy.32 We characterized the complex of Cyanine5-labeled siRNA (Cy5-siRNA) on D-GQDs through fluorometric analysis (Figure S9a,b) and determined that each D-GQD was able to carry two siRNA molecules. Next, we loaded these siR-DG into sEVs and compared them with sEVs loaded with siRNA using traditional sonication methods.3,52,53 Based on previously reported quantification using CLSM images,10 the D-GQD loading method achieved a superior siRNA permeation efficiency of 63.46 ± 4.07%, which is 8.82 times higher than the 7.21 ± 1.46% efficiency with sonication (Figures 3f,g and S9d). Additionally, we further confirmed the loading of siRNA into sEVs by an agarose gel quantification method. Quantifying siRNA loss in the flowthrough eluent after washing unloaded siRNA (Figure S9c) confirmed that the D-GQD method achieved a loading efficiency of 66.75 ± 5.75%, which is 11.87 times higher than the 5.62 ± 5.41% efficiency with sonication (Figure 3h,l) and is nearly consistent with CLSM imaging results. Here, the size of D-GQDs has been tuned to match the thickness of sEV lipid bilayers, ranging from 4 to 7 nm.54 This size compatibility of D-GQDs, combined with their nanoscale chiral structures and chemical composition, allows them to carry RNA sequences and effectively permeate lipid membranes without compromising the structural integrity of the sEVs.1,10 In previous studies, this chiral-assisted loading method successfully delivered small molecules, such as the chemotherapeutic agent doxorubicin (543.525 g/mol), as well as short RNA sequences (19 bp).10 However, loading larger biomolecules, such as antibodies55 or mRNA (which ranges from a few hundred to several thousand nucleotides)56-58 presents a challenge due to their size relative to the chiral GQDs. Accordingly, further exploration and optimization of this approach are necessary to enable the effective loading of larger molecules into sEVs. To verify the stability of siRNA in sEVs after loading, we examined the integrity of siRNA loaded in sEVs in the presence of FBS, mimicking biological conditions with enzymes such as nucleases.59 The results showed that siRNA loaded into sEVs via D-GQDs exhibited good retention and stability for 6 h, whereas siRNA loaded into sEVs by sonication was not protected from nuclease degradation and showed stability similar to that of free siRNA (Figure 3k). This result further supports the advantages of our chiral-assisted siRNA loading in maintaining the structural integrity of sEVs.
3.3. Enhanced Cellular Uptake and Lysosomal Escape of GALA-sEVs.
Chiral GQDs have been used as a model traceable sEV cargo due to their unique optical properties and high permeation efficiency into sEVs.1 We utilized this feature to examine the cellular uptake and lysosomal escape of our GALA-sEVs. First, we validated that D-GQD loaded GALA-sEVs (DG/GALA-sEVs) did not induce cytotoxicity themselves (Figure S10). To investigate the effect of GALA-chol concentration on sEV uptake enhancement, we conducted quantitative analysis of CLSM images to compare the distribution of D-GQDs within the cells (Figures 4a and S11). As the concentration of GALA-chol increased to the previously observed saturation point of per 109 sEVs, enhanced cytoplasmic delivery was evident for sEV cargo, represented by D-GQDs, via lysosomal escape through pH-responsive GALA-sEVs (Figure 3b). However, at GALA-chol per 109 sEVs, the cytoplasmic delivery rate decreased to a level between that of non-functionalized sEVs and GALA-chol functionalized sEVs. This is attributed to the steric repulsive effect reported for lipid nanoparticles,60 where a high level of added ligands prevents the interaction of targeting groups. Thus, we demonstrated that functionalizing sEVs with the GALA peptide through hydrophobic incorporation not only retained membrane bioactivity, including targeting ability, but also enhanced cytoplasmic cargo delivery up to an optimal concentration of GALA-chol per 109 sEVs, tuned to avoid exceeding levels that block ligand-mediated homing effect. These optimized GALA-functionalized sEVs were then used in all subsequent tests.
Next, we investigated the escape of cargo in DG/GALA-sEVs from the lysosome using CLSM image analysis (Figures 4c and S12). For statistical analysis of colocalization between red-stained lysosomes and the sEV cargo represented by D-GQDs, we compared the PCC values by quantifying the similarity in pixel intensity between the two channels (Figure 4d). The PCC values for both sEVs and GALA-sEVs were similar up to the reported saturation time for endocytic uptake of sEVs (4 h).18 However, the PCC value of GALA-sEVs decreased from 6 h onward, while sEVs showed no significant change over time. Due to effective lysosomal escape and cargo release from GALA-sEVs, the colocalization of lysosomes and D-GQDs decreased, indicated by arrows in Figure 4c. This was further supported by the quantification of the D-GQD area per cell, indicating a notable increase in the cytosolic distribution of D-GQD for GALA-sEVs compared to sEVs, particularly after 6 h (Figure 4e). Moreover, the cholesterol component of chol-GALA, used to anchor the peptide within the sEV lipid bilayer, has been shown to regulate membrane fusion proteins and intermediates.61,62 Its presence here may likewise enhance the fusion between sEVs and lysosomal membranes, contributing to the release of cargo into the cytosol.
To assess the ability of enhancing siRNA using GALA-sEVs, we imaged the cellular uptake of siR-DG-loaded GALA-sEVs (siR-DG/GALA-sEVs) (Figures 4g and S13). After 4 h of incubation, most Cy5-siRNA and D-GQDs colocalized as purple dots within the cytosol, indicating that the complex was maintained after cellular uptake. Remarkably, siRNA was separated from D-GQDs at 8 h and released into the cytosol, the cellular site of siRNA function.63 This phenomenon was previously investigated by a time-dependent shift in GQD fluorescence peaks during cellular uptake,64 resulting in decreased fluorescence intensity (FI) of D-GQDs per cell after reaching a peak value at 8 h during lysosomal escape (Figure 4f). This characteristic highlights the advantage of D-GQD loading platforms, which do not require additional mechanisms for siRNA release and therefore simplify the design of drug delivery systems.
3.4. Efficient TGF-β Silencing and Synergistic Combination Therapeutic Effects.
TGF-β is associated with fibrogenic signaling, leading to the deposition of a collagenous and stiff ECM in the tumor microenvironment (Figure 5a). This hinders drug penetration, induces chemotherapeutic resistance, and promotes tumor relapse.32 Specifically, TGF-β signaling is associated with doxorubicin (Dox) resistance.65 In this study, we aimed to silence TGF-β in breast cancer cells to enhance Dox sensitivity and achieve a synergistic therapeutic effect for breast cancer treatment. Hence, we delivered siRNA against TGF-β1 in breast cancer cells using GALA-sEVs containing siRNA loaded with D-GQD. First, we verified the silencing efficiency of siRNA in MCF-7 cells to determine the optimal dose and transfection time with a common transfection agent, Lipofectamine 2000 (Figure S14a,b). Subsequently, we evaluated GALA-sEVs loaded with siRNA via D-GQDs for their gene delivery efficacy and compared these to sEVs loaded with siRNA using conventional methods such as transfection and sonication.52 Western blot analysis confirmed dose-dependent TGF-β1 silencing following siRNA transfection with siR-DG/GALA-sEVs, showing significant gene knockdown of over 50% starting from 0.5k sEVs per cell (Figures 5b,d and S14d). Additional Western blot analysis confirmed superior gene silencing for siR-DG/GALA-sEVs, mediated by pH-responsive lysosomal escape, with the following relative gene expression levels: 26.97 ± 1.57% for siR-DG/GALA-sEVs, 47.51 ± 10.14% for siR-DG/sEVs, and 51.07 ± 9.03% for siR-Lipo/sEVs (Figures 5c,e and S14e). The silencing by siR-DG/sEVs without GALA peptide was competitive with that for siR-Lipo/sEVs. These results demonstrated effective drug loading using D-GQD, which offers a high loading efficiency while preserving sEV integrity. This approach could overcome challenges of transfection methods that include potential toxicity, reduced sEV integrity and stability, and insufficient loading.52 siR-DG/GALA-sEVs demonstrated superior gene silencing (~21% greater) compared to siR-DG/sEVs, attributed to ~1.74 times more cytosolic release achieved by lysosomal escape (Figure 4c,e). Monitoring scratch closure following siRNA transfection further supported the enhanced gene silencing effect of siR-DG/GALA-sEVs. This was evidenced by reduced ECM components linked to cell migration after TGF-β silencing, impairing cell scratch closure (Figure 5f,g).66
Figure 5.

Successful siRNA transfection via siR-DG/GALA-sEVs and doxorubicin (Dox) combination treatments. (a) Schematic illustration of TGF-β silencing and following ECM change. Western blot analysis (n = 3, mean ± s.d.) of TGF-β1 expression levels in MCF-7 cells after siRNA transfection for the following: (b, d) Dose-dependent test of siR-DG/GALA-sEVs. (c, e) Comparison of gene silencing effect with competitive samples (Ctrl, siRNA, siR-DG, siR-DG/sEV, siR-DG/GALA-sEV, siR-Lipo/sEV). 0.5k sEVs per cell. Cell migration test: (f) Scratch assay monitored at 0, 15, and 25 h after scratch. (g) Relative scratch area quantification (n = 5, mean ± s.d.). Dox combination treatments after siRNA transfection: (h) Short-term cell viability test (n = 4, mean ± s.d.). (i, j) Long-term clonogenic assay (n = 4, mean ± s.d.). One-way ANOVA with Tukey’s post-test. ns, not significant. *p < 0.05; **p < 0.01; ***p < 0.001; ****p < 0.0001.
Finally, we investigated the synergistic therapeutic effect of siR-DG/GALA-sEVs in combination with Dox. To examine the short-term effect, we conducted a cytotoxicity test by administering Dox 48 h after siRNA transfection (Figures 5h and S15a). The siR-DG/GALA-sEVs + Dox group exhibited the highest cytotoxicity (cell viability, 48.83 ± 5.36%) among all groups, attributed to a reduction in ECM that allowed Dox to function more effectively within cells. The siR-DG/sEVs + Dox group showed the second highest cell viability (61.52 ± 7.02%), while no significant difference was observed between free Dox (72.44% ± 4.78%) and siR-Soni/sEVs + Dox (71.79% ± 6.65%). These results support the lower siRNA loading efficiency and instability of sEVs loaded via sonication, as demonstrated earlier. To evaluate the long-term therapeutic effect, we conducted a clonogenic assay (Figures 5i,j and S15b). Through TGF-β silencing, ECM destabilization and a less supportive environment for cell growth led to reduced cell adhesion and migration, which in turn inhibits cell proliferation and results in reduced colony formation.67 Correspondingly, differences between the ctrl and all three siRNA-loaded sEV groups were evident even without Dox treatment in this long-term study, with colony formation reduced in all cases relative to ctrl: siR-DG/sEVs of 78.80 ± 2.19%, siR-DG/GALA-sEVs of 57.39 ± 8.81%, and siR-Soni/sEVs of 90.53 ± 7.25%. However, due to the short duration of signal transduction to yield cytotoxicity associated with reduced proliferation, no significant differences from the ctrl were observed in the short term groups without Dox (Figure 5h). However, in the long term groups, siR-DG/GALA-sEVs not only reduced the number of colonies but also spread more evenly over the well, further indicating ECM disruption. All Dox-treated groups showed significantly reduced colony formation compared to nontreated groups. Notably, the siR-DG/GALA-sEVs + Dox group had only 5.97 ± 1.50% colony formation, in contrast to 53.19 ± 10.34% for free Dox, 19.36 ± 5.42% for siR-DG/sEVs + Dox, and 28.49 ± 4.22% for siR-Soni/sEVs + Dox. Since Dox inhibits cell proliferation by intercalating DNA in the nucleus and preventing replication and transcription,68 immediate Dox treatment after TGF-β knockdown increased Dox sensitivity by reducing cell ECM. This allowed Dox to function effectively, inhibiting essential gene activity and significantly reducing cell proliferation rates, which led to decreased colony formation.
We further confirmed the effect of the Dox combination treatment in MCF-7 derived cellular spheroids that better mimic the in vivo environment. Using an iCC hydrogel framework developed in previous work,41 we generated MCF-7 spheroids (; n = 20, mean ± s.d.). For the combination treatment, we transfected siRNA via siR-DG/sEVs or siR-DG/GALA-sEVs in MCF-7 spheroids for 24 h, followed by Dox treatment for 48 h (Figure S16a). Afterward, multiphoton confocal laser scanning microscopy (MP-CLSM) was used to image live (blue) and dead (red) cells after staining (Figure S16b). The control group predominantly exhibited blue staining, indicating a high cell viability of 98.82 ± 0.22%. Meanwhile, all Dox-treated groups yielded purple-to-red colors due to Dox-induced cell death. Quantitative analysis revealed that the free Dox group had a viability of 49.62 ± 7.65%, while the siR-DG/sEVs + Dox group exhibited a reduced viability of 29.37 ± 7.63%, suggesting a synergistic effect of TGF-β silencing with Dox. Notably, the siR-DG/GALA-sEVs + Dox group showed the most intense red signal within the spheroids, leading to a viability of 12.71 ± 5.15%. This result indicates that enhanced TGF-β silencing through lysosomal escape significantly increased Dox therapeutic efficacy (Figure S16c). TGF-β is known to promote a stiffened ECM, which is associated with chemotherapeutic resistance, particularly in breast cancer cells.32-34 In this regard, our data showed that efficient siTGF-β RNA transfection impaired cell scratch closure (Figure 5f,g) and reduced colony spread across the well (Figure 5i), indicating ECM downregulation mediated by TGF-β knockdown. Taken together with the improved Dox cytotoxicity observed in the 3D breast cancer spheroid model (Figure S16), these results suggested that efficient TGF-β silencing via siR-DG/GALA-sEVs promotes the enhancement of Dox sensitivity significantly, likely through ECM disruption.
We significantly improved siRNA loading into sEVs via D-GQDs and enabled efficient cytoplasmic delivery via pH-responsive GALA functionalization, offering an enhanced sEV-based gene delivery platform. This approach utilizes the natural targeting and cargo delivery capabilities of sEVs alongside enhanced functionality. Expanding the current model to include Dox-loaded sEVs with enhanced loading efficiency through chiral-assisted techniques, along with GALA peptide functionalization, may offer a further synergistic effect. This strategy is expected to enable targeted and precise Dox delivery, further enhancing therapeutic efficacy in combination with efficient silencing of TGF-β using siR-DG/GALA-sEVs. Additionally, we anticipate that ECM disruption through effective delivery of siRNA for TGF-β will contribute to improve cancer treatments, including chemotherapy, immunotherapy, and T cell transfer therapy.69
4. CONCLUSION
In this study, we developed an effective sEV-based gene delivery platform by integrating chiral GQDs for efficient siRNA loading and surface functionalization with a pH-responsive GALA peptide for enhanced lysosomal escape. This approach preserves the innate biological advantages of sEVs while achieving exceptionally effective gene delivery. Using this gene delivery system, we successfully delivered siTGF-β RNA intracellularly, reducing cancer cell ECM and enhancing drug sensitivity to overcome Dox resistance, a significant challenge in breast cancer therapy. Overall, our enhanced sEV platforms for innovative gene delivery opens new avenues for precise design through passive sEV functionalization that facilitate efficient intracellular delivery and cargo release, further enabling a synergistic combination therapy.
Supplementary Material
ACKNOWLEDGMENTS
TEM and CLSM images in this study were obtained using the instruments of Notre Dame Integrated Imaging Facility (NDIIF), University of Notre Dame. NTA data in this study were collected by the instrument of Harper Cancer Research Institute (HCRI), University of Notre Dame. MS analysis for sEV proteins in this study was conducted by the instrument of Mass Spectrometry & Proteomics Facility (MSPF), University of Notre Dame. FTIR analysis in this study was conducted using the instrument at the Center for Environmental Science and Technology (CEST), University of Notre Dame. Western blot images and agarose gel images in this study were acquired using the instrument of Biophysics Instrumentation Core (BIC), University of Notre Dame. We appreciate the support from these facilities for this study.
Funding
This work was supported by the National Institutes of Health (NIH) under the Maximizing Investigators’ Research Award (MIRA) [R35GM150608]; Berthiaume Institute for Precision Health (BIPH) under the Discovery Funding; and the University of Notre Dame under the Seed Transformative Interdisciplinary Research (STIR) Grant.
Footnotes
Ethical Approval Statement: This study did not involve any experiments conducted on either animals or humans.
The authors declare no competing financial interest.
Supporting Information
The Supporting Information is available free of charge at https://pubs.acs.org/doi/10.1021/acsbiomaterials.4c01595.
Materials and methods, MS proteomics of sEVs; characterizations of GALA peptide and of chiral GQD; pre-/post-GQD loading validation; ζ potential and TEM in pH variants; cell viability test; unzoomed and z-stack CLSM images; full Western blots; combination treatment timeline; Dox sensitivity test in 3D spheroid model (PDF)
Video S1 recording of DG/GALA-sEVs under CLSM (MP4)
REFERENCES
- (1).Kim G; Zhu R; Zhang Y; Jeon H; Shirinichi F; Wang Y Fluorescent Chiral Quantum Dots to Unveil Origin-Dependent Exosome Uptake and Cargo Release. ACS applied bio materials 2024, 7 (5), 3358. [DOI] [PMC free article] [PubMed] [Google Scholar]
- (2).Johnston J; Stone T; Wang Y Biomaterial-enabled 3D cell culture technologies for extracellular vesicle manufacturing. Biomater. Sci 2023, 11 (12), 4055. [DOI] [PubMed] [Google Scholar]
- (3).Zeng H; Guo S; Ren X; Wu Z; Liu S; Yao X Current Strategies for Exosome Cargo Loading and Targeting Delivery. Cells 2023, 12 (10), 1416. [DOI] [PMC free article] [PubMed] [Google Scholar]
- (4).Li Z; Ho W; Bai X; Li F; Chen YJ; Zhang XQ; Xu X Nanoparticle depots for controlled and sustained gene delivery. J. Controlled Release 2020, 322, 622–631. [DOI] [PubMed] [Google Scholar]
- (5).Kauffman KJ; Dorkin JR; Yang JH; Heartlein MW; DeRosa F; Mir FF; Fenton OS; Anderson DG Optimization of Lipid Nanoparticle Formulations for mRNA Delivery in Vivo with Fractional Factorial and Definitive Screening Designs. Nano Lett. 2015, 15 (11), 7300. [DOI] [PubMed] [Google Scholar]
- (6).Zhao Z; Anselmo AC; Mitragotri S Viral vector-based gene therapies in the clinic. Bioeng. Transl. Med 2022, 7 (1), e10258. [DOI] [PMC free article] [PubMed] [Google Scholar]
- (7).Rakshit T; Pal S Extracellular Vesicles for Drug Delivery and Theranostics In Vivo. JACS Au 2024, 4 (2), 318. [DOI] [PMC free article] [PubMed] [Google Scholar]
- (8).De Jong OG; Kooijmans SA; Murphy DE; Jiang L; Evers MJ; Sluijter JP; Vader P; Schiffelers RM Drug Delivery with Extracellular Vesicles: From Imagination to Innovation. Acc. Chem. Res 2019, 52 (7), 1761. [DOI] [PMC free article] [PubMed] [Google Scholar]
- (9).O’Brien K; Ughetto S; Mahjoum S; Nair AV; Breakefield XO Uptake, functionality, and re-release of extracellular vesicle-encapsulated cargo. Cell Rep. 2022, 39 (2), 110651. [DOI] [PMC free article] [PubMed] [Google Scholar]
- (10).Zhang Y; Kim G; Zhu Y; Wang C; Zhu R; Lu X; Chang HC; Wang Y Chiral Graphene Quantum Dots Enhanced Drug Loading into Small Extracellular Vesicles. ACS Nano 2023, 17, 10191. [DOI] [PubMed] [Google Scholar]
- (11).Zhang M; Hu S; Liu L; Dang P; Liu Y; Sun Z; Qiao B; Wang C Engineered exosomes from different sources for cancer-targeted therapy. Signal Transduction Targeted Ther, 2023, 8 (1), 124. [DOI] [PMC free article] [PubMed] [Google Scholar]
- (12).Wu P; Zhang B; Ocansey DKW; Xu W; Qian H Extracellular vesicles: A bright star of nanomedicine. Biomaterials 2021, 269, 120467. [DOI] [PubMed] [Google Scholar]
- (13).Kumar S; Senapati S; Chang HC Extracellular vesicle and lipoprotein diagnostics (ExoLP-Dx) with membrane sensor: A robust microfluidic platform to overcome heterogeneity. Biomicrofluidics 2024, 18 (4), 041301. [DOI] [PMC free article] [PubMed] [Google Scholar]
- (14).Lin Q; Qu M; Zhou B; Patra HK; Sun Z; Luo Q; Yang W; Wu Y; Zhang Y; Li L; Deng L Exosome-like nanoplatform modified with targeting ligand improves anti-cancer and antiinflammation effects of imperialine. J. Controlled Release 2019, 311–312, 104–116. [DOI] [PubMed] [Google Scholar]
- (15).Zhuang J; Tan J; Wu C; Zhang J; Liu T; Fan C; Li J; Zhang Y Extracellular vesicles engineered with valency-controlled DNA nanostructures deliver CRISPR/Cas9 system for gene therapy. Nucleic Acids Res. 2020, 48 (16), 8870. [DOI] [PMC free article] [PubMed] [Google Scholar]
- (16).Li D; Gong L; Lin H; Yao S; Yin Y; Zhou Z; Shi J; Wu Z; Huang Z Hyaluronic Acid-Coated Bovine Milk Exosomes for Achieving Tumor-Specific Intracellular Delivery of miRNA-204. Cells 2022, 11 (19), 3065. [DOI] [PMC free article] [PubMed] [Google Scholar]
- (17).Gong L; Tian L; Cui K; Chen Y; Liu B; Li D; Feng Y; Yao S; Yin Y; Wu Z; Huang Z An off-the-shelf small extracellular vesicle nanomedicine for tumor targeting therapy. J. Controlled Release 2023, 364, 672. [DOI] [PubMed] [Google Scholar]
- (18).Joshi BS; de Beer MA; Giepmans BN; Zuhorn IS Endocytosis of Extracellular Vesicles and Release of Their Cargo from Endosomes. ACS Nano 2020, 14 (4), 4444. [DOI] [PMC free article] [PubMed] [Google Scholar]
- (19).Mindell JA Lysosomal acidification mechanisms. Annu. Rev. Physiol 2012, 74, 69. [DOI] [PubMed] [Google Scholar]
- (20).Liu C; Su C Design strategies and application progress of therapeutic exosomes. Theranostics 2019, 9 (4), 1015. [DOI] [PMC free article] [PubMed] [Google Scholar]
- (21).Xu M; Yang Q; Sun X; Wang Y Recent Advancements in the Loading and Modification of Therapeutic Exosomes. Front. Bioeng. Biotechnol. 2020, 8, 586130. [DOI] [PMC free article] [PubMed] [Google Scholar]
- (22).Wang J; Chen D; Ho EA Challenges in the development and establishment of exosome-based drug delivery systems. J. Controlled Release 2021, 329, 894. [DOI] [PubMed] [Google Scholar]
- (23).Sensale S; Peng Z; Chang HC Acceleration of DNA melting kinetics using alternating electric fields. J. Chem. Phys 2018, 149 (8), 085102. [DOI] [PMC free article] [PubMed] [Google Scholar]
- (24).Wang X; Lim HJ; Son A Characterization of denaturation and renaturation of DNA for DNA hybridization. Environ. Health Toxicol 2014, 29, e2014007. [DOI] [PMC free article] [PubMed] [Google Scholar]
- (25).Li W; Nicol F; Szoka FC Jr GALA: a designed synthetic pH-responsive amphipathic peptide with applications in drug and gene delivery. Adv. Drug Delivery Rev 2004, 56 (7), 967. [DOI] [PubMed] [Google Scholar]
- (26).Shen Z; Ma N; Wang F; Ren J; Hou C; Chao S; Pei Y; Pei Z pH-and H2O2-sensitive drug delivery system based on sodium xanthate: dual-responsive supramolecular vesicles from one functional group. Chin. Chem. Lett 2022, 33 (10), 4563–4566. [Google Scholar]
- (27).Dong J; Yu Y; Pei Y; Pei Z pH-responsive aminotriazole doped metal organic frameworks nanoplatform enables self-boosting reactive oxygen species generation through regulating the activity of catalase for targeted chemo/chemodynamic combination therapy. J. Colloid Interface Sci 2022, 607 (Pt 2), 1651–1660. [DOI] [PubMed] [Google Scholar]
- (28).Jia Y; Yu L; Ma T; Xu W; Qian H; Sun Y; Shi H Small extracellular vesicles isolation and separation: Current techniques, pending questions and clinical applications. Theranostics 2022, 12 (15), 6548. [DOI] [PMC free article] [PubMed] [Google Scholar]
- (29).Ahmad A; Khan JM pH-sensitive endosomolytic peptides in gene and drug delivery: Endosomal escape and current challenges. Journal of Drug Delivery Science and Technology 2022, 76, No. 103786. [Google Scholar]
- (30).Yan F; Zhong Z; Wang Y; Feng Y; Mei Z; Li H; Chen X; Cai L; Li C Exosome-based biomimetic nanoparticles targeted to inflamed joints for enhanced treatment of rheumatoid arthritis. J. Nanobiotechnol 2020, 18 (1), 115. [DOI] [PMC free article] [PubMed] [Google Scholar]
- (31).Wang X.-y.; Lei R; Huang H.-d.; Wang N; Yuan L; Xiao R.-y.; Bai L.-d.; Li X; Li L.-m.; Yang X.-d. The permeability and transport mechanism of graphene quantum dots (GQDs) across the biological barrier. Nanoscale 2015, 7 (5), 2034–2041. [DOI] [PubMed] [Google Scholar]
- (32).Chen J; Ding ZY; Li S; Liu S; Xiao C; Li Z; Zhang BX; Chen XP; Yang X Targeting transforming growth factor-β signaling for enhanced cancer chemotherapy. Theranostics 2021, 11 (3), 1345. [DOI] [PMC free article] [PubMed] [Google Scholar]
- (33).Zhang M; Zhang YY; Chen Y; Wang J; Wang Q; Lu H TGF-β Signaling and Resistance to Cancer Therapy. Front. Cell Dev. Biol 2021, 9, 786728. [DOI] [PMC free article] [PubMed] [Google Scholar]
- (34).Deng Z; Fan T; Xiao C; Tian H; Zheng Y; Li C; He J TGF-β signaling in health, disease, and therapeutics. Signal Transduction Targeted Ther. 2024, 9 (1), 61. [DOI] [PMC free article] [PubMed] [Google Scholar]
- (35).Chang Y; Lv Y; Wei P; Zhang P; Pu L; Chen X; Yang K; Li X; Lu Y; Hou C; Pei Y; et al. Multifunctional Glyco-Nanofibers: siRNA Induced Supermolecular Assembly for Codelivery In Vivo. Adv. Funct. Mater 2017, 27 (44), No. 1703083. [Google Scholar]
- (36).Zhu R; Makwana KM; Zhang Y; Rajewski BH; Del Valle JR; Wang Y Blocking tau transmission by biomimetic graphene nanoparticles. J. Mater. Chem. B 2023, 11 (31), 7378. [DOI] [PMC free article] [PubMed] [Google Scholar]
- (37).Jeon H; Zhu R; Kim G; Wang Y Chirality-enhanced transport and drug delivery of graphene nanocarriers to tumor-like cellular spheroid. Front. Chem 2023, 11, 1207579. [DOI] [PMC free article] [PubMed] [Google Scholar]
- (38).Chaudhari R; Nasra S; Meghani N; Kumar A MiR-206 conjugated gold nanoparticle based targeted therapy in breast cancer cells. Sci. Rep 2022, 12 (1), 4713. [DOI] [PMC free article] [PubMed] [Google Scholar]
- (39).Wu N; Zhang X; Li F; Zhang T; Gan Y; Li J Spray-dried powders enhance vaginal siRNA delivery by potentially modulating the mucus molecular sieve structure. Int. J. Nanomed 2015, 10, 5383. [DOI] [PMC free article] [PubMed] [Google Scholar]
- (40).Akoglu H User’s guide to correlation coefficients. Turk. J. Emerg. Med 2018, 18 (3), 91. [DOI] [PMC free article] [PubMed] [Google Scholar]
- (41).Jeon H; Zanon TTM; Carpenter J; Ilias A; Colon Y; Wang Y A Bioinert Hydrogel Framework for Precision 3D Cell Cultures: Advancing Automated High-Content and High-Throughput Drug Screening. bioRxiv Preprint (Bioengineering) 2024. 2024.08.27.609940. 10.1101/2024.08.27.609940. [DOI] [Google Scholar]
- (42).Wolfson E; Goldenberg M; Solomon S; Frishberg A; Pinkas-Kramarski R Nucleolin-binding by ErbB2 enhances tumor-igenicity of ErbB2-positive breast cancer. Oncotarget 2016, 7 (40), 65320. [DOI] [PMC free article] [PubMed] [Google Scholar]
- (43).Napolitano V; Russo D; Morra F; Merolla F; Varricchio S; Ilardi G; Di Crescenzo RM; Martino F; Mascolo M; Celetti A; Tamagnone L; Staibano S Neuropilin-1 Expression Associates with Poor Prognosis in HNSCC and Elicits EGFR Activation upon CDDP-Induced Cytotoxic Stress. Cancers 2021, 13 (15), 3822. [DOI] [PMC free article] [PubMed] [Google Scholar]
- (44).Smith JW; Ruggeri ZM; Kunicki TJ; Cheresh DA Interaction of integrins αvβ3 and glycoprotein IIb-IIIa with fibrinogen. Differential peptide recognition accounts for distinct binding sites. J. Biol. Chem 1990, 265 (21), 12267. [PubMed] [Google Scholar]
- (45).Munoz NM; Upton M; Rojas A; Washington MK; Lin L; Chytil A; Sozmen EG; Madison BB; Pozzi A; Moon RT; Moses HL; Grady WM Transforming growth factor beta receptor type II inactivation induces the malignant transformation of intestinal neoplasms initiated by Apc mutation. Cancer Res. 2006, 66 (20), 9837. [DOI] [PubMed] [Google Scholar]
- (46).Ghadami S; Dellinger K The lipid composition of extracellular vesicles: applications in diagnostics and therapeutic delivery. Front. Mol. Biosci 2023, 10, 1198044. [DOI] [PMC free article] [PubMed] [Google Scholar]
- (47).Huang YW; Cambre M; Lee HJ The Toxicity of Nanoparticles Depends on Multiple Molecular and Physicochemical Mechanisms. Int. J. Mol. Sci 2017, 18 (12), 2702. [DOI] [PMC free article] [PubMed] [Google Scholar]
- (48).Chen RJ; Chen YY; Liao MY; Lee YH; Chen ZY; Yan SJ; Yeh YL; Yang LX; Lee YL; Wu YH; Wang YJ The Current Understanding of Autophagy in Nanomaterial Toxicity and Its Implementation in Safety Assessment-Related Alternative Testing Strategies. Int. J. Mol. Sci 2020, 21 (7), 2387. [DOI] [PMC free article] [PubMed] [Google Scholar]
- (49).DiCiccio JE; Steinberg BE Lysosomal pH and analysis of the counter ion pathways that support acidification. J. Gen. Physiol 2011, 137 (4), 385. [DOI] [PMC free article] [PubMed] [Google Scholar]
- (50).Goertz MP; Goyal N; Montano GA; Bunker BC Lipid bilayer reorganization under extreme pH conditions. Langmuir 2011, 27 (9), 5481. [DOI] [PubMed] [Google Scholar]
- (51).Zhuang WR; Wang Y; Cui PF; Xing L; Lee J; Kim D; Jiang HL; Oh YK Applications of π-π stacking interactions in the design of drug-delivery systems. J. Controlled Release 2019, 294, 311. [DOI] [PubMed] [Google Scholar]
- (52).Xi XM; Xia SJ; Lu R Drug loading techniques for exosome-based drug delivery systems. Pharmazie 2021, 76 (2), 61. [DOI] [PubMed] [Google Scholar]
- (53).Chen C; Sun M; Wang J; Su L; Lin J; Yan X Active cargo loading into extracellular vesicles: Highlights the heterogeneous encapsulation behaviour. Journal of extracellular vesicles 2021, 10 (13), e12163. [DOI] [PMC free article] [PubMed] [Google Scholar]
- (54).Regan D; Williams J; Borri P; Langbein W Lipid Bilayer Thickness Measured by Quantitative DIC Reveals Phase Transitions and Effects of Substrate Hydrophilicity. Langmuir: the ACS journal of surfaces and colloids 2019, 35 (43), 13805. [DOI] [PMC free article] [PubMed] [Google Scholar]
- (55).Mizutani N; Korposh S; Selyanchyn R; Wakamatsu S; Lee SW Application of a quartz crystal microbalance (QCM) twin sensor for selective label-free immunoassay to simultaneous antigen-antibody reactions. Sens. Transducers 2012, 137 (2), 1. [Google Scholar]
- (56).Brenet F; Dussault N; Delfino C; Boudouresque F; Chinot O; Martin PM; Ouafik LH Identification of secondary structure in the 5′-untranslated region of the human adrenomedullin mRNA with implications for the regulation of mRNA translation. Oncogene 2006, 25 (49), 6510. [DOI] [PubMed] [Google Scholar]
- (57).Zheng J-L; Zhuo M-Q; Luo Z; Song Y-F; Pan Y-X; Huang C; Hu W; Chen Q-L Peroxisome proliferator-activated receptor alpha1 in yellow catfish Pelteobagrus fulvidraco: molecular characterization, mRNA tissue expression and transcriptional regulation by insulin in vivo and in vitro. Comp. Biochem. Physiol., Part B: Biochem. Mol. Biol 2015, 183, 58. [DOI] [PubMed] [Google Scholar]
- (58).Pedroso FL; de Jesus-Ayson EGT; Cortado HH; Hyodo S; Ayson FG Changes in mRNA expression of grouper (Epinephelus coioides) growth hormone and insulin-like growth factor I in response to nutritional status. Gen. Comp. Endocrinol 2006, 145 (3), 237. [DOI] [PubMed] [Google Scholar]
- (59).Habibian M; Harikrishna S; Fakhoury J; Barton M; Ageely EA; Cencic R; Fakih HH; Katolik A; Takahashi M; Rossi J; Pelletier J Effect of 2′-5′/3′-5′ phosphodiester linkage heterogeneity on RNA interference. Nucleic Acids Res. 2020, 48 (9), 4643. [DOI] [PMC free article] [PubMed] [Google Scholar]
- (60).Tenchov R; Bird R; Curtze AE; Zhou Q Lipid Nanoparticles—From Liposomes to mRNA Vaccine Delivery, a Landscape of Research Diversity and Advancement. ACS Nano 2021, 15 (11), 16982. [DOI] [PubMed] [Google Scholar]
- (61).Yang ST; Kreutzberger AJ; Lee J; Kiessling V; Tamm LK The role of cholesterol in membrane fusion. Chem. Phys. Lipids 2016, 199, 136. [DOI] [PMC free article] [PubMed] [Google Scholar]
- (62).Aeffner S; Reusch T; Weinhausen B; Salditt T Energetics of stalk intermediates in membrane fusion are controlled by lipid composition. Proc. Natl. Acad. Sci. U. S. A 2012, 109 (25), E1609. [DOI] [PMC free article] [PubMed] [Google Scholar]
- (63).Wittrup A; Lieberman J Knocking down disease: a progress report on siRNA therapeutics. Nat. Rev. Genet 2015, 16 (9), 543. [DOI] [PMC free article] [PubMed] [Google Scholar]
- (64).Fasbender S; Zimmermann L; Cadeddu RP; Luysberg M; Moll B; Janiak C; Heinzel T; Haas R The Low Toxicity of Graphene Quantum Dots is Reflected by Marginal Gene Expression Changes of Primary Human Hematopoietic Stem Cells. Sci. Rep 2019, 9 (1), 12028. [DOI] [PMC free article] [PubMed] [Google Scholar]
- (65).Wo L; Zhang B; You X; Hu Y; Gu Z; Zhang M; Wang Q; Lv Z; Zhao H Up-regulation of LncRNA UCA1 by TGF-β promotes doxorubicin resistance in breast cancer cells. Immunopharm. Immunotoxicol 2022, 44 (4), 492. [DOI] [PubMed] [Google Scholar]
- (66).Gómez-Contreras P; Ramiro-Díaz JM; Sierra A; Stipp C; Domann FE; Weigel RJ; Lal G Extracellular matrix 1 (ECM1) regulates the actin cytoskeletal architecture of aggressive breast cancer cells in part via S100A4 and Rho-family GTPases. Clin. Exp. Metastasis 2017, 34 (1), 37. [DOI] [PMC free article] [PubMed] [Google Scholar]
- (67).Han Z; Kang D; Joo Y; Lee J; Oh GH; Choi S; Ko S; Je S; Choi HJ; Song JJ TGF-β downregulation-induced cancer cell death is finely regulated by the SAPK signaling cascade. Exp. Mol. Med 2018, 50 (12), 1. [DOI] [PMC free article] [PubMed] [Google Scholar]
- (68).Linders AN; Dias IB; López Fernández T; Tocchetti CG; Bomer N; Van der Meer P A review of the pathophysiological mechanisms of doxorubicin-induced cardiotoxicity and aging. npj Aging 2024, 10 (1), 9. [DOI] [PMC free article] [PubMed] [Google Scholar]
- (69).Pei X; Zhang X; Zhang L; Yuan M; Sun L; Yu F; Wang B; Zhao J; He H; Yang VC Targeted exosomes for co-delivery of siFGL1 and siTGF-β1 trigger combined cancer immunotherapy by remodeling immunosuppressive tumor microenvironment. Chemical Engineering Journal 2021, 421, No. 129774. [Google Scholar]
Associated Data
This section collects any data citations, data availability statements, or supplementary materials included in this article.