

Abstract
OBJECTIVE:
Diagnosis of tuberculosis (TB) in multi-slice spiral computed tomography (CT) images is a difficult task in many TB prevalent locations in which experienced radiologists are lacking. To address this difficulty, we develop an automated detection system based on artificial intelligence (AI) in this study to simplify the diagnostic process of active tuberculosis (ATB) and improve the diagnostic accuracy using CT images.
DATA:
A CT image dataset of 846 patients is retrospectively collected from a large teaching hospital. The gold standard for ATB patients is sputum smear, and the gold standard for normal and pneumonia patients is the CT report result. The dataset is divided into independent training and testing data subsets. The training data contains 337 ATB, 110 pneumonia, and 120 normal cases, while the testing data contains 139 ATB, 40 pneumonia, and 100 normal cases, respectively.
METHODS:
A U-Net deep learning algorithm was applied for automatic detection and segmentation of ATB lesions. Image processing methods are then applied to CT layers diagnosed as ATB lesions by U-Net, which can detect potentially misdiagnosed layers, and can turn 2D ATB lesions into 3D lesions based on consecutive U-Net annotations. Finally, independent test data is used to evaluate the performance of the developed AI tool.
RESULTS:
For an independent test, the AI tool yields an AUC value of 0.980. Accuracy, sensitivity, specificity, positive predictive value, and negative predictive value are 0.968, 0.964, 0.971, 0.971, and 0.964, respectively, which shows that the AI tool performs well for detection of ATB and differential diagnosis of non-ATB (i.e. pneumonia and normal cases).
CONCLUSION:
An AI tool for automatic detection of ATB in chest CT is successfully developed in this study. The AI tool can accurately detect ATB patients, and distinguish between ATB and non- ATB cases, which simplifies the diagnosis process and lays a solid foundation for the next step of AI in CT diagnosis of ATB in clinical application.
Keywords: Active tuberculosis (ATB), artificial intelligence (AI), deep learning
1. Introduction
Worldwide, tuberculosis (TB) is one of the top 10 causes of death. Tuberculosis is also one of the most common causes of opportunistic infections and a major cause of death among people living with Human Immunodeficiency Virus (HIV). In 2017, tuberculosis killed approximately 1.3 million HIV-negative people, and about 300,000 HIV-positive people died from TB. According to the best estimate, there were about 10 million people newly infected with tuberculosis in the world in 2017 [1]. In order to reduce the global burden of this disease, the World Health Organization recommends screening for active tuberculosis (ATB) among high-risk groups for early detection and timely treatment. For the high-risk group, the incidence rate of tuberculosis is significantly higher than for the general population [2]. X-ray examination is one of the auxiliary diagnostic tests for tuberculosis screening, but there is a rate of missed cases in practice. With the popularization of computer tomography (CT) technology in small and medium-sized hospitals, CT has become very helpful in identifying chest parenchymal lesions and detecting the severity of lung disease in tuberculosis patients [3, 4]. CT images can better display the characteristics of ATB, including cavities, parenchymal abnormalities, lobular central nodules, and tree bud signs [5]. However, the diagnosis of tuberculosis in CT requires a doctor with a certain diagnostic ability, which is a difficult task for most TB prevalent locations in which experienced radiologists are often lacking [6, 7]. Consequently, the screening efficiency is quite low, which may impair timely treatment of ATB patients.
Therefore, there has been an interest in applying artificial intelligence (AI) to the detection of ATB in CT, which can help improve the screening efficiency. So far, various algorithms have been proposed based on deep learning to automatically diagnose diseases in the medical field [8]. In the Image Net Large Scale Visual Recognition Competition in 2012, deep learning techniques have achieved great success, especially in the classification of medical images [7]. In 2018, Hwang et al. developed an automatic detection software for ATB based on chest X-ray images, which showed better performance than most doctors including chest radiologists [9]. Moreover, the use of deep learning to diagnose lung nodules and pneumonia in images has demonstrated advantages and application values [10, 11]. Thus, the recent success and promising results provide great encouragement for future clinical applications of AI in assisting diagnosis of diseases using in medical imaging.
The purpose of this paper is to simplify the ATB diagnosis process and improve the diagnostic accuracy based on an automated deep learning, artificial intelligence (AI) detection system for multi-slice spiral CT images. It also improves the detection rate of early ATB for remote areas and reduces the workload of radiologists. The structure of this paper is as follows: Section II mainly introduces the data and methods, including the collection and arrangement of data, and the deep learning techniques we used for developing the automatic detection model. Section III presents the final test results and the measures for evaluating the performance of the algorithm. Section IV analyzes and discusses the results, and describes the advantages and disadvantages of the software. Section V describes the conclusions drawn from this paper. Finally, Section VI describes the outlook for the future.
2. Data and methods
2.1. Data
CT images of 868 patients (male 534, female 334; mean ± standard deviation of age: 47 ± 20 years old), from April 2016 to May 2019, in the affiliated Hospital of Hebei University of China were retrospectively collected. Each patient had a corresponding electronic image report for CT, and each ATB patient also had a corresponding tuberculosis sputum smear report. These patients were divided into 498 ATB (22 sputum smear were found negative, 476 sputum smear were found postive), 220 normal and 150 pneumonia cases. In this study, ATB cases were diagnosed using positive tuberculosis smear as the gold standard, and normal and pneumonia cases were diagnosed using the radiologists’ reports as the gold standard. Then, all the cases were divided into a training data set and a testing data set, including 337 ATB, 120 normal, and 110 pneumonia cases as the training data set to optimize network weights; and 139 ATB, 100 normal, and 40 pneumonia cases as the testing data set to test the performance of the algorithm. The training and the testing data sets are independent, with details shown in Tables 1 and 2. Because of the similar imaging findings of pneumonia and ATB in clinical diagnosis [12, 13], patients with pneumonia were enrolled in this study.
Table 1.
Training data
| Total | Sex | Average±standard | Maximum | Minimum | Total number | ||
|---|---|---|---|---|---|---|---|
| (case) | Male | Female | deviation age | age | age | of CT slices | |
| ATB | 337 | 237 | 100 | 44 ± 20 | 89 | 12 | 21460 |
| Normal | 120 | 60 | 60 | 42 ± 14 | 68 | 5 | 7410 |
| Pneumonia | 110 | 63 | 47 | 63 ± 16 | 89 | 14 | 6679 |
Table 2.
Testing data
| Total | Sex | Average±standard | Maximum | Minimum | Total number | ||
|---|---|---|---|---|---|---|---|
| (case) | Male | Female | deviation age | age | age | of CT slices | |
| ATB | 139 | 92 | 47 | 43 ± 20 | 85 | 7 | 8908 |
| Normal | 100 | 48 | 52 | 43 ± 16 | 83 | 2 | 2293 |
| Pneumonia | 40 | 18 | 22 | 62 ± 16 | 86 | 18 | 6109 |
The main CT manifestations of ATB and non-tuberculous pneumonia are as follows: The CT appearance of ATB is mainly characterized by multiple lung lobes, multiple lung segments, and multiple morphologies, which are more likely to occur in the posterior segment of the upper lobes of the lungs and the dorsal segment of the lower lobes. The morphology is mainly manifested as flakes or tree bud signs, often accompanied by cord strip shadows, calcifications, voids, etc [14, 15] as shown in Fig. 1a. Pneumonia is often confined to one lobe of the lungs. In CT, it is mainly manifested as smears or ground glass shadows with blurred edges, uniform density, and air bronchial signs are often seen in the lesions [16, 17] as shown in Fig. 1b.
Fig. 1.
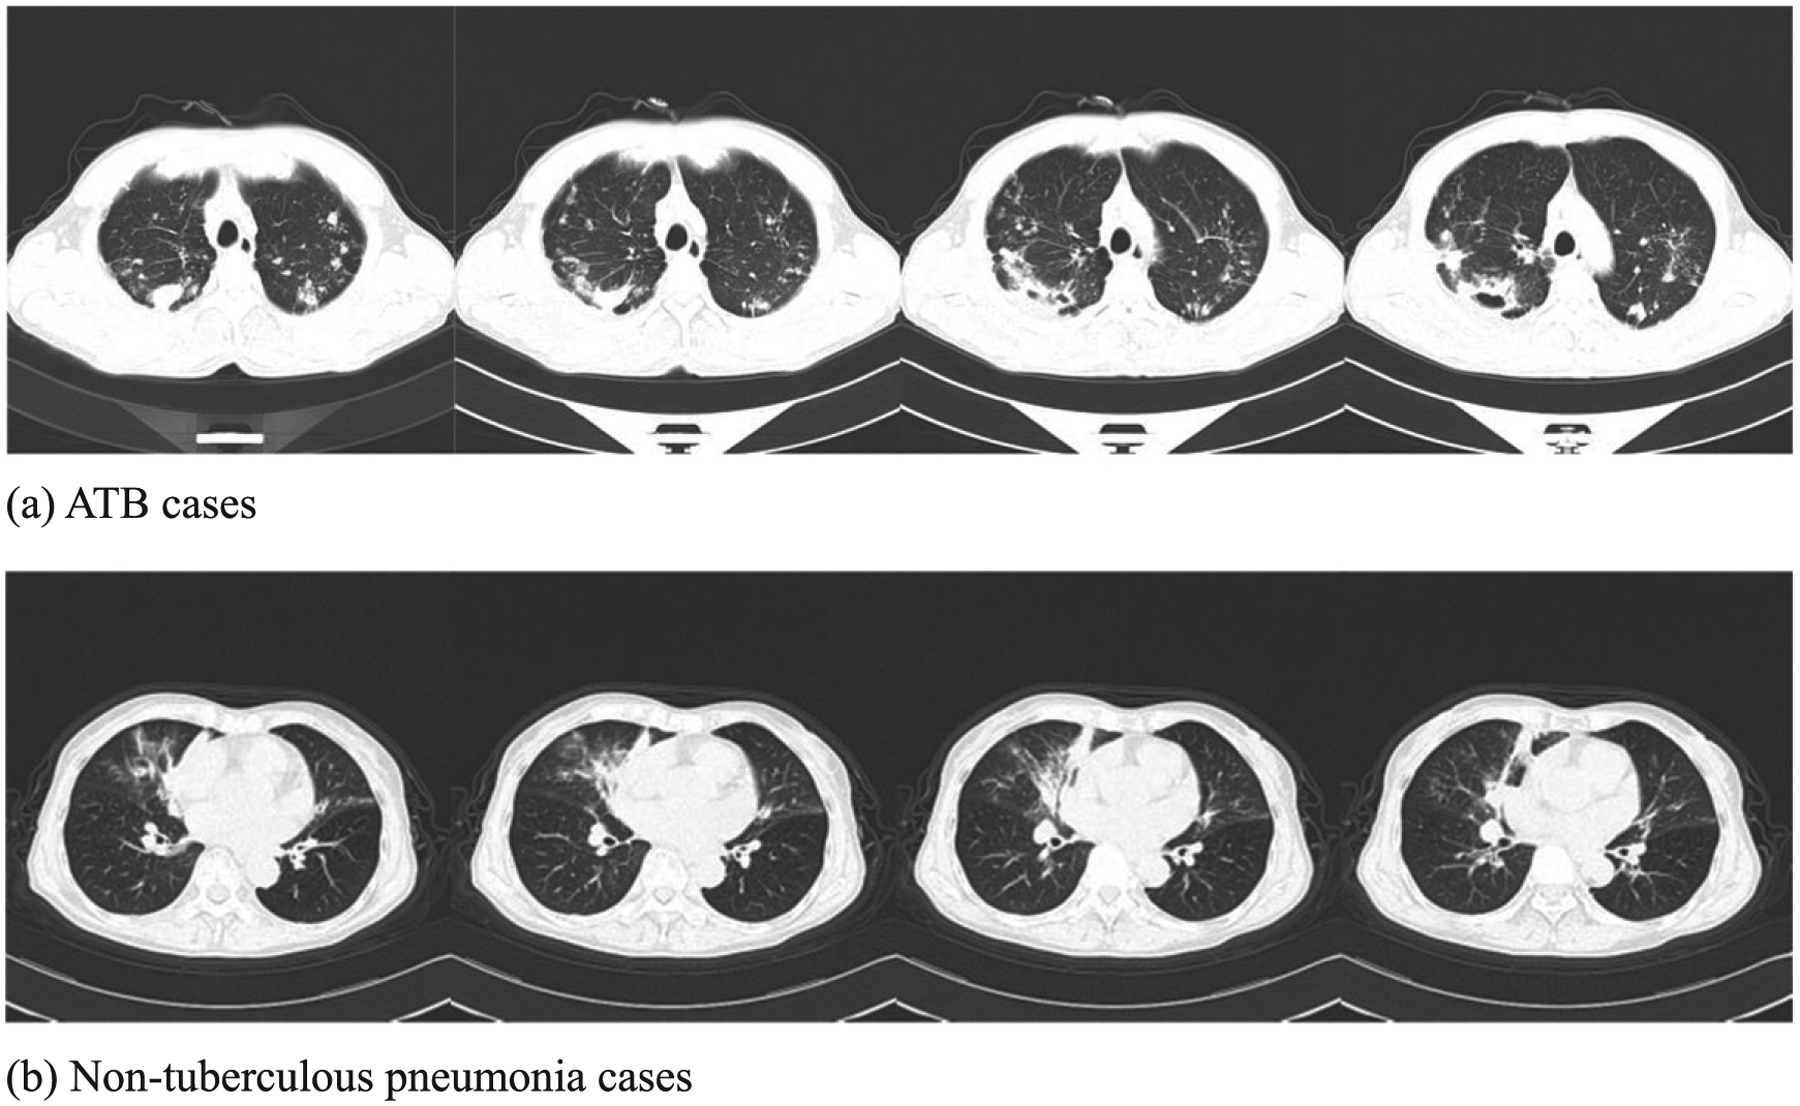
Typical CT findings of (a) ATB and (b) non-tuberculous pneumonia.
In the development of accurate radiology deep learning algorithms, in addition to the appropriate model structure, a large number of precise markers are needed to train the algorithm [18]. Therefore, before developing a deep-learning-based automatic detection (DLAD) algorithm, this paper uses LabelImg software to mark the lesions of 337 ATB patients in the training data. A total of 8213 CT slices are marked, with a total of 13679 labels and an average of 5917 pixels per label. Two radiologists negotiated to develop a unified standard for these markings (The standard is to circle the ATB lesions in each CT slice with a box using LabelImg software. The same focus can be marked with multiple boxes, which should not contain normal lung tissue and should exceed the abnormal lung area as little as possible). All ATB, normal and pneumonia CT images were examined by five radiologists, with more than 5 years of experience in CT reading, in the affiliated Hospital of Hebei University (Class III Class A Hospital), China.
In this study, the CT images were scanned using Siemens (SOMATOM Definition AS) 64-row 128-slice spiral CT, and 40-row 64-slice spiral CT. Before spiral CT scanning, a patient was trained in breathing. When performing a spiral CT scan, the patient takes the supine position, raises the arms and advances the head. The patient breathes in and finishes the whole lung scan within 5–8s. The scan ranges from the chest entrance to the base of the lung, in spiral scanning mode. The tube voltage is 100 kV; tube current: 100 mA; pitch: 1.3; slice thickness: 5.0 mm; field of view: 430 mm.
2.2. Method
The algorithm was primarily developed by Shenzhen Smart Imaging Healthcare Co., Ltd and CT/MRI Department, Affiliated Hospital of Hebei University in collaboration with several US and Chinese institutions listed in the affiliation of authors. In this study, CT images of ATB were used as positive samples, and CT images of pneumonia and normal patients were used as negative samples for training and testing.
The primary architecture consists of a U-Net deep learning based CNN model to process each slice of an entire CT scan to identify 2-D regions of interest (ROI) in each slice. The architecture also involves a clustering technique based on the connectivity of an ROI to convert multiple ROIs in 2-D slices into a single 3-D object of interest (OOI) in a 3-D scan, as shown in Fig. 2.
Fig. 2.

Main framework of AI detection software.
The training data process is as follows: First, the ATB lesions were labeled with rectangular boxes centered at the locations of tuberculosis findings by a board-certified radiologist based on the radiology reports, using LabelImg software developed by the authors of this paper. The training and testing data do not overlap. Second, using a U-Net segmentation network to perform image segmentation training on labeled ATB regions in the training data, the trained U-Net for automatic identification of ATB lesions was obtained. Third, when diagnosing ATB patients, image processing methods have been added that can effectively convert 2-D ROI at each slice into 3-D OOI for a CT scan. Finally, combining the steps above, the AI detection software was obtained. In order to verify the performance of the AI detection software, the testing data is used for detection evaluation.
2.2.1. U-Net deep learning technique to detect 2-D ROI at each CT slice
The U-Net neural network in this paper is used to predict the ATB lesions in each CT image, as shown in Fig. 3. U-Net is an image segmentation network based on a Convolutional Neural Network (CNN) for extracting image features. The basic component of U-Net is the same as the traditional convolutional network in that it performs convolution, batch normalization, activation, and maximum pooling operations in sequence [19]. However, there is a big difference between the U-Net network structure and the traditional CNN network structure. The first half adopts a downsampling pooling operation, so that the resolution of each feature map is reduced to 1/4 of the original size, and the second half adopts upsampling and merging operations, respectively improving the resolution of the feature map, and the fusion of shallow and deep information makes up for the loss of characteristic information caused by the introduction of pooling operations.
Fig. 3.
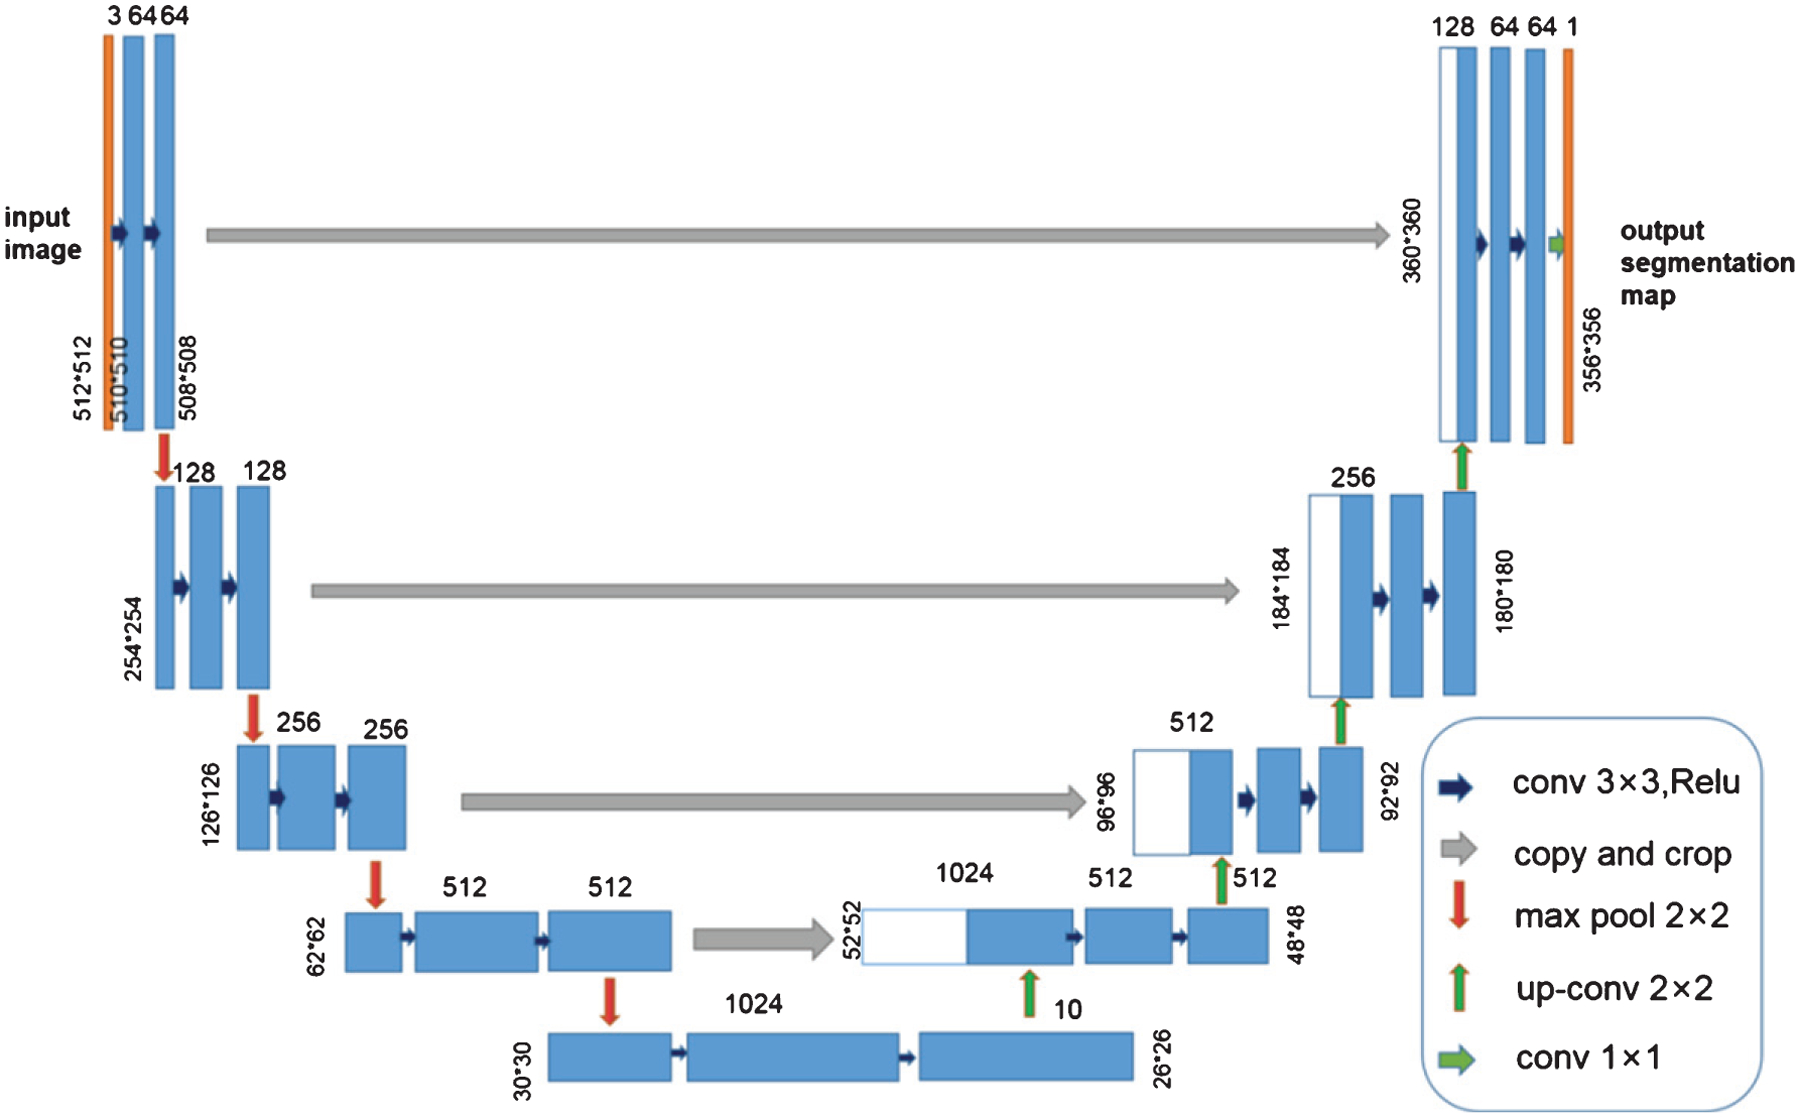
Architecture of our adapted U-Net network.
2.2.2. Clustering technique to detect 3-D OOI for an entire CT scan
After the U-Net segmentation network is used to predict lesion areas (ROI) of ATB in the testing data, the next step is to convert these 2-D ROI into 3-D OOI by combining CT slices with ATB lesions. If the contour of an ATB lesion slice is detected, and the center points of adjacent bounding boxes are within 30 voxels, the bounding boxes were fused into one, avoiding the interference of tiny regions. Then, the CT slices of ATB lesions at the joint with Intersection Over Union (IOU) >0.3 of adjacent ATB lesion slices were selected, which means the overlap of ATB lesions in adjacent CT layers is greater than 30%. Patients who meet the above conditions, and who have more than four consecutive ATB lesion slices, are classified as ATB patients, as shown in Fig. 4.
Fig. 4.
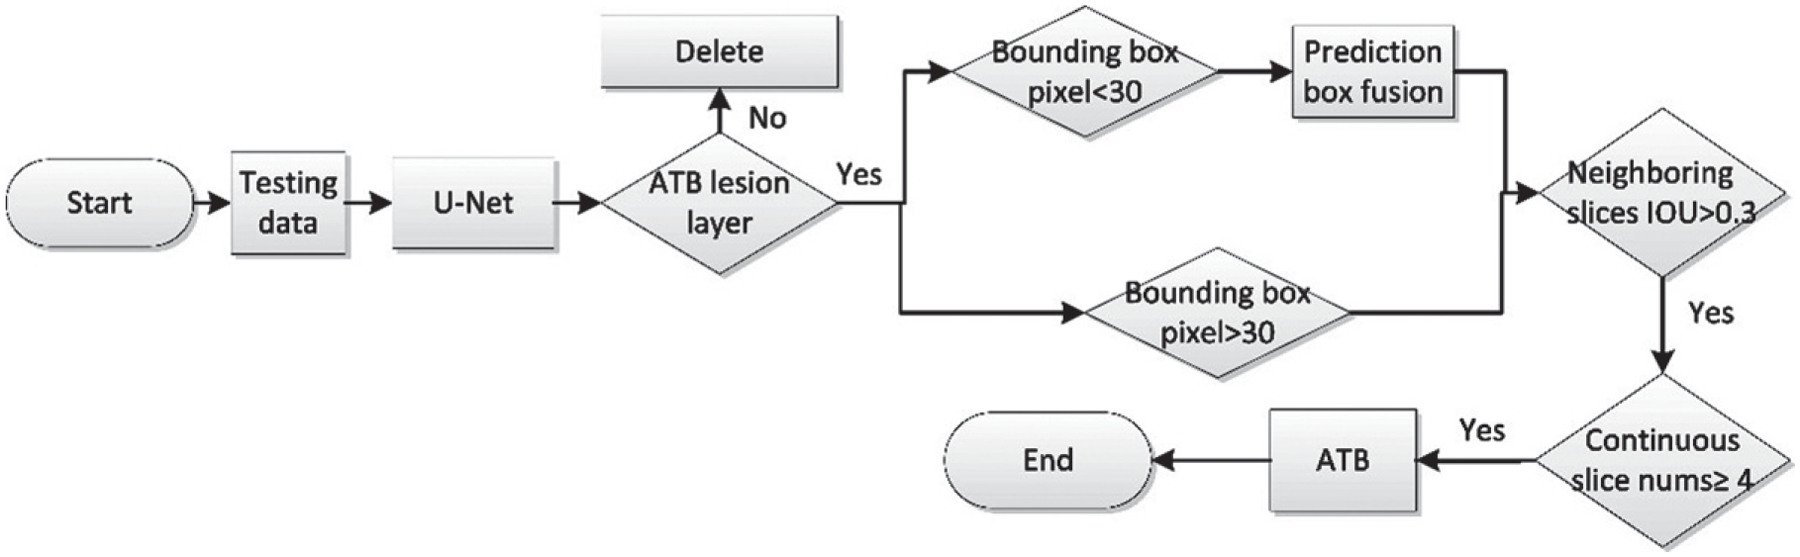
AI detection software - diagnostic flowchart.
2.3. Statistical method
We use our AI software to process the testing data, and plot the ROC curve achieved by our model. To evaluate our software, we compute the AUC value, accuracy, Sensitivity (SS), Specificity (SP), Positive Predictive Value (PPV), and Negative Predictive Value (NPV).
In order to generate the ROC curve and AUC from our segmentation network, we innovatively propose a new method in this study. For each patient, the predictions at each pixel of an input CT slice (Fig. 5a) were computed with a confidence score, which can be displayed as a gray level within the range of [0,255]. The threshold value was set to 127. Every input CT slice of the patient was then preprocessed by normalizing pixel values from the range [0, 255] to [0, 1], with a threshold value of 0.5, changing the gray image (Fig. 5b) into a binary image (Fig. 5c). The degree of confidence in a tuberculosis lesion was obtained by averaging the confidence scores for every pixel within the identified region. Therefore, each patient possesses a degree of confidence, and the patient-level predictions were then obtained to generate the ROC curve.
Fig. 5.

Example images for generating the ROC curve: (a) Input CT image of a patient; (b) gray image; (c) binary image.
3. Result
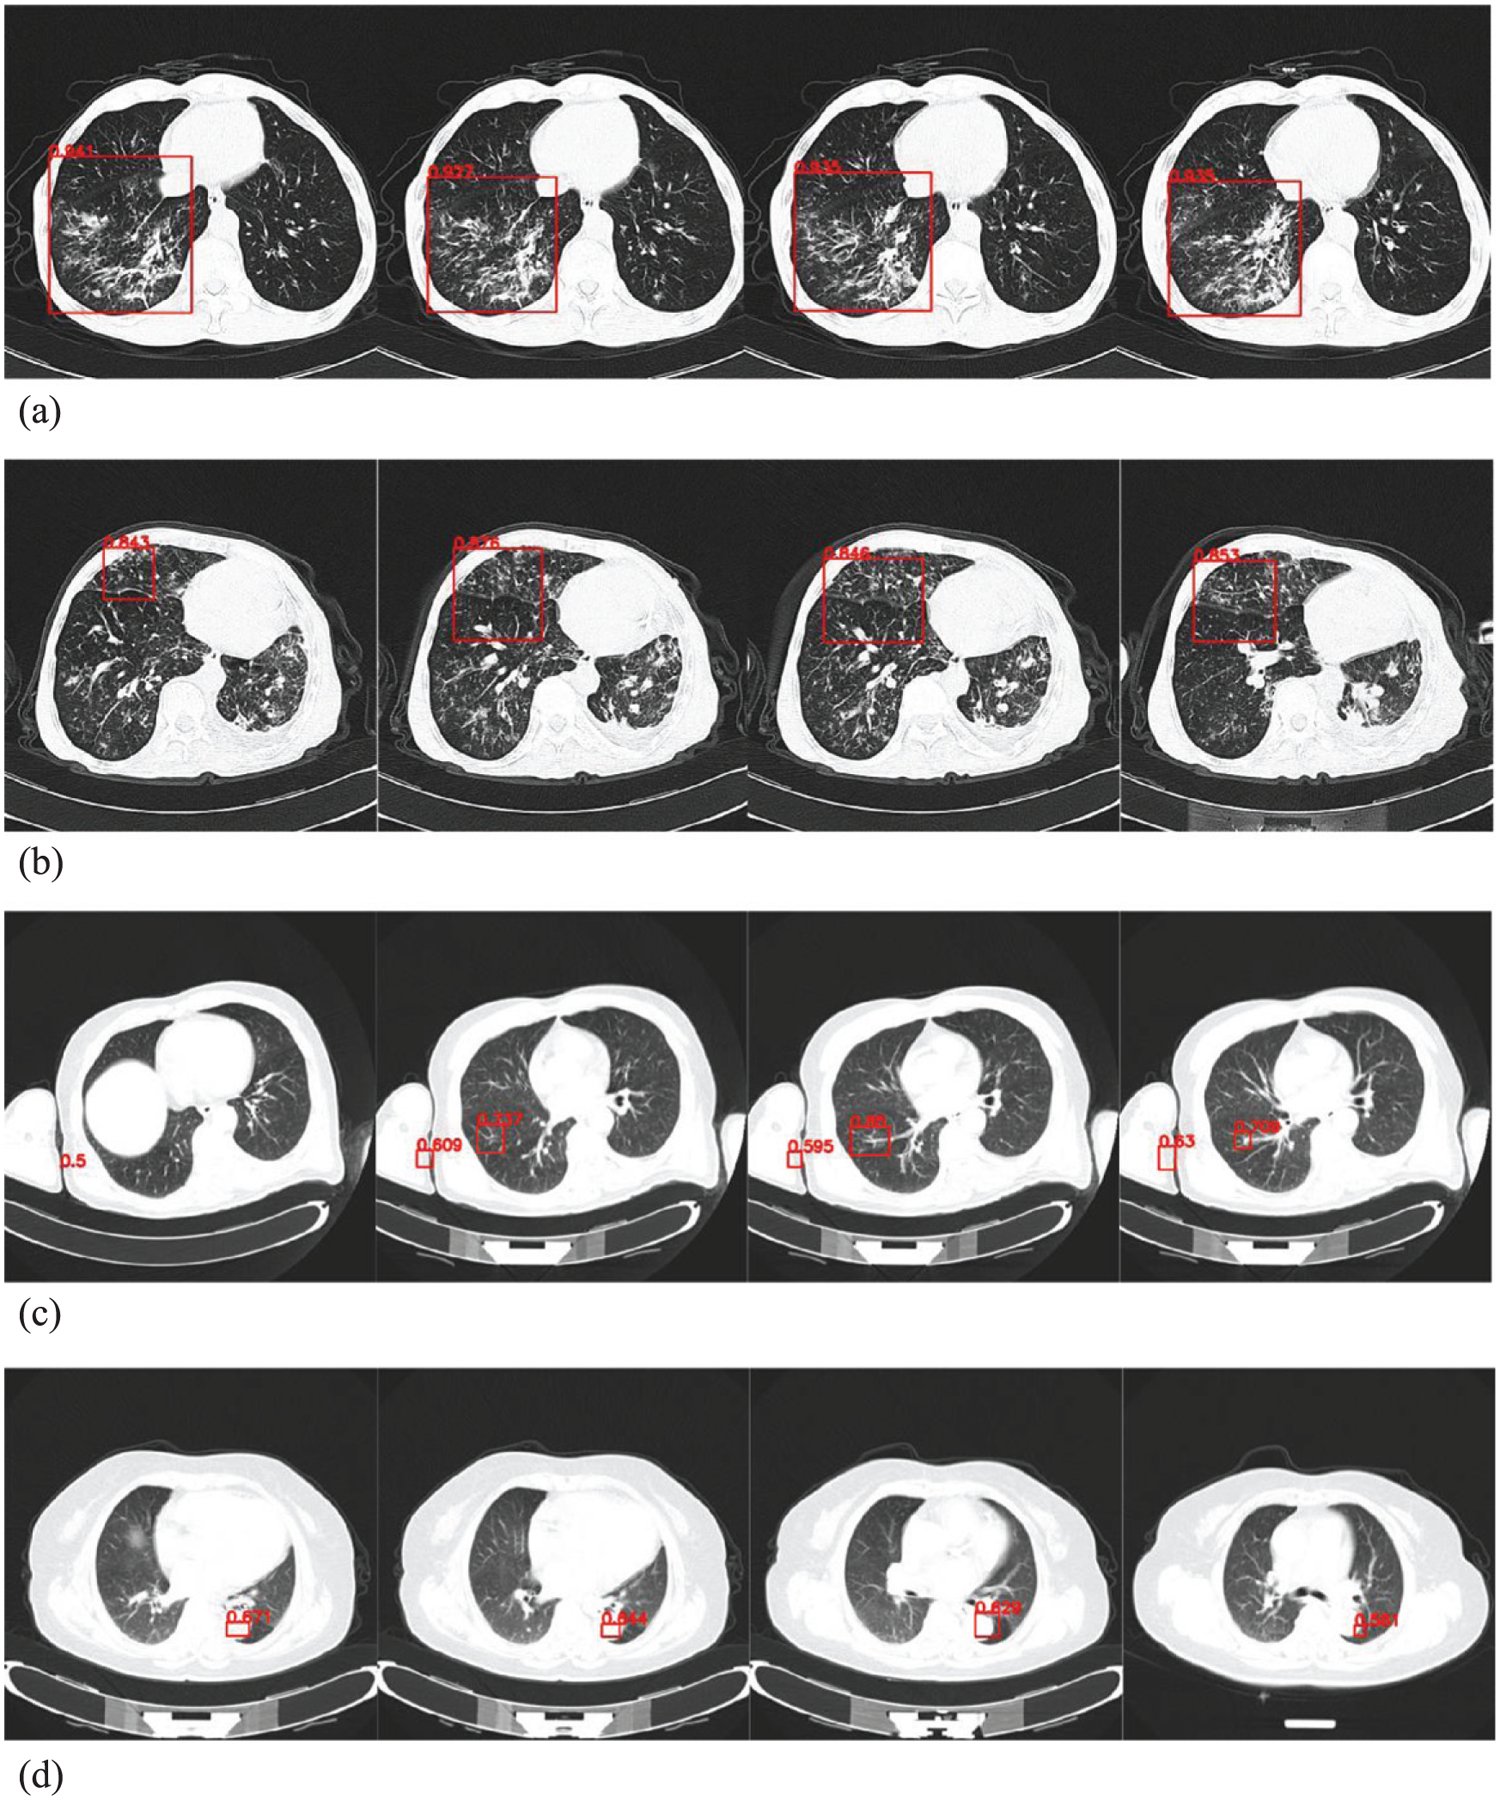
Applying our AI detection software to the testing data of 279 cases, the number of correctly detected ATB cases was 134, the number of missed positive ATB diagnoses was 5, the number of correctly detected non-ATB cases was 136, and the number of false positives was 4, as shown in Table 3. Figure 6 (a) shows the original four consecutive CT layers of an ATB patient in the testing data, and Fig. 6 (b) shows the corresponding four CT layers of the ATB patient diagnosed by our AI software. Figure 7 is a ROC curve plotted for our AI detection software on the testing data. The area under the ROC curve reached 0.980 (AUC = 0.980). We computed the following performance indices for our software: The accuracy rate is 0.968, the SS is 0.964, the SP is 0.971, the PPV is 0.971, and the NPV is 0.964, as shown in Table 4.
Table 3.
Software performance on testing data
| True value | |||||
|---|---|---|---|---|---|
| ATB (case)+ | Not ATB (case) − | Total (case) | |||
| Pneumonia | Normal | ||||
| Predicted value | ATB (case)+ | 134 | 2 | 2 | 138 |
| Not ATB (case) − | 5 | 38 | 98 | 141 | |
| Total (case) | 139 | 40 | 100 | 279 | |
Fig. 6.

CT slices of an ATB patient in the testing data. (a) Original slices and (b) abnormalities detected by the software.
Fig. 7.
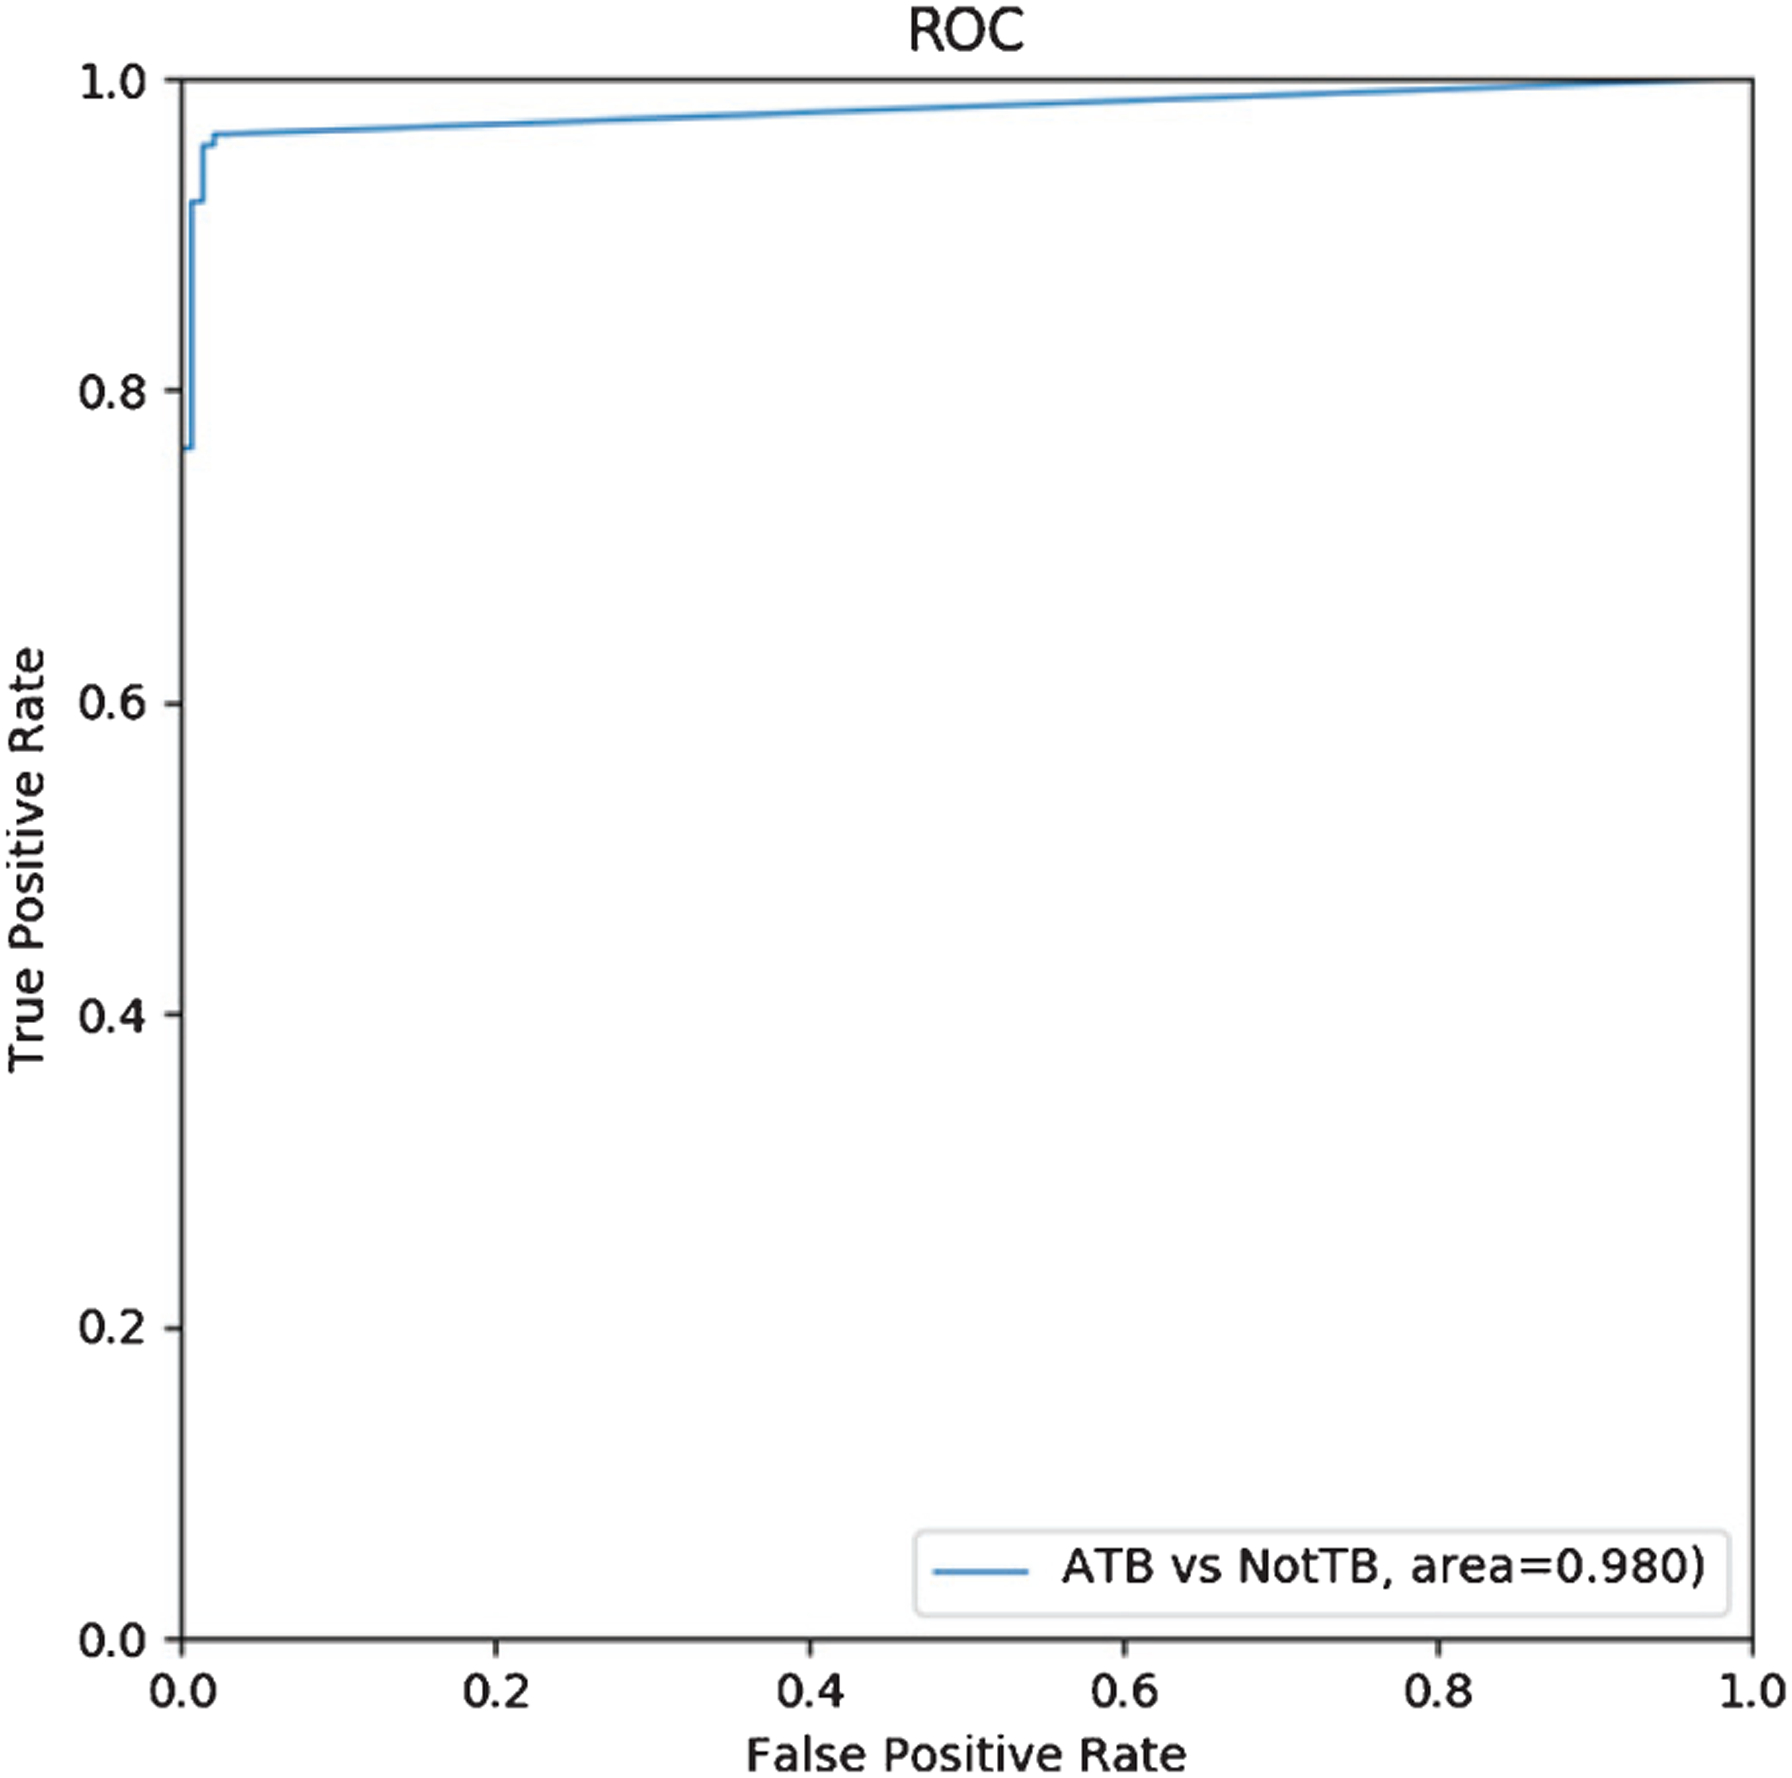
ROC curve for ATB vs no-ATB.
Table 4.
Software performance on testing data
| Evaluation index | AUC | Accuracy | SS | SP | PPV | NPV |
|---|---|---|---|---|---|---|
| Result | 0.980 | 0.968 | 0.964 | 0.971 | 0.971 | 0.964 |
4. Discussion
Tuberculosis is a disease that occurs throughout the world. Because chest X-rays have limitations, CT has become important for the diagnosis of ATB [20]. Researchers have tried using various automated detection methods to diagnose tuberculosis [6, 21–24]. However, to the best of our knowledge, chest radiographs are commonly used for detecting ATB, and no studies have been conducted for detecting ATB in CT images using AI. A study on the detection of pulmonary tuberculosis using AI in CT has reported the prediction of multi-drug resistant tuberculosis in CT lung images based on deep learning technology, with an accuracy rate of 91.11% [25].
In the data analysis, we found that the minimum ages of ATB, normal, and pneumonia patients were 12, 5, and 14 respectively, and the maximum ages were 89, 68, and 89, respectively. In the testing data, the minimum ages of ATB, normal, and pneumonia patients were 7, 2, and 18 respectively, and the maximum ages were 85, 83, and 86, respectively. In each group of cases, there are minors (under 18 years old) and elderly (over 60 years old), which means that the data contains immature young lungs, which may be smaller than the lungs of adults, while the elderly may have atrophy and other factors leading to smaller lungs. The factor of age has little effect on the AI detection software.
In contrast to previous AI research in medical imaging diagnosis, in the development process, we adopted the recommendations of radiologists. Radiologists in the CT room need to handle patients with different diseases during their daily work, which requires AI to identify diseases like radiologists. Accordingly, the AI detection software of this study first tries to distinguish ATB, pneumonia, and normal CTs. Unlike chest X-rays, CT diagnosis requires several consecutive slices to be inspected. Therefore, when diagnosing ATB patients, image processing methods are proposed in this study that can effectively convert the 2D ROI in each CT slice into a 3D OOI, which has been described previously in Section 2.2.2. The recommendations of doctors and radiologists were a tremendous help to our image processing method for AI diagnosis of ATB. The AI detection software in this paper not only relies on neural networks to make the diagnosis, but also lays the foundation for adding other diseases later and for applying ATB detection software at a clinic in the future.
In this paper, U-Net is used to perform image segmentation prediction on the testing data. As a result, we found that some slices in normal and pneumonia patients in the testing data were misjudged as ATB regions, as shown in Fig. 8. The causes of misdiagnosis include: stomach, intestine, sternal angle and trachea, pulmonary blood vessels, thoracic aorta, humerus, wearing of metal clothes, and pneumonia lesions mistaken for ATB lesions. Therefore, we adopted an image processing method to eliminate the ATB lesion areas incorrectly predicted by U-Net in the CT image.
Fig. 8.

Misdiagnosed CT images of normal and pneumonia patients by U-Net: (a) stomach; (b) intestinal; (c) sternal angle and trachea; (d) left pulmonary vascular cross section; (e) thoracic aorta; (f) right humerus; (g) metal clothing in vitro; (h) right-sided pneumonia lesion.
Four cases of misdiagnosis are shown in Fig. 9 (a), (b): Two cases of pneumonia were misdiagnosed as ATB, because the two cases of pneumonia lesions affected more than two lung lobes. The other 2 cases of normal patients were misdiagnosed as ATB slices, as shown in Fig. 9 (c) and (d). Figure 9 (c) shows how the AI software incorrectly responded to the heightened cross section of the blood vessels in the right lung and the right humerus. Density shadows are misdiagnosed as ATB lesions; Fig. 9 (d) shows that the software mistakes a high-density shadow of a normal thoracic aorta as an ATB lesion.
Fig. 9.
AI detection software was used to diagnose images of normal and pneumonia patients in the testing data (a) right-sided pneumonia lesion; (b) right-sided pneumonia lesion; (c) images of right humeral head and right lung in normal patient; (d) normal thoracic aortic images.
Figure 10 shows cases missed by the AI detection software. We found that five cases of ATB were missed. After further analysis, we found that the common imaging characteristics of the five missed patients were small and atypical lesions. The ATB lesions in some slices were relatively small and not predicted by U-Net. The ATB lesions were predicted in some slices; however, less than 4 consecutive slices with predicted ATB lesions were generated by the software, so the software eventually misdiagnosed the patient, as shown in Fig. 10.
Fig. 10.
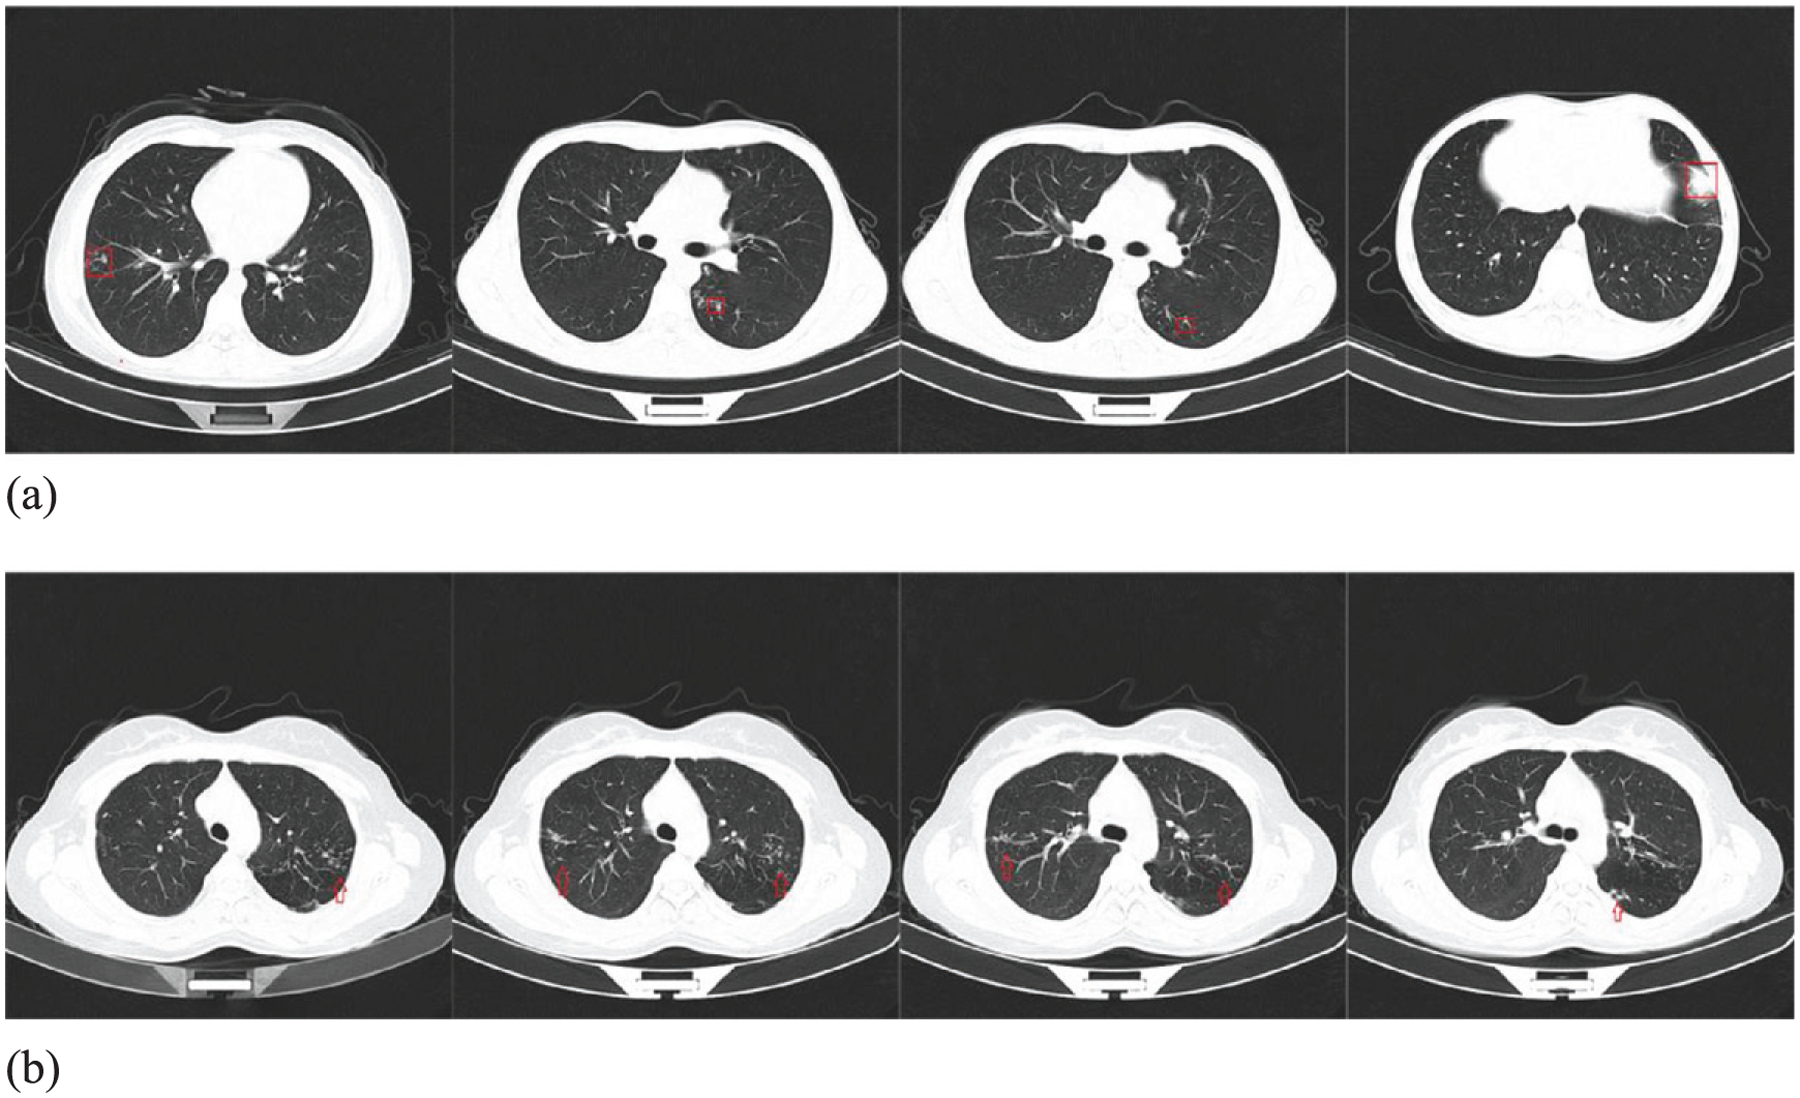
CT slices of an ATB patient missed by the software.
The AI detection software developed in this study has following advantages and potentially clinical application value. First, ATB has a high incidence in resource-poor areas and areas where people’s quality of life is not high. These areas are often lacking radiologists [26]. The accuracy, sensitivity, and specificity of the AI software developed in this paper can help to reduce the workload of radiologists in remote areas. Second, this AI detection software has laid a foundation for distinguishing ATB from other lung diseases in future research. Third, image processing methods have been added to effectively convert a 2-D region of interest into a 3-D object of interest for a CT scan, see Section 2.2.2. This method can delete false positive slices and effectively improve the accuracy of diagnosis.
This study also has limitations. First, our training data does not contain other diseases and abnormalities, such as lung abscess, obsolete pulmonary tuberculosis, lung tumors, multiple nodules and other lung diseases. We plan to add other lung diseases in the next step to widen the scope of the algorithm. Second, because this study assumes that more than four consecutive lesion slices define an ATB patient, this may cause lesions of less than two centimeter in size to be missed (CT slice thickness is 5 mm); however, considering that most ATB lesions are larger, the impact is relatively small.
5. Conclusion and future work
This study successfully developed an AI software tool for automatic detection of ATB in chest CT. The software has a high performance, with an AUC value of 0.980. The accuracy is 0.968, the SS is 0.964, the SP is 0.971, the PPV is 0.971, and the NPV is 0.964. In summary, our study shows that using AI detection software can not only diagnose ATB patients, and distinguish between ATB and non-ATB (normal and pneumonia), but also simplify the diagnosis process for doctors. Therefore, this AI detection software lays a foundation for the application of AI in CT diagnosis of ATB in clinical medicine.
In order to improve the completeness and practicality of this software, future research should continue adding training data for other lung diseases. At present, drug-resistant tuberculosis has become a problem. In our next study, we will use CT data of drug-resistant tuberculosis to train and develop an AI detection system based on deep learning to predict drug-resistant tuberculosis in CT images.
Acknowledgments
This work was funded by Shenzhen Science and Technology Program (Grant No. KQTD2017033 110081833). This work was partially supported by the Intramural Research Program of the Lister Hill National Center for Biomedical Communications (LHNCBC) at the U.S. National Library of Medicine (NLM), National Institutes of Health (NIH).
References
- [1].World Health Organization. Global tuberculosis report 2018. [2018-09-18], https://www.who.int/tb/Publications/globalreport/en/. 2018
- [2].World Health Organization. Systematic screening for active tuberculosis: principles and recommendations, World Health Organization, 2013. [PubMed] [Google Scholar]
- [3].Lee SW, Jang YS, Park CM, et al. The role of chest CT scanning in TB outbreak investigation, Chest 137(5) (2010), 1057–1064. [DOI] [PubMed] [Google Scholar]
- [4].Bhalla AS, Goyal A, Guleria R, et al. Chest tuberculosis: Radiological review and imaging recommendations, The Indian Journal of Radiology & Imaging 25(3) (2015), 213. [DOI] [PMC free article] [PubMed] [Google Scholar]
- [5].Lange C and Mori T, Advances in the diagnosis of tuberculosis, Respirology 15(2) (2010), 220–240. [DOI] [PubMed] [Google Scholar]
- [6].Melendez J, Sánchez CI, Philipsen R, et al. An automated tuberculosis screening strategy combining X-ray-based computer-aided detection and clinical information, Scientific Reports 6 (2016), 25265. [DOI] [PMC free article] [PubMed] [Google Scholar]
- [7].Van’t Hoog AH, Meme HK, Van Deutekom H, et al. High sensitivity of chest radiograph reading by clinical officers in a tuberculosis prevalence survey, The International Journal of Tuberculosis and Lung Disease 15(10) (2011), 1308–1314. [DOI] [PubMed] [Google Scholar]
- [8].Panicker RO, Soman B, Saini G, et al. A review of automatic methods based on image processing techniques for tuberculosis detection from microscopic sputum smear images, Journal of Medical Systems 40(1) (2016), 17. [DOI] [PubMed] [Google Scholar]
- [9].Hwang EJ, Park S, Jin KN, et al. Development and validation of a deep learning–based automatic detection algorithm for active pulmonary tuberculosis on chest radiographs, Clinical Infectious Diseases 69(5) (2018), 739–747. [DOI] [PMC free article] [PubMed] [Google Scholar]
- [10].Zhao X, Qi S, Zhang B, et al. , Deep CNN models for pulmonary nodule classification: model modification, model integration, and transfer learning, Journal of X-ray Science and Technology 27(4) (2019), 615–629. [DOI] [PubMed] [Google Scholar]
- [11].Zech JR, Badgeley MA, Liu M, et al. Variable generalization performance of a deep learning model to detect pneumonia in chest radiographs: A cross-sectional study, PLoS Medicine 15(11) (2018), e1002683. [DOI] [PMC free article] [PubMed] [Google Scholar]
- [12].Dantsev VV, Golota AS, Karpuschenko VG, et al. The modern state and improvement prospects of community-acquired pneumonia and pulmonary tuberculosis differential diagnostics, Voenno-meditsinskii Zhurnal 336(5) (2015), 29–36. [PubMed] [Google Scholar]
- [13].Qu H, Zhang W, Yang J, et al. The value of the air bronchogram sign on CT image in the identification of different solitary pulmonary consolidation lesions, Medicine 97(35) (2018), e11985. [DOI] [PMC free article] [PubMed] [Google Scholar]
- [14].Goo JM, Im JG, CT of tuberculosis and nontuberculous mycobacterial infections, Radiologic Clinics of North America 40(1) (2002), 73–87. [DOI] [PubMed] [Google Scholar]
- [15].McAdams HP, Radiological manifestations of pulmonary tuberculosis, Radiol Clin Morth Am 33(4) (1995), 655–678. [PubMed] [Google Scholar]
- [16].Nambu A, Saito A, Araki T, et al. Chlamydia Pneumoniae: Comparison with Findings of Mycoplasma Pneumoniae and Streptococcus Pneumoniae at Thin-Section CT, Radiology 238(1) (2006), 330–338. [DOI] [PubMed] [Google Scholar]
- [17].Nambu A, Ozawa K, Kobayashi N, et al. Imaging of community-acquired pneumonia: Roles of imaging examinations, imaging diagnosis of specific pathogens and discrimination from noninfectious diseases, World Journal of Radiology 6(10) (2014), 779–793. [DOI] [PMC free article] [PubMed] [Google Scholar]
- [18].Song L, Liu J, Qian B, et al. A deep multi-modal CNN for multi-instance multi-label image classification, IEEE Transactions on Image Processing 27(12) (2018), 6025–6038. [DOI] [PubMed] [Google Scholar]
- [19].Ronneberger O, Fischer P and Brox T, U-net: Convolutional networks for biomedical image segmentation[C]//International Conference on Medical image computing and computer-assisted intervention. Springer, Cham: (2015), 234–241. [Google Scholar]
- [20].Eisenberg RL and Pollock NR, Low yield of chest radiography in a large tuberculosis screening program, Radiology 256(3) (2010), 998–1004. [DOI] [PMC free article] [PubMed] [Google Scholar]
- [21].Jaeger S, Karargyris A, Candemir S, et al. Automatic screening for tuberculosis in chest radiographs: a survey, Quantitative Imaging in Medicine and Surgery 3(2) (2013), 89. [DOI] [PMC free article] [PubMed] [Google Scholar]
- [22].Jaeger S, Karargyris A, Candemir S, et al. Automatic tuberculosis screening using chest radiographs, IEEE Transactions on Medical Imaging 33(2) (2013), 233–245. [DOI] [PubMed] [Google Scholar]
- [23].Vajda S, Karargyris A, Jaeger S, et al. Feature selection for automatic tuberculosis screening in frontal chest radiographs, Journal of Medical Systems 42(8) (2018), 146. [DOI] [PubMed] [Google Scholar]
- [24].Hogeweg L, Sánchez CI, Maduskar P, et al. Automatic detection of tuberculosis in chest radiographs using a combination of textural, focal, and shape abnormality analysis, IEEE Transactions on Medical Imaging 34(12) (2015), 2429–2442. [DOI] [PubMed] [Google Scholar]
- [25].Gao XW, Qian Y, Prediction of multidrug-resistant TB from CT pulmonary images based on deep learning techniques, Molecular Pharmaceutics 15(10) (2017), 4326–4335. [DOI] [PubMed] [Google Scholar]
- [26].Qin C, Yao D, Shi Y, et al. Computer-aided detection in chest radiography based on artificial intelligence: a survey, Biomedical Engineering Online 17(1) (2018), 113. [DOI] [PMC free article] [PubMed] [Google Scholar]