

Abstract
Background
Prunella vulgaris L. (PVL) extracts have been reported to inhibit the proliferation and promote the apoptosis of lung cancer cells. However, its pharmacological mechanism remains unclear. The objective of this study was to explore the main active ingredients and potential molecular mechanisms of PVL in the treatment of non-small cell lung cancer (NSCLC).
Materials and methods
The differentially expressed genes (DEGs) associated with NSCLC were obtained by analyzing microarray dataset GSE136043 in Gene Expression Omnibus. The bioactive components of PVL were obtained using TCMSP database, and the related targets of PVL were collected using the Swiss Target Prediction database, and drug-disease common targets were subsequently obtained. Protein–protein interaction (PPI) network was constructed using a STRING database and core targets were obtained via Cytoscape 3.9.0 software. Gene Ontology (GO) and Kyoto Encyclopedia of Genes and Genomes (KEGG) enrichment analyses of the common targets were performed using DAVID database. Molecular docking analysis was then performed using AutoDock Vina software. Finally, the therapeutic activity of morin, a crucial component of PVL, against NSCLC was verified by in vitro experiments.
Results
A total of 11 active components and 180 targets of PVL were obtained, 39 of which overlapped with NSCLC’s disease targets, and were considered to be “drug-disease” common targets. Morin, luteolin, delphinidin, kaempferol and quercetin were considered key components of PVL in NSCLC treatment. AKT1, MMP9, ESR1, XDH, MAPT, and CYP1B1 were considered to be the core targets in the PPI network. These “drug-disease” common targets were associated with 100 GO items, including 41 biological processes, 16 cellular components, and 43 molecular functions. KEGG enrichment analysis identified 14 signaling pathways. The key components morin, luteolin, delphinidin, kaempferol and quercetin had good binding affinity with the core targets (AKT1, MMP9, ESR1, XDH and CYP1B1). Additionally, morin could inhibit NSCLC cell viability and promote cell apoptosis in a dose-dependent manner. In addition, morin could also reduce mRNA expression levels of core targets.
Conclusion
PVL may have the potential to treat NSCLC with a multi-component, multi-target and multi-pathway manner.
Keywords: Non-small cell lung cancer, Prunella vulgaris L., Network pharmacology, Bioinformatics, Molecular docking
Introduction
Lung cancer is one of the most frequently diagnosed malignancies worldwide and the leading cause of cancer-related death. Globally, 2,206,771 newly diagnosed cases and 1,796,144 deaths were reported in 2020 [1]. Non-small cell lung cancer (NSCLC) is the most common subtype of lung cancer, accounting for about 85% of diagnosed lung cancer cases, and is further divided into lung adenocarcinoma (LUAD), lung squamous cell carcinoma (LUSC) and large cell carcinoma (LCC) based on cytopathology [2]. At present, the main treatment strategies for NSCLC include surgical resection, chemotherapy, radiotherapy, targeted therapy and immunotherapy [3, 4]. However, the efficacy of existing treatments is still limited for the patients with distant metastasis and recurrence [5]. Therefore, it is urgent to develop safe and effective drugs as complementary or alternative therapies for NSCLC treatment.
Chinese herbal medicine has become an important resource for anti-cancer drug development [6]. Prunella vulgaris L. (PVL) is a perennial herb in the Labiaceae family, and is widely used in China as a herbal medicine, and it is also used in diet therapy, or used as a beverage component [7–9]. PVL has many chemical components, including triterpenoids, sterols, flavonoids, phenylpropanoids, organic acids, volatile oils and polysaccharides, among which triterpenoids and flavonoids were the main active components [8]. Previous studies have shown that PVL extract is cytotoxic to human gastric cancer cells, breast cancer cells and thyroid cancer cells [10–12]. In addition, it is reported that PVL extract can promote apoptosis of NSCLC cells, induce cell cycle arrest in vitro [13, 14]. However, the mechanism of action of PVL in NSCLC treatment has not been fully elucidated.
Network pharmacology is a new approach for drug discovery, which was firstly reported in 2007 [15, 16]. Molecular docking is an important technology in the field of computer-aided drug research and has become an increasingly important tool for drug discovery [17]. This study aims to explore the mechanism of action of PVL in NSCLC treatment using network pharmacology and molecular docking. The overall flow chart of this study is shown in Fig. 1.
Fig. 1.

Flowchart of the analytical procedures used in this study
Materials and methods
Screening of DEGs in NSCLC
From Gene Expression Omnibus (GEO), GSE136043 dataset (https://www.ncbi.nlm.nih.gov/geo/query/acc.cgi?acc=GSE136043) was downloaded, which contains gene expression profiles of 5 NSCLC tissue samples and 5 normal lung tissue samples. The GEO2R tool (http://www.ncbi.nlm.nih.gov/geo/geo2r/) was used for identifying the DEGs between cancer tissue samples and normal tissue samples [18, 19]. The cut-off criteria were false discover rate (FDR) < 0.05 and |log2 fold change (FC) | > 1, and the DEGs were visualized by the volcano map and the heat map.
Screening of active components of PVL and their action targets
According to oral bioavailability (OB) ≥ 30% and drug similarity (DL) ≥ 0.18 [20–22], active components of PVL were selected from the Traditional Chinese Medicine Systems Pharmacology Database and Analysis Platform (TCMSP, https://www.tcmsp-e.com/) [23]. SMILES files were obtained through NOVOPRO online platform (https://novopro.cn/tools/mol2smiles.html) and PubChem database (https://pubchem.ncbi.nlm.nih.gov). Then the SMILES files were imported into the SwissTargetPrediction database (http://www.swisstargetprediction.ch) for predicting the targets (probability ≥ 0).
Screening and network construction of potential targets for PVL
The Draw Venn Diagram tool (http://bioinformatics.psb.ugent.be/webtools/Venn/) was used for obtaining the “drug-disease” common targets. Cytoscape 3.9.0 software was used to construct the network diagram of “drug-disease” common targets, and the degree values of the nodes in the network were calculated through the CytoNCA plug-in to obtain the key components.
Construction of protein–protein interaction (PPI) network and screening of core targets
“Drug-disease” common targets were imported into the STRING database (https://cn.string-db.org/), and the species was set as “homo sapiens”, and the minimum interaction score required was set to “medium confidence” (0.4). After removing the free points, the PPI network was obtained. Using Centiscape 2.2 plug-in in Cytoscape 3.9.0 software, betweenness centrality (BC) ≥ 57.371428571428574, closeness centrality (CC) ≥ 0.01141715028016585, degree centrality (DC) ≥ 4.285714285714286 were applied for screening the core targets. The molecular complex detection (MCODE) plug-in was used for cluster analysis of PPI networks. MCODE score >2 and number of nodes >5 were set as the criteria.
Bioinformatics analysis
The “drug-disease” common targets were imported into the Database for Annotation, Visualization and Integrated Discovery (DAVID) database (https://david.ncifcrf.gov/tools.jsp) for gene ontology (GO) analysis and Kyoto Encyclopedia of Genes and Genomes (KEGG) enrichment analysis. With P < 0.05 as the screening condition, the key biological functions and signaling pathways probably affected by PVL in NSCLC treatment were obtained.
Using Gene Expression Profiling Interactive Analysis (GEPIA) database (http://gepia.cancer-pku.cn/), the expression characteristics of core target genes in NSCLC samples in The Cancer Genome Atlas (TCGA) database, and non-cancerous lung tissues in the Genotype-Tissue Expression (GTEx) project, were analyzed.
Using Kaplan Meier-Plotter database (http://kmplot.com/analysis/), the relationship between the expression levels of core target genes and NSCLC patients’ overall survival (OS) time was analyzed.
Tumor Immune Estimation Resource (TIMER) 2.0 (https://cistrome.shinyapps.io/timer/) was applied to study the relationship between core target expression and the level of immune cell infiltration in NSCLC tissues [24].
Molecular docking
AutoDock Vina software (v.1.1.2) was used to perform molecular docking of the key active components of PVL and core target proteins. X-ray crystal structures of the selected proteins were available from the Protein Database (PDB, https://www.rcsb.org/). Then, the PDB files were processed with PyMOL software, and water molecules were removed from the protein crystal structures, and hydrogen atoms were added, and the charge was calculated. From PubChem (https://www.ncbi.nlm.nih.gov/pccompound/), 3D structure files of the key active ingredients were downloaded, and converted into PDB format file with OpenBabel software (v.3.1.1). Next, the PDB format files were converted to PDBQT format files via AutoDockTools (version 1.5.7). The “grid box” function of AutoDockTools was used to define specific docking pockets in the selected proteins which may bind to the active ingredients. Finally, molecular docking was performed using AutoDock Vina software (v.1.1.2) to calculate the binding energy to evaluate the theoretical binding affinity of the active ingredient with the selected protein. PyMOL software was used to visualize the results.
Cell culture
Human NSCLC cell lines A549 and NCI-H1385, and immortalized normal lung epithelial cell line BEAS-2B were purchased from American Type Culture Collection (ATCC, Manassas, VA, USA). The cells were placed in Petri dishes containing Dulbecco’s Modified Eagle’s Medium (DMEM; Invitrogen, Carlsbad, CA, USA), with 10% fetal bovine serum (FBS; Beyotime, Shanghai, China), 100 U/mL penicillin and 100 μg/mL streptomycin (Invitrogen, Carlsbad, CA, USA), and cultured at 37 ℃ in 5% CO2.
Cell viability assay
The cell viability was evaluated by MTT assay. A549, NCI-H1385 and BEAS-2B cells of logarithmic growth stage were inoculated in 96-well culture plates with 100 μL cell suspension per well (1 × 10⁵ cells/mL) and cultured at 37 °C for 24 h. Next, different doses of morin (Purity: ≥95%, HPLC, Sigma-Aldrich, Shanghai, China) were used to treat the cells for 24 h. Subsequently, 100 μL of MTT solution was added to each well (0.5 mg/mL; Beyotime, Shanghai, China). After culture at 37℃ for 4 h, 150 μL dimethyl sulfoxide (DMSO, Beyotime, Shanghai, China) was added to each well, and shaken to dissolve the formazan crystal. Relative cell viability was then calculated by measuring absorbance at 490 nm wave length per well.
Evaluation of caspase-3 activity
A caspase-3 activity assay kit (#5723; Cell Signaling Technology, Shanghai, China) was applied to detect the activity of caspase-3. In short, A549 and NCI-H1385 cells were inoculated into 96-well plates at a density of 2000 cells per well and treated with different concentrations of morin (50 μM or 100 μM) for 24 h. The cells were harvested and lyzed with 50 µL lysis buffer (#7018; Cell Signaling Technology, Shanghai, China). Subsequently, after centrifugation at 14,000×g for 10 min, the supernatant was transferred to a fresh test tube and the protein concentration was detected using the bicinchoninic acid (BCA) assay kit (Beyotime, Shanghai, China). The sample was incubated with the DVD-NA substrate (final concentration = 200 µM) at 37 °C for 2 h. Finally, the absorbance values were read at 405 nm wave length using a microplate reader (Dynatech Labs, Chantilly, VA, USA) and the relative activity of caspase-3 was normalized to the activity of the control group.
Apoptosis assay
The apoptosis rate of A549 and NCI-H1385 cells was examined using an Annexin V-Fluorescein Isothiocyanate (FITC)/Propidium Iodide (PI) Apoptosis Assay Kit (BD Biosciences, San Jose, CA, USA) according to manufacturer’s instructions. After treating the cells with different concentrations of morin (50 μM or 100 μM) for 24 h, the cells were collected and trypsinized with 0.25% trypsin. After centrifugation (800 g, 4℃, 5 min), phosphate buffer saline (PBS; Sigma-Aldrich, Shanghai, China) was used to wash the cells twice. Then the cells were incubated with 5 μL PI and 5 μL Annexin V-FITC at room temperature for 15 min away from light. After the cells were washed with the binding buffer, a Beckman Coulter FC500 flow cytometer (Cytomics FC500; Beckman Coulter, Villepinte, France) was applied for detecting the apoptosis rate.
Quantitative real-time polymerase chain reaction (qRT-PCR)
A549 and NCI-H1385 cells were treated with different concentrations of morin (50 μM or 100 μM) for 24 h and cells were collected. Total RNA was extracted from the cells using the TRIzol reagents (Invitrogen, Carlsbad, CA, USA) according to the manufacturer’s protocol. Complementary DNA (cDNA) template was synthesized using a PrimeScript RT kit (TaKaRa, Dalian, China). qRT-PCR was performed with a SYBR Premix Ex Taq kit (TaKaRa, Dalian, China) in Applied Biosystems System 7500 (Thermo Fisher Scientific, Waltham, MA, USA). Using GAPDH as the endogenous control, the relative expression levels of the target genes were calculated by 2−ΔΔCt method. The primers used for qRT-PCR are shown in Table 1. All primers were synthesized by GenePharma Co., Ltd, (Shanghai, China).
Table 1.
Sequences for qRT-PCR primers
| Name | Primer sequences |
|---|---|
| AKT1 | Forward: 5′-CCCAGGAGGTTTTTGGGCTT-3′ |
| Reverse: 5′-AAGGTGCGTTCGATGACAGT-3′ | |
| MMP9 | Forward: 5′-TCCCTGGAGACCTGAGAACC-3′ |
| Reverse: 5′-CCACCCGAGTGTAACCATAGC-3′ | |
| ESR1 | Forward: 5′-CTGCCAAGGAGACTCGCTAC-3′ |
| Reverse: 5′-GCAACTCTTCCTCCGGTTCT-3′ | |
| XDH | Forward: 5′-CAGAAGCTGGGCCAAGAGAA-3′ |
| Reverse: 5′-AGCTCTCTGTGTGTGTTCCG-3′ | |
| CYP1B1 | Forward: 5′-CACCGTTTTCCGCGAATTC-3′ |
| Reverse: 5′-CCTTCTTTTCCGCAGAGAGGAT-3′ | |
| HIF-1α | Forward: 5′-AGAGGTTGAGGGACGGAGAT-3′ |
| Reverse: 5′-CTCCGACATTGGGAGCTCAT-3′ | |
| GAPDH | Forward: 5′-AATGGGCAGCCGTTAGGAAA-3′ |
| Reverse: 5′-GCGCCCAATACGACCAAATC-3′ |
Statistical analysis
All data in the in vitro assays were expressed as “mean ± standard deviation (SD)”. SPSS 21.0 software (IBM Corp., Armonk, NY, USA) was used for statistical analysis of the data. The normality of the data was tested with Shapiro–Wilk test, and the homogeneity of variances was tested with Levene’s test. Multiple groups were compared using one-way analysis of variance (ANOVA) and Tukey post hoc tests. All experiments were conducted independently at least in triplicate. A P value <0.05 was considered statistically significant.
Results
Identification and analysis of DEGs in NSCLC
GSE136043 was analyzed to identify DEGs in adjacent lung tissue and NSCLC tissues. First, the expression matrix was constructed with the 10 samples, and two clusters were identified using principal component analysis (PCA). The results showed significant differences between the normal and tumor groups (Fig. 2A). Next, a total of 3264 DEGs were identified, including 1709 up-regulated genes and 1555 down-regulated genes (Fig. 2B). To investigate the biological functions and mechanisms of 3264 DEGs, GO and KEGG enrichment analyses were performed. The results showed that these DEGs were mainly enriched in cell adhesion, extracellular matrix organization, inflammatory response, angiogenesis and animal organ morphogenesis (Fig. 2C). In addition, 40 pathways were associated with the 3264 DEGs, which were predicted by KEGG enrichment analysis. The top 10 pathways included ECM-receptor interaction (hsa04512), human papillomavirus infection (hsa05165), protein digestion and absorption (hsa04974), melanogenesis (hsa04916), cushing syndrome (hsa04934), complement and coagulation cascades (hsa04610), HIF-1 signaling pathway (hsa04066), viral protein interaction with cytokine and cytokine receptor (hsa04061), Wnt signaling pathway (hsa04310) and arrhythmogenic right ventricular cardiomyopathy (hsa05412) (Fig. 2D).
Fig. 2.

Collection of NSCLC-related target genes. A Principal component analysis (PCA) diagram based on GSE136043 dataset. B A volcano map was used to show DEGs between normal and tumor groups in GSE136043 dataset. The horizontal axis is the fold change of gene expression, and the vertical axis is the P value of the change in gene expression. Red dots represent genes whose expression is upregulated. Blue dots represent genes that are down-regulated. The gray dots represent genes with no significant differences. C GO analysis diagram of the DEGs. According to P value < 0.05, the top 10 BP (green), CC (yellow) and MF (purple) items with the largest enrichment fold were selected for visualization. D KEGG pathway enrichment analysis diagram of the DEGs. The top 10 KEGG pathways with the smallest P values were visualized. The color and size of each bubble represent the P value and gene count, respectively
Screening of PVL’s active ingredients and their targets
According to the screening criteria of OB ≥ 30% and DL ≥ 0.18, 11 potential active ingredients of PVL were obtained from TCMSP database (Table 2). The molecular structures of the active components of PVL are shown in Fig. 3. From SwissTargetPrediction database, 180 drug targets of the ingredients of PVL were obtained. Next, the common genes were screened from 3264 DEGs and 180 drug targets, and 39 common targets were obtained, which were defined as “drug-disease” common targets (Fig. 4A). Compared with the non-cancerous tissues, 21 genes were significantly up-regulated and 18 genes were significantly down-regulated in NSCLC tissues in GSE136043 (Fig. 4B; Table 3).
Table 2.
Details of active compounds in Prunella vulgaris L
| No | Mol ID | Molecule name | OB (%) | DL | PubChem CID | SMILES | Interaction |
|---|---|---|---|---|---|---|---|
| 1 | MOL000358 | Beta-sitosterol | 36.91 | 0.75 | 222284 | CCC(CCC(C)C1CCC2C1(CCC3C2CC=C4C3(CCC(C4)O)C)C)C(C)C | 44 |
| 2 | MOL000422 | Kaempferol | 41.88 | 0.24 | 5280863 | C1=CC(=CC=C1C2=C(C(=O)C3=C(C=C(C=C3O2)O)O)O)O | 104 |
| 3 | MOL004355 | Spinasterol | 42.98 | 0.76 | 5281331 | CCC(C=CC(C)C1CCC2C1(CCC3C2=CCC4C3(CCC(C4)O)C)C)C(C)C | 58 |
| 4 | MOL000449 | Stigmasterol | 43.83 | 0.76 | 5280794 | CCC(C=CC(C)C1CCC2C1(CCC3C2CC=C4C3(CCC(C4)O)C)C)C(C)C | 41 |
| 5 | MOL004798 | Delphinidin | 40.63 | 0.28 | 128853 | C1=C(C=C(C(=C1O)O)O)C2=[O+]C3=CC(=CC(=C3C=C2O)O)O | 104 |
| 6 | MOL000006 | Luteolin | 36.16 | 0.25 | 5280445 | C1=CC(=C(C=C1C2=CC(=O)C3=C(C=C(C=C3O2)O)O)O)O | 104 |
| 7 | MOL006767 | Vulgaxanthin-I | 56.14 | 0.26 | 5281217 | C1C(N=C(C=C1C=CNC(CCC(=O)N)C(=O)O)C(=O)O)C(=O)O | 1 |
| 8 | MOL006772 | Poriferasterol monoglucoside_qt | 43.83 | 0.76 | N/A | CC[C@H](C=C[C@@H](C)[C@@H]1CC[C@@H]2[C@@H]3CC=C4C[C@@H](O)CC[C@]4(C)[C@H]3CC[C@]12C)C(C)C | 48 |
| 9 | MOL006774 | Stigmast-7-enol | 37.42 | 0.75 | 12315384 | CCC(CCC(C)C1CCC2C1(CCC3C2=CCC4C3(CCC(C4)O)C)C)C(C)C | 56 |
| 10 | MOL000737 | Morin | 46.23 | 0.27 | 5281670 | C1=CC(=C(C=C1O)O)C2=C(C(=O)C3=C(C=C(C=C3O2)O)O)O | 104 |
| 11 | MOL000098 | Quercetin | 46.43 | 0.28 | 5280343 | C1=CC(=C(C=C1C2=C(C(=O)C3=C(C=C(C=C3O2)O)O)O)O)O | 104 |
OB oral bioavailability, DL drug-likeness
Fig. 3.

Chemical structures of the bioactive ingredients of PVL
Fig. 4.

Collection of targets for PVL in NSCLC treatment. A A Venn diagram was applied to screen the drug-disease common targets. B A heat map was used to show the difference in the expression of drug-disease common targets in NSCLC tissue samples and normal lung tissue samples in GSE136043. Blue represents the normal group and red represents the tumor group
Table 3.
Potential candidate targets of Prunella vulgaris L. for treating non-small cell lung cancer
| No | Gene symbol | P value | logFC | No | Gene symbol | P value | log FC |
|---|---|---|---|---|---|---|---|
| 1 | AKR1B10 | 0.0000866 | 2.3932595 | 21 | ACHE | 0.0415 | 3.5809483 |
| 2 | ADORA3 | 0.000332 | 1.5149787 | 22 | NOS2 | 0.00000115 | −2.9362951 |
| 3 | SERPINA6 | 0.000388 | 1.6530115 | 23 | PDE4D | 0.00000708 | −1.8826387 |
| 4 | GCGR | 0.000427 | 1.079908 | 24 | CA4 | 0.0000316 | −4.677416 |
| 5 | CYP1B1 | 0.00129 | 2.353458 | 25 | CHRM2 | 0.000517 | −1.0184839 |
| 6 | MMP12 | 0.00129 | 4.3452597 | 26 | ABCB1 | 0.000757 | −3.130854 |
| 7 | CAMK2B | 0.00175 | 1.5617937 | 27 | CDK6 | 0.00093 | −1.4464042 |
| 8 | HSD17B2 | 0.00207 | 1.3030574 | 28 | ABCG2 | 0.00117 | −1.2862328 |
| 9 | NEK6 | 0.00293 | 1.1406784 | 29 | AKR1C1 | 0.00167 | −1.6951737 |
| 10 | TOP2A | 0.00341 | 1.8746864 | 30 | FABP5 | 0.00281 | −1.3844588 |
| 11 | XDH | 0.00345 | 2.4103457 | 31 | ALOX5 | 0.00753 | −1.0923645 |
| 12 | AKT1 | 0.00364 | 1.3787715 | 32 | SLC6A4 | 0.00958 | −1.6490666 |
| 13 | MMP13 | 0.00748 | 3.2412005 | 33 | CA2 | 0.0117 | −1.2531044 |
| 14 | PTGES | 0.00781 | 1.1341809 | 34 | BCHE | 0.0123 | −1.5660594 |
| 15 | CA13 | 0.00982 | 1.4324762 | 35 | HSD11B1 | 0.0125 | −1.3634651 |
| 16 | MMP9 | 0.0114 | 1.9071978 | 36 | PFKFB3 | 0.013 | −2.3139196 |
| 17 | MAPT | 0.0163 | 1.2303265 | 37 | AKR1C4 | 0.0138 | −1.0646393 |
| 18 | CCNB2 | 0.0163 | 1.1197655 | 38 | ESR1 | 0.0213 | −1.1750729 |
| 19 | PTPRF | 0.0253 | 1.1681767 | 39 | AR | 0.0267 | −1.0753623 |
| 20 | SHBG | 0.0398 | 1.1883309 |
FC fold change
Construction of composition-intersection target network diagram
Next, Cytoscape 3.9.0 software was used to construct a composition-intersection target network. The network consisted of 52 nodes and 234 edges (Fig. 5A). CytoNCA plug-in was further used to calculate the degree value of each node, and the greater the degree value, the greater the possibility of the ingredient playing a therapeutic role. Morin (degree = 26), luteolin (degree = 25), delphinidin (degree = 25), kaempferol (degree = 25) and quercetin (degree = 23) with the highest degree values were considered to be the key active ingredients of PVL in NSCLC treatment (Fig. 5B).
Fig. 5.

Construction and analysis of the network between drug-disease common targets and ingredients of PVL. A The network between drug-disease common targets and ingredients of PVL was constructed using Cytoscape 3.9.0 software. The pink diamond represents PVL, the green circle represents the 10 active components of PVL, and the blue V represents the target gene. B Statistical chart of degree values of 10 active ingredients of PVL
PPI network construction
Next, the 39 common targets were imported into STRING database and a PPI network was constructed. The network consisted of 35 nodes and 75 edges (Fig. 6A). Subsequently, a core network consisting of 6 nodes and 9 edges was determined based on topological parameter analysis (Fig. 6B). Through network analysis, six core targets were identified, namely AKT1 (degree value = 15), MMP9 (degree value = 13), ESR1 (degree value = 13), XDH (degree value = 7), MAPT (degree value = 6) and CYP1B1 (degree value = 5). In addition, cluster analysis with MCODE plug-in generated a highly connected subnetwork consisting of 6 nodes and 10 edges (Fig. 6C).
Fig. 6.

PPI network construction and analysis of the target of PVL in NSCLC treatment. A PPI network of potential targets of PVL in the treatment of NSCLC. Nodes represent proteins and edges represent protein–protein interactions. B Centiscape 2.2 was applied to obtain the central node of the PPI network. The larger the degree value, the darker the node color and the larger the font. C The cluster analysis of the PPI network
Biological function prediction of “drug-disease” common targets
Then GO analysis was performed with the 39 common targets. A total of 100 GO items were identified, including 41 biological processes (BP), 16 cellular components (CC), and 43 molecular functions (MF). The top 20 BP, CC, and MF items were selected for visualization in order (Fig. 7A–C). The results showed that for BP, the targets of PVL in NSCLC treatment were mainly involved in the daunorubicin metabolic process (GO:0044597), steroid metabolic process (GO:0008202), doxorubicin metabolic process (GO:0044598), response to beta-amyloid (GO:1904645), androgen metabolic process (GO:0008209), et al. (Fig. 7A). For CC, the common targets were associated with nuclear envelope lumen (GO:0005641), synapse (GO:0045202), extracellular region (GO:0005576), cytosol (GO:0005829) and plasma membrane (GO:0005886), etc. (Fig. 7B). Steroid binding (GO:0005496), enzyme binding (GO:0019899), alditol:NADP+ 1-oxidoreductase activity (GO:0004032), 17-beta-hydroxysteroid dehydrogenase (NADP+) activity (GO:0072582) and collagen binding (GO:0005518) were significantly enriched in MF (Fig. 7C). In addition, a bar chart shows the items with the highest gene count in each category (a total of 30 terms) (Fig. 7D). Through KEGG enrichment analysis, it was found that 14 pathways were associated with the 39 common targets, and the common targets were mainly involved in metabolic pathways (hsa01100). HIF-1 signaling pathway (hsa04066) and relaxin signaling pathway (hsa04926) (Fig. 8A). The 14 pathways were classified and summarized, and it was found that these KEGG pathways were mainly divided into 4 categories. These included Metabolism, Environmental Information Processing, Organismal Systems, and Human Diseases (Fig. 8B, C). In addition, the hub gene and its related-KEGG pathway were shown by a Sankey bubble map (Fig. 8D).
Fig. 7.

GO analysis of the target of PVL for NSCLC treatment. BP (A), CC (B) and MF (C) bubble maps of drug-disease common targets. The vertical and horizontal axes show the fold enrichment and genes respectively. The color and size of the bubbles represent P values and gene counts, respectively. D The top 10 BP (green), CC (yellow) and MF (blue) with largest gene counts
Fig. 8.

KEGG pathway enrichment analysis of the targets of PVL in NSCLC treatment. A Bubble map was used to show 14 KEGG pathways associated with PVL in NSCLC treatment. The vertical and horizontal axes show the item name and the enrichment fold of gene respectively. The color and size of the bubbles represent P values and gene counts, respectively. B Classification summary enrichment circle diagram of KEGG pathway. Yellow for metabolism, blue for environmental information processing, green for organismal systems and purple for human diseases. From outside to inside are: KEGG items (same color for the same classification), total number of genes in term, number of up-regulated genes in the item, number of down-regulated genes in the item, and number of enrichment factor (up-regulated genes + number of down-regulated genes). C Second-level classification of KEGG pathways. D Sankey bubble diagram of KEGG pathway. The Sankey diagram on the left side represents the genes contained in each pathway. The bubble diagram is on the right. Bubble size and color represent the number of genes and P value of the pathway, respectively
Construction of pathway-target network diagram
To further explore the key targets involved in the KEGG pathway, the KEGG pathway-target network diagram was constructed using Cytoscape 3.9.0 software. As shown (Fig. 9A), the network contained 81 nodes and 384 edges. Analysis with CytoNCA plug-in showed that targets such as AKT1, CAMK2B, NOS2, CYP1B1, ESR1, CDK6, MMP9, CA2, HSD17B2, AKR1C1 and HSD11B1 were significantly enriched in these 14 KEGG pathways (Fig. 9B, degree value ≥3). In addition, the targets in HIF-1 signaling pathway were colored using PathView. The targets of PVL in NSCLC treatment were stained with red (up-regulated in NSCLC) or green (down-regulated in NSCNC) (Fig. 9C).
Fig. 9.

Construction of “KEGG pathway-target” network. A The pathway-target network diagram was constructed using Cytoscape 3.9.0 software. V-shaped nodes represent pathways, and circular nodes represent targets. Both the size of the node and the depth of the color represent the size of the degree value. B Degree value statistics of the targets in the pathway-target network. C Distribution of the key targets in HIF-1 signaling pathway
Expression characteristics and clinical significance of core targets in NSCLC in TCGA dataset
To validate the expression characteristics of the core targets in NSCLC tissues, TCGA data were analyzed, with the data of GTEx database as the controls. It showed that, MMP9 expression and XDH expression were up-regulated in both LUAD and LUSC; and the expression levels of AKT1, ESR1, MAPT and CYP1B1 were not significantly changed (Fig. 10A–F). In order to study the correlation between core target expression and overall survival time in NSCLC patients, we divided lung cancer patients into high expression group and low expression group according to the expression levels of 6 core target genes, and analyzed them using the Kaplan Meier-Plotter database. The results showed that the expression levels of AKT1 and MMP9 had no significant relationship with the prognosis of lung cancer patients (Fig. 11A, B). Low expression levels of ESR1 and MAPT, and high expression levels of XDH and CYP1B1 were associated with worse prognosis of lung cancer patients (Fig. 11C–F).
Fig. 10.

The expression characteristics of core targets in TCGA database and GTEx database. A–F The expression levels of AKT1, MMP9, ESR1, XDH, MAPT, CYP1B1 in lung adenocarcinoma (LUAD) and lung squamous cell carcinoma (LUSC), with the data in GTEx database as the control. * P < 0.001
Fig. 11.

Correlation between core targets and prognosis of NSCLC patients. Relationship between the expression level of AKT1 (A), MMP9 (B), ESR1 (C), XDH (D), MAPT (E) and CYP1B1 (F) and overall survival time of the patients with NSCLC. Black represents low expression and red represents high expression
Correlation analysis between the core targets and immune cell infiltration in NSCLC
In order to explore the relationship between the core target expression and immune cell infiltration in NSCLC tissues, TIMER2.0 was used for analysis. The results showed that the expression level of AKT1 in NSCLC was negatively correlated with the levels of CD8+ T Cell, but positively correlated with the levels of CD4+ T Cell, Neutrophil and Dendritic Cell (Fig. 12A). The expression level of MMP9 was negatively correlated with the tumor purity, but positively correlated with the infiltration level of B Cell, CD4+ T Cell, Macrophage, Neutrophil and Dendritic Cell (Fig. 12B). The expression levels of ESR1 and CYP1B1 were negatively correlated with the tumor purity, but positively correlated with the levels of B Cell, CD8+ T Cell, CD4+ T Cell, Macrophage, Neutrophil and Dendritic Cell (Fig. 12C, D). The expression level of XDH was negatively correlated with the tumor purity, but positively correlated with the level of CD4+ T Cell, Macrophage, Neutrophil and Dendritic Cell (Fig. 12E). The expression level of MAPT was positively correlated with that of B Cell, CD4+ T Cell, Macrophage and Dendritic Cell (Fig. 12F).
Fig. 12.

Relationship between core targets and immune cell infiltration in NSCLC tissues. The correlation between the expression levels of AKT1 (A), MMP9 (B), ESR1 (C), XDH (D), MAPT (E) and CYP1B1 (F) and tumor purity, and the infiltration levels of different immune cells (B Cell, CD8+ T Cell, CD4+ T Cell, Macrophage, Neutrophil and Dendritic Cell) in NSCLC tissues
Results of molecular docking
To validate the findings in network pharmacology, molecular docking technique was applied to evaluate the binding affinity between the key components of PVL and the core targets (Table 4). Previous studies have shown that binding affinity less than −4.25 kcal/mol indicates that two molecules have standard binding ability, and less than −5.0 kcal/mol indicates good binding, and less than −7.0 kcal/mol indicates strong binding activity [25]. As shown (Fig. 13), morin, luteolin, delphinidin, kaempferol, quercetin and AKT1 (PDB ID: 3O96), MMP9 (PDB ID: 1L6J), ESR1 (PDB ID: 6PSJ), XDH (PDB ID: 3AX7) and CYP1B1 (PDB ID: 3PM0) had good binding affinity (less than −7.0 kcal/mol). Therefore, in the follow-up experiments, we focused on the mechanism of action of core targets such as AKT1, MMP9, ESR1, XDH and CYP1B1. PyMOL software was used to visualize 3D images of the optimal docking of receptors and ligands (Fig. 14).
Table 4.
Docking center and binding pocket of compounds and targets
| Targets (PDB ID) | Compounds | Docking center (x, y, z) | Docking pocket (x, y, z) |
|---|---|---|---|
| AKT1 (3O96) | Morin, Luteolin, Delphinidin, Kaempferol and Quercetin | x = 6.782, y = −11.138, z = 20.57 | x = 54.25, y = 62.0, z = 63.55 |
| MMP9 (1L6J) | Morin, Luteolin, Delphinidin, Kaempferol and Quercetin | x = 38.538, y = 35.802, z = 34.594 | x = 49.6166666667, y = 78.8777777778, z = 67.4277777778 |
| ESR1 (6PSJ) | Morin, Luteolin, Delphinidin, Kaempferol and Quercetin | x = 5.414, y = −19.865, z = 19.855 | x = 52.4444444444, y = 49.1666666667, z = 54.0833333333 |
| XDH (3AX7) | Morin, Luteolin, Delphinidin, Kaempferol and Quercetin | x = 14.333, y = −0.128, z = 26.623 | x = 104.0, y = 88.0, z = 82.0 |
| MAPT (5MP5) | Morin, Luteolin, Delphinidin, Kaempferol and Quercetin | x = 10.834, y = −23.535, z = −40.736 | x = 15.0, y = 15.0, z = 15.0 |
| CYP1B1 (3PM0) | Morin, Luteolin, Delphinidin, Kaempferol and Quercetin | x = −18.657, y = 17.823, z = −11.837 | x = 69.25, y = 52.3222222222, z = 69.25 |
Fig. 13.
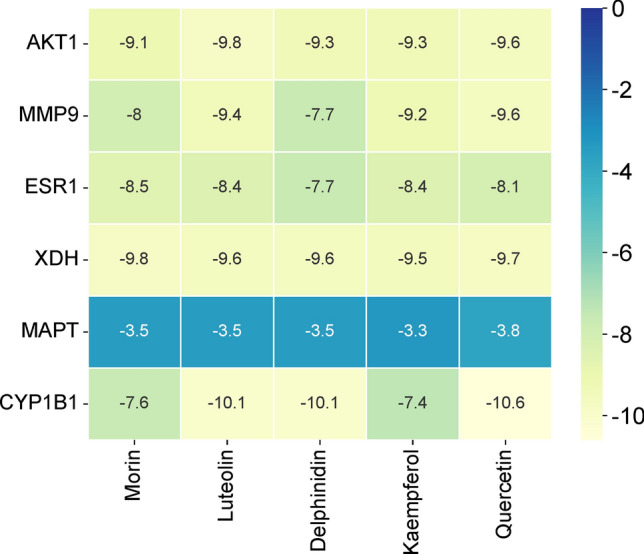
The binding ability between key components morin, luteolin, delphinidin, kaempferol, quercetin and core targets AKT1 (PDB ID: 3O96), MMP9 (PDB ID: 1L6J), ESR1 (PDB ID: 1L6J), XDH (PDB ID: 3AX7), MAPT (PDB ID: 6PSJ) and CYP1B1 (PDB ID: 3PM0)
Fig. 14.

3D molecular docking diagrams of key components and core targets. Blue represents key components, green represents amino acid residues around the binding bag, and dashed lines represent hydrogen bonds
Morin inhibits proliferation and induces apoptosis of NSCLC cells
In order to verify the potential function and mechanism of PVL in the treatment of NSCLC, we selected morin, with the highest degree value, for in vitro experiments. A549 and NCI-H1385 cells were treated with different concentrations morin for 24 h and cell viability was measured. The results showed that morin significantly inhibited A549 and NCI-H1385 cell viability in a dose-dependent manner (Fig. 15A). The previous studies usually used a rang of morin doses, from 0 to 100 μM, to investigate the tumor-suppressive properties of morin [26, 27]. So in the present work, a series of different doses of morin, 0, 3.5, 7.5, 15, 25, 50, 75, 100, 125, 150, 175, 200 μM, were used to treat A549, NCI-H1385 and BEAS-2B cells, to determine the IC50. The IC50 value of A549 cells treated with morin was 73.9 μM, and that of NCI-H1385 cells was 97.98 μM, much lower than that of BEAS-2B (192.1 μM) (Fig. 15B), suggesting NSCLC cells were more sensitive to morin treatment. To investigate the effect of morin on the apoptosis of NSCLC cells, firstly, we examined caspase-3 activity in A549 and NCI-H1385 cells treated with morin (50 μM or 100 μM). As shown (Fig. 15C), morin treatment significantly enhanced caspase-3 activity in A549 and NCI-H1385 cells. Additionally, flow cytometry analysis showed that the apoptosis levels of A549 and NCI-H1385 cells in morin treatment group were significantly higher than those in the control group (Fig. 15D). These results indicated that morin could inhibit the viability of NSCLC cells and induce apoptosis.
Fig. 15.

Morin inhibits the viability of NSCLC cells and promotes apoptosis. A,B After treating A549, NCI-H1385 and BEAS-2B cells for 24 h with different concentrations (0, 3.5, 7.5, 15, 25, 50, 75, 100, 125, 150, 175, 200) of morin, MTT assay was used to detect cell viability. C After treating A549 and NCI-H1385 cells with different concentrations of morin (50 and 100 μM) for 24 h, the caspase-3 activity was detected. D The apoptosis levels of A549 and NCI-H1385 cells treated with different concentrations (50 and 100 μM) of morin for 24 h were detected by flow cytometry. * P < 0.05, ** P < 0.01, *** P < 0.001
Morin can modulate the core targets and HIF-1 pathway
Based on GSE136043 dataset, the correlation coefficient network diagram of core targets in NSCLC was constructed. As shown (Fig. 16A), the expression of AKT1 in NSCLC was positively correlated with the expression of MMP9, XDH and CYP1B1, while negatively correlated with the expression of ESR1, and the expression of ESR1 was negatively correlated with the expression of MMP9 and CYP1B1, and the expression of MMP9 was positively correlated with that of CYP1B1. To further verify the results of network pharmacological analysis, we tested the effect of morin on the mRNA expression level of core targets by qRT-PCR. The results showed that morin significantly decreased the expression of AKT1, MMP9, XDH, and CYP1B1 mRNA in A549 and NCI-H1385 cells, and increased the expression of ESR1 mRNA (Fig. 16B). In addition, we also verified the regulatory effect of morin on HIF-1 signaling pathway. The results showed that morin inhibited HIF-1α mRNA expression in A549 and NCI-H1385 cells in a does-dependent manner (Fig. 16C). These results suggested that morin can inhibit the progression of NSCLC by acting on core targets such as AKT1, MMP9, XDH, CYP1B1 and ESR1 at both protein level and mRNA level, as well as HIF-1 signaling pathway.
Fig. 16.

Effects of morin on core target and HIF-1α expression. A Network diagram of correlation coefficients of core target expression in NSCLC tissue. The larger the correlation coefficient, the thicker the line. Blue indicates a negative correlation and red indicates a positive correlation. B,C The mRNA expression levels of AKT1, MMP9, XDH, CYP1B1, ESR1 and HIF-1α in A549 and NCI-H1385 cells treated with morin at different concentrations (50 and 100 μM) for 24 h were detected by qRT-PCR. ** P < 0.01, *** P < 0.001
Discussion
As a kind of complementary and alternative medicine, traditional Chinese medicine (TCM) has been widely used in clinical practice in China for more than 2000 years [28, 29]. In recent years, TCM preparations have been considered as important options for cancer treatment [6, 30, 31]. Active ingredients of PVL have significant anti-tumor activity in cancers such as gastric cancer, breast cancer, thyroid cancer and lung cancer [10–14]. However, its potential mechanism of action in NSCLC has not been fully elucidated. In the present work, the main bioactive components of PVL were summarized, and the crucial components and molecular targets of PVL in NSCLC treatment were identified, and the tumor-suppressive properties of morin, a crucial component in PVL were preliminarily investigated.
In this work, firstly, an open access GEO dataset was analyzed to identify DEGs between human NSCLC tissues and non-cancerous lung tissues. Here, we identified a total of 3264 DEGs, of which 1709 genes were up-regulated and 1555 genes were down-regulated, suggesting that the progression of NSCLC was regulated by a complex gene network. Next, based on network pharmacological analysis, it was found that PVL contained 11 active ingredients, corresponding to 180 targets, and finally 39 drug-disease common targets were obtained. Subsequently, five key components of PVL against NSCLC were obtained, which were morin, luteolin, delphinidin, kaempferol and quercetin. Morin has been reported to inhibit the viability, growth and migration of lung cancer cells by inhibiting the miR-135b/CCNG2 axis [32]. Luteolin, a flavonoid with tumor-suppressive properties, inhibits the proliferation of KRAS mutant lung cancer and down-regulates IFN-γ-induced PD-L1 expression [33]. Delphinidin is a kind of antioxidant, found in many fruits (pomegranates, berries, and black grapes) and vegetables (eggplant, tomatoes, carrots, and red onions) [34]. Delphinidin can inhibit proliferation and induce apoptosis of NSCLC cells, and also enhance the radiosensitivity of NSCLC cells [34, 35]. Kaempferol is a flavonoid that exists in a variety of vegetables and fruits and has a promising anti-tumor effects [36–38]. Quercetin, a bioflavonoid widely distributed in plants, has shown significant anti-tumor activity by regulating multiple targets, inducing cell apoptosis, inhibiting cell proliferation and tumor metastasis [39]. Previous studies have shown that quercetin can inhibit the growth of NSCLC cells carrying EGFR-C797S mutation [40]. In summary, it is supposed that PVL may play a key role in NSCLC treatment via the above components.
PPI network showed that PVL could inhibit NSCLC through a complex molecular network. Some DEGs with high topological parameters have been defined as hub genes, including AKT1, MMP9, ESR1, XDH, MAPT and CYP1B1. Abnormal activation of AKT pathway is a common event in NSCLC progression [41]. AKT1 polymorphism is also associated with poor prognosis in patients with early NSCLC [42]. MMP9, a member of the matrix metalloproteinase family, regulates the aggressiveness of cancer cells, and is highly expressed in NSCLC tissues and associated with poor prognosis in patients [43]. ESR1 has a low expression in NSCLC tissues, and its high expression is associated with a longer overall survival of NSCLC patients [44]. It has been reported that XDH gene is highly expressed in lung adenocarcinoma, and is associated with low survival [45]. MAPT is a microtubule-associated protein that promotes the assembly of tubulin into microtubules to stabilize the microtubule structure, and has been shown to be up-regulated in paclitaxel-resistant NSCLC cells [46, 47]. CYP1B1 is encoded by CYP1B1 gene and plays a key role in tumorigenesis [48]. The CYP1B1 G119T mutant genotype is associated with a higher risk of tumor recurrence and death after surgical resection of NSCLC [49]. In this study, it was found that AKT1, MMP9, XDH, MAPT and CYP1B1 were highly expressed in NSCLC tissues, while ESR1 was lowly expressed in NSCLC tissues. We supposed that PVL may mediate NSCLC progression by acting on these six core targets.
In order to better elucidate the molecular mechanism of PVL against NSCLC, we performed enrichment analysis of the 39 common targets. The results imply that PVL acts on NSCLC progression via multiple biological processes and pathways. Among the enriched pathways, HIF-1 signaling pathway has been reported to be involved in the pathogenesis of NSCLC [50]. HIF-1 is composed of α and β subunits, and HIF-1α is the functional part, and this pathway is considered to be crucial in cancer progression [51]. Previous studies have shown that HIF-1α inhibits ferroptosis by activating the Hippo signaling pathway, thus promoting the malignant progression of NSCLC [52]. We further verified the mechanism of action of PVL in NSCLC treatment through bioinformatics analysis, molecular docking and in vitro experiments. Through bioinformatics analysis, it was found that low expression levels of ESR1 and high expression levels of XDH and CYP1B1 were associated with shorter overall survival of lung cancer patients. It was also revealed that the expression levels of AKT1, MMP9, ESR1, XDH, MAPT and CYP1B1 were correlated with the dysregulation of infiltration of various immune cells in NSCLC. Interestingly, through molecular docking, it was found that the key components of PVL have strong binding ability with the core targets AKT1, MMP9, ESR1, XDH and CYP1B1. However, the ability to combine with MAPT is weak. This suggests that bioactive ingredients of PVL may regulate NSCLC by acting on core targets such as AKT1, MMP9, ESR1, XDH, and CYP1B1. In addition, morin, a key PVL component, was found to inhibit NSCLC cell viability, enhance caspase-3 activity, and induce cell apoptosis in vitro. Morin can also inhibit the mRNA expression levels of AKT1, MMP9, XDH, CYP1B1 and HIF-1α mRNA in NSCLC cells, and increase the expression of ESR1 mRNA. These results suggest that morin may play a role in NSCLC treatment by targeting AKT1, MMP9, XDH, CYP1B1, ESR1, and HIF-1 signaling.
However, some shortcomings exit in the present work. Firstly, the therapeutic effect of the drug (PVL extract, morin, etc.) needs to be verified in vivo. Secondly, network pharmacology is an approach based on databases, so some potential components of the drug may be missed. Thirdly, the RNA-sequencing data from multiple cohorts may help comprehensively screen the targets of PVL in the following work. In addition, although morin is a key component of PVL, it still does not fully represent the bioactivity of PVL. Therefore, the detailed mechanisms of action of other active ingredients still need to be explored in the future. Last but not least, the safety and efficacy of PVL and morin in NSCLC treatment, should be validated in clinical trials, before its application in clinical practice.
Conclusion
PVL inhibits the viability of NSCLC cell and promotes apoptosis, probably through a multi-component and multi-target manner, and it is deserved to be considered to treat the patients as a complementary and alternative medicine. In the following studies, animal models, pre-clinical models, combined with molecular biology experiments, are required to further validate the pharmacological effects of PVL and its bioactive components. Additionally, the efficiency and safety of PVL in treating NSCLC should be further verified based on clinical trials.
Acknowledgements
None.
Author contributions
Designed the study: DZ & YJ. Data collection and analysis: YD, YJ, JW and LW. Drafted the manuscript: YD. Reviewed the manuscript: DZ. All authors agree with the final version of the manuscript.
Funding
This work was supported by the author themselves.
Data availability
The labeled dataset used to support the findings of this study are available from the corresponding author upon request.
Declarations
Ethics approval and consent to participate
Not applicable.
Competing interests
The authors declare no competing interests.
Footnotes
Publisher's Note
Springer Nature remains neutral with regard to jurisdictional claims in published maps and institutional affiliations.
Yanggang Dan and Yangli Jin have contributed equally to this work.
References
- 1.Sung H, Ferlay J, Siegel RL, Laversanne M, Soerjomataram I, Jemal A, Bray F. Global cancer statistics 2020: GLOBOCAN estimates of incidence and mortality worldwide for 36 cancers in 185 countries. CA Cancer J Clin. 2021;71(3):209–49. [DOI] [PubMed] [Google Scholar]
- 2.Duma N, Santana-Davila R, Molina JR. Non-small cell lung cancer: epidemiology, screening, diagnosis, and treatment. Mayo Clin Proc. 2019;94(8):1623–40. [DOI] [PubMed] [Google Scholar]
- 3.Schneider BJ, Ismaila N, Aerts J, Chiles C, Daly ME, Detterbeck FC, Hearn JWD, Katz SI, Leighl NB, Levy B, Meyers B, Murgu S, Nekhlyudov L, Santos ES, Singh N, Tashbar J, Yankelevitz D, Altorki N. Lung cancer surveillance after definitive curative-intent therapy: ASCO guideline. J Clin Oncol. 2020;38(7):753–66. [DOI] [PubMed] [Google Scholar]
- 4.Yuan M, Huang LL, Chen JH, Wu J, Xu Q. The emerging treatment landscape of targeted therapy in non-small-cell lung cancer. Signal Transduct Target Ther. 2019;4:61. [DOI] [PMC free article] [PubMed] [Google Scholar]
- 5.Zheng Y, Guo Z, Li Y. Long non-coding RNA prostate cancer-associated transcript 6 inhibited gefitinib sensitivity of non-small cell lung cancer by serving as a competing endogenous RNA of miR-326 to up-regulate interferon-alpha receptor 2. Bioengineered. 2022;13(2):3785–96. [DOI] [PMC free article] [PubMed] [Google Scholar]
- 6.Geng X, Chi W, Lin X, Niu Z, Jiang Q, Sui Y, Jiang J. Determining the mechanism of action of the Qishan formula against lung adenocarcinoma by integration of network pharmacology, molecular docking, and proteomics. Medicine. 2023;102(13): e33384. [DOI] [PMC free article] [PubMed] [Google Scholar]
- 7.Guo Q, Qu H, Zhang H, Zhong X. Prunella vulgaris L. attenuates experimental autoimmune thyroiditis by inhibiting HMGB1/TLR9 signaling. Drug Des Dev Ther. 2021;15:4559–74. [DOI] [PMC free article] [PubMed] [Google Scholar]
- 8.Zhang JH, Qiu JN, Wang L, Zhang S, Jiang YY. Research progress on chemical constituents and pharmacological effects of Prunella vulgaris. Chin Tradit Herb Drugs. 2018;49(14):3432–40. [Google Scholar]
- 9.Pan J, Wang H, Chen Y. Prunella vulgaris L.—a review of its ethnopharmacology, phytochemistry, quality control and pharmacological effects. Front Pharmacol. 2022;13: 903171. [DOI] [PMC free article] [PubMed] [Google Scholar]
- 10.Tan J, Qi H, Ni J. Extracts of endophytic fungus xkc-s03 from Prunella vulgaris L. spica inhibit gastric cancer in vitro and in vivo. Oncol Lett. 2015;9(2):945–9. [DOI] [PMC free article] [PubMed] [Google Scholar]
- 11.Luo H, Zhao L, Li Y, Xia B, Lin Y, Xie J, Wu P, Liao D, Zhang Z, Lin L. An in vivo and in vitro assessment of the anti-breast cancer activity of crude extract and fractions from Prunella vulgaris L. Heliyon. 2022;8(11): e11183. [DOI] [PMC free article] [PubMed] [Google Scholar]
- 12.Zheng XQ, Song LX, Han ZZ, Yang YB, Zhang Y, Gu LH, Yang L, Chou GX, Wang ZT. Pentacyclic triterpenoids from spikes of Prunella vulgaris L. with thyroid tumour cell cytostatic bioactivities. Nat Prod Res. 2023;37(9):1518–26. [DOI] [PubMed] [Google Scholar]
- 13.Feng L, Jia X, Zhu M, Chen Y, Shi F. Chemoprevention by Prunella vulgaris L. extract of non-small cell lung cancer via promoting apoptosis and regulating the cell cycle. Asian Pac J Cancer Prev. 2010;11(5):1355–8. [PubMed] [Google Scholar]
- 14.Zhu J, Zhang W, Zhang Y, Wang Y, Liu M, Liu Y. Effects of Spica prunellae on caspase-3-associated proliferation and apoptosis in human lung cancer cells in vitro. J Cancer Res Ther. 2018;14(4):760–3. [DOI] [PubMed] [Google Scholar]
- 15.Hopkins AL. Network pharmacology. Nat Biotechnol. 2007;25(10):1110–1. [DOI] [PubMed] [Google Scholar]
- 16.Zhang X, Shen T, Zhou X, Tang X, Gao R, Xu L, Wang L, Zhou Z, Lin J, Hu Y. Network pharmacology based virtual screening of active constituents of Prunella vulgaris L. and the molecular mechanism against breast cancer. Sci Rep. 2020;10(1):15730. [DOI] [PMC free article] [PubMed] [Google Scholar]
- 17.Chen PY, Han LT. Study on the molecular mechanism of anti-liver cancer effect of Evodiae fructus by network pharmacology and QSAR model. Front Chem. 2023;10:1060500. [DOI] [PMC free article] [PubMed] [Google Scholar]
- 18.Barrett T, Wilhite SE, Ledoux P, Evangelista C, Kim IF, Tomashevsky M, Marshall KA, Phillippy KH, Sherman PM, Holko M, Yefanov A, Lee H, Zhang N, Robertson CL, Serova N, Davis S, Soboleva A. NCBI GEO: archive for functional genomics data sets–update. Nucleic Acids Res. 2013;41(Database issue):D991–5. [DOI] [PMC free article] [PubMed] [Google Scholar]
- 19.Diboun I, Wernisch L, Orengo CA, Koltzenburg M. Microarray analysis after RNA amplification can detect pronounced differences in gene expression using limma. BMC Genomics. 2006;7:252. [DOI] [PMC free article] [PubMed] [Google Scholar]
- 20.Gao Y, Ji W, Lu M, Wang Z, Jia X, Wang D, Cao P, Hu C, Sun X, Wang Z. Systemic pharmacological verification of Guizhi Fuling decoction in treating endometriosis-associated pain. J Ethnopharmacol. 2022;297: 115540. [DOI] [PubMed] [Google Scholar]
- 21.Li T, Li W, Guo X, Tan T, Xiang C, Ouyang Z. Unraveling the potential mechanisms of the anti-osteoporotic effects of the Achyranthes bidentata-Dipsacus asper herb pair: a network pharmacology and experimental study. Front Pharmacol. 2023;14:1242194. [DOI] [PMC free article] [PubMed] [Google Scholar]
- 22.Qian Y, Yi F. Inulae Flos is a potential herbal medicine to treat glioma: a study based on gene expression profile analysis, network pharmacology and molecular docking. Diagnostics and Therapeutics. 2024;3(1):32–52. [Google Scholar]
- 23.Ru J, Li P, Wang J, Zhou W, Li B, Huang C, Li P, Guo Z, Tao W, Yang Y, Xu X, Li Y, Wang Y, Yang L. TCMSP: a database of systems pharmacology for drug discovery from herbal medicines. J Cheminform. 2014;6:13. [DOI] [PMC free article] [PubMed] [Google Scholar]
- 24.Li T, Fu J, Zeng Z, Cohen D, Li J, Chen Q, Li B, Liu XS. TIMER2.0 for analysis of tumor-infiltrating immune cells. Nucleic Acids Res. 2020;48(W1):W509–14. [DOI] [PMC free article] [PubMed] [Google Scholar]
- 25.Saikia S, Bordoloi M. Molecular docking: challenges, advances and its use in drug discovery perspective. Curr Drug Targets. 2019;20(5):501–21. [DOI] [PubMed] [Google Scholar]
- 26.Maharjan S, Lee MG, Kim SY, Lee KS, Nam KS. Morin sensitizes MDA-MB-231 triple-negative breast cancer cells to doxorubicin cytotoxicity by suppressing FOXM1 and attenuating EGFR/STAT3 signaling pathways. Pharmaceuticals. 2023;16(5):672. [DOI] [PMC free article] [PubMed] [Google Scholar]
- 27.Shin S, Ko J, Kim M, Song N, Park K. Morin induces melanogenesis via activation of MAPK signaling pathways in B16F10 mouse melanoma cells. Molecules. 2021;26(8):2150. [DOI] [PMC free article] [PubMed] [Google Scholar]
- 28.Zhuang Z, Lin T, Luo L, Zhou W, Wen J, Huang H, Liu Z, Lin L. Exploring the mechanism of aidi injection for lung cancer by network pharmacology approach and molecular docking validation. Biosci Rep. 2021;41(2):BSR20204062. [DOI] [PMC free article] [PubMed] [Google Scholar]
- 29.Ma C, Gu Y, Liu C, Tang X, Yu J, Li D, Liu J. Anti-cervical cancer effects of compound Yangshe granule through the PI3K/AKT pathway based on network pharmacology. J Ethnopharmacol. 2023;301: 115820. [DOI] [PubMed] [Google Scholar]
- 30.Le-Xin C, Ming-Jun L, Chun-Qi X, Jia-Xin Z, Jing-Ya Y, Li-Xin N, Mei-Qi W, En-Xin Z, Xiao-Jun Z. Yi Qi Chu Tan formula (YQCTF) inhibited the progress of lung cancer via regulating tumor-associated neutrophil: an integrated study of network pharmacology, proteomics and pharmacodynamics. J Ethnopharmacol. 2024;318(Pt B): 116943. [DOI] [PubMed] [Google Scholar]
- 31.Tu H, Li J, Xu W, Wang Z, Wang L. Target and mechanism of the Xihuang Pill based on network pharmacology for lung squamous cell carcinoma. Altern Ther Health Med. 2023;29(7):148–54. [PubMed] [Google Scholar]
- 32.Yao D, Cui H, Zhou S, Guo L. Morin inhibited lung cancer cells viability, growth, and migration by suppressing miR-135b and inducing its target CCNG2. Tumour Biol. 2017;39(10):1010428317712443. [DOI] [PubMed] [Google Scholar]
- 33.Jiang ZB, Wang WJ, Xu C, Xie YJ, Wang XR, Zhang YZ, Huang JM, Huang M, Xie C, Liu P, Fan XX, Ma YP, Yan PY, Liu L, Yao XJ, Wu QB, Lai-Han LE. Luteolin and its derivative apigenin suppress the inducible PD-L1 expression to improve anti-tumor immunity in KRAS-mutant lung cancer. Cancer Lett. 2021;515:36–48. [DOI] [PubMed] [Google Scholar]
- 34.Pal HC, Sharma S, Strickland LR, Agarwal J, Athar M, Elmets CA, Afaq F. Delphinidin reduces cell proliferation and induces apoptosis of non-small-cell lung cancer cells by targeting EGFR/VEGFR2 signaling pathways. PLoS ONE. 2013;8(10): e77270. [DOI] [PMC free article] [PubMed] [Google Scholar]
- 35.Kang SH, Bak DH, Chung BY, Bai HW, Kang BS. Delphinidin enhances radio-therapeutic effects via autophagy induction and JNK/MAPK pathway activation in non-small cell lung cancer. Korean J Physiol Pharmacol. 2020;24(5):413–22. [DOI] [PMC free article] [PubMed] [Google Scholar]
- 36.Zhang J, Liu X, Zhang G, Wu J, Liu Z, Liu C, Wang H, Miao S, Deng L, Cao K, Shang M, Zhu Q, Sun P. To explore the effect of kaempferol on non-small cell lung cancer based on network pharmacology and molecular docking. Front Pharmacol. 2023;14:1148171. [DOI] [PMC free article] [PubMed] [Google Scholar]
- 37.Fouzder C, Mukhuty A, Kundu R. Kaempferol inhibits Nrf2 signalling pathway via downregulation of Nrf2 mRNA and induces apoptosis in NSCLC cells. Arch Biochem Biophys. 2021;697: 108700. [DOI] [PubMed] [Google Scholar]
- 38.Kuo WT, Tsai YC, Wu HC, Ho YJ, Chen YS, Yao CH, Yao CH. Radiosensitization of non-small cell lung cancer by kaempferol. Oncol Rep. 2015;34(5):2351–6. [DOI] [PubMed] [Google Scholar]
- 39.Chai R, Xu C, Lu L, Liu X, Ma Z. Quercetin inhibits proliferation of and induces apoptosis in non-small-cell lung carcinoma via the lncRNA SNHG7/miR-34a-5p pathway. Immunopharmacol Immunotoxicol. 2021;43(6):693–703. [DOI] [PubMed] [Google Scholar]
- 40.Huang KY, Wang TH, Chen CC, Leu YL, Li HJ, Jhong CL, Chen CY. Growth suppression in lung cancer cells harboring EGFR-C797S mutation by quercetin. Biomolecules. 2021;11(9):1271. [DOI] [PMC free article] [PubMed] [Google Scholar]
- 41.Malanga D, De Marco C, Guerriero I, Colelli F, Rinaldo N, Scrima M, Mirante T, De Vitis C, Zoppoli P, Ceccarelli M, Riccardi M, Ravo M, Weisz A, Federico A, Franco R, Rocco G, Mancini R, Rizzuto A, Gulletta E, Ciliberto G, Viglietto G. The Akt1/IL-6/STAT3 pathway regulates growth of lung tumor initiating cells. Oncotarget. 2015;6(40):42667–86. [DOI] [PMC free article] [PubMed] [Google Scholar]
- 42.Kim MJ, Kang HG, Lee SY, Jeon HS, Lee WK, Park JY, Lee EB, Lee JH, Cha SI, Kim DS, Kim CH, Kam S, Jung TH, Park JY. AKT1 polymorphisms and survival of early stage non-small cell lung cancer. J Surg Oncol. 2012;105(2):167–74. [DOI] [PubMed] [Google Scholar]
- 43.Liu J, Ping W, Zu Y, Sun W. Correlations of lysyl oxidase with MMP2/MMP9 expression and its prognostic value in non-small cell lung cancer. Int J Clin Exp Pathol. 2014;7(9):6040–7. [PMC free article] [PubMed] [Google Scholar]
- 44.Aresti U, Carrera S, Iruarrizaga E, Fuente N, Marrodan I, de Lobera AR, Muñoz A, Buque A, Condori E, Ugalde I, Calvo B, Vivanco GL. Estrogen receptor 1 gene expression and its combination with estrogen receptor 2 or aromatase expression predicts survival in non-small cell lung cancer. PLoS ONE. 2014;9(10): e109659. [DOI] [PMC free article] [PubMed] [Google Scholar]
- 45.Tavassoly I, Hu Y, Zhao S, Mariottini C, Boran A, Chen Y, Li L, Tolentino RE, Jayaraman G, Goldfarb J, Gallo J, Iyengar R. Genomic signatures defining responsiveness to allopurinol and combination therapy for lung cancer identified by systems therapeutics analyses. Mol Oncol. 2019;13(8):1725–43. [DOI] [PMC free article] [PubMed] [Google Scholar]
- 46.Kar S, Fan J, Smith MJ, Goedert M, Amos LA. Repeat motifs of tau bind to the insides of microtubules in the absence of taxol. EMBO J. 2003;22(1):70–7. [DOI] [PMC free article] [PubMed] [Google Scholar]
- 47.Cai Y, Jia R, Xiong H, Ren Q, Zuo W, Lin T, Lin R, Lei Y, Wang P, Dong H, Zhao H, Zhu L, Fu Y, Zeng Z, Zhang W, Wang S. Integrative gene expression profiling reveals that dysregulated triple microRNAs confer paclitaxel resistance in non-small cell lung cancer via co-targeting MAPT. Cancer Manag Res. 2019;11:7391–404. [DOI] [PMC free article] [PubMed] [Google Scholar]
- 48.Mao M, Wu Z, Chen J. MicroRNA-187-5p suppresses cancer cell progression in non-small cell lung cancer (NSCLC) through down-regulation of CYP1B1. Biochem Biophys Res Commun. 2016;478(2):649–55. [DOI] [PubMed] [Google Scholar]
- 49.Li F, Zhang S, Zhang Q, Li J, Zhao S, Gu C. CYP1B1 G199T polymorphism affects prognosis of NSCLC patients with the potential to be an indicator and target for precise drug intervention. Biomed Res Int. 2017;2017:1529564. [DOI] [PMC free article] [PubMed] [Google Scholar]
- 50.Liu J, Huang X, Liu D, Ji K, Tao C, Zhang R, Chen J. Demethyleneberberine induces cell cycle arrest and cellular senescence of NSCLC cells via c-Myc/HIF-1α pathway. Phytomedicine. 2021;91: 153678. [DOI] [PubMed] [Google Scholar]
- 51.Jin Q, Zhou J, Xu X, Huang F, Xu W. Hypoxia-inducible factor-1 signaling pathway influences the sensitivity of HCC827 cells to gefitinib. Oncol Lett. 2019;17(4):4034–43. [DOI] [PMC free article] [PubMed] [Google Scholar]
- 52.Zheng S, Mo J, Zhang J, Chen Y. HIF-1α inhibits ferroptosis and promotes malignant progression in non-small cell lung cancer by activating the Hippo-YAP signalling pathway. Oncol Lett. 2023;25(3):90. [DOI] [PMC free article] [PubMed] [Google Scholar]
Associated Data
This section collects any data citations, data availability statements, or supplementary materials included in this article.
Data Availability Statement
The labeled dataset used to support the findings of this study are available from the corresponding author upon request.