

Abstract
We propose a state-of-the-art deep learning approach for accurate electrocardiogram (ECG) signal analysis, addressing both waveform delineation and beat type classification tasks. For beat type classification, we integrated two novel schemes into the deep learning model, significantly enhancing its performance. The first scheme is an adaptive beat segmentation method that determines the optimal duration for each heartbeat based on RR-intervals, mitigating segmenting errors from conventional fixed-period segmentation. The second scheme incorporates relative heart rate information of the target beat compared to neighboring beats, improving the model’s ability to accurately detect premature atrial contractions (PACs) that are easily confused with normal beats due to similar morphology. Extensive evaluations on the PhysioNet QT Database, MIT-BIH Arrhythmia Database, and real-world wearable device data demonstrated the proposed approach’s superior capabilities over existing methods in both tasks. The proposed approach achieved sensitivities of 99.81% for normal beats, 99.08% for premature ventricular contractions, and 97.83% for PACs in beat type classification. For waveform delineation, we achieved F1-scores of 0.9842 for non-waveform, 0.9798 for P-waves, 0.9749 for QRS complexes, and 0.9848 for T-waves. It significantly outperforms existing methods in PAC detection while maintaining high performance across both tasks. The integration of aforementioned two schemes into the deep learning model improved the accuracy of normal sinus rhythms and arrhythmia detection.
Keywords: Arrhythmia detection, Cardiac signal processing, Machine learning in cardiology, RR-interval analysis, Temporal feature extraction
1. Introduction
Electrocardiogram (ECG) signal analysis is a crucial diagnostic tool for assessing cardiac health and detecting arrhythmias [1]. Accurate delineation of ECG waveform components and robust classification of beat types are vital for timely diagnosis and treatment [2]. However, traditional methods for waveform delineation and beat classification often struggle with noise, morphological variations, and subtle arrhythmia patterns, limiting their clinical utility [3]. In recent years, deep learning techniques have emerged as powerful alternatives, exhibiting remarkable performance in discerning complex patterns from data [4]. Convolutional neural networks (CNNs) and recurrent neural networks (RNNs) have demonstrated promising results in ECG analysis tasks [5,6]. However, existing approaches still face challenges in handling ambiguous signals, adapting to diverse patient populations, and ensuring adoption to real-world scenarios [7]. We propose a novel deep learning framework that integrates two innovative schemes to enhance the accuracy of ECG waveform delineation and beat type classification, with a particular emphasis on improving the detection of premature atrial contractions (PACs). The first scheme introduces an adaptive beat segmentation method that dynamically extracts the optimal duration for each heartbeat based on RR-interval lengths, mitigating segmenting error via fixed-period segmentation approaches. The second scheme incorporates relative heart rate information of the beat of interest with neighboring beats, enabling the approach to more effectively distinguish subtle premature atrial contraction (PAC) patterns from normal beats. Through extensive evaluations on the PhysioNet QT Database, MIT-BIH Arrhythmia Database, and real-world wearable device data, we show the superior performance of the proposed approach, achieving state-of-the-art results in PAC detection while maintaining high accuracy across all beat types. The proposed techniques hold significant potential for reliable automated ECG monitoring in clinical practice, contributing to timely diagnosis for cardiac arrhythmias.
2. Related work
ECG signal analysis, regarding waveform delineation and beat type classification, has been an active area of research, exploring both traditional signal processing techniques and modern machine learning-based approaches.
Traditional methods for ECG waveform delineation have often relied on derivative-based algorithms, wavelet transforms, and filter banks [8,9]. However, these techniques are prone to noise and variations in ECG morphologies, which can limit their robustness.
In recent years, machine learning methodologies have emerged as potent alternatives due to their ability to discern intricate patterns directly from data. CNNs have become popular for ECG waveform delineation tasks. A CNN-based method was proposed for simultaneous delineation and classification of ECG waveforms [10]. Dense convolutional neural network models developed for ECG waveform delineation have also been introduced, demonstrating superior performance across multiple ECG databases, including MIT-BIH Arrhythmia [11,12].
For ECG beat type classification, various machine learning algorithms have been proposed. Early techniques such as support vector machines (SVMs) and random forests were commonly employed [13, 14]. With the rise of deep learning, neural network-based approaches have gained prominence. A 34-layer convolutional neural network was utilized to classify 14 different arrhythmia types [15], while a deep neural network architecture incorporating temporal convolutional layers and recurrent layers achieved state-of-the-art performance on the PhysioNet/CinC Challenge datasets [5]. Additionally, a deep convolutional neural network model with a batch-weighted loss function was proposed to enhance the accuracy and efficiency of heartbeat classification, effectively addressing class imbalance in heartbeat datasets [16]. Another approach introduced deep coded features and long short-term memory (LSTM) networks for arrhythmia classification, offering improved accuracy in detecting heart rhythm abnormalities [17].
Despite promising results, challenges remain. These include the management of noisy ECG signals, adaptation to diverse patient populations, and assurance of robustness in real-world clinical scenarios. The opacity of deep learning models’ decision-making process also limits their adoption in critical medical applications.
Machine learning techniques, especially deep learning models, have significantly advanced ECG signal analysis. These models outperform conventional approaches in deciphering complex patterns. However, ongoing research aims to improve their accuracy, robustness, and interpretability for effective integration into clinical practice. Table 1 summarizes the detailed information of related works, including recent studies [18–24], providing a comprehensive overview of the field’s current state.
Table 1.
Summary of the related work in the “Related Work” section, where mitdb, Sen.,F1, Acc., N, VE, and SVE, denote MIT-BIH Arrhythmia Database, sensitivity, F1-score, accuracy, normal, ventricular ectopic, and supraventricular ectopic, respectively.
| Related Work | Dataset | Approach | Result |
|---|---|---|---|
| Ref. [8] | CSE, QTDB | Quadratic spline wavelet transform | Close to cardiologists |
| Ref. [9] | mitdb | Adaptive thresholding | Sen. (QRS) 99.69% |
| Ref. [10] | mitdb, PhysioNet/CinC | CNN-RNN | Overall F1 0.82 |
| Ref. [18] | mitdb, QTDB | SegNet, encoder–decoder model | F1 99.12, 99.97, 99.56% for P, QRS, T-waves |
| Ref. [19] | mitdb, PhysioNet/CinC | CNN+transformer | Overall F1 99.18, 99.97, 99.63% for P, QRS, T waves |
| Ref. [11] | QT, mitdb | 34-layer dense CNN | F1 99.96, 99.97, 99.95% for P, QRS, T waves |
| Ref. [13] | mitdb | SVM | Overall Acc. 85.90% for N,VE, SVE beats |
| Ref. [14] | mitdb | random forests | Overall Acc. |
| Ref. [15] | 29,163 patients | 34 layer CNN | F1 0.837 for 12 rhythms |
| Ref. [5] | 53,549 patients | 33 layer CNN | F1 0.837 for 12 rhythms |
| Ref. [16] | mitdb | CNN with weighted loss | Overall Acc. 99.31% for 5 heartbeats |
| Ref. [17] | mitdb | autoencoders with LSTM | Overall Acc. 99.25% for 17 arrhythmias |
| Ref. [20] | mitdb | attention-based RNN+CNN | Acc. 98.46% for heartbeats |
| Ref. [21] | mitdb | unsupervised deep learning | Acc. 98.46% for heartbeats |
| Ref. [22] | mitdb, CPSC2018 dataset | autoencoder+CNN | Acc. 99.85% for heartbeats |
| Ref. [23] | mitdb, PTB database | ML with sample generation, augmented attention | Acc. 99.80% |
| Ref. [24] | mitdb, CPSC2018 dataset | Transformer | Acc. 99.76% for arrhythmia classes |
Contribution
Existing studies have made significant progress in ECG analysis, but they face challenges in P-wave delineation and accurate PAC detection. These methods often fail to fully leverage the temporal context of ECG signals for PAC detection. The proposed deep learning model significantly improves P-wave detection performance. Additionally, we introduced two novel schemes: adaptive beat segmentation and relative heart rate information incorporation. These enhancements, when integrated into the deep learning model, substantially improved PAC beat detection performance. The resulting architecture achieves more accurate classification of both normal and abnormal beats, with especially notable improvement in PAC detection. This approach effectively addresses the shortcomings of previous methods in ECG analysis.
Specifically, we propose a novel deep learning-based approach that achieves state-of-the-art performance in both ECG waveform delineation and beat type classification tasks. The method integrates two novel schemes with the proposed deep learning model, leading to significantly improved detection performance of PACs compared to existing methods.
The proposed approach employs an adaptive beat segmentation scheme that dynamically extracts the optimal duration of the beat of interest based on the length of consecutive RR-intervals. Unlike conventional fixed-period segmentation methods, the adaptive approach mitigates potential issues arising from overly broad or narrow beat intervals, which can adversely affect beat morphology learning. By adjusting the segmentation according to RR-interval variations, the method ensures more precise delineation and enhanced accuracy in learning beat morphology, contributing to robust performance in beat detection across diverse datasets.
We incorporate relative heart rate information of the beat with respect to adjacent beats, significantly enhancing the approach’s capability in detecting PACs. This integration of morphological and temporal information enables accurate identification of subtle PACs, a crucial abnormality in ECG signals that can be a false positive of a normal beat easily in terms of morphology.
Comprehensive evaluation on the well-established QTDB and MIT-BIH arrhythmia datasets, as well as real-world wearable device data, demonstrates the outstanding performance of the proposed approach. The model achieved impressive overall accuracy and F1-scores in waveform delineation, exhibiting high sensitivity and precision across various waveform classes, including P-wave, QRS complex, T-wave, and non-waveform segments.
Furthermore, the approach outperformed existing methods in ECG beat type classification, achieving the highest sensitivity, precision, and F1-scores for normal, premature ventricular contraction, and premature atrial contraction classes. The remarkable outcomes, particularly in detecting PACs and premature ventricular contractions (PVCs), highlight the reliability and potential of the approach for real-world deployment in clinical settings and cardiac monitoring applications.
3. Materials and method
3.1. Materials
We utilize the PhysioNet QT Database (QTDB) [1,25] and the MIT-BIH Arrhythmia Database for waveform delineation and beat classification, respectively, both of which are accessible from [26]. Additionally, we included an independent testing set comprising ECG recordings collected from participants in the intervention group of Phase I of the PulseWatch clinical trial (NCT03761394) [27]. In this trial, participants aged 50 or older with a history of ischemic stroke or transient ischemic attack wore an FDA-cleared, two-lead rhythm patch device (Cardea SOLO, Cardiac Insight Inc., Bellevue, WA, USA) for ECG data collection. The inclusion of this independent testing set allowed us to validate the proposed model’s performance on ECG data obtained from wearable devices, focusing on the detection of P, QRS, T, and non-waveform (N/W) regions.
The QTDB encompasses approximately 15 min of ECG data sampled at a frequency of 250 Hz, originating from a cohort of 105 individuals. Each recording comprises a two-channel signal acquired by positioning electrodes strategically on the patient’s chest. The database incorporates signal region annotations generated through an automated expert system described in [28]. The primary objective of this study is to leverage a deep learning framework to assign a precise label to each sample within the ECG signals, delineating its specific region within the cardiac cycle. The automated expert system independently labeled each channel of the 105 two-channel ECG signals, with each channel treated as a separate entity, resulting in a total of 210 ECG signals.
The MIT-BIH Arrhythmia database comprises over 4000 long-term Holter recordings obtained by the Beth Israel Hospital Arrhythmia Laboratory between 1975 and 1979, with approximately 60 % from inpatients. The database includes 23 randomly selected records (numbered 100 to 124) and 25 selected to feature rare but clinically important phenomena (numbered 200 to 234) which can be obtained from [26]. Each record spans slightly over 30 min. The first group represents a range of waveforms and artifacts typical in clinical settings, while the second group includes complex arrhythmias and conduction abnormalities. Subjects were 25 men aged 32 to 89 years and 22 women aged 23 to 89 years, with two records from the same male subject. Two cardiologists independently reviewed the recordings, adding, deleting, or modifying beat labels, along with rhythm and signal quality labels. Discrepancies were resolved by consensus, and corrections were made and analyzed for consistency. Over time, adjustments were made to improve the accuracy of beat labels, ensuring the database’s reliability for research.
Table 2 presents the data distribution for both the waveform delineation and beat type classification tasks. For waveform delineation using the QTDB dataset, we classify samples into four categories: N/W, P-wave (P), QRS complex (QRS), and T-wave (T). The beat type classification task using the MIT-BIH arrhythmia database (mitdb) categorizes beats into normal (N), premature ventricular contraction (V), and premature atrial contraction (A). In both tasks, we observe apparent class imbalance. For waveform delineation, N/W samples dominate, comprising over 50% of both training and testing data, while P-waves are the least represented at around 10%. The beat type classification task shows even more pronounced imbalance, with normal beats constituting over 90% of the data, and premature atrial contractions (A) being particularly underrepresented at less than 2% in both sets. Despite slight variations, the class distributions in the training and testing sets are relatively consistent for both tasks, ensuring that the model’s performance evaluation reflects its ability to handle real-world data distributions. We discuss handling class imbalance in more details shortly in Section 3.4.
Table 2.
Distribution of training and testing data for ECG waveform delineation and beat type classification tasks.
| Class | Waveform delineation (sample) - QTDB | Beat type classification (sample∥beat) - mitdb | |||||
|---|---|---|---|---|---|---|---|
| N/W | P | QRS | T | N | V | A | |
| Training data | 16,907,512 (51.71%) | 3,258,672 (9.97%) | 4,566,668 (13.97%) | 7,962,139 (24.35%) | 5,394,016∥24,126 (91.81%) | 410,355∥1,726 (6.57%) | 67,853∥425 (1.62%) |
| Testing data | 6,968,915 (49.65%) | 1,471,347 10.48%) | 1,971,879 (14.05%) | 3,622,859 25.81%) | 948,117∥4,252 (95.44%) | 23,679∥109 (2.45%) | 7,518∥94 (2.11%) |
3.2. Method
We propose a deep learning architecture for sequence-to-sequence classification tasks, maintaining consistency across both waveform delineation and beat classification while introducing additional schemes specifically aimed at enhancing beat classification accuracy. The foundational elements of the model primarily consist of 1-D convolutional layers integrated with bidirectional long short-term memory (BiLSTM) layers.
The 1-D convolutional layer is a fundamental component of CNNs, meticulously designed for processing one-dimensional input data, notably relevant to ECG-signal analysis. This layer operates by applying convolution operations to the input sequence, leveraging a set of adaptable filters. These filters traverse the input, capturing localized patterns and generating feature maps. Crucially, parameter sharing reduces redundancy by utilizing the same set of filter weights across the input, facilitating the acquisition of spatial hierarchies of features. Feature extraction is accomplished through convolutions, with filters discerning various features such as peaks, patterns, or motifs. Optionally, pooling operations like max pooling or average pooling can downsample feature maps, preserving essential information while reducing dimensionality. Introducing non-linearity via activation functions like ReLU empowers the network to discern intricate patterns and representations. Additionally, parameters like padding and stride offer control over output feature map size and spatial resolution. In summary, the 1-D convolutional layer serves as a pivotal tool for capturing hierarchical representations in sequential data, facilitating feature extraction and robust learning across applications including time series forecasting, speech recognition, and ECG-signal processing.
In contrast, while 1-D convolutional layers typically necessitate fixed-length input due to their fixed filter sizes and stride lengths, BiLSTM inherently accommodates variable-length input sequences without requiring padding or truncation. BiLSTM’s memory cells possess the crucial ability to retain information across multiple time steps, enabling effective handling of sequences with long-term dependencies—a critical capability for tasks like natural language processing, speech recognition, and time series prediction. Although BiLSTM typically entails more parameters compared to 1-D convolutional layers, this increased parameterization enables the capture of complex patterns and relationships within the data. However, it also escalates computational demands and the risk of overfitting, particularly in scenarios with limited training data. While training and inference with BiLSTM layers can be computationally intensive, especially for large-scale datasets and deep networks, 1-D convolutional layers offer greater computational efficiency due to their simpler operations. Thus, leveraging the complementary strengths of these two sequential layers is pivotal for achieving optimal performance in the study.
3.3. Evaluation metrics
We used the following metrics to evaluate the model:
Sensitivity = TP / (TP + FN);
Precision = TP / (TP + FP);
F1-score = 2 × (Precision × Sensitivity) / (Precision + Sensitivity), where TP = True Positives, FN = False Negatives, FP = False Positives. To provide a comprehensive evaluation of the model’s performance across all classes, we utilize macro and micro averaging techniques. Macro averaging computes the metric independently for each class and then takes the average. This gives equal weight to each class, regardless of its frequency:
where N is the number of classes, and Metric could be precision, recall, or F1-score. Micro averaging, on the other hand, aggregates the contributions of all classes to compute the average metric:
3.3.1. Proposed deep learning network architecture
The deep neural network architecture proposed in this study is illustrated in Fig. 1. To address performance degradation and memory overload associated with lengthy input signals in the BiLSTM network, we adopt a segmentation approach for ECG signals and labels. This involves partitioning the data into smaller segments and resizing them as needed, aiming to create as many 5000-sample segments as possible, with the final segment potentially being shorter. Specifically, each ECG record from the QT Database is segmented into 44 distinct data segments, while each record from the MIT-BIH Arrhythmia database is divided into 130 separate data segments for the purpose of deep learning experiments. This segmentation strategy ensures efficient processing while preserving signal integrity. The segmented input ECG sequence data undergoes z-score normalization for standardization. Notably, we refrain from utilizing bandpass or noise removal filters, as our investigation has confirmed their inability to enhance the performance of classification, particularly after the annotation process has been completed, as they may alter the coherence of sample positions and labels.
Fig. 1.

Architecture of the proposed deep learning model for ECG waveform delineation. The network consists of a feature extraction module comprising four convolutional layers, followed by batch normalization and ReLU activation layers. The extracted features are then processed by a sequence modeling module, which employs a stack of three bidirectional long short-term memory (BiLSTM) layers to capture bidirectional temporal dependencies. A dropout layer is incorporated for regularization to mitigate overfitting. Finally, the processed features are passed through a fully connected layer and a softmax layer to perform the classification into four waveform classes: P-wave, QRS complex, T-wave, and “N/W” (non-waveform regions).
After normalization, a sequence of 5000 samples is passed through a series of four consecutive 1-D convolutional layers, followed by a batch normalization layer. Batch normalization is applied to normalize a batch of data across observations. To expedite training of the convolutional layers and lessen sensitivity to network initialization, batch normalization layers are placed between convolutional layers and nonlinear activation functions, such as ReLU layers. The rectified linear unit (ReLU) activation function is utilized to introduce nonlinearity into the network, aiding in mitigating the vanishing gradient problem during model training and facilitating the learning of complex data relationships. This architectural choice helps accelerate training and enhances the stability and performance of the network. Following this, the learning process extends deeper, leveraging the unique capabilities of BiLSTM. With a stack of three BiLSTM layers, the network benefits from its ability to retain information across multiple time steps and effectively handle sequences with long-term dependencies. The incorporation of multiple stacked BiLSTM layers in the network architecture further enhances its capability to capture intricate temporal patterns and long-range dependencies present in the data. This multi-layered BiLSTM structure enables the model to learn and leverage complex temporal relationships more effectively, ultimately contributing to improved performance and increased robustness in ECG signal analysis tasks. However, our empirical investigations revealed that stacking more than three BiLSTM layers did not result in further improvements in capturing temporal patterns and relationships. This finding suggests that three stacked BiLSTM layers provide an optimal configuration, effectively leveraging the benefits of this architectural component while preventing potential overfitting or diminishing returns beyond a certain depth. Additionally, a dropout layer is employed as a regularization method to prevent overfitting before the fully connected layer, which generates hypothesis function values for the classes. Finally, the softmax layer is employed to obtain the probability mass function for each class, resulting in the final class output. The layers and operation of the proposed learning network system are described in Table 3.
Table 3.
The layers and operation of the proposed learning network system are described, where FS, NF, and NHU represent filter size, number of filters, and number of hidden units, respectively.
| Layer/Process | Property |
|---|---|
| Input type | Sequence, Size = 1 |
| Output type | Classification |
| Number of layers | 14 |
| Signal normalization | z-score |
| CONV1d-1 | FS = 5, NF = 16, Stride = 1, padding: same |
| CONV1d-2 | FS = 7, NF = 32, Stride = 1, padding: same |
| CONV1d-3 | FS = 7, NF = 64, Stride = 1, padding: same |
| CONV1d-4 | FS = 7, NF = 128, Stride = 1, padding: same |
| BiLSTM-1 | NHU = 64, Input size = 128 |
| BiLSTM-2 | NHU = 128, Input size = 128 |
| BiLSTM-3 | NHU = 128, Input size = 256 |
| Dropout probability | 0.2 |
| FC | Output size = 4, Input size = 256 |
| Loss function | Cross entropy |
| Shuffle: every epoch |
In summary, the input data is a sequence of size 1, and the output is a classification result. The network consists of 14 layers in total. The first four layers are 1D convolutional layers (CONV1d-1 to CONV1d-4) with varying filter sizes (FS) ranging from 5 to 7, different numbers of filters (NF) ranging from 16 to 128, a stride of 1, and same padding. The next three layers are BiLSTM layers (BiLSTM-1 to BiLSTM-3) with varying numbers of hidden units (NHU) of 64, 128, and 128, respectively, and input sizes of 128 and 256. The dropout probability is set to 0.2. The fully connected (FC) layer has an output size of 4 and an input size of 256. The loss function used is cross-entropy, and the Adam optimizer is employed for training. The training options include a maximum of 10 epochs, a batch size of 50, an initial learning rate of 0.01, a learn rate drop period of 3, a gradient threshold of 1, a piecewise learn rate schedule, and data shuffling at every epoch.
3.3.2. Proposed schemes for beat type classification
We propose two strategies for beat-type classification in ECG signals. The first approach involves beat segmentation, where signal samples are extracted relative to an R-peak based on the ratios of previous RR-intervals (PRRIs) and current RR-intervals (CRRIs). PRRI represents the period from the previous R-peak to the current R-peak, while CRRI denotes the period from the current R-peak to the next R-peak. This method differs from existing techniques, which typically extract samples at fixed intervals relative to an R-peak. For each heartbeat segmentation relative to a specified R-peak, we extract samples from two regions: (1) the latter 0.3 portion of the PRRI duration, representing the first half of the beat, and (2) the initial 0.45 portion of the CRRI duration, representing the second half of the beat. However, if any RR-interval exceeds a predefined threshold of, e.g., 450 samples, we employ a fixed segmentation, extracting 150 samples before the R-peak and 200 samples after the R-peak. The RR interval is illustrated in Fig. 2. We are provided with information on R-peak locations, beat types associated with R-peaks, and RR-intervals. The average ECG frequency ranges from 60 to 80 beats per minute, with a t1 duration of 0.25 s before the R-peak and a t2 duration of 0.45 s after the R-peak, resulting in an average total length of 0.7 s [29]. Here, t1 and t2 represent the period from the beginning of the P-wave to the R-peak and from the R-peak to the end of the T-wave, respectively, as shown in Fig. 2. This strategy aims to consistently capture the core part of beat morphology across various lengths of heartbeat intervals, including bradycardia and tachycardia, based on two consecutive RR-intervals.
Fig. 2.

Illustration of a normal ECG waveform, highlighting the key components. The P wave represents atrial depolarization, the QRS complex indicates ventricular depolarization, and the T wave corresponds to ventricular repolarization. The labeled intervals ‘t,’ ‘t1’ and ‘t2’ depict specific time periods within the ECG cycle, while ‘N/W’ denotes the regions between waveforms, which are not classified as distinct waves.
In the second scheme, postprocessing refines the predicted class of normal beats, addressing challenges in distinguishing them from premature atrial ventricular (PAV) beats. Despite the typical absence of a P-wave in PAVs, this distinction is not always reliable, as evidenced by P-wave presence in many annotated PAVs in the MIT-BIH arrhythmia database. During postprocessing, predicted normal beats meeting specific criteria are reclassified. Specifically, each normal beat’s expected heartbeat, based on its PRRI, is compared with the average heartbeat of the ten nearest normal beats detected, determined by their respective PRRIs. If the normal beat’s heartbeat falls ten beats below this average, it is reclassified as a PAV. We verified this scheme’s successful application, demonstrating significantly improved accuracy, as shown shortly.
3.4. Handling class imbalance
As shown in Table 2, our datasets for both waveform delineation and beat type classification tasks exhibit apparent class imbalance. This imbalance reflects the natural occurrence of different ECG components and beat types in real-world scenarios.
To address the imbalance in the waveform delineation task, we implemented the following strategies: We used a sequence-to-sequence classification approach, which allows the model to learn from the contextual information of surrounding samples, mitigating the impact of class imbalance. The proposed deep learning architecture, particularly the BiLSTM layers, helps capture long-range dependencies, which is crucial for understanding less represented classes like P-waves in the context of the entire ECG signal.
For the highly imbalanced beat-type classification task, we employed several techniques: We implemented an adaptive beat segmentation method that ensures each beat, regardless of its type, is appropriately represented in the input data. We incorporated relative heart rate information as an additional feature, which is particularly helpful in distinguishing the underrepresented PAC class from normal beats. Post-processing was applied to refine the classification of normal beats and PACs, addressing the challenge of their similar morphologies.
To ensure a fair assessment of the model’s performance across all classes, we used class-specific metrics such as sensitivity, precision, and F1-score, as well as macro and micro averages. These metrics provide a more balanced view of the model’s performance on both majority and minority classes.
4. Results
ECG-wave delineation results are presented first, followed by beat-type classification.
4.1. ECG-waveform delineation using QTDB
The dataset consisted of 210 ECG records, each resized and reformatted into 44 data containing 5000 samples. The data were shuffled and randomly divided into 70% for training and 30% for testing in the initial experiment. A sequence of 5000 samples was fed into the deep learning network illustrated in Fig. 1, where each sample was classified as “P” for P-wave, “QRS” for QRS complex, “T” for T-wave, or “N/W” for regions not classified as distinct waveforms. Fig. 3 depicts an example of satisfactory performance by the deep learning model. However, we encountered instances of non-fully satisfactory performance, which we attributed to potential inaccuracies in the automated expert annotation system, as exemplified in Fig. 4. To mitigate this issue, we manually removed data with incorrect labels from the expert system and retrained the model on the remaining data. Consequently, approximately 30% of the original data was discarded.
Fig. 3.

An example demonstrating accurate ECG waveform delineation by both the automated expert system and the deep learning model predictions. The top row displays the labels assigned by automated expert systems, serving as the ground truth annotations. Meanwhile, the bottom row shows corresponding predictions made by the deep learning model, aligning closely with expert annotations. This example underscores the successful performance of the deep learning approach in accurately delineating ECG waveforms, particularly when provided with high-quality expert annotations as training data.
Fig. 4.

Example result demonstrating non-fully satisfactory classification in ECG waveform delineation. The top figures display labels assigned by the automated expert systems, while the bottom figures depict corresponding predictions made by the deep learning system. It is notable that the delineation by the automatic expert system is not satisfactory.
The test results obtained after retraining on the curated dataset are shown in Fig. 5 as confusion matrices. It is important to note that the values and metrics are computed based on sample-by-sample accuracy rather than wave-based classifications. The results are statically evaluated across various metrics in Table 4. The deep learning model achieved exceptional performance in delineating different components of the ECG signal, including the P-wave, QRS complex, T-wave, and non-waveform regions. It demonstrated high sensitivity scores ranging from 0.9744 (QRS complex) to 0.9829 (T-wave), indicating its effectiveness in identifying true positive instances. The precision scores, varying from 0.9755 (QRS complex) to 0.9867 (T-wave), suggest a low false positive rate and accurate classification. The F1-scores, which combine precision and recall, were also high, with the T-wave exhibiting the highest score of 0.9848. Furthermore, the model exhibited excellent specificity, with true negative rates ranging from 0.9961 (T-wave) to 0.9973 (P-wave), indicating a low false positive rate for non-waveform regions. The consistent overall accuracy of 0.9828 across all classes suggests a low misclassification rate. Both macro and micro averages were high for precision, sensitivity, and accuracy, providing a comprehensive assessment of the model’s performance in ECG waveform delineation. We benchmark the results against established methodologies in the literature [11,30,31] as shown in Table 5. These studies also leveraged the QTDB dataset for their ECG waveform delineation experiments. However, they adopted slightly different data formulations to optimize their performance. For instance, their methodologies typically employed sample lengths of 500 or 1000 per data, whereas the approach utilizes sequences of 5000 samples per data as input to the deep learning model. Table 5 shows comparative evaluation of the deep learning model’s performance in ECG waveform delineation across four classes: P-wave, QRS complex, T-wave, and “N/W” using QTDB. Table 5 reports sensitivity (equivalent to recall), precision, and F1-score metrics for each class, indicating whether input signals are filtered. The comparative performance evaluation demonstrates that the proposed deep learning model achieves the best performance across most metrics. Notably, the approach excels in the detection of P-waves and T-waves, which are more challenging due to their smaller peak amplitudes compared to the prominent QRS complex. This superior performance highlights the model’s capability in accurately delineating subtle waveform components, a task that is often more challenging for traditional methods.
Fig. 5.

Confusion matrix depicting the sequence-to-sequence classification of ECG waveform delineation using QTDB. The values in the upper matrix represent the number of corresponding samples. The lower matrix displays the row-normalized ratios of the upper matrix. Diagonal elements in the lower matrix represent the sensitivity for each class.
Table 4.
Evaluation metrics by the deep learning model for assessing the performance of ECG waveform delineation using QTDB. The table presents various statistical measures, including sensitivity, precision, F1-score, and overall accuracy, calculated for each waveform class (P-wave, QRS complex, T-wave) and the “N/W” class representing non-waveform regions. Note: The numbers represent sample counts.
| Metric | N/W | P | QRS | T | Macro AVG | Micro AVG |
|---|---|---|---|---|---|---|
| True positive | 2,663,926 | 547,937 | 579,932 | 1,121,957 | 1228438 | 1,228,438 |
| False positive | 44,301 | 12,201 | 14,589 | 15,157 | 21,562 | 21,562 |
| False negative | 41,019 | 10,425 | 15,234 | 19,570 | 21,562 | 21,562 |
| True negative | 2,250,754 | 4,429,437 | 4,390,245 | 3,843,316 | 3,728,438 | 3,728,438 |
| Precision | 0.9836 | 0.9782 | 0.9755 | 0.9867 | 0.9810 | 0.9828 |
| Sensitivity | 0.9848 | 0.9813 | 0.9744 | 0.9829 | 0.9809 | 0.9828 |
| Specificity | 0.9807 | 0.9973 | 0.9967 | 0.9961 | 0.9927 | 0.9943 |
| Accuracy | 0.9828 | 0.9828 | 0.9828 | 0.9828 | 0.9828 | 0.98275 |
| F1-measure | 0.9842 | 0.9798 | 0.9749 | 0.9848 | 0.9809 | 0.9828 |
Table 5.
Comparative evaluation of the deep learning model’s performance in ECG waveform delineation across four classes: P-wave, QRS complex, T-wave, and “N/W” (non-waveform regions) using QTDB. The table reports sensitivity (equivalent to recall), precision, and F1-score metrics for each class, indicating whether input signals are filtered. The best values are highlighted in bold. The * symbol denotes references utilizing datasets other than MIT-BIH arrhythmia, while the • symbol indicates metrics not available in the references.
| Metric | Sensitivity | Precision | F1-score | Filtering | |||||||||
|---|---|---|---|---|---|---|---|---|---|---|---|---|---|
| Class | N/W | P | QRS | T | N/W | P | QRS | T | N/W | P | QRS | T | |
| Ref. [30] | 0.95 | 0.90 | 0.95 | 0.92 | 0.95 | 0.92 | 0.94 | 0.90 | 0.95 | 0.91 | 0.94 | 0.91 | No |
| Ref. [31] | 0.93 | 0.92 | 0.95 | 0.93 | 0.95 | 0.90 | 0.90 | 0.92 | 0.95 | 0.91 | 0.94 | 0.93 | No |
| Ref. [11] (%) | 84.39 | 76.80 | 85.54 | 82.40 | 95.11 | 87.83 | 96.24 | 91.43 | 89.43 | 81.95 | 90.58 | 86.68 | No |
| Ref. [11] (%) | 98.75 | 96.53 | 99.70 | 96.81 | 98.36 | 89.74 | 99.19 | 95.44 | 98.55 | 93.01 | 99.45 | 96.12 | Yes |
| Ref. [18] (%) | 94.39 | 92.66 | 95.29 | 92.30 | • | • | • | • | 94.20 | 93.17 | 95.22 | 92.52 | No |
| Ref. [19]* (%) | • | 94.52 | 97.40 | 92.94 | • | 94.03 | 97.25 | 94.92 | • | 94.27 | 97.32 | 93.92 | No |
| Our approach (%) | 98.48 | 98.13 | 97.44 | 98.29 | 98.36 | 97.82 | 97.55 | 98.67 | 98.42 | 97.98 | 97.49 | 98.48 | No |
4.2. ECG-waveform delineation using data from a wearable device
To evaluate the model’s performance on wearable device data, we applied the pre-trained deep learning network from the previous section. The only pre-processing step involved was z-score normalization of the wearable device data. It is important to note that we did not have annotated wearable device data available, preventing us from retraining the network on this specific data source. Consequently, the model’s performance on the wearable device data is based solely on the knowledge acquired during the initial training phase, which utilized the well-established PhysioNet QT Database. It is notable that its performance could potentially be further improved by retraining the network with annotated wearable device data, enabling it to adapt to the specific characteristics and nuances of this data source. For the evaluation, we randomly selected 250 segments, each lasting 20 s and sampled at 250 Hz, from participants identified as having atrial fibrillation rhythm by the Cardea SOLO software. Given that the ECG data were obtained in real-life scenarios, we focused on selecting clean beats for validation, although we acknowledged the possibility of some segments containing significant noise. We then visually inspected the model’s performance in detecting waves on these ECG beats.
Fig. 6 showcases the deep learning model’s proficiency in classifying different components of the ECG waveform using data from wearable devices. The two subplots highlight the model’s ability to accurately detect the presence and absence of P-waves, a crucial component of the ECG signal. In Fig. 6(a), the model successfully detects the presence of P-waves in the ECG signal, labeled in blue. The P-waves are clearly visible as small deflections preceding the larger QRS complexes (labeled in orange). The accurate identification and labeling of these P-wave segments demonstrate the model’s capability to recognize this essential waveform component. Fig. 6(b) provides an example of an ECG signal exhibiting atrial fibrillation (AF), where no discernible P-waves are present. In this case, the model correctly identifies the absence of P-waves in the AF beats, as evident from the lack of labeled P-wave segments. Instead, the model accurately classifies the QRS complexes, T-waves (labeled in purple), and the N/W segments (also labeled in purple), which represent the isoelectric (flat) regions between waveforms. This figure illustrates the deep learning model’s robustness and reliability in ECG waveform classification, particularly in the context of data obtained from wearable devices, which can be more challenging due to potential noise and signal variability. The accurate detection of P-waves when present, as well as the correct non-detection in AF beats, highlights the model’s proficiency in handling diverse ECG signals encountered in real-world scenarios.
Fig. 6.

Illustrations of ECG waveform classification performance by the deep learning model on wearable device data. It demonstrates the model’s capability to accurately detect P-waves when present, as shown in (a), and correctly identify the absence of P-waves in atrial fibrillation beats, as depicted in (b).
The experiment result using the data from the wearable device has been summarized in Fig. 7 and Table 6. The model achieves an impressive overall accuracy of 97.97% and a micro-averaged F1-score of 97.97%, indicating a high level of proficiency in accurately classifying the ECG waveform components and non-waveform segments. The model exhibits excellent performance in identifying non-waveform segments, with a sensitivity (recall) of 98.03%, precision of 98.58%, and specificity of 98.58%. The model demonstrates robust performance in detecting P-waves, with a sensitivity of 94.44%, precision of 92.42%, and specificity of 98.87%. The model excels in recognizing QRS complexes, achieving a remarkably high sensitivity of 99.30%, precision of 98.90%, and specificity of 99.75%. The model performs exceptionally well in identifying T-waves, with a sensitivity of 98.90%, precision of 99.30%, and specificity of 99.84%. The confusion matrix provides insights into the model’s misclassifications. While the majority of waves are correctly classified along the diagonal, there are some notable off-diagonal elements. A small fraction (2.0%) of N/W samples are misclassified as P-waves. A few QRS complexes (0.7%) are misidentified as T-waves, and vice versa (1.1% of T-waves are misclassified as QRS). The macro-averaged precision, sensitivity, and F1-score are 97.30%, 97.67%, and 97.48%, respectively, while the micro-averaged values are identical at 97.97%. This indicates that the model’s performance is consistent and robust across the different classes, with minimal class imbalance or bias. In summary, the deep learning model demonstrates outstanding performance in ECG waveform delineation, accurately identifying and classifying the P-waves, QRS complexes, T-waves, and non-waveform segments from the wearable device data. The high sensitivity, precision, and F1-scores for individual classes, coupled with the impressive overall accuracy and macro-averaged metrics, underscore the model’s efficacy and potential for reliable ECG analysis and arrhythmia detection in wearable and remote health monitoring applications.
Fig. 7.

Confusion matrix evaluating the performance of an ECG waveform delineation on data from the wearable device. The upper matrix displays the number of waves classified into each category (N/W, P, QRS, T) by the model’s predictions. The lower matrix shows the row-normalized percentages. The diagonal elements in the lower matrix correspond to the sensitivity for each class, highlighting the model’s ability to correctly identify N/W (98.0%), P (94.4%), QRS (99.3%), and T (98.9%) waveform segments. Off-diagonal elements indicate misclassifications, such as a small fraction of N/W samples being misclassified as P (2.0%), or a few QRS segments being misidentified as T (0.7%).
Table 6.
Evaluation metrics for assessing the performance of ECG waveform delineation on data from the wearable device using the deep learning model. The table presents various statistical measures, including sensitivity, precision, F1-score, and overall accuracy, calculated for each waveform class (P-wave, QRS complex, T-wave) and the “N/W” class representing non-waveform regions. Note: The numbers represent wave counts.
| Metric | N/W | P | QRS | T | Macro AVG | Micro AVG |
|---|---|---|---|---|---|---|
| True positive | 2631 | 646 | 993 | 989 | 1314.75 | 1314.75 |
| False positive | 38 | 53 | 11 | 7 | 27.25 | 27.25 |
| False negative | 53 | 38 | 7 | 11 | 27.25 | 27.25 |
| True negative | 2646 | 4631 | 4357 | 4361 | 3998.75 | 3998.75 |
| Precision | 0.9858 | 0.9242 | 0.9890 | 0.9930 | 0.9730 | 0.9797 |
| Sensitivity | 0.9803 | 0.9444 | 0.9930 | 0.9890 | 0.9767 | 0.9797 |
| Specificity | 0.9858 | 0.9887 | 0.9975 | 0.9984 | 0.9926 | 0.9932 |
| Accuracy | 0.9797 | 0.9797 | 0.9797 | 0.9797 | 0.9797 | 0.9797 |
| F1-measure | 0.9830 | 0.9342 | 0.9910 | 0.9910 | 0.9748 | 0.9797 |
4.3. ECG beat-type classification
Leveraging the accurate and high-performance of the proposed deep learning network model for ECG waveform classification and delineation, we extend the approach with two additional novel schemes to tackle the problem of ECG beat-type classification, with a focus on arrhythmias such as PAC and PVC. In this endeavor, our objective shifts from analyzing the waveforms of ECG signals to examining the morphology of the heartbeat itself. Consequently, the delineation process expands beyond individual waves to encompass entire beats, as a normal beat comprises a P-wave, QRS-complex, and T-wave. Although certain arrhythmias may lack specific waves, such as the P-wave, the fundamental structure of a beat remains composed of these wave components. While PVC detection is relatively straightforward, identifying PACs poses a significant challenge due to the similarity between PAC waveforms and those of normal beats, except for shorter PRRI durations in PACs compared to normal beats. Despite the irregular nature of RR-intervals in arrhythmias, which precludes a universal criterion for distinguishing PACs based solely on RR-interval values, existing approaches often struggle to accurately detect PACs, in contrast to the generally satisfactory performance observed in PVC detection. To rigorously evaluate the two proposed novel schemes in conjunction with the deep learning network model’s beat-type classification capabilities, we extract relevant ECG records from the MIT-BIH arrhythmia database, selecting only those containing normal beats, PACs, and PVCs. The specific ECG records comprising solely these beat types – normal sinus rhythm (Ns), PACs, and PVCs – are summarized in Table 7. It shows the distribution of beat types in the ECG records from the MIT-BIH Arrhythmia Database used for training and evaluation of the beat-type classification model. The table presents the count of each beat-type category for both the training and evaluation datasets. We set aside records 116 and 220 for testing purposes, while utilizing the remaining records as training data for the model. Each ECG record comprises 650,000 samples, sampled at a frequency of 250 Hz. To preprocess the data, we resize each record into segments of 5000 samples, resulting in 130 data per record. Initially, we label each 5000-sample segment as “N/A” (not applicable), before further labeling individual samples based on beat types, RR-intervals, R-peaks, and segmented beats. The deep learning architecture and parameters used align with those employed in the waveform delineation study described in the previous section. Consequently, the data are shuffled at every epoch during training. Our approach diverges from existing methods in beat-type classification, as we first classify all 5000 samples within resized data before making decisions regarding segmented beats, whereas existing approaches classify the entire waveform of a beat at once. We classify a beat based on the label with the maximum count within its duration.
Table 7.
Distribution of beat types in ECG records from the MIT-BIH arrhythmia database used for training and evaluation of beat-type classification.
| Record | 100 | 103 | 106 | 112 | 115 | 116 | 117 | 119 | 121 | 122 | 209 | 220 | 221 | 228 |
|---|---|---|---|---|---|---|---|---|---|---|---|---|---|---|
| N | 2293 | 2082 | 1507 | 2537 | 1953 | 2302 | 1534 | 1543 | 1861 | 2476 | 2621 | 1954 | 2031 | 1688 |
| PAC | 33 | 2 | 0 | 2 | 0 | 1 | 1 | 0 | 1 | 0 | 383 | 94 | 0 | 3 |
| PVC | 1 | 0 | 520 | 0 | 0 | 109 | 0 | 444 | 1 | 1 | 1 | 0 | 396 | 362 |
Fig. 8 shows an example of the performance of the proposed deep learning model for ECG beat classification by comparing its predictions with expert annotations. The top row displays the ground truth beat labels assigned by cardiologists, including Normal (N), premature atrial contraction (A or PAC), premature ventricular contraction (V or PVC), and Non-Applicable (N/A). The bottom row shows the corresponding beat classifications made by the deep learning model across a 5000-sample sequence. This example illustrates the model’s high accuracy in correctly classifying different beat types, closely matching the expert annotations. After the initial classification, the second proposed scheme described in Section 3.3.2 is applied as a post-processing step to the approach. This process specifically and exclusively converts falsely classified Normal beats (N) to Atrial Premature Beats (PAV) based on a predefined criterion.
Fig. 8.

Comparison of expert annotations and deep learning model predictions for ECG beat classification. The top row displays the ground truth labels assigned by cardiologists for normal (N), PAC (A), PVC (V), and non-applicable (N/A) beats. The bottom row shows the corresponding beat classifications made by the proposed deep learning model. This example illustrates the model’s excellent performance in accurately classifying different beat types, closely matching the expert annotations across the 5000 sample sequence.
This false detection occurs due to the similarity between these two beat types, with the primary distinction being the duration of the PRRIs. The deep learning network faces challenges in learning the pattern of PRRIs for each beat type because these durations are not deterministic values; they can vary across records, patients, or even within the same individual’s condition. We experimented with diverse values for the number of neighboring beats considered, and the results were similar for a range of 2 to 20 neighbors, but the performance was marginally better when considering 10 neighboring beats.
For example, Fig. 9 shows an instance where a PAC beat was misclassified as a normal beat by the deep learning model, as indicated by the arrow. Such misclassifications of PAC beats as normal beats represent a major challenge in accurate PAC classification. The proposed post-processing scheme aims to address these instances of misclassification by attempting to correctly identify PAC beats that were initially misclassified as normal beats.
Fig. 9.

Comparison of beat classification results between cardiologists’ annotations (top) and a deep learning model (bottom). The arrow in the bottom plot highlights an instance where the model initially misclassified a PAC as a normal beat (N), which is subsequently corrected by the proposed post-processing scheme.
Finally, we show the result of beat-type classification in Fig. 10. The confusion matrix in Fig. 10 illustrates the classification results of ECG beat types across four categories: N/A (not a beat), N (normal), V (PVC), and A (PAC). In the upper matrix, the counts represent the actual distribution of beats among the predicted classes, while the lower matrix displays the row-normalized percentages, providing a clearer perspective on the relative proportions. The model demonstrates high performance across all classes, with sensitivity rates indicating its ability to accurately identify each beat type. Specifically, the normal beat class (N) achieves a sensitivity of 99.8%, the V class achieves a sensitivity of 99.1%, and the A class achieves a sensitivity of 97.8%, further emphasizing the model’s robust performance in accurately classifying PVC and PAC beats.
Fig. 10.
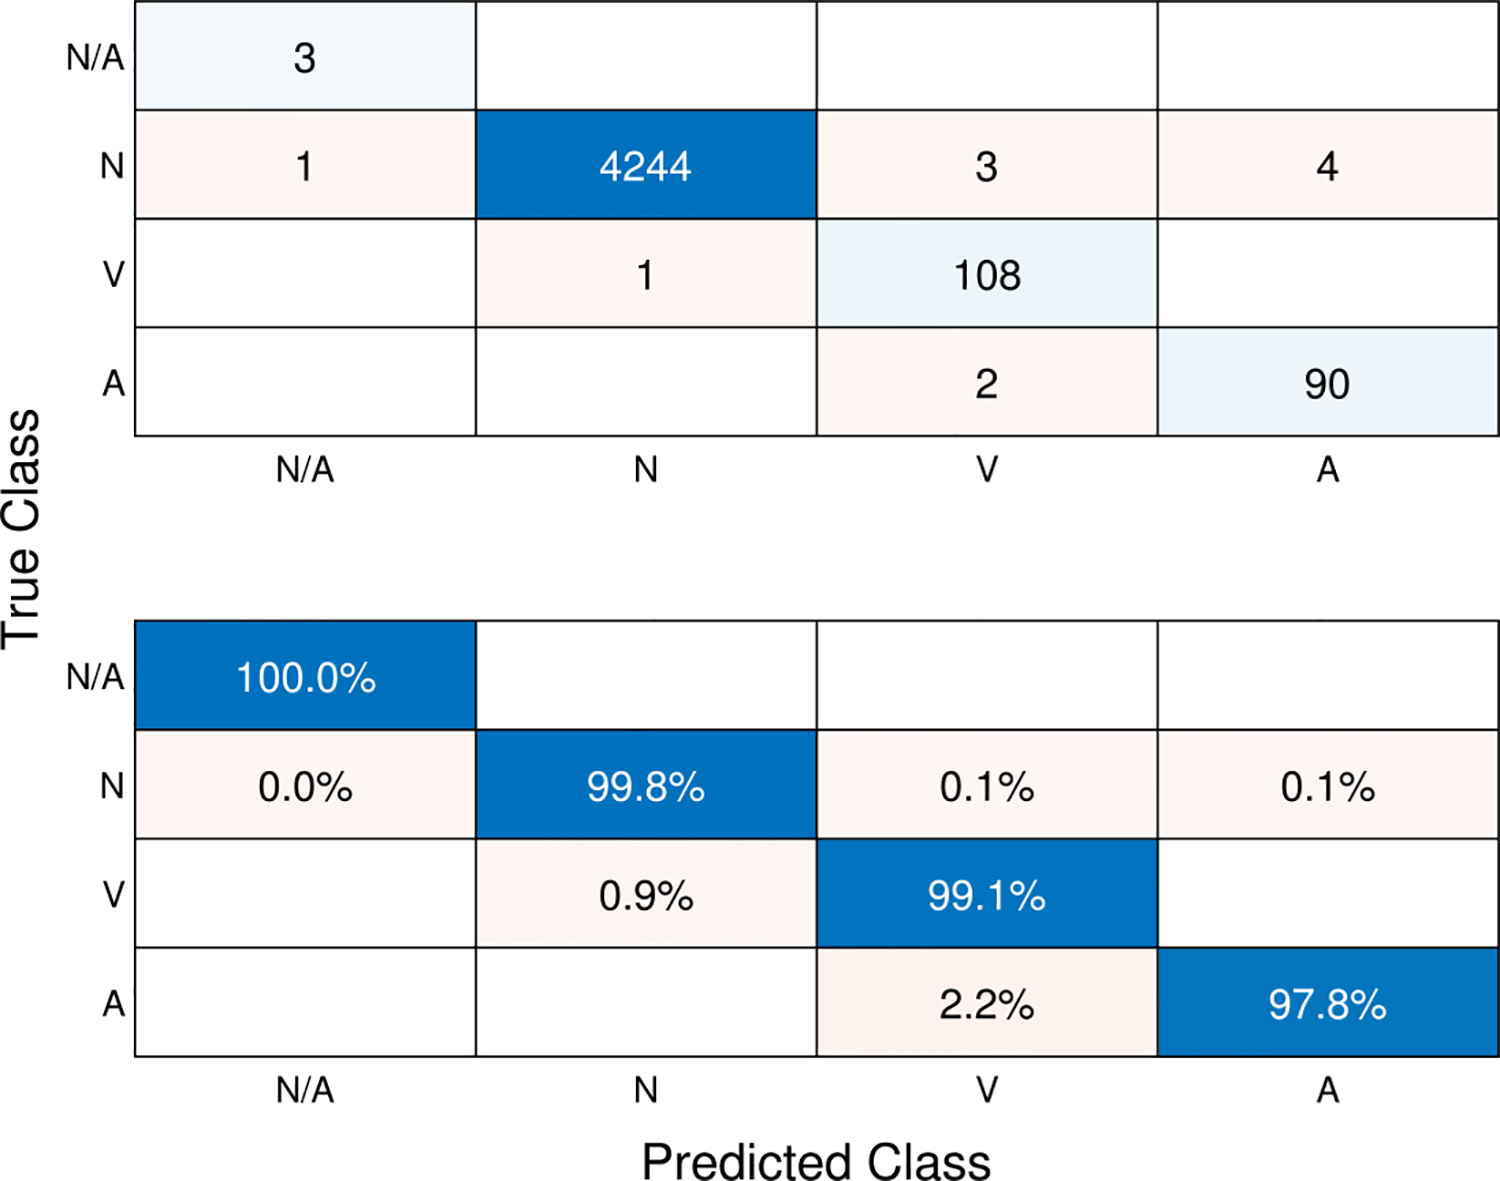
Confusion matrix depicting the sequence-to-sequence classification of ECG beat-types. The values in the upper matrix represent the number of corresponding beats. The lower matrix displays the row-normalized ratios of the upper matrix. Diagonal elements in the lower matrix represent the sensitivity (recall) for each class.
Table 8 evaluates the performance of the deep learning model for classifying four different ECG beat types: N/A, N (Normal), V, and A. In terms of sensitivity (recall), the model achieves high sensitivity scores for all beat types, with 0.9981 for N, 0.9908 for V, and 0.9783 for A. This indicates that the model is highly effective in correctly identifying the true positive instances of each class. The precision scores are also impressive, ranging from 0.9558 for V to 0.9998 for N. This means the model has a low false positive rate and correctly classifies the most positive predictions. The F1-scores, which combine precision and recall, are high for all classes, with N having the highest at 0.9989, followed by V (0.9730), and A (0.9677). The model demonstrates excellent specificity (true negative rate) across all classes, indicating a low false positive rate for negative instances. The overall accuracy of the model is 0.9975 for all classes, which is outstanding and suggests a very low misclassification rate. The macro averages provide an overall assessment of the model’s performance across classes, while the micro averages consider the total true positives, false positives, and false negatives. Both macro and micro averages are high for precision, sensitivity, and accuracy. In summary, the post-processing method proposed alongside the deep learning model demonstrates exceptional performance in classifying ECG beat types, with high sensitivity, precision, F1-scores, and overall accuracy across all classes. The results indicate the model’s reliability and potential for practical applications in ECG analysis and cardiac monitoring.
Table 8.
Evaluation metrics for assessing the performance of ECG beat type classification using the deep learning model. The table presents various statistical measures, including sensitivity, precision, F1-score, and overall accuracy, calculated for each beat type class.
| Metric | N/A | N (Normal) | V (PVC) | A (PAC) | Macro AVG | Micro AVG |
|---|---|---|---|---|---|---|
| True positive | 3 | 4244 | 108 | 90 | 1111.2 | 1111.2 |
| False positive | 1 | 1 | 5 | 4 | 2.75 | 2.75 |
| False negative | 0 | 8 | 1 | 2 | 2.75 | 2.75 |
| True negative | 4452 | 203 | 4342 | 4360 | 3339.2 | 3339.2 |
| Precision | 0.75 | 0.9998 | 0.9558 | 0.9575 | 0.9157 | 0.9975 |
| Sensitivity | 1 | 0.9981 | 0.9908 | 0.9783 | 0.9918 | 0.9975 |
| Specificity | 0.9998 | 0.9951 | 0.9989 | 0.9991 | 0.9982 | 0.9992 |
| Accuracy | 0.9975 | 0.9975 | 0.9975 | 0.9975 | 0.9975 | 0.9975 |
| F1-measure | 0.8571 | 0.9989 | 0.9730 | 0.9677 | 0.949 | 0.9975 |
We benchmark the results against existing methods in the literature as shown in Table 9. The table provides a comprehensive comparative analysis of the deep learning model’s efficacy in classifying ECG beat types across four distinct categories: N (normal), V (premature ventricular contraction), A (premature atrial contraction), and “N/A” (not a beat), leveraging the MIT-BIH arrhythmia dataset. Key performance metrics, including sensitivity (equivalent to recall), precision, and F1-score, are evaluated. In the N (normal) class, the proposed method demonstrates exceptional sensitivity, achieving a remarkable rate of 99.81%, surpassing the majority of referenced techniques. Furthermore, it attains the highest precision level recorded at 99.98%, signifying outstanding accuracy in positive predictions. The F1-score, indicative of a harmonious balance between precision and recall, stands at 99.89%, marking it as the highest observed in this study. For the V class, the model achieves a sensitivity rate of 99.08%, placing it among the top performers in the field. Despite a precision slightly lower than some references, at 95.58%, it maintains robust predictive capability. Notably, its F1-score of 0.9730 ranks as the highest recorded for this particular class, underscoring its efficacy in distinguishing premature ventricular contractions. In the A class, the approach excels with the highest sensitivity rate observed at 97.83%. Additionally, it establishes a new benchmark for precision in this category, reaching 95.75%. With an F1-score of 96.77%, surpassing all other evaluated methods, it demonstrates superior performance in accurately identifying premature atrial contractions. Moreover, the proposed approach achieves superior accuracy rates across all existing methodologies, solidifying its position as a frontrunner in the field of ECG beat type classification. In summary, the integration of our post-processing method with the deep learning model yields state-of-the-art performance, boasting the highest or among the highest scores for sensitivity, precision, and F1-score across all classes when compared with reference methods. These results underscore the efficacy of our classification approach and its potential for practical applications in ECG analysis.
Table 9.
Comparative evaluation of the deep learning model’s performance in ECG beat type classification across four classes: N (normal), V (premature ventricular contraction), A (premature atrial contraction), and “N/A” (not a beat) using the MIT-BIH arrhythmia dataset. The table reports sensitivity (equivalent to recall), precision, and F1-score metrics for each class, with the best values highlighted in bold. The * symbol denotes references utilizing datasets other than MIT-BIH arrhythmia, while the • symbol indicates metrics not available in the references.
| Metric | Sensitivity | Precision | F1-score | Accuracy | ||||||
|---|---|---|---|---|---|---|---|---|---|---|
| Class | N (normal) | (PVC) | A (PAC) | N (normal) | (PVC) | A (PAC) | N (normal) | (PVC) | A (PAC) | |
| Ref. [16] (%) | 88.51 | 92.05 | 82.04 | • | • | • | • | • | • | 95.08 |
| Ref. [32]* | 0.85 | 0.82 | 0.56 | • | • | • | 0.817 | 0.830 | 0.618 | • |
| Ref. [33]*(%) | 99.77 | 80.70 | • | 98.70 | 97.20 | • | • | • | • | 98.60 |
| Ref. [34] (%) | 98.70 | 98.54 | 86.75 | 97.53 | 98.70 | 91.59 | 98.11 | 98.62 | 89.11 | 97.52 |
| Ref. [35] (%) | 100 | 97.61 | • | • | • | • | • | • | • | 99.67 |
| Ref. [36]* | • | • | • | • | • | • | 0.801 | 0.869 | 0.826 | |
| Ref. [37] (%) | 99.4 | 97.9 | 95.8 | • | • | • | • | • | • | 99.11 |
| Ref. [12]* | • | 1.00 | 0.80 | • | 0.84 | 0.87 | • | 0.91 | 0.83 | • |
| Ref. [17] | 1.00 | 0.98 | 0.89 | 0.99 | 0.98 | 0.93 | 0.99 | 0.98 | 0.91 | 0.9911 |
| Ref. [20] (%) | 99.05 | 98.88 | 96.32 | 97.07 | 96.88 | 96.69 | 97.57 | 97.38 | 97.21 | • |
| Ref. [21] (%) | 99.74 | 98.69 | 91.56 | • | • | • | • | • | • | • |
| Ref. [22] (%) | 99.79 | 92.49 | 97.10 | 99.44 | 95.80 | 93.49 | 99.61 | 94.12 | 95.26 | • |
| Ref. [23] (%) | 95.63 | 97.30 | 96.30 | • | • | • | • | • | • | 96.19 |
| Ref. [24] (%) | 96.6 | 87.2 | 70.3 | 88.5 | 98.1 | 86.7 | • | • | • | • |
| Our approach (%) | 99.81 | 99.08 | 97.83 | 99.98 | 95.58 | 95.75 | 99.89 | 0.9730 | 96.77 | 99.78 |
Overall, our study result can be highlighted as follows. For beat-type classification, we obtained sensitivity values of 99.81%, 99.08%, and 97.83% for normal beats, PVCs, and PACs respectively. Precision scores were 99.98%, 95.58%, and 95.75% for the same classes. In waveform delineation, we observed F1-scores of 0.9842 for N/W, 0.9798 for P-waves, 0.9749 for QRS complexes, and 0.9848 for T-waves.
5. Discussion
The proposed deep learning model, integrating two novel schemes, showed outstanding performance in ECG waveform delineation and beat type classification tasks using the QTDB and MIT-BIH arrhythmia datasets [1,25,27]. The adaptive beat segmentation scheme dynamically extracts optimal beat durations based on RR-intervals, addressing limitations of fixed-period segmentation methods [8,9]. The proposed approach ensures more precise delineation and improved beat morphology learning.
The post-processing scheme, incorporating relative heart rate information alongside learned sequential morphology, significantly enhances premature atrial contraction (PAC) detection, addressing challenges noted in previous studies [16,17]. For waveform delineation, the proposed model achieved high accuracy across all classes on both QTDB and wearable device data, outperforming existing methods [10,30,31].
In beat type classification, we obtained state-of-the-art performance [32,34], particularly in PAC detection. It achieved the highest sensitivity, precision, and F1-scores for normal, premature ventricular contraction, and PAC classes, and outperformed earlier classification attempts [33].
These results show the model’s robustness in ECG signal analysis, including real-world wearable device data, aligning with recent trends in applying deep learning to ECG data from wearable devices for arrhythmia detection [12,37]. This capability holds promise for timely diagnosis and treatment in real-world cardiac monitoring applications.
Limitations and future directions
While the proposed approach has been rigorously evaluated on established datasets and real-world wearable device data, its performance may be limited in scenarios with severe motion artifacts, such as during cardiopulmonary resuscitation. Future work should focus on integrating preprocessing steps for artifact removal, potentially leveraging denoising techniques using convolutional neural networks and autoencoder–decoder architectures [38,39].
The lack of representation of certain classes, particularly PACs in beat type classification, remains a challenge despite our strategies to mitigate class imbalance. This imbalance may contribute to slightly lower performance metrics for minority classes. Future research should explore ECG-specific data augmentation techniques, synthetic data generation methods to increase minority class representation, and ensemble methods combining models trained on different class distributions. These efforts aim to enhance the robustness and generalizability of the approach across a wider range of real-world scenarios and class distributions.
6. Conclusion
Our study demonstrated the effectiveness of integrating novel schemes with deep learning for ECG signal analysis. The proposed approach achieved state-of-the-art performance in waveform delineation and beat type classification across diverse datasets, including real-world wearable device data. The adaptive beat segmentation scheme enhanced beat morphology learning by dynamically adjusting to RR-interval lengths, mitigating segmenting errors via typical fixed-period segmentation. Additionally, incorporating relative heart rate information significantly improved the detection of PACs that are easily confused with normal beats. The proposed approach showed a state-of-the-art performance in detecting PACs and PVCs, with high sensitivity, precision, and F1-scores. This reliability extended wearable device data, and showed real-world applicability. The consistent performance in both waveform delineation and beat type classification tasks underscores the approach’s high potential for broader application in ECG arrhythmia detection, which are significant implications for clinical practice, potentially improving cardiac monitoring, diagnosis timeliness, etc.
Acknowledgments
This work was supported by NIH R01 HL165009.
Footnotes
CRediT authorship contribution statement
Jaechan Lim: Writing – review & editing, Writing – original draft, Visualization, Validation, Software, Methodology, Investigation, Formal analysis, Data curation, Conceptualization. Dong Han: Writing – review & editing, Investigation, Data curation. Mahdi Pirayesh Shirazi Nejad: Writing – review & editing, Validation, Investigation, Data curation. Ki H. Chon: Writing – review & editing, Supervision, Software, Resources, Project administration, Methodology, Investigation, Formal analysis, Conceptualization.
Declaration of competing interest
The authors ensure that there is no potential conflict of interest possibly influencing the interpretation of data in the paper. The authors declare that there is no competing financial interest or personal relationship that could have appeared to influence the work reported in this paper.
References
- [1].Goldberger AL, Amaral LA, Glass L, Hausdorff JM, Ivanov PC, Mark RG, Mietus JE, Moody GB, Peng C-K, Stanley HE, PhysioBank, PhysioToolkit, and PhysioNet: components of a new research resource for complex physiologic signals, circulation 101 (23) (2000) e215–e220. [DOI] [PubMed] [Google Scholar]
- [2].Sahoo S, Dash M, Behera S, Sabut S, Machine learning approach to detect cardiac arrhythmias in ECG signals: A survey, Irbm 41 (4) (2020) 185–194. [Google Scholar]
- [3].Luz E.J.d.S., Schwartz WR, Cámara-Chávez G, Menotti D, ECG-based heartbeat classification for arrhythmia detection: A survey, Comput. Methods Programs Biomed 127 (2016) 144–164. [DOI] [PubMed] [Google Scholar]
- [4].Hong S, Zhou Y, Shang J, Xiao C, Sun J, Opportunities and challenges of deep learning methods for electrocardiogram data: A systematic review, Comput. Biol. Med 122 (2020) 103801. [DOI] [PubMed] [Google Scholar]
- [5].Hannun AY, Rajpurkar P, Haghpanahi M, Tison GH, Bourn C, Turakhia MP, Ng AY, Cardiologist-level arrhythmia detection and classification in ambulatory electrocardiograms using a deep neural network, Nat. Med 25 (1) (2019) 65–69. [DOI] [PMC free article] [PubMed] [Google Scholar]
- [6].Yıldırım Ö, Pławiak P, Tan R-S, Acharya UR, Arrhythmia detection using deep convolutional neural network with long duration ECG signals, Comput. Biol. Med 102 (2018) 411–420. [DOI] [PubMed] [Google Scholar]
- [7].Mincholé A, Rodriguez B, Artificial intelligence for the electrocardiogram, Nat. Med 25 (1) (2019) 22–23. [DOI] [PubMed] [Google Scholar]
- [8].Martínez JP, Almeida R, Olmos S, Rocha AP, Laguna P, A wavelet-based ECG delineator: evaluation on standard databases, IEEE Trans. Biomed. Eng 51 (4) (2004) 570–581. [DOI] [PubMed] [Google Scholar]
- [9].Chouhan V, Mehta S, Detection of QRS complexes in 12-lead ECG using adaptive quantized threshold, Int. J. Comput. Sci. Netw. Secur 8 (1) (2008) 155–163. [Google Scholar]
- [10].Xiong Z, Nash MP, Cheng E, Fedorov VV, Stiles MK, Zhao J, ECG signal classification for the detection of cardiac arrhythmias using a convolutional recurrent neural network, Physiol. Meas 39 (9) (2018) 094006. [DOI] [PMC free article] [PubMed] [Google Scholar]
- [11].Peimankar A, Puthusserypady S, DENS-ECG: A deep learning approach for ECG signal delineation, Expert Syst. Appl 165 (2021) 113911. [Google Scholar]
- [12].Hong J, Li H-J, Yang C.-c., Han C-L, Hsieh J.-c., A clinical study on atrial fibrillation, premature ventricular contraction, and premature atrial contraction screening based on an ECG deep learning model, Appl. Soft Comput 126 (2022) 109213. [Google Scholar]
- [13].De Chazal P, O’Dwyer M, Reilly RB, Automatic classification of heartbeats using ECG morphology and heartbeat interval features, IEEE Trans. Biomed. Eng 51 (7) (2004) 1196–1206. [DOI] [PubMed] [Google Scholar]
- [14].Llamedo M, Martínez J, Analysis of a semiautomatic algorithm for ECG heartbeat classification, in: 2011 Computing in Cardiology, IEEE, 2011, pp. 137–140. [Google Scholar]
- [15].Rajpurkar P, Hannun AY, Haghpanahi M, Bourn C, Ng AY, Cardiologist-level arrhythmia detection with convolutional neural networks, 2017, arXiv preprint arXiv:1707.01836. [Google Scholar]
- [16].Sellami A, Hwang H, A robust deep convolutional neural network with batch-weighted loss for heartbeat classification, Expert Syst. Appl 122 (2019) 75–84. [Google Scholar]
- [17].Yildirim O, Baloglu UB, Tan R-S, Ciaccio EJ, Acharya UR, A new approach for arrhythmia classification using deep coded features and LSTM networks, Comput. Methods Programs Biomed 176 (2019) 121–133. [DOI] [PubMed] [Google Scholar]
- [18].Liang X, Li L, Liu Y, Chen D, Wang X, Hu S, Wang J, Zhang H, Sun C, Liu C, ECG_SegNet: An ECG delineation model based on the encoder-decoder structure, Comput. Biol. Med 145 (2022) 105445. [DOI] [PubMed] [Google Scholar]
- [19].Wang D, Qiu L, Zhu W, Dong Y, Zhang H, Chen Y, et al. , Inter-patient ECG characteristic wave detection based on convolutional neural network combined with transformer, Biomed. Signal Process. Control 81 (2023) 104436. [Google Scholar]
- [20].Islam MS, Hasan KF, Sultana S, Uddin S, Quinn JM, Moni MA, et al. , HARDC: A novel ECG-based heartbeat classification method to detect arrhythmia using hierarchical attention based dual structured RNN with dilated CNN, Neural Netw. 162 (2023) 271–287. [DOI] [PubMed] [Google Scholar]
- [21].Xu Y, Liu L, Zhang S, Xiao W, Multilayer extreme learning machine-based unsupervised deep feature representation for heartbeat classification, Soft Comput. 27 (17) (2023) 12353–12366. [Google Scholar]
- [22].Chen Z, Yang D, Cui T, Li D, Liu H, Yang Y, Zhang S, Yang S, Ren T-L, A novel imbalanced dataset mitigation method and ECG classification model based on combined 1D_CBAM-autoencoder and lightweight CNN model, Biomed. Signal Process. Control 87 (2024) 105437. [Google Scholar]
- [23].Zubair M, Woo S, Lim S, Kim D, Deep representation learning with sample generation and augmented attention module for imbalanced ECG classification, IEEE J. Biomed. Health Inf (2023). [DOI] [PubMed] [Google Scholar]
- [24].Tao Y, Xu B, Zhang Y, Refined self-attention transformer model for ECG-based arrhythmia detection, IEEE Trans. Instrum. Meas (2024). [Google Scholar]
- [25].Laguna P, Mark RG, Goldberg A, Moody GB, A database for evaluation of algorithms for measurement of QT and other waveform intervals in the ECG, in: Computers in Cardiology 1997, IEEE, 1997, pp. 673–676. [Google Scholar]
- [26].https://archive.physionet.org/cgi-bin/atm/ATM.
- [27].https://cardio.jmir.org/2023/1/e45137/.
- [28].Laguna P, Jané R, Caminal P, Automatic detection of wave boundaries in multilead ECG signals: Validation with the CSE database, Comput. Biomed. Res 27 (1) (1994) 45–60. [DOI] [PubMed] [Google Scholar]
- [29].Nurmaini S, Umi Partan R, Caesarendra W, Dewi T, Naufal Rahmatullah M, Darmawahyuni A, Bhayyu V, Firdaus F, An automated ECG beat classification system using deep neural networks with an unsupervised feature extraction technique, Appl. Sci 9 (14) (2019) 2921. [Google Scholar]
- [30].Abrishami H, Han C, Zhou X, Campbell M, Czosek R, Supervised ECG interval segmentation using LSTM neural network, in: Proceedings of the International Conference on Bioinformatics & Computational Biology, BIOCOMP, The Steering Committee of The World Congress in Computer Science, Computer …, 2018, pp. 71–77. [Google Scholar]
- [31].Abrishami H, Campbell M, Han C, Czosek R, Zhou X, Semantic ECG interval segmentation using autoencoders, in: Proceedings of the International Conference on Bioinformatics & Computational Biology, BIOCOMP, The Steering Committee of The World Congress in Computer Science, Computer …, 2019, pp. 3–9. [Google Scholar]
- [32].Che C, Zhang P, Zhu M, Qu Y, Jin B, Constrained transformer network for ECG signal processing and arrhythmia classification, BMC Med. Inform. Decis. Mak 21 (1) (2021) 184. [DOI] [PMC free article] [PubMed] [Google Scholar]
- [33].Al Rahhal MM, Al Ajlan N, Bazi Y, Al Hichri H, Rabczuk T, Automatic premature ventricular contractions detection for multi-lead electrocardiogram signal, in: 2018 IEEE International Conference on Electro/Information Technology, EIT, IEEE, 2018, pp. 0169–0173. [Google Scholar]
- [34].Oh SL, Ng EY, San Tan R, Acharya UR, Automated diagnosis of arrhythmia using combination of CNN and LSTM techniques with variable length heart beats, Comput. Biol. Med 102 (2018) 278–287. [DOI] [PubMed] [Google Scholar]
- [35].Şen SY, Özkurt N, ECG arrhythmia classification by using convolutional neural network and spectrogram, in: 2019 Innovations in Intelligent Systems and Applications Conference, ASYU, IEEE, 2019, pp. 1–6. [Google Scholar]
- [36].Chen T-M, Huang C-H, Shih ES, Hu Y-F, Hwang M-J, Detection and classification of cardiac arrhythmias by a challenge-best deep learning neural network model, Iscience 23 (3) (2020). [DOI] [PMC free article] [PubMed] [Google Scholar]
- [37].Ullah A, Anwar SM, Bilal M, Mehmood RM, Classification of arrhythmia by using deep learning with 2-D ECG spectral image representation, Remote Sens. 12 (10) (2020) 1685. [Google Scholar]
- [38].Hajeb-M S, Cascella A, Valentine M, Chon KH, Enhancing the accuracy of shock advisory algorithms in automated external defibrillators during ongoing cardiopulmonary resuscitation using a deep convolutional encoder-decoder filtering model, Expert Syst. Appl 203 (2022) 117499. [Google Scholar]
- [39].Nejad MPS, Kargink V, Hajeb-M S, Hicks D, Valentine M, Chon KH, Enhancing the accuracy of shock advisory algorithms in automated external defibrillators during ongoing cardiopulmonary resuscitation using a cascade of CNNEDs, Comput. Biol. Med 172 (2024) 108180. [DOI] [PubMed] [Google Scholar]