

Abstract
Background
Health Literacy (HL) is an effective determinant of health and health behaviors. The HL for School-Aged Children (HLSAC) scale has five components, and a 10-item was developed by Paakkari, 2016 in the Finnish language to measure the HL levels of adolescents. However, its validity and reliability were not tested among adolescents in the Bengali language. This study aimed to determine the validity and reliability of the HLSAC scale in the Bengali version among adolescents of secondary school children to evaluate their literacy status in Bangladesh.
Methods
A cross-sectional study was conducted among secondary school children in two different schools in Bangladesh. The schools were purposively selected, one from both rural and urban areas. The participants were students graded between 7 and 9 at the time of enrollment. The validity and reliability of the HLSAC scale were checked by confirmatory factor analysis, convergent validity, Cronbach’s alpha, and test–retest reliability.
Results
The mean age of the participants was 13.5 years. The reliability of the HLSAC scale showed that Cronbach’s alpha was 0.759. The confirmatory factor analysis model fit appears robust as the p-value was not significant (p = 0.137), 2 /df 1.263, RMSEA 0.029 and CFI = 0.982. The test–retest reliability of this scale was 0.388 (low). For the convergent validity, the Bengali version of the HLSAC scale was positively correlated with the General Self-Efficacy and Perceived Knowledge scales (r = 0.704, 0.618, respectively; all, p < 0.001).
Conclusion
Our study found that the HLSAC scale, Bengali version is valid and reliable for school-aged adolescents in Bangladesh. This research finding allows for a suitable HLSAC scale to measure the level of HL among adolescents in Bangladesh.
Keywords: Health Literacy, Validity, Reliability, Health Literacy for School-Aged Children (HLSAC) scale, Adolescents
Background
Health literacy (HL) is an individual’s cognitive and social abilities to find, understand, and use information and services to make health-related decisions and actions for themselves and their surroundings [1, 2]. By measuring HL, an individual’s health status and health outcomes can be predicted [3, 4]. It is also considered a key factor for determining the appropriate use of health information and making decisions for promoting a healthy lifestyle [3]. It was found that people with low HL had less understanding and less self-management ability of health which was the main cause of increased hospitalization, hospital expenses and high mortality [5]. According to the International Union for Health Promotion and Education (IUHPE) and the World Health Organization (WHO), HL serves as a health determinant and is a major force in maintaining health equity [6, 7]. Therefore, HL is considered a vital empowerment approach to achieving lifetime sound health and well-being [8, 9].
HL is a valuable and modifiable determinant of health for the benefit of children and adolescents’ present and future health status [8–10]. The United Nations (UN) Convention on the Rights of the Child states that all children must have age-specific health information for a safe and healthy life [11]. The Adolescent period is an effective key time for addressing HL [12]. Therefore, adolescent children are the crucial target population for health education intervention to get the best HL outcome [5, 13, 14]. HL in the adolescent period can aid them in gaining and understanding health information which can bring positive health outcomes and increase quality of life in adulthood [15]. Adolescents with health literacy can access and navigate health information, comprehend health messages, think critically about health claims, and make informed decisions about their health. They are also able to acquire health knowledge and apply it in new situations, communicate about health issues, use health information to improve their health, develop healthy habits, engage in healthy activities in communities, and avoid unnecessary health risks [13, 14, 16].
A study conducted in Germany found that 8.4% had difficulty understanding health information and 22.7% had a low level of health knowledge among adolescents [8]. HL is associated with transition readiness in adolescents and young adults for healthcare utilization [17]. Low levels of HL increase the risk of disease incidence and mortality rates, and less-than-optimal service utilization in Bangladesh [18]. One study conducted in a rural community in Bangladesh using a limited questionnaire concluded the necessity of having a systematic HL program [19].
According to researchers from a prior study, skill-based educational intervention in the school setting with the cooperation of all professional health personnel is particularly important to create long-term sustainable, positive behavioral changes and increase awareness among school-aged adolescents [20]. It also benefits the school by fostering a safe, encouraging environment and a child's favorable academic growth. This will benefit the school adolescents as well as their parents and surrounding people to improve health-related knowledge and prevent diseases, especially lifestyle-related non-communicable diseases (NCDs) in the early stage.
To determine and improve HL precisely, it is imperative to develop and use a valid and reliable HL tool [21, 22]. However, a few brief generic instruments are now available to measure HL among children and adolescents [23]. The Rapid Estimate of Adolescent Literacy in Medicine (REALM-Teen) [24] was developed based on the Rapid Estimate of Adult Literacy in Medicine (REALM) scale and is a visually oriented tool. This scale is simple to administer and highly feasible, with a measurement time of no more than 5 min. However, its measurement dimension is narrow, primarily focusing on cognitive ability while neglecting the assessment of comprehension skills. The Newest Vital Sign (NVS) scale [25] primarily focuses on the subject's performance in a single dimension of health literacy, which may not fully reflect the individual's overall health literacy level. Health Literacy for School-Aged Children (HLSAC) scale is a self-administered tool developed in Finland to measure the level of HL among adolescent school-going children. It includes ten items with five core components: (1) theoretical knowledge, (2) practical knowledge, (3) individual critical thinking, (4) self-awareness, and (5) citizenship [26]. This instrument measures HL comprehensively by considering all three domains including functional, interactive and critical. It considers participants'developmental changes and dependency. For that, it is regarded as appropriate to use school-aged adolescents for quick administration, satisfactory reliability and one-factor validity. However, the 8-item Health Literacy Assessment Tool (HLAT-8) was recommended, for its convergent validity and children and adolescents below 18 years have not been tested yet [23].
There has not been any established validated and reliable scale identified for measuring HL among children and adolescents in Bangladesh. An adequate and accurate measurement of HL is essential for appropriate attention to improve an individual’s capabilities, ultimately leading to changes in the health system [27]. Therefore, it is imperative to develop an HLSAC scale in Bengali version to conduct research on HL among children in Bangladesh. Like other developing countries, Bangladeshi adults do not have sound health. If we can foster school-aged adolescents, they can contribute not only to themselves and their families but also to the community as change agents. Among all the established HL scales, we selected the HLSAC scale as we believe ‘citizenship’ is the most important component for Bangladeshi adolescents. The ‘citizenship’ component refers to aspects of HL that incorporate civic understanding and engagement related to health issues. It encompasses an individual's awareness of rights and responsibilities as a citizen, knowledge of health systems, community awareness, and empowerment to make informed decisions for active participation in their health and community health matters [26]. The purpose of this research was to determine the validity and reliability of a Bengali-translated HLSAC scale among adolescents in secondary school children in Bangladesh.
Methods
Preparation of the Bengali version of the HLSAC scale
-
Translation and back-translation
First, written permission was obtained from Paakkari O, the original author of the HLSAC instrument [25]. Then, the 10-item English version was translated into Bengali by bilingual research team members including two nurse researchers and one psychologist. The Bengali translation was done with an emphasis on semantic equivalence rather than linguistic surface equivalence. The back-translation into English was done by another two bilingual researchers. After that, one native English speaker evaluated the semantic equivalence between the original version and the back-translation and modified the wording in the Bengali version as appropriate; the first revision was made.
-
Pre-test
A preliminary survey of the Bengali-translated version of the HLSAC was conducted to confirm and further revise the appropriateness of the Bengali wording and the ease of completing the questionnaire. For that, 20 students from the same school (rural) of the main study participated. To check the face validity in a rural setting, we administered the questionnaire only among the rural students to understand the local dialect, wording, orders of the items and response times of the participants. We assumed that rural participants had different challenges due to the variability of rural settings compared to urban ones. We wanted to ensure that the tool is sensitive to those specific conditions (e.g., knowledge about study participation, quality of health education, local language (dialect), access to healthcare, and socioeconomic factors). For that, we initially focused on rural setting to refine the tool and then planned to conduct further testing in both rural and urban settings. Pre-testing helped us to determine whether the participants understood the items as well as they could perform the task. The question item’s wording was modified as appropriate.
Main survey
-
Study design
This was a school-based cross-sectional study to test the validity and reliability of the HLSAC scale, Bengali version.
-
Study site
This study was conducted in two secondary schools, one from a rural community and another from an urban area in Bangladesh to obtain the diversification of the samples. The rural school is located in Tongibari Upazila, Munshigonj district and the urban school is located in Gazipur city in Bangladesh. These two schools are run by privately funded organizations/individuals under the Dhaka Education Board within the Bangladesh academic system, these secondary-level schools comprise grades 6 to 10 (ages 11 to 17). There are about 650 rural and 400 urban secondary school students in these two schools, in total of 1050. These two schools were selected purposely for convenience according to the following criteria: 1) schools affiliated with the Bangladesh Education Board, 2) give permission to conduct this study, 3) located in the rural community and urban area, and 4) provide education facilities for both genders (Fig. 1).
-
Study participants
Inclusion criteria- Students who studied in grades 7 to 9 at the time of enrollment.
- Students irrespective of gender.
- Students whose first language was Bengali.
- Students who were willing to participate.
-
Students whose parents or legal guardians agreed to give consent and were willing to participate in the study.Exclusion criteria
- Students with cognitive and mental disorders (teachers excluded those students who were incapable of filling out the questionnaire).
- Students in grades 6 and 10 were excluded after being included in this study to maintain consistency with the inclusion of participants from the same grades in the previous study [26].
-
Sample size calculation
Based on the items in the questionnaires and suggestions from the previous research ideally, at least 200 samples are needed to estimate validity and reliability [28]. Moreover, for factor analysis, it is estimated that at least five cases per variable are needed and a minimum of 300 cases are recommended [29]. Therefore, we decided our sample size was 300. With a 10% dropout, the total estimated sample size was 330 from two different schools. However, due to the community-based study, we approached all the students between Grades 7 and 9 from the two schools for equal participation.
-
Study procedures
At first, the Principal Investigator communicated with the headmasters of both rural and urban schools in August 2023 to conduct the study. After getting permission, the research team visited the schools in September 2023 and explained the purpose and procedures of this research to the headmasters including school teachers and obtained written permissions at the end of October 2023 for data collection from the designated schools. The school teachers set a convenient time for data collection from the school children through survey administration. Before enrolling in the study, assent was obtained from the students and written informed consent from their parents or legal guardians. Data were collected through a survey questionnaire for a two-hour session. The questionnaire was distributed at a time among the 7 th to 9 th-grade children in the school classroom. The test was performed in January, 2024, and after 14 days, a re-test was conducted among the same students in January and February, 2024 for both school students.
Fig. 1.

Study flowchart
Test–retest
The participants were reassessed using the same HLSAC scale two weeks apart, and out of 312, 304 participated in this survey (Fig. 1). The correlation of the total scores from the two measurements was calculated by the Pearson correlation coefficient (r). A test–retest reliability coefficient of less than 0.4 indicates low, 0.4 to 0.75 indicates good and above 0.75 indicates excellent temporal stability [30].
Measurements
-
The Health Literacy Scale for School-Aged Children (HLSAC) scale in Bengali version (10 items),
The HLSAC scale had a four-point Likert scale ranging from 1 to 4 (1 = not at all true, 2 = not quite true, 3 = somewhat true, and 4 = absolutely true). The sum scores of 10 items were calculated from 10 to 40, with a higher score indicating more HL [22].
-
General Self-Efficacy scale (GSE), Bengali version (10 items),
The General Self-Efficacy scale (GSE) had also 10 items, a four-point Likert scale ranging from 1 to 4 (1 = not at all true, 2 = hardly true, 3 = moderately true, and 4 = exactly true). The total score was calculated as the sum of 10 items ranging between 10 and 40 with a higher score indicating more self-efficacy [31].
-
Perceived knowledge to take care of one’s health (2 items) [32],
The Perceived knowledge questionnaire contained physical and mental health components. Each component had a five-point Likert scale ranging from 1 to 5 (1 = have no knowledge, 2 = have very little knowledge, 3 = have little knowledge, 4 = have some knowledge, and 5 = have enough knowledge). The scale was translated by two professional translators from English to Bengali, and then another two translators back-translated the Bengali version to English. A modification was made in wording to make it more comprehensive for conceptual likeness between the English and Bengali versions of Perceived knowledge scales.
We also collected participants'socio-demographic data (age, sex, education in grade level, family household income, father and mother educational level).
Convergent validity
Convergent validity ensures that tests are measured consistently with other validated scales [33]. To examine the convergent validity of the Bengali version of the HLSAC scale, the GSE and Perceived knowledge to take care of one’s health were used. We calculated the correlation coefficient such as Spearman to determine the strength of correlation among the scales HLSAC, GSE and Perceived knowledge scales. A high correlation indicates that the test has strong convergent validity.
Data analysis
To examine the reliability and validity of the questionnaire, the IBM SPSS Statistics version 25.0 and SPSS Amos version 28.0 were used, respectively, in this study for descriptive and factor analysis. Descriptive statistics including mean, standard deviation (SD), missing with skewness and kurtosis for each item were conducted. To understand the distribution of data, we performed a normality test. Skewness of data was considered when the value between −1 and −0.5 or between + 0.5 and + 1 was considered moderately skewed and less than −1 or greater than + 1 was considered highly skewed. Kurtosis was considered as less than −2 and more than + 2. To confirm the validity (structure of factors) of the HLSAC scale, a confirmatory factor analysis (CFA) was conducted. In CFA, a high factor loading indicates the factor strongly influences the variables. The value of factors loading below 0.32 is considered poor, ≥ 0.45 is fair, ≥ 0.55 is good, ≥ 0.63 is very good, and above 0.71 is considered excellent [34]. To observe the model fitness to assess the relationship between observed variables and the theoretical model (here, the HLSAC), the cutoff value of chi-square/degree of freedom (2/df) was considered ≤ 2 as a good fit, ≤ 3 as acceptable. We considered the root mean square error of approximation (RMSEA) (≤ 0.05 as a good fit, ≤ 0.10 as acceptable) and for standardized root means square residual (SRMS) (≤ 0.05 as good fit, ≤ 0.10 as acceptable). For the comparative fit index (CFI), goodness of fit index (GFI), normed fit index (NFI), relative fit index (RFI), incremental fit index (IFI) and the Tucker- Lewis index (TLI), we considered the value of ≥ 0.95 as a good fit and ≥ 0.90 as acceptable [35]. Likewise, convergent validity was tested to see the correlation (r) among the HLSAC, GSE scale, and Perceived knowledge, Bengali version to take care of one’s health by Spearman’s correlation test. For the correlation analysis, the significance level of the p-value was set to 1%. To estimate internal consistency of the components of different scales, reliability was tested for an adequate Cronbach’s coefficient alpha. A reliability coefficient of ≥ 0.7 score was considered good for this study [36]. We also checked the measurement invariance of the scale across different groups by CFA. After getting lack of invariance of the scale, we further conducted analysis of variance (ANOVA) and t-test to explore the background differences among the groups.
Results
Sociodemographic characteristics of participants
Out of a total of 850 school students, 312 participated (36.7%) and completed questionnaires from two different schools; 96 from an urban school and 216 from a rural school. A description of the sample characteristics is in Table 1.
Table 1.
Sociodemographic characteristics of the study participants (n = 312)
| Variables | N | (%) |
|---|---|---|
| Age (years) (mean ± SD) | 13.51 ± 1.25 | |
| 11 | 9 | 2.9 |
| 12 | 63 | 20.2 |
| 13 | 85 | 27.2 |
| 14 | 95 | 30.4 |
| 15 | 42 | 13.5 |
| 16 | 12 | 3.8 |
| 17 | 6 | 1.9 |
| Sex | ||
| Male | 53 | 17.0 |
| Female | 259 | 83.0 |
| Religion | ||
| Muslim | 282 | 90.4 |
| Hindu | 30 | 9.6 |
| Education (grade) | ||
| 7 | 112 | 35.9 |
| 8 | 115 | 36.9 |
| 9 | 85 | 27.2 |
| Mother’s education | ||
| Primary not completed | 37 | 11.9 |
| Primary completeda | 104 | 33.3 |
| Secondary level completedb | 95 | 30.4 |
| Higher secondary completedc | 54 | 17.3 |
| Graduate level completed or more | 22 | 7.1 |
| Father’s education | ||
| Primary not completed | 63 | 20.2 |
| Primary completeda | 110 | 35.3 |
| Secondary level completedb | 59 | 18.9 |
| Higher secondary completedc | 43 | 13.8 |
| Graduate level completed or more | 37 | 11.9 |
| Number of family members | ||
| 3 | 38 | 12.2 |
| 4 | 121 | 38.8 |
| 5 | 99 | 31.7 |
| > 5 | 54 | 17.3 |
| Family monthly income (BDT) | ||
| Do not know | 197 | 63.1 |
| < 10,000 | 22 | 7.1 |
| 10,000 to 20,000 | 43 | 13.8 |
| > 20,000 | 50 | 16.0 |
| Main earning occupation | ||
| Labor | 29 | 9.3 |
| Unemployed | 45 | 14.4 |
| Farmer | 82 | 26.3 |
| Business | 97 | 31.1 |
| Service holder | 59 | 18.9 |
| History of receiving health education | ||
| Yes | 135 | 43.3 |
| No | 177 | 56.7 |
| Area | ||
| Rural | 216 | 69.2 |
| Urban | 96 | 30.8 |
a5 years formal education
b10 years formal education
c12 years formal education
Distribution
We analyzed the 10-item of the HLSAC scale. We present the total, mean, SD, statistics and standard error (SE) of skewness and kurtosis of each item. We examined the assumption of normality and found data were not normally distributed and skewness and kurtosis were significant. The mean score of 10 items ranged from 2.61 to 3.44 and the minimum score was 1 and the maximum was 4 (Table 2).
Table 2.
Description of item analysis of the HLSAC scale
| Item | N | Mean | SD | Skewness | SE | Kurtosis | SE |
|---|---|---|---|---|---|---|---|
| 1. I have good information about health | 312 | 2.82 | 0.54 | −0.98 | 0.14 | 2.07 | 0.28 |
| 2. When necessary, I am able to give ideas on how to improve health in my immediate surroundings (e.g., a nearby place or area, family, friends) | 312 | 2.75 | 0.91 | −0.26 | 0.14 | −0.74 | 0.28 |
| 3. I can compare health-related information from different sources | 312 | 2.61 | 0.92 | −0.14 | 0.14 | −0.79 | 0.28 |
| 4. I can follow the instructions given to me by healthcare personnel (e.g., nurse, doctor) | 312 | 3.44 | 0.85 | −1.53 | 0.14 | 1.57 | 0.28 |
| 5. I can easily give examples of things that promote health | 312 | 3.03 | 0.85 | −0.70 | 0.14 | 0.02 | 0.28 |
| 6. I can judge how my own actions affect the surrounding natural environment | 312 | 3.22 | 0.74 | −0.56 | 0.14 | −0.33 | 0.28 |
| 7. When necessary, I find health-related information that is easy for me to understand | 312 | 2.87 | 0.98 | −0.43 | 0.14 | −0.85 | 0.28 |
| 8. I can judge how my behaviour affects my health | 312 | 2.89 | 0.85 | −0.45 | 0.14 | −0.38 | 0.28 |
| 9. I can usually figure out if some health-related information is right or wrong | 312 | 2.77 | 0.92 | −0.36 | 0.14 | −0.68 | 0.28 |
| 10. I can give reasons for the choices I make regarding my health | 312 | 3.25 | 1.00 | −1.08 | 0.14 | −0.09 | 0.28 |
SD Standard Deviation, SE Standard Error
Factor validity (construct validity)
Confirmatory factor analysis (CFA)
As the HLSAC questionnaire has a well-established theoretical framework with predefined constructs and validated in previous research, for that, we conducted CFA to understand whether the predefined structure aligns with the actual data. The original 10 items HLSAC and 1-dimensional solution of the HLSAC scale revealed the model structure for estimating the statistical relationships between HLSAC and individual items. Table 3 shows the results of the indices. Two models were developed: one for 10-items (Model 1) and another 9-items which excluded item 6 (Model 2). We found a robust model fit as the p-values for Model 1 and Model 2 were not significant (p = 0.137 and 0.151, respectively). Since the p-values were > 0.05, the difference between the observed data (Figs. 2 and 3) and the theoretical model is not significant, suggesting a good fit. Moreover, for Models 1 and 2, the value (1.263 and 1.279) of 2/df showed good fit (≤ 2), RMSEA 0.029 and 0.030 good fit (≤ 0.05), SRMR = 0.028 and 0.028 (≤ 0.05 as good fit), CFI = 0.982 and 0.985 (≥ 0.95 as good fit), GFI = 0.973 and 0.976 (≥ 0.95 as good fit), NFI = 0.920 and 0.936 (≥ 0.90 as acceptable), RFI = 0.897 and 0.914 (≥ 0.90 as acceptable), IFI = 0.982 and 0.985 (≥ 0.95 as good fit) and TLI = 0.977 and 0.980 (≥ 0.95 as good fit). However, in Model 1, the factor loading HL question (HLQ) 6 was 0.1 (< 0.3 is not ideal) (Fig. 2). Therefore, after removing HLQ6, a second CFA was conducted, resulting in Model 2 (Fig. 3). We found the p-value was still not significant (p = 0.151) and higher than Model 1.
Table 3.
Confirmatory factor analysis (CFA) of the HLSAC scale. Model fit indices
| Fit Measure | Model 1 (10 items) | Model 2 (9 items; exclude item 6) |
|---|---|---|
| χ2 | 44.203 | 34.541 |
| P value | 0.137 | 0.151 |
| 2/df | 1.263 | 1.279 |
| RMSEA | 0.029 | 0.030 |
| SRMR | 0.028 | 0.028 |
| CFI | 0.982 | 0.985 |
| GFI | 0.973 | 0.976 |
| NFI | 0.920 | 0.936 |
| RFI | 0.897 | 0.914 |
| IFI | 0.982 | 0.985 |
| TLI | 0.977 | 0.980 |
χ2 chi-square, df degrees of freedom, RMSEA Root mean square error of approximation, SRMR Standardized root mean square residual, CFI Comparative fit index, GFI Goodness of fit index, NFI Normed fit index, RFI Relative fit index, IFI Incremental fit index, TLI Tucker-Lewis index
Fig. 2.
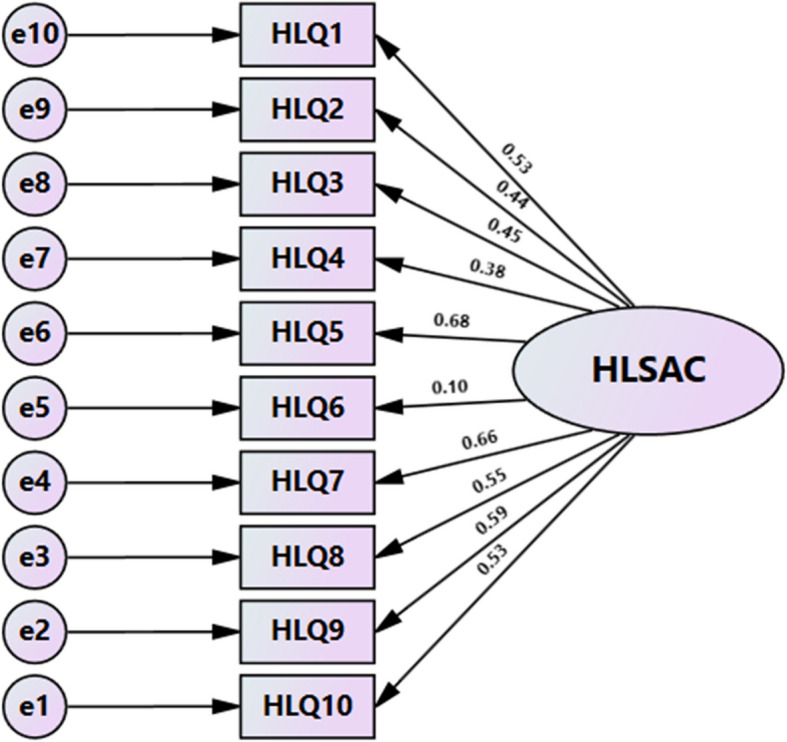
Confirmatory factor analysis of HLSAC scale among adolescents (Model 1). Note: χ2 = 44.203, P = 0.137, df = 35, χ.2/df = 1.263, RMSEA = 0.029, RMR = 0.028, GFI = 0.973, NFI = 0.920, RFI = 0.897, IFI = 0.982, TLI = 0.977, CFI = 0.982
Fig. 3.
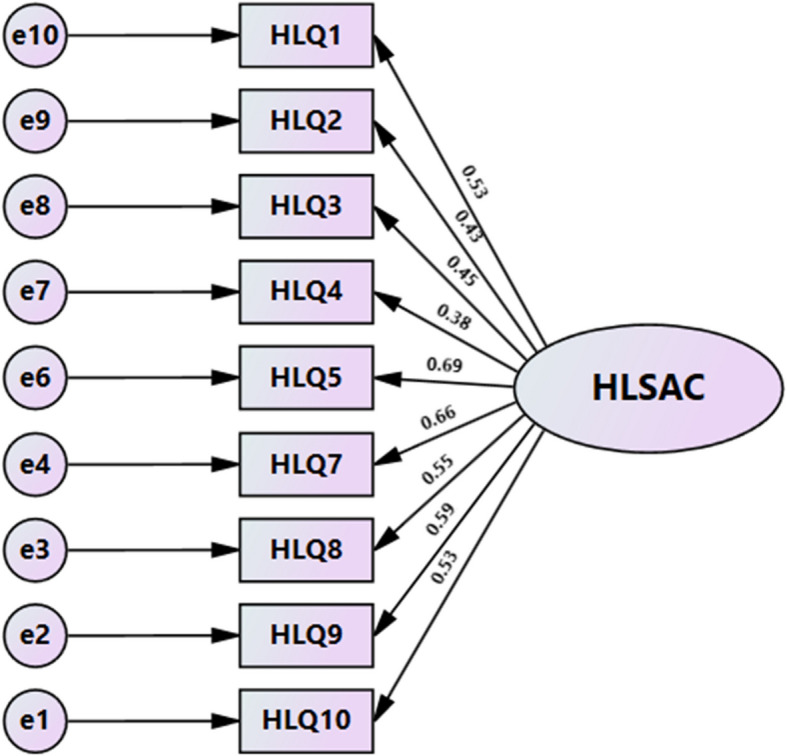
Confirmatory factor analysis of HLSAC scale among adolescents (Model 2). Note: χ2 = 34.541, P = 0.151, df = 27, χ.2/df = 1.279, RMSEA = 0.030, RMR = 0.028, GFI = 0.976, NFI = 0.936, RFI = 0.914, IFI = 0.985, TLI = 0.980, CFI = 0.985
We performed Spearman’s correlation coefficient to measure the associations among the scales and found significant (p < 0.001) positive correlations between HLSAC-10, HLSAC-9 (excluded HL scale item 6), GSE and Perceived knowledge (Table 4).
Table 4.
Convergent validity of the HLSAC scale
| Construct | Mean | SD | Cronbach’s alpha | Spearman’s correlation coefficient | |||
|---|---|---|---|---|---|---|---|
| HLSAC-10 | HLSAC-9 | GSE | Perceived knowledge | ||||
| HLSAC-10 | 2.96 | 0.486 | 0.759 | 1 | 0.833* | 0.704* | 0.618* |
| HLSAC-9 | 2.89 | 0.593 | 0.776 | 0.833* | 1 | 0.574* | 0.540* |
| GSE | 3.04 | 0.481 | 0.728 | 0.704* | 0.574* | 1 | 0.570* |
| Perceived knowledge | 3.99 | 0.777 | 0.604 | 0.618* | 0.540* | 0.570* | 1 |
HLSAC-10 Health Literacy for School-Aged Children 10-item, HLSAC-9 Health Literacy for School-Aged Children 9-item, GSE General Self Efficacy, SD Standard deviation
*Significant at <0.001 level
Reliability
The reliability of the HLSAC-10 and HLSAC-9 scales showed that Cronbach’s alpha were 0.759 and 0.776, respectively. The inter-item correlation values range between 0.117 and 0.371 for both HLSAC-10 and HLSAC-9 and the item means were 2.96 and 2.89, respectively. The HLSAC scale of 10 and 9 items was positively correlated with the General Self-Efficacy and Perceived Knowledge scales (r = 0.704, 0.618, and 0.574, 0.540, respectively; all, p < 0.001).
Test–retest
A total of 304 participants completed the retest reliability assessment. The correlation coefficient (r) of test–retest reliability of this scale was 0.388 and 0.375 (all, p < 0.01) for HLSAC 10 and 9 items, respectively.
Measurement invariance
In our study, we conducted measurement invariances by CFA ensuring that the HLSAC scale of 10 and 9 items measures the same construct across different groups (sex, location, number of family members, family monthly income and main earning occupation). We observed that the HLSAC scale had a lack of invariances regarding sex (female vs. male; ΔCFI = 0.083 and 0.105), location (rural vs. urban; ΔCFI = 0.074 and 0.082) and main earning occupation (ΔCFI = 0.016 and 0.017) for both 10 and 9 items, respectively and the number of family members (ΔCFI = 0.013) for 9 items (Table 5).
Table 5.
Measurement of invariance across different groups for the HLSAC scale 10 and 9 items
| Model | HLSAC-10 | HLSAC-9 | ||||||||
|---|---|---|---|---|---|---|---|---|---|---|
| 2 /df | CFI | TLI | RMSEA | ΔCFI | 2 /df | CFI | TLI | RMSEA | ΔCFI | |
| Sex (female/male) | ||||||||||
| Unconstrained | 1.543 | 0.936 | 0.917 | 0.042 | - | 1.520 | 0.952 | 0.936 | 0.041 | - |
| Measurement weights | 2.239 | 0.853 | 0.812 | 0.063 | 0.083 | 2.434 | 0.847 | 0.823 | 0.068 | 0.105 |
| Location (rural/urban) | ||||||||||
| Unconstrained | 1.715 | 0.913 | 0.888 | 0.048 | - | 1.488 | 0.952 | 0.936 | 0.040 | - |
| Measurement weights | 2.178 | 0.839 | 0.816 | 0.062 | 0.074 | 2.158 | 0.870 | 0.849 | 0.061 | 0.082 |
| Number of family members | ||||||||||
| Unconstrained | 1.369 | 0.870 | 0.883 | 0.035 | - | 1.389 | 0.886 | 0.899 | 0.036 | - |
| Measurement weights | 1.386 | 0.858 | 0.877 | 0.035 | 0.006 | 1.415 | 0.873 | 0.892 | 0.037 | 0.013 |
| Family monthly income (BDT) | ||||||||||
| Unconstrained | 1.616 | 0.780 | 0.802 | 0.045 | - | 1.544 | 0.832 | 0.851 | 0.042 | - |
| Measurement weights | 1.604 | 0.775 | 0.806 | 0.044 | 0.005 | 1.534 | 0.827 | 0.853 | 0.042 | 0.005 |
| Main earning occupation | ||||||||||
| Unconstrained | 1.445 | 0.799 | 0.829 | 0.038 | - | 1.354 | 0.862 | 0.885 | 0.034 | - |
| Measurement weights | 1.465 | 0.783 | 0.822 | 0.039 | 0.016 | 1.383 | 0.845 | 0.876 | 0.035 | 0.017 |
△CFI<0.01 means that the scale has the same factor structure across different groups
We compared scores among different groups for the HLSAC scale 10 and 9 items and found significant differences in students'grade, parents'education, family income and history of receiving health education (Table 6).
Table 6.
Comparison of scores across different groups for the HLSAC scale 10 and 9 items
| Variables | HLSAC-10 (total score range: 10–40) | HLSAC-9 (total score range: 9–36) | ||||
|---|---|---|---|---|---|---|
| Score (M ± SD) | F / t | p- value | Score (M ± SD) | F / t | p- value | |
| Age (years) | 1.449a | 0.196 | 1.406a | 0.212 | ||
| 11 | 29.33 ± 2.739 | 26.44 ± 2.603 | ||||
| 12 | 30.10 ± 3.942 | 26.87 ± 3.770 | ||||
| 13 | 30.49 ± 5.168 | 27.26 ± 5.123 | ||||
| 14 | 29.22 ± 5.384 | 26.01 ± 5.305 | ||||
| 15 | 28.05 ± 4.515 | 24.90 ± 4.131 | ||||
| 16 | 30.25 ± 4.434 | 26.83 ± 4.239 | ||||
| 17 | 29.83 ± 4.622 | 26.17 ± 4.446 | ||||
| Sex | 0.558b | 0.577 | −0.045 b | 0.964 | ||
| Male | 29.98 ± 4.466 | 26.40 ± 4.448 | ||||
| Female | 29.57 ± 4.945 | 26.43 ± 4.798 | ||||
| Religion | 1.195b | 0.233 | 0.880b | 0.380 | ||
| Muslim | 29.75 ± 4.872 | 26.50 ± 4.755 | ||||
| Hindu | 28.63 ± 4.731 | 25.70 ± 4.535 | ||||
| Education (grade) | 17.626a | < 0.001 | 16.869a | < 0.001 | ||
| 7 | 30.49 ± 3.313 | 27.33 ± 3.206 | ||||
| 8 | 30.69 ± 5.418 | 27.33 ± 5.416 | ||||
| 9 | 27.11 ± 4.923 | 24.00 ± 4.627 | ||||
| Mother’s education | 5.529a | < 0.001 | 5.824a | < 0.001 | ||
| Primary not completed | 29.62 ± 4.704 | 26.22 ± 4.744 | ||||
| Primary completed | 29.36 ± 4.736 | 26.07 ± 4.597 | ||||
| Secondary level completed | 28.43 ± 5.367 | 25.26 ± 5.229 | ||||
| Higher secondary completed | 30.94 ± 3.683 | 28.04 ± 3.319 | ||||
| Graduate level completed or more | 33.05 ± 3.946 | 29.50 ± 3.997 | ||||
| Father’s education | 2.697a | 0.031 | 2.858a | 0.024 | ||
| Primary not completed | 28.60 ± 5.321 | 25.25 ± 5.252 | ||||
| Primary completed | 29.42 ± 5.139 | 26.20 ± 4.971 | ||||
| Secondary level completed | 29.37 ± 4.374 | 26.31 ± 4.236 | ||||
| Higher secondary completed | 30.37 ± 4.271 | 27.28 ± 4.177 | ||||
| Graduate level completed or more | 31.65 ± 4.063 | 28.27 ± 3.878 | ||||
| Number of family members | 1.210a | 0.306 | 1.390a | 0.246 | ||
| 3 | 28.82 ± 4.747 | 25.39 ± 4.559 | ||||
| 4 | 30.25 ± 4.460 | 27.02 ± 4,347 | ||||
| 5 | 29.25 ± 5.209 | 26.10 ± 5.072 | ||||
| > 5 | 29.57 ± 5.120 | 26.41 ± 4.985 | ||||
| Family monthly income (BDT) | 3.309a | 0.020 | 3.414a | 0.018 | ||
| Do not know | 29.23 ± 5.220 | 26.07 ± 5.054 | ||||
| < 10,000 | 29.45 ± 4.251 | 26.14 ± 4.302 | ||||
| 10,000 to 20,000 | 29.33 ± 4.167 | 25.93 ± 4.102 | ||||
| > 20,000 | 31.60 ± 3.709 | 28.36 ± 3.618 | ||||
| Main earning occupation | 0.995a | 0.410 | 0.844a | 0.498 | ||
| Labor | 29.07 ± 5.291 | 25.76 ± 5.076 | ||||
| Unemployed | 29.00 ± 5.347 | 25.76 ± 5.301 | ||||
| Farmer | 29.29 ± 5.112 | 26.15 ± 4.897 | ||||
| Business | 30.40 ± 4.107 | 27.00 ± 4.005 | ||||
| Service holder | 29.64 ± 5.054 | 26.69 ± 5.004 | ||||
| History of receiving health education | 4.880b | < 0.001 | 5.753b | < 0.001 | ||
| Yes | 31.13 ± 4.784 | 28.10 ± 4.534 | ||||
| No | 28.51 ± 4.623 | 25.14 ± 4.486 | ||||
| Area | −0.289 b | 0.773 | 0.249b | 0.804 | ||
| Rural | 29.59 ± 5.177 | 26.47 ± 5.042 | ||||
| Urban | 29.76 ± 4.090 | 26.32 ± 3.975 | ||||
a: Anova; b: t test, p<0.05 significant
M: mean, SD: Standard deviation, F/t: Anova/t-test
Discussion
We demonstrated the validity and reliability of a Bengali version of the HLSAC scale among adolescents in secondary school children in Bangladesh. We observed the 10-item HLSAC scale Bengali version was significantly valid and reliable for this population group.
Based on the original scale with 10 items and 1-dimension, confirmatory factor analysis was used to validate the Bengali version of the HLSAC scale. The results of Model 1 indicated that all fit indices met the requirements, suggesting a good fit of the scale. However, the factor loading of HLQ6 was less than 0.3, which is not ideal. Therefore, HLQ6 was deleted, and a second confirmatory factor analysis was conducted. The results showed that the 9-item, 1-dimension model had a better fit than Model 1. A similar finding was observed that HLQ6 had the poorest individual fit in adults [37]. One study was conducted among Norwegian school-aged adolescents and found that the original 10-item 1-dimensional solution had a poor fit. They observed that the HLSAC scale consisting of 1, 3, 6, 7, 9 and 10 items were statistically valid and reliable and suggested this shorter version HLSAC-6 scale for measuring HL for those adolescents [32]. Another large study was conducted in seven European countries with an HLSAC-5 (1, 3, 6, 7 and 10) instrument extracted from the original 10-item HLSAC scale and found that this brief scale was valid and reliable among the adolescents of those countries (Finland, Estonia, Poland, Czechia, Belgium, Slovakia and Germany) [38]. However, the HLSAC scale with the original 10-item was found suitable for German children and adolescents in the German version [39]. Therefore, modifications and use of the instrument indicate the need for further investigation of the HLSAC scale in diverse settings and different age groups. We observed a robust model fit (p-values not significant) for HLSAC-10 and 9, we can use both for our adolescents. As HLQ 6 had less factor loading value [0.1 (< 0.3 is not ideal)], therefore, HLSAC-10 needs to be used with caution.
Convergent validity mainly reflects the correlation between the measurement tool and other related measurement tools. In this study, GSE and Perceived Knowledge were used as convergent indicators. The results showed that the Bengali version of the HLSAC-10 and HLSAC-9 scales were positively correlated with both GSE and Perceived Knowledge (p < 0.05), indicating that the Bengali version of the HLSAC scale has good convergent validity.
Internal consistency reflects the internal correlation of the measurement tool. The results of this study showed that the Cronbach's alpha of the Bengali version of the HLSAC-10 scale was 0.759 and HLSAC-9 was 0.776, indicating that the Bengali version of the HLSAC scale has good internal consistency. Test–retest reliability reflects the stability and consistency of the measurement tool over time. In this study, the test–retest reliability for HLSAC 10 and 9 were 0.388 and 0.375, respectively, which are at a low level. The responses of adolescents differ significantly between the test and re-test indicating that the scale contains unclear questions, ambiguity in responses and/or external factors (participants'sociodemographic and cultural). As we could not yield consistent results, it may not be reliable enough for researchers and clinical practice to draw a meaningful conclusion. We found that the HLSAC scale had a lack of invariances across sex, location and main earning occupation for both 10 and 9 items, and the number of family members for 9 items; indicated inconsistencies in the measurement tool itself. The invariances were achieved for family monthly income for both the HLSAC-10 and 9, and the number of family members for only the HLSAC-9. We found that some sociodemographic factors significantly influenced the scores of the HLSAC-10 and 9 scales. We did not stratify our samples based on sociodemographic characteristics. These diverse characteristics might influence the lack of invariance of our results. It is needed to review the items to evaluate the cultural biases, unclear concepts and other issues that may also affect the response and interpretation of different groups.
Strengths
As this is the first study to establish a valid and reliable HLSAC scale in Bengali version among school-aged adolescents in Bangladesh, it can be widely used to evaluate the HL in this population. The findings of this study will provide valuable insights for further development of various HL instruments.
Limitations
This study has certain limitations. Although the scale is developed for adolescents, we included students from 7 to 9 grades; therefore, this did not cover other adolescents in the excluded grades. In this study, we included all the school-going students, while this is true of only 52.4% of the general population in the age group of 15–19 years in Bangladesh [40]. Hence, we recommend future studies with large sample sizes and including other upper and lower grade school students which would allow greater consistency and minimize biases. Our test–retest reliability has shown insufficient consistency among adolescents. Further longitudinal studies with different settings are needed for testing and modification to establish a suitable HL scale in the Bengali language. We observed lack of measurement invariance across different groups based on some sociodemographic characteristics. With these limitations, educators and practitioners need to emphasize health education involving family and community to get a suitable HLSAC scale in this population.
Conclusions
To assess the HL among adolescents, a valid and reliable HLSAC scale is essential for school-aged children in Bangladesh with the Bengali language for better understanding. To the best of our knowledge, this is the first study that used the HLSAC scale in the Bengali version for measuring HL among school-aged adolescents in Bangladesh. We found the 10-item and 1-dimension Bengali version of the HLSAC scale was a good fit; however, the 9-item (without HLQ6), the 1-dimension model was found to have a better fit than the 10-item for these school-aged adolescents. The scale demonstrated low test–retest reliability in terms of the overall measure. Since there is currently no valid and reliable Bengali version of the HLSAC scale available to measure HL, this research will significantly impact the assessment of HL among adolescents. The measurement invariances were not achieved regarding sex, location and main earning occupation. Further investigation with a larger sample size, stratifying different sociodemographic factors and using different settings can identify the predictors of the Bengali version of the HLSAC scale, and whether the 10-item or 9-item is suitable for this age group. More age-specific HL scales will guarantee a high probability to test and measure HL in different age groups including adults in the Bengali version for the population of Bangladesh.
Acknowledgements
We would like to express our sincere gratitude to the headmasters and other teachers for their generous permission to conduct this study at their schools and the children who participated and gave their precious time for this study. We also thank all the research staff for their contribution to collecting data and preparing for analysis.
Abbreviations
- CFA
Confirmatory factor analysis
- CFI
Comparative fit index
- Df
Degrees of freedom
- GFI
Goodness of fit index
- GSE
General Self-Efficacy scale
- HL
Health Literacy
- HLAT
Health Literacy Assessment Tool
- HLQ
Health Literacy Questionnaire
- HLSAC
Health Literacy for School-Aged Children
- IFI
Incremental fit index
- NFI
Normed fit index
- REALM
Rapid Estimate of Adult Literacy in Medicine
- RFI
Relative fit index
- RMSEA
Root mean square error of approximation
- SRMR
Standardized root mean square residual
- TLI
Tucker-Lewis index
Authors’ contributions
PRB conceptualization, data collection, prepared data for analysis and drafted the manuscript. KATMEH data analysis, drafted the manuscript and project administration. GH data analysis. AOB conceptualization and data analysis. MM conceptualization, and project administration, drafted the manuscript, and critically reviewed the manuscript. All authors provided input to improve the manuscript, read and approved the final version for submission.
Funding
This work was supported by JSPS KAKENHI (Grant Number JP 21H03250). The funder had no control over the interpretation, writing, or publication of this work.
Data availability
The data presented in this study are available upon request from the corresponding author. The data are not publicly available due to privacy restrictions.
Declarations
Ethics approval and consent to participate
This study was approved by the Institutional Review Board/Ethics Review Committee (IRB/ERC) of North South University, Bangladesh (reference number: 2023/OR-NSU/IRB/0707). This study is being conducted according to the Declaration of Helsinki.
Written informed consent was obtained from all participants, and parents or legal guardians of any participant under the age of 16 to participate in this study. Confidentiality of individual information was maintained at all steps of the research.
Consent for publication
Not applicable.
Competing interests
The authors declare no competing interests.
Footnotes
Publisher’s Note
Springer Nature remains neutral with regard to jurisdictional claims in published maps and institutional affiliations.
References
- 1.World Health Organization (WHO) 2021. WHO health promotion glossary of terms 2021. Geneva. Available from: https://www.who.int/publications/i/item/9789240038349 (accessed on January 14, 2024).
- 2.Center for Disease Control and Prevention 2023. What is health literacy? Atlanta, Georgia. Available from: https://www.cdc.gov/healthliteracy/learn/index.html (accessed on June 24, 2024).
- 3.Sørensen K, Van den Broucke S, Pelikan JM, Fullam J, Doyle G, Slonska Z, Kondilis B, Stoffels V, Osborne RH, Brand H; HLS-EU Consortium. Measuring health literacy in populations: illuminating the design and development process of the European Health Literacy Survey Questionnaire (HLS-EU-Q). BMC Public Health. 2013 Oct 10;13:948. 10.1186/1471-2458-13-948. [DOI] [PMC free article] [PubMed]
- 4.Baker DW. The meaning and the measure of health literacy. J Gen Intern Med. 2006;21:878–83. 10.1111/j.1525-1497.2006.00540.x. [DOI] [PMC free article] [PubMed] [Google Scholar]
- 5.Wu JR, Holmes GM, DeWalt DA, Macabasco-O’Connell A, Bibbins-Domingo K, Ruo B, Baker DW, Schillinger D, Weinberger M, Broucksou KA, Erman B, Jones CD, Cene CW, Pignone M. Low literacy is associated with increased risk of hospitalization and death among individuals with heart failure. J Gen Intern Med. 2013Sep;28(9):1174–80. 10.1007/s11606-013-2394-4. [DOI] [PMC free article] [PubMed] [Google Scholar]
- 6.International Union for Health Promotion and Education. IUHPE Position statement on health literacy: a practical vision for a health literate world. Paris: IUHPE; 2018. Available from: https://www.researchgate.net/publication/329467998_IUHPE_Position_Statement_on_Health_Literacy_a_practical_vision_for_a_health_literate_world (accessed on January 22, 2024).
- 7.World Health Organization (WHO) 2024. Shanghai declaration on promoting health in the 2030 agenda for sustainable development. 9th Global Conference on Health Pormotion, Shanghai, 21–24 November 2016. Available from: https://www.who.int/publications/i/item/WHO-NMH-PND-17.5 (accessed on June 24, 2024).
- 8.Fleary SA, Joseph P, Pappagianopoulos JE. Adolescent health literacy and health behaviors: A systematic review. J Adolesc. 2018;62:116–27. 10.1016/j.adolescence.2017.11.010. [DOI] [PubMed] [Google Scholar]
- 9.World Health Organization (WHO), Regional Office for Europe. Health literacy in the context of health, well-being and learning outcomes the case of children and adolescents in schools: The case of children and adolescents in schools, License: CC BY-NC-SA 30 IGO. Geneva: WHO; 2020.
- 10.Simonsen N, Wackström N, Roos E, Suominen S, Välimaa R, Tynjälä J, Paakkari L. Does health literacy explain regional health disparities among adolescents in Finland? Health Promot Int. 2021Dec 23;36(6):1727–38. 10.1093/heapro/daaa122. [DOI] [PubMed] [Google Scholar]
- 11.United Nations Children’s Fund UK. The United Nations convention on the rights of the child. 1989. https://www.ohchr.org/en/professionalinterest/pages/crc.aspx (accessed 5 January 2024).
- 12.Sansom-Daly UM, Lin M, Robertson EG, Wakefield CE, McGill BC, Girgis A, Cohn RJ. Health literacy in adolescents and young adults: an updated review. J Adolesc Young Adult Oncol. 2016Jun;5(2):106–18. 10.1089/jayao.2015.0059. [DOI] [PubMed] [Google Scholar]
- 13.Okan O, Pakkari L, Dadaczynski K. Health literacy in schools: state of the art. Finland and Germany, 2020. Available from: https://www.researchgate.net/publication/344202587_Health_literacy_in_schools_State_of_the_art (accessed January 30, 2024).
- 14.Chu-Ko F, Chong ML, Chung CJ, Chang CC, Liu HY, Huang LC. Exploring the factors related to adolescent health literacy, health-promoting lifestyle profile, and health status. BMC Public Health. 2021Dec 1;21(1):2196. 10.1186/s12889-021-12239-w. [DOI] [PMC free article] [PubMed] [Google Scholar]
- 15.Manganello JA. Health literacy and adolescents: a framework and agenda for future research. Health Educ Res. 2008;23(5):840–7. 10.1093/her/cym069. [DOI] [PubMed] [Google Scholar]
- 16.Paakkari L, Inchley J, Schulz A, Weber MW, Okan O. Addressing health literacy in schools in the European region. Public Health Panor. 2019; 5(2–3): 186–90. https://apps.who.int/iris/handle/10665/327055.
- 17.Rague JT, Kim S, Hirsch JA, Meyer T, Rosoklija I, Larson JE, Swaroop VT, Bowman RM, Bowen DK, Cheng EY, Gordon EJ, Chu DI, Isakova T, Yerkes EB, Chu DI. Assessment of health literacy and self-reported readiness for transition to adult care among adolescents and young adults with spina bifida. JAMA Netw Open. 2021;4(9): e2127034. 10.1001/jamanetworkopen.2021.27034. [DOI] [PMC free article] [PubMed] [Google Scholar]
- 18.Islam MK, Nasrin N, Jaber A, Hossain MT. Association between health literacy and BMI: a cross-sectional study of suburban adult population in Bangladesh. Journal of Population and Social Studies (JPSS). 2022; 30: 288–308. 10.25133/JPSSv302022.018.
- 19.Das S, Mia MN, Hanifi SMA, Hoque S, Bhuiya A. Health literacy in a community with low levels of education: findings from Chakaria, a rural area of Bangladesh. BMC Public Health. 2017; 17(1). 10.1186/s12889-017-4097-y. [DOI] [PMC free article] [PubMed]
- 20.Furukawa Y, Fumihiko Y, Maruf RI, Nishikitani M, Kikuchi K, Ahmed A, Nakashima N. School-based educational intervention to improve adolescents’s oral health-related behaviors in rural Bangladesh. South East Asia J. Public Heal. 2018; 7(2): 27–33. Available from: 10.3329/seajph.v7i2.38853.
- 21.Bröder J, Okan O, Bauer U, Bruland D, Schlupp S, Bollweg TM, Saboga-Nunes L, Bond E, Sørensen K, Bitzer EM, Jordan S, Domanska O, Firnges C, Carvalho GS, Bittlingmayer UH, Levin-Zamir D, Pelikan J, Sahrai D, Lenz A, Wahl P, Thomas M, Kessl F, Pinheiro P. Health literacy in childhood and youth: a systematic review of definitions and models. BMC Public Health. 2017;17(1):361. 10.1186/s12889-017-4267-y. Erratum.In:BMCPublicHealth.2017;17(1):419.doi:10.1186/s12889-017-4365-x. [DOI] [PMC free article] [PubMed] [Google Scholar]
- 22.Sørensen K, Van den Broucke S, Fullam J, Doyle G, Pelikan J, Slonska Z, Brand H; (HLS-EU) Consortium Health Literacy Project European. Health literacy and public health: a systematic review and integration of definitions and models. BMC Public Health. 2012;12:80. 10.1186/1471-2458-12-80. [DOI] [PMC free article] [PubMed]
- 23.Guo S, Armstrong R, Waters E, Sathish T, Alif SM, Browne GR, Yu X. Quality of health literacy instruments used in children and adolescents: a systematic review. BMJ Open. 2018;8(6): e020080. 10.1136/bmjopen-2017-020080. [DOI] [PMC free article] [PubMed] [Google Scholar]
- 24.Davis TC, Wolf MS, Arnold CL, Byrd RS, Long SW, Springer T, Kennen E, Bocchini JA. Development and validation of the Rapid Estimate of Adolescent Literacy in Medicine (REALM-Teen): a tool to screen adolescents for below-grade reading in health care settings. Pediatrics. 2006;118(6):e1707–14. 10.1542/peds.2006-1139. [DOI] [PubMed] [Google Scholar]
- 25.Weiss BD, Mays MZ, Martz W, Castro KM, DeWalt DA, Pignone MP, Mockbee J, Hale FA. Quick assessment of literacy in primary care: the newest vital sign. Ann Fam Med. 2005 Nov-Dec;3(6):514–22. 10.1370/afm.405. Erratum in: Ann Fam Med. 2006 Jan-Feb;4(1):83. [DOI] [PMC free article] [PubMed]
- 26.Paakkari O, Torppa M, Kannas L, Paakkari L. Subjective health literacy: development of a brief instrument for school-aged children. Scand J Public Health. 2016;44(8):751–7. 10.1177/1403494816669639. [DOI] [PubMed] [Google Scholar]
- 27.Institute of Medicine (US) Roundtable on Health Literacy. Measures of health literacy: workshop summary. Washington (DC): National Academies Press (US); 2009. 2, An overview of measures of health literacy. Available from: https://www.ncbi.nlm.nih.gov/books/NBK45375/. [PubMed]
- 28.Frost MH, Reeve BB, Liepa AM, Stauffer JW, Hays RD; Mayo/FDA. Patient-reported outcomes consensus meeting group; what is sufficient evidence for the reliability and validity of patient-reported outcome measures? Value Health. 2007;10 Suppl 2:S94-S105. 10.1111/j.1524-4733.2007.00272.x. [DOI] [PubMed]
- 29.Tabachnick BG, Fidell LS. Using Multivariate Statistics (3rd edn). New York: Harper Collins; 1996. [Google Scholar]
- 30.Fleiss JL. The design and analysis of clinical experiments. New York: Wiley; 1986. [Google Scholar]
- 31.Reliability of measurement.Luszczynska A, Scholz U, Schwarzer R. The general self-efficacy scale: multicultural validation studies. J Psychol. 2005;139(5):439–57. 10.3200/JRLP.139.5.439-457. [DOI] [PubMed]
- 32.Bjørnsen HN, Moksnes UK, Eilertsen MB, Espnes GA, Haugan G. Validation of the brief instrument “Health Literacy for School-Aged Children” (HLSAC) among Norwegian adolescents. Sci Rep. 2022Dec 21;12(1):22057. 10.1038/s41598-022-26388-4. [DOI] [PMC free article] [PubMed] [Google Scholar]
- 33.Chin CL, Yao G. 2014. Convergent Validity. In: Michalos, A.C. (eds) Encyclopedia of quality of life and well-being research. Springer, Dordrecht. 10.1007/978-94-007-0753-5_573.
- 34.Sharma S. Applied Multivariate Techniques. John Wiley & Sons, Inc., ISBN: 978–0–471–31064–8, 1995. https://www.wiley.com/en-br/Applied+Multivariate+Techniques+-p-9780471310648 (accessed on August 24, 2024).
- 35.Jöreskog KG, Olsson UH, Wallentin FY. Multivariate Analysis with LISREL. Springer Nature, published in 2016; pages 283–339. https://link.springer.com/book/10.1007/978-3-319-33153-9 (accessed on September 25, 2024).
- 36.Hair JF, Black WC, Babin BJ, Anderson RE. Multivariate data analysis, Seventh edition; Pearson Prentice Hall, 2010. Available from: https://www.drnishikantjha.com/papersCollection/Multivariate%20Data%20Analysis.pdf (accessed on October 24, 2024).
- 37.Rasmussen SE, Aaby A, Søjbjerg A, Mygind A, Maindal HT, Paakkari O, Christensen KS. The brief health literacy scale for adults: adaptation and validation of the health literacy for school-aged children questionnaire. Int J Environ Res Public Health. 2023Nov 16;20(22):7071. 10.3390/ijerph20227071. [DOI] [PMC free article] [PubMed] [Google Scholar]
- 38.Paakkari O, Kulmala M, Lyyra N, Torppa M, Mazur J, Boberova Z, Paakkari L. The development and cross-national validation of the short health literacy for school-aged children (HLSAC-5) instrument. Sci Rep. 2023Oct 31;13(1):18769. 10.1038/s41598-023-45606-1. [DOI] [PMC free article] [PubMed] [Google Scholar]
- 39.Saskia M. Fischer, Kevin Dadaczynski, Gorden Sudeck, Katharina Rathmann, Olli Paakkari, Leena Paakkari, Ludwig Bilz, and the HBSC Study Group Germany. Measuring Health Literacy in Childhood and Adolescence with the Scale Health Literacy in School-Aged Children – German Version: The Psychometric Properties of the German-Language Version of the WHO Health Survey Scale HLSAC. Diagnostica, 2022;68, 4, 184–196. 10.1026/0012-1924/a000296.
- 40.National Institute of Population Research and Training (NIPORT) and ICF. 2024. Bangladesh Demographic and Health Survey 2022: Final Report. Dhaka, Bangladesh, and Rockville, Maryland, USA: NIPORT and ICF. https://dhsprogram.com/pubs/pdf/FR386/FR386.pdfPer.
Associated Data
This section collects any data citations, data availability statements, or supplementary materials included in this article.
Data Availability Statement
The data presented in this study are available upon request from the corresponding author. The data are not publicly available due to privacy restrictions.