

Abstract
Background
A large body of research has focused on investigating the effects of healthcare provider volume and specialization on patient outcomes including outcomes of colorectal cancer surgery. However there is conflicting evidence about the role of such healthcare provider characteristics in the management of colorectal cancer.
Objectives
To examine the available literature for the effects of hospital volume, surgeon caseload and specialization on the outcomes of colorectal, colon and rectal cancer surgery.
Search methods
We searched Cochrane Central Register of Controlled Trials (CENTRAL), and LILACS using free text search words (as well as MESH‐terms). We also searched Medline (January 1990‐September 2011), Embase (January 1990‐September 2011) and registers of clinical trials, abstracts of scientific meetings, reference lists of included studies and contacted experts in the field.
Selection criteria
Non‐randomised and observational studies that compared outcomes for colorectal cancer, colon cancer and rectal cancer surgery (overall 5‐year survival, five year disease specific survival, operative mortality, 5‐year local recurrence rate, anastomotic leak rate, permanent stoma rate and abdominoperineal excision of the rectum rate) between high volume/specialist hospitals and surgeons and low volume/specialist hospitals and surgeons.
Data collection and analysis
Two review authors independently abstracted data and assessed risk of bias in included studies. Results were pooled using the random effects model in unadjusted and case‐mix adjusted meta‐analyses.
Main results
Overall five year survival was significantly improved for patients with colorectal cancer treated in high‐volume hospitals (HR=0.90, 95% CI 0.85 to 0.96), by high‐volume surgeons (HR=0.88, 95% CI 0.83 to 0.93) and colorectal specialists (HR=0.81, 95% CI 0.71 to 0.94). Operative mortality was significantly better for high‐volume surgeons (OR=0.77, 95% CI 0.66 to 0.91) and specialists (OR=0.74, 95% CI 0.60 to 0.91), but there was no significant association with higher hospital caseload (OR=0.93, 95% CI 0.84 to 1.04) when only case‐mix adjusted studies were included. There were differences in the effects of caseload depending on the level of case‐mix adjustment and also whether the studies originated in the US or in other countries. For rectal cancer, there was a significant association between high‐volume hospitals and improved 5‐year survival (HR=0.85, 95% CI 0.77 to 0.93), but not with operative mortality (OR=0.97, 95% CI 0.70 to 1.33); surgeon caseload had no significant association with either 5‐year survival (HR=0.99, 95% CI 0.86 to 1.14) or operative mortality (OR=0.86, 95% CI 0.62 to 1.19) when case‐mix adjusted studies were reviewed. Higher hospital volume was associated with significantly lower rates of permanent stomas (OR=0.64, 95% CI 0.45 to 0.90) and APER (OR=0.55, 95% CI 0.42 to 0.72). High‐volume surgeons and specialists also achieved lower rates of permanent stoma formation (0.75, 95% CI 0.64 to 0.88) and (0.70, 95% CI 0.53 to 0.94, respectively).
Authors' conclusions
The results confirm clearly the presence of a volume‐outcome relationship in colorectal cancer surgery, based on hospital and surgeon caseload, and specialisation. The volume‐outcome relationship appears somewhat stronger for the individual surgeon than for the hospital; particularly for overall 5‐year survival and operative mortality, there were differences between US and non‐US data, suggesting provider variability at hospital level between different countries, making it imperative that every country or healthcare system must establish audit systems to guide changes in the service provision based on local data, and facilitate centralisation of services as required. Overall quality of the evidence was low as all included studies were observational by design. In addition there were discrepancies in the definitions of caseload and colorectal specialist. However ethical challenges associated with the conception of randomised controlled trials addressing the volume outcome relationship makes this the best available evidence.
Keywords: Humans; Colonic Neoplasms; Colonic Neoplasms/mortality; Colonic Neoplasms/surgery; Colorectal Neoplasms; Colorectal Neoplasms/mortality; Colorectal Neoplasms/surgery; Colorectal Surgery; Colorectal Surgery/mortality; Colorectal Surgery/statistics & numerical data; Hospitals; Hospitals/statistics & numerical data; Outcome Assessment, Health Care; Outcome Assessment, Health Care/statistics & numerical data; Rectal Neoplasms; Rectal Neoplasms/mortality; Rectal Neoplasms/surgery; Risk Adjustment; Surgical Stomas; Surgical Stomas/statistics & numerical data; Survival Analysis; Workload; Workload/statistics & numerical data
Plain language summary
Workload and surgeon´s speciality for outcome after colorectal cancer surgery
There is some evidence to suggest better patient outcomes with increasing healthcare provider volume in complex cancer surgery. At present, healthcare providers are unsure of this relationship for colorectal cancer patients and there are mixed views on the concentration of such services to higher volume institutions. Some of the consequences of service centralization would include the loss of local healthcare provision for some patients, and the threat to financial viability of smaller hospitals often relying on a regular income from such a common condition. After thorough search of the available literature, we found fifty‐four observational studies (fifty one meta‐analysed) including 943,728 patients that addressed either the volume‐outcome relationship in the context of modern colorectal cancer treatment, or the effects of surgeon specialization. The results confirm the presence of a volume‐outcome relationship in colorectal cancer surgery, based on hospital and surgeon caseload, and benefits for specialization. For death within five years of treatment, hospital volume appeared to be more beneficial in rectal cancer surgery than for colon cancer. However, international differences in the data suggest provider variability at the hospital level between the different countries, making it imperative that every country or healthcare system must establish audit systems to guide changes in the service provision based on local data, and facilitate centralization of services as required. Overall quality of the evidence was low as all included studies were observational by design. In addition there were discrepancies in the definitions of caseload and colorectal specialist. However ethical challenges associated with the conception of randomised controlled trials addressing the volume outcome relationship makes this the best available evidence.
Summary of findings
Summary of findings for the main comparison. Hospital volume and primary outcomes after colorectal cancer surgery (adjusted analyses).
| Hospital volume and primary outcomes after colorectal cancer surgery (adjusted analyses) | ||||||
| Population: Patients with outcomes after colorectal cancer surgery Settings: Elective and urgent procedures Intervention: High hospital volume | ||||||
| Outcomes | Illustrative comparative risks* (95% CI) | Relative effect (95% CI) | No of Participants (studies) | Quality of the evidence (GRADE) | Comments | |
| Assumed risk | Corresponding risk | |||||
| Control | High hospital volume | |||||
| Overall five year survival ‐ Colorectal cancer | 494 per 1000 | 459 per 1000 (436 to 477) | HR 0.9 (0.84 to 0.95) | 36858 (2 studies) | ⊕⊝⊝⊝ very low1 | |
| Overall five year survival ‐ Colon cancer | 543 per 1000 | 532 per 1000 (453 to 615) | HR 0.97 (0.77 to 1.22) | 5211 (2 studies) | ⊕⊝⊝⊝ very low2 | |
| Overall five year survival ‐ Rectal cancer | 527 per 1000 | 471 per 1000 (438 to 509) | HR 0.85 (0.77 to 0.95) | 4028 (3 studies) | ⊕⊕⊝⊝ low | |
| Inpatient and 30 day mortality ‐ Colorectal cancer | 53 per 1000 | 52 per 1000 (43 to 63) | OR 0.98 (0.79 to 1.2) | 77823 (3 studies) | ⊕⊝⊝⊝ very low1 | |
| Inpatient and 30 day mortality ‐ Colon cancer | 56 per 1000 | 50 per 1000 (44 to 57) | OR 0.89 (0.78 to 1.01) | 263071 (7 studies) | ⊕⊝⊝⊝ very low1 | |
| Inpatient and 30 day mortality ‐ Rectal cancer | 54 per 1000 | 57 per 1000 (41 to 79) | OR 1.07 (0.76 to 1.5) | 14941 (5 studies) | ⊕⊝⊝⊝ very low1 | |
| *The basis for the assumed risk (e.g. the median control group risk across studies) is provided in footnotes. The corresponding risk (and its 95% confidence interval) is based on the assumed risk in the comparison group and the relative effect of the intervention (and its 95% CI). CI: Confidence interval; OR: Odds ratio; HR: Hazard ratio; | ||||||
| GRADE Working Group grades of evidence High quality: Further research is very unlikely to change our confidence in the estimate of effect. Moderate quality: Further research is likely to have an important impact on our confidence in the estimate of effect and may change the estimate. Low quality: Further research is very likely to have an important impact on our confidence in the estimate of effect and is likely to change the estimate. Very low quality: We are very uncertain about the estimate. | ||||||
1 Unexplained heterogeneity 2 Study was high risk for 5 of ten items used to assess risk of bias
The following studies were not included in the table 1 because no data was published on number of patients experiencing the outcome and the total number of patients in either control or interventional group.
Simunovic 2000 , Elferink 2010A; Elferink 2010B; Manchon‐Walsh 2011)
Summary of findings 2. Hospital volume and secondary outcomes after colorectal cancer surgery (adjusted analyses).
| Hospital volume and secondary outcomes after colorectal cancer surgery (adjusted analyses) | ||||||
| Population: Patients with outcomes after colorectal cancer surgery Settings: Elective and urgent procedures Intervention: High hospital volume | ||||||
| Outcomes | Illustrative comparative risks* (95% CI) | Relative effect (95% CI) | No of Participants (studies) | Quality of the evidence (GRADE) | Comments | |
| Assumed risk | Corresponding risk | |||||
| Control | High hospital volume | |||||
| Five year local recurrence rate ‐ Rectal cancer | 152 per 1000 | 119 per 1000 (81 to 174) | HR 0.77 (0.51 to 1.16) | 2986 (3 studies) | ⊕⊝⊝⊝ very low1 | |
| Anastomotic leak rate ‐ Colon cancer | 18 per 1000 | 26 per 1000 (14 to 45) | OR 1.44 (0.8 to 2.59) | 2808 (1 study) | ⊕⊕⊝⊝ low | |
| Anastomotic leak rate ‐ Rectal cancer | 72 per 1000 | 53 per 1000 (36 to 78) | OR 0.72 (0.48 to 1.09) | 2615 (2 studies) | ⊕⊕⊝⊝ low | |
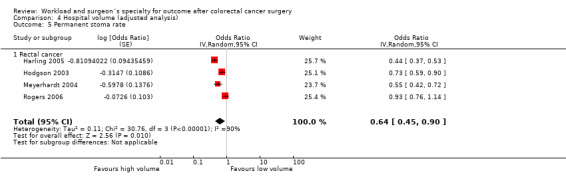
| Permanent stoma rate ‐ Rectal cancer | 371 per 1000 | 252 per 1000 (171 to 352) | OR 0.57 (0.35 to 0.92) | 7093 (2 studies) | ⊕⊝⊝⊝ very low1 | |
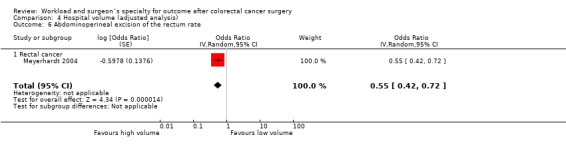
| Abdominoperineal excision of the rectum rate ‐ Rectal cancer | 463 per 1000 | 322 per 1000 (266 to 383) | OR 0.55 (0.42 to 0.72) | 894 (1 study) | ⊕⊝⊝⊝ very low2 | |
| *The basis for the assumed risk (e.g. the median control group risk across studies) is provided in footnotes. The corresponding risk (and its 95% confidence interval) is based on the assumed risk in the comparison group and the relative effect of the intervention (and its 95% CI). CI: Confidence interval; OR: Odds ratio; HR: Hazard ratio; | ||||||
| GRADE Working Group grades of evidence High quality: Further research is very unlikely to change our confidence in the estimate of effect. Moderate quality: Further research is likely to have an important impact on our confidence in the estimate of effect and may change the estimate. Low quality: Further research is very likely to have an important impact on our confidence in the estimate of effect and is likely to change the estimate. Very low quality: We are very uncertain about the estimate. | ||||||
1 Unexplained heterogeneity 2 Study was high risk for 5 of ten items used to assess risk of bias
The following studies were not included in the table 2 because no data was published on the number of patients experiencing the outcome and the total number of patients in either control or interventional group.
Summary of findings 3. Surgeon volume and primary outcomes after colorectal cancer surgery (adjusted analyses).
| Surgeon volume and primary outcomes after colorectal cancer surgery (adjusted analyses) | ||||||
| Population: Patients with outcomes after colorectal cancer surgery Settings: Elective and urgent procedures Intervention: High surgeon volume | ||||||
| Outcomes | Illustrative comparative risks* (95% CI) | Relative effect (95% CI) | No of Participants (studies) | Quality of the evidence (GRADE) | Comments | |
| Assumed risk | Corresponding risk | |||||
| Control | High surgeon volume | |||||
| Overall five year survival ‐ Colorectal cancer | 521 per 1000 | 473 per 1000 (453 to 492) | HR 0.87 (0.82 to 0.92) | 15462 (2 studies) | ⊕⊕⊝⊝ low | |
| Overall five year survival ‐ Colon cancer | 393 per 1000 | 343 per 1000 (316 to 371) | HR 0.84 (0.76 to 0.93) | 2905 (1 study) | ⊕⊕⊝⊝ low | |
| Overall five year survival ‐ Rectal cancer | 428 per 1000 | 425 per 1000 (381 to 471) | HR 0.99 (0.86 to 1.14) | 1903 (1 study) | ⊕⊕⊝⊝ low | |
| Five year disease specific survival ‐ Colorectal cancer | 659 per 1000 | 636 per 1000 (568 to 703) | HR 0.94 (0.78 to 1.13) | 1416 (1 study) | ⊕⊕⊝⊝ low | |
| Inpatient and 30 day mortality ‐ Colon cancer | 49 per 1000 | 39 per 1000 (30 to 49) | OR 0.79 (0.61 to 1.02) | 47584 (3 studies) | ⊕⊝⊝⊝ very low1 | |
| Inpatient and 30 day mortality ‐ Rectal cancer | 93 per 1000 | 75 per 1000 (50 to 111) | OR 0.79 (0.51 to 1.22) | 1903 (1 study) | ⊕⊕⊝⊝ low | |
| *The basis for the assumed risk (e.g. the median control group risk across studies) is provided in footnotes. The corresponding risk (and its 95% confidence interval) is based on the assumed risk in the comparison group and the relative effect of the intervention (and its 95% CI). CI: Confidence interval; OR: Odds ratio; HR: Hazard ratio; | ||||||
| GRADE Working Group grades of evidence High quality: Further research is very unlikely to change our confidence in the estimate of effect. Moderate quality: Further research is likely to have an important impact on our confidence in the estimate of effect and may change the estimate. Low quality: Further research is very likely to have an important impact on our confidence in the estimate of effect and is likely to change the estimate. Very low quality: We are very uncertain about the estimate. | ||||||
1 Unexplained heterogeneity
The following study was not included in the table 3 because no data was published on number of patients experiencing the outcome and the total number of patients in either control or interventional group.
Summary of findings 4. Surgeon volume and secondary outcomes after colorectal cancer surgery (adjusted analyses).
| Surgeon volume and secondary outcomes after colorectal cancer surgery (adjusted analyses) | ||||||
| Population: Patients with outcomes after colorectal cancer surgery Settings: Elective and urgent procedures Intervention: High surgeon volume | ||||||
| Outcomes | Illustrative comparative risks* (95% CI) | Relative effect (95% CI) | No of Participants (studies) | Quality of the evidence (GRADE) | Comments | |
| Assumed risk | Corresponding risk | |||||
| Control | High surgeon volume | |||||
| Anastomotic leak rate ‐ Colon cancer | 27 per 1000 | 18 per 1000 (10 to 33) | OR 0.66 (0.36 to 1.21) | 2570 (1 study) | ⊕⊕⊝⊝ low | |
| Anastomotic leak rate ‐ Rectal cancer | 93 per 1000 | 59 per 1000 (29 to 116) | OR 0.61 (0.29 to 1.28) | 1929 (1 study) | ⊕⊕⊝⊝ low | |
| Permanent stoma rate ‐ Rectal cancer | 376 per 1000 | 282 per 1000 (217 to 354) | OR 0.65 (0.46 to 0.91) | 1323 (1 study) | ⊕⊕⊝⊝ low | |
| Abdominoperineal excision of rectum rate ‐ Rectal cancer | 569 per 1000 | 209 per 1000 (117 to 346) | OR 0.2 (0.1 to 0.4) | 180 (1 study) | ⊕⊝⊝⊝ very low1,2,3 | |
| *The basis for the assumed risk (e.g. the median control group risk across studies) is provided in footnotes. The corresponding risk (and its 95% confidence interval) is based on the assumed risk in the comparison group and the relative effect of the intervention (and its 95% CI). CI: Confidence interval; OR: Odds ratio; | ||||||
| GRADE Working Group grades of evidence High quality: Further research is very unlikely to change our confidence in the estimate of effect. Moderate quality: Further research is likely to have an important impact on our confidence in the estimate of effect and may change the estimate. Low quality: Further research is very likely to have an important impact on our confidence in the estimate of effect and is likely to change the estimate. Very low quality: We are very uncertain about the estimate. | ||||||
1 Four high risk and two unclear risk items out of ten 2 Total number of events less than 300 3 Large effect present, OR < 0.5
The following study was not included in the table 4 because no data was published on number of patients experiencing the outcome and the total number of patients in either control or interventional group.
Summary of findings 5. Surgeon specialisation and primary and secondary outcomes after colorectal cancer surgery (adjusted analyses).
| Surgeon specialisation and primary and secondary outcomes after colorectal cancer surgery (adjusted analyses) | ||||||
| Population: Patients with outcomes after colorectal cancer surgery Settings: Elective and urgent procedures Intervention: Surgeon specialisation | ||||||
| Outcomes | Illustrative comparative risks* (95% CI) | Relative effect (95% CI) | No of Participants (studies) | Quality of the evidence (GRADE) | Comments | |
| Assumed risk | Corresponding risk | |||||
| Control | Surgeon specialisation | |||||
| Overall five year survival ‐ Colorectal cancer | 422 per 1000 | 359 per 1000 (323 to 403) | HR 0.81 (0.71 to 0.94) | 14628 (4 studies) | ⊕⊕⊝⊝ low | |
| Five year disease specific survival ‐ Colorectal cancer | 638 per 1000 | 529 per 1000 (467 to 591) | HR 0.74 (0.62 to 0.88) | 2186 (1 study) | ⊕⊕⊝⊝ low | |
| Inpatient and 30 day mortality ‐ Colorectal cancer | 104 per 1000 | 79 per 1000 (65 to 95) | OR 0.74 (0.6 to 0.91) | 11973 (2 studies) | ⊕⊕⊝⊝ low | |
| Five year local recurrence rate ‐ Colorectal cancer | 169 per 1000 | 99 per 1000 (78 to 123) | HR 0.56 (0.44 to 0.71) | 2587 (1 study) | ⊕⊕⊝⊝ low | |
| Anastomotic leak rate ‐ Colorectal cancer | 37 per 1000 | 27 per 1000 (12 to 59) | OR 0.71 (0.31 to 1.63) | 8563 (2 studies) | ⊕⊝⊝⊝ very low1 | |
| Permanent stoma rate ‐ Rectal cancer | 362 per 1000 | 285 per 1000 (231 to 348) | OR 0.7 (0.53 to 0.94) | 2026 (1 study) | ⊕⊕⊝⊝ low | |
| *The basis for the assumed risk (e.g. the median control group risk across studies) is provided in footnotes. The corresponding risk (and its 95% confidence interval) is based on the assumed risk in the comparison group and the relative effect of the intervention (and its 95% CI). CI: Confidence interval; OR: Odds ratio; HR: Hazard ratio; | ||||||
| GRADE Working Group grades of evidence High quality: Further research is very unlikely to change our confidence in the estimate of effect. Moderate quality: Further research is likely to have an important impact on our confidence in the estimate of effect and may change the estimate. Low quality: Further research is very likely to have an important impact on our confidence in the estimate of effect and is likely to change the estimate. Very low quality: We are very uncertain about the estimate. | ||||||
1 Significant unexplained heterogeneity between studies
Background
Description of the condition
Colorectal cancer is an important public health problem. It is the third most common cancer in the developed world (Globocan 2002), and the second most common cause of cancer death (Globocan 2002). Worldwide, approximately 875,000 people are newly diagnosed with colorectal cancer each year, with a four time greater incidence in developed countries compared to the developing world (Globocan 2002). In countries with the highest prevalence, as much as 6% of the population could suffer from the disease within their lifetime (Keating 2003; Skegg 2002).
Despite substantial advances in neoadjuvant and adjuvant treatment, the mainstay of treatment for colorectal cancer remains surgery. Resection of the cancer alone may cure around 40% of cases (Wille‐Jørgensen 2001), with adjuvant or neo‐adjuvant treatment in the form of chemotherapy and pre‐operative chemo‐radiotherapy confers an additional survival benefit of 5‐6% (Midgley 2000). Overall, relative survival for colorectal cancer has improved over the last three decades (Verdecchia 2007), particularly attributed to improvements in treatments for rectal cancer (Verdecchia 2007). The mean age‐adjusted 5‐year relative survival in Europe is 55% and 53% for colon and rectal cancer, respectively, with women having slightly better survival than men for both cancers (Sant 2009). However, the recently published Eurocare‐4 data still highlights significant variability in the survival rates between many European countries (Sant 2009).
The outcomes of colorectal surgery can be evaluated in many ways. In the UK, quality benchmarks stated in the guidelines of the Association of Coloproctology of Great Britain and Ireland (ACPGBI) (ACPGBI 2007) include 30‐day mortality, anastomotic leak rates, permanent stoma and Abdomino‐Perineal Excision (APER) rates, 5‐year local recurrence, and overall or cancer‐specific survival (ACPGBI 2007). Furthermore, in order to comparatively evaluate the quality of healthcare providers in observational studies, it is imperative to employ case‐mix adjusted outcomes (Hall 2009). Although most risk factors can be defined objectively, some have a subjective component which may result in inconsistencies for some preoperative variables (Ranta 1997; Haynes 1995), thus introducing bias.
Description of the intervention
A large body of research over the last two decades has focused on explaining the relationship between patient outcomes and volume of work undertaken by health providers. For many rare diseases, the concentration of patient care in the hand of specialist surgeons allows accumulation of experience with such infrequently seen conditions, with obvious benefits for the quality of treatment, training, research and economic efficiency. For more common diseases, the effects of service concentration on training and research are less pronounced, and economy of scale may be even counterproductive if the viability of smaller hospitals is threatened by the reduction of regular income streams. Nonetheless, if the patient's received quality of care is indeed determined by the experience and expertise of the treating surgeon and the whole treatment team, it is important to determine the responsible factors that enable high‐quality healthcare. Whilst it may be difficult to spot each individual intervention that leads to better outcomes, it has been long demonstrated that differences in results exist between providers, even for common conditions (Lee 1957; Lipworth 1963), and that caseload could indeed act as an important measure in comparative analysis (Luft 1979).
In recent times there has been a drive towards centralisation of cancer services based on the widely held assumption that specialists and high‐volume providers achieve better patient outcomes (Dudley 2000; Fong 2005; Ihse 2003). The benefits of higher caseload, although used for surgeons and hospitals often synonymously, may work through different pathways (Gruen 2009): for the high‐volume surgeon, it is thought that greater experience should lead to improvements in the pre‐ and intraoperative decision‐making process, case selection and surgical technique; for the high‐volume hospital, the organisation of care including multi‐disciplinary team work approach, local availability of other specialist services and more active involvement with research is thought to lead to the reported better results (Ihse 2003). An alternative hypothesis to the "practice‐makes‐perfect" concept, explaining at least some of the reported variability between high‐ and low‐volume providers, is that of "selective referral" patterns: the better outcome achieved by more widely known surgeons and centres may in itself result in high‐volume practice, and attract a better case‐mix from a larger population base (Luft 1987). As for the effects of specialisation, patient outcome may be improved not only through dedicated training and practice, and the associated in‐depth knowledge of surgical anatomy and pathology, but also through the concentration of workload resulting in high caseload itself (Chowdhury 2007).
Why it is important to do this review
Colorectal cancer surgery is traditionally performed both by general surgeons and trained colorectal specialists, and is provided in most acute hospitals. There have been conflicting reports regarding the "volume‐outcome relationship" in colorectal cancer surgery (Iversen 2007; Salz 2008); results from high volume centres in support of centralization have been criticised for trying to justify their own existence (Hogan 2009). Within any healthcare system, the outcome of the volume‐outcome debate has substantial implications for the structure and delivery of services for common conditions including colorectal cancer, as there is an inherent conflict between the retention of colorectal services in smaller, but local, hospital units with geographical advantages for many patients, and the concentration in large‐volume, regional units (Soljak 2002; Hogan 2009). Furthermore, the cost involved in developing and maintaining centralised care provision on a large scale is significant and can only be justified by evidence of improved patient outcome. As the treatment of colorectal cancer has evolved rapidly over the last two decades, with widespread introduction of pre‐operative neo‐adjuvant treatment of rectal cancer (Kapiteijn 2001; Swedish Rectal Cancer Trial 1997), Total Mesorectal Excision (TME) (Heald 1988) and the expanding role of adjuvant chemotherapy (Dube 1997; Mamounas 1999), the examination of organisational factors such as caseload and specialization should be performed within the context of contemporary studies.
Objectives
The aim of this systematic review and meta‐analyses is to examine the available literature for the effects of hospital and surgeon volume, and surgeon specialization, on the outcomes of colorectal, colon and rectal cancer surgery in the context of modern management routine.
Methods
Criteria for considering studies for this review
Types of studies
There is a well‐known absence of randomised‐controlled trials; in the absence of evidence from randomised controlled trials on this issue, all available non‐randomised cohort and observational studies, and subgroup analysis of clinical trials were included.
Types of participants
Patients with a confirmed histological diagnosis of colorectal, colon and rectal cancer in prospective studies and patients with diagnostic codes for colorectal, colon and rectal cancer, derived from International classification of diseases, 9th Revision (ICD‐9‐CM) for retrospective studies. Analysis was primarily performed for all colorectal cancer patients, but effects for colon and rectal cancer patients were examined in separate subgroups where possible; as not all studies provided individual data on colon and rectal cancer, and some studies exclusively reported only on one or the other subgroup, a third subgroup of colorectal cancer patients was established and analysed.
Types of interventions
Intervention: Surgery for colorectal, colon and rectal cancer performed by high volume and/or specialized units/hospitals or surgeons. In studies with more than two stratified groups, the highest volume category was used for comparative analysis.
Control: Surgery for colorectal, colon and rectal cancer performed by low volume and/or non‐specialized units/hospitals or surgeons. Comparisms were restricted to studies that compared an intervention with this control group. In studies where the highest volume category was used as control, the effects were reversed to standardise analysis.
Types of outcome measures
Primary outcomes
1. Five‐year overall and/or cancer specific survival 2. Operative mortality rate (inpatient death or death within 30 days from surgery)
Secondary outcomes
1. Five‐year local recurrence rate 2. Postoperative anastomotic leak rate 3. Permanent stoma rate for rectal cancer surgery 4. Abdominoperineal excision of rectum rate (APER) for rectal cancer surgery
Outcomes were stratified according to colon and rectal cancer surgery if possible, otherwise the outcomes were included as colorectal cancer surgery.
Search methods for identification of studies
Papers in all languages were sought and translations carried out where necessary
Electronic searches
Electronic searches from January 1990 to September 2011 were performed in PUBMED, EMBASE, Cochrane Central Register of Controlled Trials (CENTRAL) and LILACS, with no restriction on language and using free text search for words (as well as MESH‐terms) ‐ Appendix 1. We chose 1990 as the study cut off point to capture the effects of volume and outcome in the context of modern colorectal cancer management, as this has changed dramatically over the years.
Searching other resources
Reports of conference proceedings and abstracts from the last 5 years were searched in the following sources:
American Society of Colon and Rectal Surgeons (ASCRS)
European Society of Coloproctology (ESCP)
Association of Coloproctologists of Great Britain and Ireland (ACPGBI)
The citation lists of included studies were checked and experts in the field contacted to identify further reports of studies.
Data collection and analysis
Selection of studies
All titles and abstracts retrieved by electronic searching were examined independently by two authors (DA, DWB), and duplicates were removed. The remaining titles and abstracts were scrutinised independently for inclusion by the two reviewers (DA, DWB). Disagreements were resolved by discussion. Studies that clearly did not meet the inclusion criteria were excluded and copies of the full text of potentially relevant references were obtained. The eligibility of retrieved studies was assessed independently by the two reviewers (DA, DWB); disagreements were resolved by discussion. Consultation with a third reviewer was not required. Reasons for exclusion of studies were documented.
Data extraction and management
For all included studies, the following data were extracted as recommended in Chapter 7 of the Cochrane Handboook (Higgins 2008).
Author/year of publication
Country
Setting
Study design and methodology
Study population
Total number of participants
Definition of rectum (colorectal/rectal cancer studies only)
Patient characteristics according to intervention groups (as reported):
Sex
Age
Tumour stage
Tumour grade
Comorbidity
Tumour site
Neoadjuvant therapy
Presentation
Ethnicity
Socioeconomic status/income
Total mesorectal rate (rectal cancer studies only)
Details of Intervention
Total number of hospitals/surgeons/specialists
Definitions of hospital and surgeon volumes
Definitions of specialist surgeons
Details of outcome
Data on all reported primary and secondary outcomes were extracted as follows:
For time to event data (e.g. five year overall survival, five year disease specific survival, local recurrence rate), we extracted the log of the unadjusted and case‐mix adjusted hazards ratios and their standard errors from the included studies. Where not reported, we estimated them from other reported statistics using the methods of Parmar 1998.
For dichotomous outcomes (e.g. 30‐day mortality, anastomotic leak rate, permanent stoma rate and APER rates), we extracted the number of patients in each treatment arm who experienced the outcome of interest and the total number of patients assessed, in order to estimate the odds ratio (OR) in unadjusted meta‐analyses.
For dichotomous outcomes we also extracted the adjusted odds ratios and their standard errors where reported for case‐mix adjusted meta‐analyses. Variables adjusted for in case‐mix adjusted analyses were noted.
Data extraction was performed by the two reviewers (DA, DWB) on special data‐extraction‐sheets (see Appendix 2) designed for the review; disagreements were resolved by discussion. There was no need for further appeal to a third reviewer. Data extraction was performed as recommended in chapter 7 of Cochrane Handbook (Higgins 2008) where applicable. The review was performed in RevMan 5.1.
Assessment of risk of bias in included studies
The risk of bias in included studies was assessed using a modification of the Newcastle‐Ottawa Scale for non‐experimental studies.
Study design
The design of the included studies were coded as:
Low risk: e.g. if population‐based, multi‐centred and prospectively designed
High risk: e.g. if not population‐based, not multi‐centred and retrospectively designed
Unclear risk:e.g. if no clear study design was reported
Representativeness of study cohort
The representativeness of participants in studies of colorectal/colon/rectal cancer patients were coded as:
Low risk: e.g. if study cohort was representative and not from selected groups
High risk: e.g. if somewhat representative or from selected groups
Unclear risk: e.g. if no description of cohort was reported
Ascertainment of intervention
The ascertainment of surgeon/hospital volume and surgeon specialization in included studies were coded as:
Low risk: e.g. if ascertainment of intervention was from study data or from structured interviews
High risk: e.g. if self reported
Unclear risk: e.g. if not reported
Comparability of intervention and comparison/control group
The comparability of participants in the intervention and comparison/control groups were coded as:
Low risk: e.g. if study reported no differences between intervention and comparison/control group and/or if adjustments for case‐mix differences between intervention and comparison/control were performed
High risk e.g. if study reported significant differences between intervention and comparison/control group and/or if adjustments for case‐mix differences between intervention and comparison/control were not performed
Unclear risk e.g. if differences between intervention and comparison/control groups were not reported
Assessment of outcomes
The assessments of primary and secondary outcomes in studies were coded as:
Low risk: e.g. if independent blind assessment of outcomes was performed or outcomes were assessed by the use of record linkage
High risk: e.g. if self reporting of outcomes was performed
Unclear risk: e.g. if no description was reported of how the outcomes were assessed.
Addressing incomplete data
The proportion of participants whose outcomes were analysed in included studies were assessed and coded as:
Low risk: e.g. if loss of outcome data for participants or participants lost to follow‐up was unlikely to introduce bias (<20%)
high risk: e.g. if loss of outcome data for participants or participants lost to follow‐up was likely to introduce bias (>20%)
Unclear risk: e.g. if no information was provided
Missing data on primary interventions and outcomes
The proportion of participants in the intervention groups whose outcomes were analysed in included studies were assessed and coded as:
Low risk: e.g. if loss of data on primary interventions and outcomes was unlikely to introduce bias (<20%)
High risk: e.g. if loss of data on primary interventions and outcomes was likely to introduce bias (>20%)
Unclear risk: e.g. if no information was provided
Assessment of risk of bias was independently performed (DA and DWB) and disagreements resolved by discussion.
Measures of treatment effect
The following measures of the effect of treatment were used:
For time to event data, we used the hazard ratio
For dichotomous data, we used the odds ratio
Unit of analysis issues
Studies that adjusted for the effects of clustering within healthcare providers were noted, and a unit of analysis error if this was not performed was recorded.
Dealing with missing data
Missing outcome data was not imputed. Where data was missing, an attempt was made to contact study authors to request data on the outcomes only among participants that were assessed.
Assessment of heterogeneity
Heterogeneity between studies was assessed by visual inspection of forest plots, by estimation of the percentage heterogeneity between studies, which cannot be attributed to sampling variation (Higgins 2003), and by a formal statistical test of heterogeneity (Deeks 2001).
Assessment of reporting biases
Funnel plots corresponding to meta‐analysis of the case‐mix adjusted primary outcome (inpatient and 30 day mortality) was examined to assess the potential for publication bias.
Data synthesis
Results were pooled together in unadjusted and case‐mix adjusted meta‐analyses using random effects models.
For adjusted and unadjusted time to event data, hazard ratios were pooled using the generic inverse variance facility of Revman 5.1
For dichotomous data, adjusted odds ratios were also pooled using the generic inverse variance facility of Revman 5.1
For unadjusted dichotomous data, the absolute numbers for each outcome, and the total numbers in intervention and comparison groups were entered into Revman 5.1 for unadjusted meta‐analyses using the Mantel Haenszel statistical method.
Subgroup analysis and investigation of heterogeneity
Subgroup analyses was performed, grouping the studies according to continent of origin (North‐America versus Europe). Further subgroup analysis would have been performed for rectal cancer patients only according to site of tumour, (e.g. true rectal and rectosigmoid cancers) if more than one rectal cancer study reporting on adjusted estimates for the outcome APER rate were identified (see Differences between protocol and review)
Sensitivity analysis
Sensitivity analyses was not performed as all studies were non‐randomised and observational by nature (see Differences between protocol and review ).
Results
Description of studies
Results of the search
The search strategy identified a total of 894 potentially relevant studies, of which 797 were excluded on the basis of title or abstract. For the remaining 97 studies, the full text were obtained and reviewed. Forty‐three studies were excluded on the basis of reasons listed in the section on Characteristics of excluded studies. In total, 54 studies were judged to fulfil the inclusion criteria; however, three potentially valuable studies (Gort 2010; Grabham 1996; Larson 2008) could not be included in quantitative analyses due to insufficient published statistics or data, leaving 51 studies that were included in the meta‐analysis. Any disagreements were resolved by discussion between the two reviewers (DA, DWB).
Included studies
Characteristics of included studies
Twenty‐eight studies were based in Europe; 11 studies were UK‐based (Borowski 2007; Borowski 2010; Carter et al 1995; Dorrance 2000; Grabham 1996; McArdle 2004; Mella 1997; Ng 2006, Parry 1999; Platell 2003; Smith 2003), five based in Germany (Engel 2005B; Marusch 2001A; Marusch 2001B; Mroczkowski 2011; Ptok 2007), four in the Netherlands (Elferink 2010A; Elferink 2010B; Engel 2005A; Gort 2010), three in Sweden (Kressner 2009; Martling 2002; Sjovall 2007), two in Norway (Debes 2008; Wibe 2005) and one study each in Denmark (Harling 2005) and Spain (Manchon‐Walsh 2011). One study covered a number of European centres (COLOR Study Group). Twenty‐one studies were based in North America; 18 studies were based in USA (Billingsley 2007; Birkmeyer 2002; Dimick 2003; Drolet 2011; Finlayson 2003; Hannan 2002; Harmon 1999; Hodgson 2003; Larson 2008; Meyerhardt 2003; Meyerhardt 2004; Purves 2005; Rabeneck 2004; Rogers 2006; Schrag 2002; Schrag 2003; Simons 1997; Zhang 2007) and three studies in Canada (Simunovic 2000; Simunovic 2006; Urbach 2004). Two studies originated from Asia (Kuwabara 2009; Lin 2006) and three from Australia (Marwan 2010; McGrath 2005; Morris 2007). Twenty‐eight studies were of retrospective design (Billingsley 2007; Birkmeyer 2002; Debes 2008; Dimick 2003; Dorrance 2000; Drolet 2011; Elferink 2010A; Elferink 2010B; Finlayson 2003; Harling 2005; Harmon 1999; Hodgson 2003; Kuwabara 2009; Lin 2006; Manchon‐Walsh 2011; Marwan 2010; Morris 2007; Ng 2006; Parry 1999; Rabeneck 2004; Rogers 2006; Schrag 2002; Schrag 2003; Simons 1997; Simunovic 2000; Simunovic 2006; Urbach 2004; Zhang 2007), and 25 studies were prospective (Borowski 2007; Borowski 2010; Carter et al 1995; COLOR Study Group; Engel 2005A; Engel 2005B; Gort 2010; Grabham 1996; Hannan 2002; Kressner 2009; Larson 2008; Martling 2002; Marusch 2001A; Marusch 2001B; McGrath 2005; Mella 1997; Meyerhardt 2003; Meyerhardt 2004; Mroczkowski 2011; Platell 2003; Ptok 2007; Purves 2005; Sjovall 2007; Smith 2003; Wibe 2005). One study was by design in part retrospective and prospective (McArdle 2004). Most studies were based on data from population registries, with the exception of 13 studies (Birkmeyer 2002; COLOR Study Group; Debes 2008; Dorrance 2000; Harmon 1999; Larson 2008; Marusch 2001A; Marusch 2001B; Ng 2006; Platell 2003; Ptok 2007; Purves 2005; Rabeneck 2004).
In 15 studies, the effect of the intervention(s) were reported on a combined cohort of colorectal cancer patients (Borowski 2007; Borowski 2010; Carter et al 1995; Dimick 2003; Dorrance 2000; Engel 2005A; Harmon 1999; McArdle 2004; Mella 1997; Parry 1999; Platell 2003; Rabeneck 2004; Rogers 2006; Urbach 2004; Zhang 2007), although data in one study (Borowski 2010) was available for analysis of colon and rectal cancers separately. Seventeen studies assessed the effect of the intervention(s) on colon cancer patients (Billingsley 2007; Birkmeyer 2002; COLOR Study Group; Drolet 2011; Elferink 2010A; Finlayson 2003; Hannan 2002; Kuwabara 2009; Larson 2008; Lin 2006; Marusch 2001B; Meyerhardt 2003; Morris 2007; Mroczkowski 2011; Schrag 2003; Simunovic 2006; Sjovall 2007), and 22 studies assessed the effect of the intervention(s) on rectal cancer patients only (Debes 2008; Elferink 2010B; Engel 2005B; Gort 2010; Grabham 1996; Harling 2005; Hodgson 2003; Kressner 2009; Manchon‐Walsh 2011; Martling 2002; Marusch 2001A; Marwan 2010; McGrath 2005; Meyerhardt 2004; Ng 2006; Ptok 2007; Purves 2005; Schrag 2002; Simons 1997; Simunovic 2000; Smith 2003; Wibe 2005).
The effects of hospital volume alone was assessed by 29 studies (Birkmeyer 2002; COLOR Study Group; Dimick 2003; Elferink 2010A; Elferink 2010B; Engel 2005A; Engel 2005B; Finlayson 2003; Hannan 2002; Harling 2005; Hodgson 2003; Kressner 2009; Kuwabara 2009; Lin 2006; Manchon‐Walsh 2011; Marusch 2001A; Marusch 2001B; Meyerhardt 2003; Meyerhardt 2004; Mroczkowski 2011; Ptok 2007; Rabeneck 2004; Simons 1997; Simunovic 2000; Simunovic 2006; Sjovall 2007; Urbach 2004; Wibe 2005; Zhang 2007), and effects of surgeon volume alone was assessed by seven studies (Carter et al 1995; Debes 2008; Grabham 1996; Larson 2008; McArdle 2004; Morris 2007; Purves 2005). Ten studies assessed the effects of both hospital and surgeon volume (Billingsley 2007; Borowski 2010; Drolet 2011; Gort 2010; Harmon 1999; McGrath 2005; Parry 1999; Rogers 2006; Schrag 2002; Schrag 2003). Three studies reported the effects of specialization alone (Dorrance 2000; Ng 2006, Platell 2003), and six studies reported both effects of specialization and surgeon volume (Borowski 2007Martling 2002; Marwan 2010; McArdle 2004; Mella 1997; Smith 2003).
Twenty‐eight studies adjusted for important prognostic factors, of which twelve studies reported overall five year survival (Borowski 2007; Borowski 2010; Kressner 2009; McArdle 2004; Meyerhardt 2003; Meyerhardt 2004; Morris 2007; Platell 2003; Simunovic 2000; Rabeneck 2004; Rogers 2006; Smith 2003; Wibe 2005), one reported five‐year disease specific survival (McArdle 2004 ), 18 reported inpatient and 30‐day mortality (Billingsley 2007; Birkmeyer 2002; Borowski 2007; Borowski 2010; Drolet 2011; Elferink 2010A; Elferink 2010B; Engel 2005B; Finlayson 2003; Harling 2005; Hodgson 2003; Lin 2006; Manchon‐Walsh 2011; Rogers 2006; Simunovic 2000; Simunovic 2006; Smith 2003; Urbach 2004), three studies reported five‐year local recurrence rate (Meyerhardt 2004; Ptok 2007; Wibe 2005), five studies reported permanent stoma rate (Borowski 2007; Borowski 2010; Harling 2005; Hodgson 2003; Rogers 2006), two reported APER rates (Meyerhardt 2004; Purves 2005). Studies adjusting for the various prognostic factors and corresponding primary and secondary outcomes are displayed in theTable 6.
1. Casemix adjusted studies, study outcomes and adjusted prognostic factors.
| Study ID | Outcomes | Type of tumour | Age | Sex | Stage | Grade | Site | Comorbidity | Socioeconomic Status/Income | Ethnicity | Unit of analysis error | Surgeon characteristics | Hospital characteristics | Presentation | Lymph nodes | Others |
| Borowski 2007 | OS*, M*, AL*, PS* | Colorectal | Y | Y | Y | N | N | Y | N | N | Y | N | N | Y | N | N |
| Borowski 2010 | OS*, M*, AL*, PS* | Colorectal | Y | Y | Y | N | N | Y | N | N | Y | N | N | Y | N | N |
| Rabeneck 2004 | OS* | Colorectal | Y | Y | N | N | Y | Y | N | Y | Y | N | N | N | N | Marital status |
| Rogers 2006 | M*, OS*, PS* | Colorectal | Y | Y | N | N | N | Y | Y | Y | N | N | N | N | N | N |
| Engel 2005A | M* | Colorectal | Y | Y | N | N | N | N | N | N | Y | N | N | Y | N | N |
| Urbach 2004 | M* | Colorectal | Y | Y | N | N | N | Y | N | N | N | N | N | N | N | N |
| Platell 2003 | OS* | Colorectal | Y | N | Y | N | N | Y | N | N | Y | N | N | N | N | Chemotherapy |
| Smith 2003 | DS*, OS* M*, AL*, APER | Colorectal | Y | Y | Y | N | Y | Y | N | N | N | N | N | Y | N | N |
| McArdle 2004 | OS*, DS*, M |
Colorectal | Y | Y | Y | N | Y | N | Y | N | Y | N | N | Y | N | N |
| Meyerhardt 2003 | OS* | Colon | Y | Y | Y | Y | N | Y | N | Y | N | N | Y | Y | N | N |
| Billingsley 2007 | M* | Colon | Y | Y | Y | N | N | Y | Y | Y | Y | Y | Y | N | N | N |
| Birkmeyer 2002 | M* | Colon | Y | Y | N | N | N | Y | N | Y | Y | N | N | Y | N | N |
| Drolet 2011 | M* | Colon | Y | Y | Y | N | N | Y | N | Y | Y | N | N | Y | N | Procedure type, Insurance status, Laproscopy |
| Elferink 2010A | M* | Colon | Y | Y | Y | N | N | N | N | N | Y | N | Y | N | N | Cancer region. |
| Finlayson 2003 | M* | Colon | Y | Y | N | N | N | Y | Y | Y | Y | N | N | Y | N | Year of procedure |
| Lin 2006 | M* | Colon | Y | Y | N | N | N | Y | N | N | Y | N | N | N | N | N |
| Simunovic 2006 | M* | Colon | Y | Y | N | N | N | Y | Y | N | Y | N | N | N | N | Place of residence |
| Morris 2007 | OS*, M | Colon | Y | Y | Y | N | N | Y | N | Y | N | N | Y | Y | Y | N |
| Simunovic 2000 | OS*, M* | Rectal | N | Y | Y | N | N | Y | N | N | Y | N | Y | N | N | Referral to regional centre. |
|
Purves 2005 |
APER* | Rectal | Y | Y | N | N | N | Y | Y | Y | Y | N | N | N | N | N |
| Wibe 2005 | OS*, M, LR*, AL, APER | Rectal | Y | Y | Y | Y | Y | N | N | N | Y | N | N | N | N | N |
| Meyerhardt 2004 | OS*, LR*, APER* | Rectal | Y | Y | Y | N | N | Y | N | Y | N | N | Y | Y | Y | N |
| Elferink 2010B | M* | Rectal | Y | Y | Y | N | N | N | N | N | Y | N | Y | N | N | Cancer region |
| Harling 2005 | OS, M*, AL*, PS* | Rectal | Y | Y | N | N | Y | N | N | N | Y | N | N | N | N | N |
| Hodgson 2003 | M*, PS* | Rectal | Y | Y | Y | N | Y | Y | Y | Y | Y | N | N | N | N | N |
| Kressner 2009 | OS*, M, AL*, LR | Rectal | Y | Y | Y | N | N | N | N | N | Y | N | N | N | N | Radiotherapy |
| Manchon‐Walsh 2011 | M*, AL, PS | Rectal | Y | Y | Y | N | N | Y | N | N | Y | N | N | Y | N | Procedure type, Year of surgery |
| Ptok 2007 | LR*, APER | Rectal | N | N | Y | N | N | N | N | N | Y | N | N | N | N | Tumour perforation, Type of procedure, CRM |
Abbreviations
*= Outcomes for which prognostic factors were considered in case mix adjusted studies. Abbreviations; OS= Overall five year survival, M= 30 day and in‐patient mortality, LR=Five year local recurrence rate, AL= Anastomotic leak rate, PS= Permanent stoma rate, APER= Abdominoperineal excision of the rectum rate, Y=YES, N=No
Characteristics of participants
Across all studies, a total of 943,728 patients were included in the meta‐analysis; 222,993 patients with colorectal cancer and no further subgroup analysis for colon and rectum, 655,009 patients with colon cancer, and 65,726 patients with rectal cancer. Patients' age and gender were reported in all but six studies (Grabham 1996; Harling 2005; Marusch 2001A; Mella 1997; Mroczkowski 2011; Simons 1997). One study reported on age, but not on gender (Ng 2006). Tumour staging was reported through the International Union against Cancer (UICC) classification in 14 studies (Billingsley 2007; Elferink 2010A; Elferink 2010B; Engel 2005B; Gort 2010; Kressner 2009; Manchon‐Walsh 2011; Martling 2002; Marusch 2001B; Marwan 2010; Mroczkowski 2011; Ptok 2007; Rabeneck 2004; Sjovall 2007), the American Joint Commitee on Cancer (AJCC) staging classification in seven studies (COLOR Study Group; Hodgson 2003; Larson 2008; Rogers 2006; Schrag 2002; Schrag 2003; Zhang 2007), UICC TNM staging classification in four studies (Drolet 2011; Meyerhardt 2003; Meyerhardt 2004; Simunovic 2006) and Dukes' stage in 13 studies (Borowski 2007; Borowski 2010; Carter et al 1995; Debes 2008; Dorrance 2000; Harling 2005; McArdle 2004; McGrath 2005; Mella 1997; Ng 2006; Parry 1999; Smith 2003; Wibe 2005). One study reported tumour stage specifically by presence of localised disease only, lymph node involvement and organ metastases (Harmon 1999). The grade of the tumour was reported in six studies (Debes 2008; Engel 2005B; Meyerhardt 2003; Meyerhardt 2004; Parry 1999; Wibe 2005). Comorbidity was stratified by the Charlson score and it's modifications in 18 studies (Billingsley 2007; Birkmeyer 2002; Dimick 2003; Finlayson 2003; Gort 2010; Harmon 1999; Hodgson 2003; Kuwabara 2009; Lin 2006; Purves 2005; Rabeneck 2004; Rogers 2006; Schrag 2002; Schrag 2003; Simunovic 2000; Smith 2003; Urbach 2004; Zhang 2007), the American Society of Anaesthesiology (ASA) grading system in 10 studies (Borowski 2007; Borowski 2010; Carter et al 1995; Larson 2008; Manchon‐Walsh 2011; Marusch 2001B; Mella 1997; Mroczkowski 2011; Platell 2003; Ptok 2007), performance status in two studies (Meyerhardt 2003; Meyerhardt 2004) and Elixauser system in one study (Drolet 2011). The incidence of neoadjuvant radiotherapy was reported in four of the rectal cancer studies (Engel 2005B; Harling 2005; Martling 2002, Wibe 2005). Urgency of surgery or the mode of presentation was reported in 20 studies (Billingsley 2007; Birkmeyer 2002; Borowski 2007; Borowski 2010; Carter et al 1995; Dimick 2003; Dorrance 2000; Engel 2005A; Finlayson 2003; Grabham 1996; Harmon 1999; Marusch 2001B; McArdle 2004; Mella 1997; Parry 1999; Platell 2003; Schrag 2002; Schrag 2003; Sjovall 2007; Smith 2003).
Patient's ethnicity was reported by 14 studies (Billingsley 2007; Birkmeyer 2002; Finlayson 2003; Hannan 2002; Harmon 1999; Hodgson 2003; Meyerhardt 2003; Meyerhardt 2004; Purves 2005; Rabeneck 2004; Rogers 2006; Schrag 2002; Schrag 2003; Zhang 2007), and socioeconomic status or income data was reported in eight studies (Billingsley 2007; Finlayson 2003; Hodgson 2003; Purves 2005; Rogers 2006; Schrag 2002; Schrag 2003; Zhang 2007).
In studies that reported outcomes for rectal cancer, a definition of the rectum in terms of distance from the anal verge was given as 15 cm, 16cm and 18cm in eight studies, (Borowski 2007; Borowski 2010; Debes 2008; Kressner 2009; Mella 1997; Ng 2006; Smith 2003; Wibe 2005), four studies (Engel 2005B; Manchon‐Walsh 2011; Marusch 2001A; Ptok 2007) and one study (Platell 2003), respectively. ICD‐9 codes and ICD for oncology 3rd edition C20 were used in six studies (Dimick 2003, Harmon 1999; Meyerhardt 2004; Parry 1999; Purves 2005; Rabeneck 2004) and one study (Marwan 2010), respectively.
Characteristics of interventions
Three studies reported the rate of total mesorectal excision in their studies (Debes 2008; Martling 2002; Marusch 2001A). All studies assessed the impact of the intervention(s) on patients based on open abdominal surgery, but may have included some patients who underwent laparoscopic surgery; however, two studies specifically examined laparoscopic surgery for colon cancer (COLOR Study Group; Kuwabara 2009).
Two volume/caseload groups were used in five studies reporting on hospital volume (McGrath 2005; Rabeneck 2004; Simons 1997; Sjovall 2007; Urbach 2004) and five studies reporting on surgeon volume (Carter et al 1995; Debes 2008; Martling 2002; Marwan 2010; McGrath 2005). Three volume/caseload groups were used in 20 studies reporting on hospital volume (Borowski 2010; COLOR Study Group; Drolet 2011; Elferink 2010A; Elferink 2010B; Engel 2005A; Engel 2005B; Finlayson 2003; Gort 2010; Harling 2005; Harmon 1999; Kressner 2009; Manchon‐Walsh 2011; Marusch 2001A; Marusch 2001B; Meyerhardt 2003; Meyerhardt 2004; Mroczkowski 2011; Ptok 2007; Simunovic 2000) and nine studies reporting on surgeon volume (Borowski 2010; Drolet 2011; Gort 2010; Harmon 1999; Larson 2008; McArdle 2004; Mella 1997; Morris 2007; Purves 2005). Four volume/caseload groups were used in 12 studies reporting on hospital volume (Billingsley 2007; Dimick 2003; Hannan 2002; Hodgson 2003; Kuwabara 2009; Parry 1999; Rogers 2006; Schrag 2002; Schrag 2003; Simunovic 2006; Wibe 2005; Zhang 2007) and five surgeon volume studies (Billingsley 2007; Parry 1999; Rogers 2006; Schrag 2002; Schrag 2003). One study reported on surgeon volume, using six volume/caseload groups (Smith 2003). Although two studies reported on the same patient population, both were included in the analysis; volume/caseload groups were taken from only one of these (Borowski 2010), whilst analysis on the effects of specialists was taken from the other (Borowski 2007).
Excluded studies
Twenty‐three studies were excluded as their study period was outside the set inclusion criteria (Beart 1995; Bokey 1997; Crocetti 1996; Dahlberg 1998; Hayanga 2010; Hermanek 1995; Hermanek 1996; Hermanek 1998; Hermanek 1999; Hermanek 2000; Hilska 2004; Holm 1997; Luna‐Perez 1999; Mander 2002; Martling 2000McArdle 1991; Mohner 1990; Paquette 2010; Pata 2008; Porter 1998; Read 2002; Renzulli 2006; Stocchi 2001; Ubhi 1995 ). Volume/caseload analysis were not performed in six studies (Easson 2002; McArdle 2002; Jestin 2004; Shankar 2001; Singh 1995; Smedh 2001). Three studies did not report any of the measured outcome variables (Miller 2004; Yasunaga 2009a; Yasunaga 2009b). Local recurrence follow‐up for fewer than five years was reported by four studies (Dorrance 1997; Kapiteijn 1998; Machado 2000; Syk 2010). Overall survival was reported by two studies for two years only in two studies (Kee 1999; Machado 2000). The study cohort in two studies were not exclusively cancer patients (Callahan 2003; Hayanga 2010), one study (Schrag 2000) had data previously used in an included study (Schrag 2003), and we did not identify a reference group in the analyses in one study (Ho 2006).
Risk of bias in included studies
1.
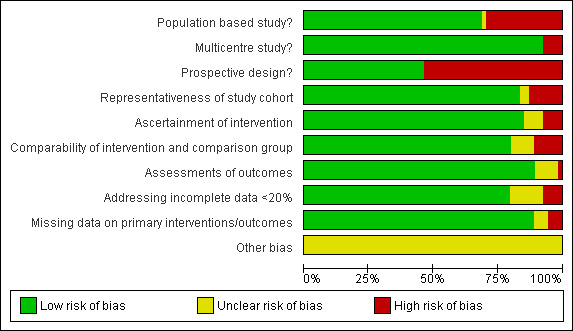
Risk of bias graph: review authors' judgements about each risk of bias item presented as percentages across all included studies.
2.

Risk of bias summary: review authors' judgements about each risk of bias item for each included study.
Overall, participants in included studies were satisfactorily representative of colorectal/colon/rectal cancer patients (85%). We judged study design to be satisfactory across studies as approximately fifty percent (50%) of included studies were prospective and approximately ninety percent (90%) were population based and multi‐centred. We judged the ascertainment of interventions and outcomes to be objective across all included studies (88% and 90% respectively). Comparability of intervention and comparison/control group in included studies was satisfactory in our judgement (80%). Missing data on interventions and outcomes in included studies were dealt with satisfactorily (80% and 90% respectively). There was no significant publication bias (see Figure 3).
3.
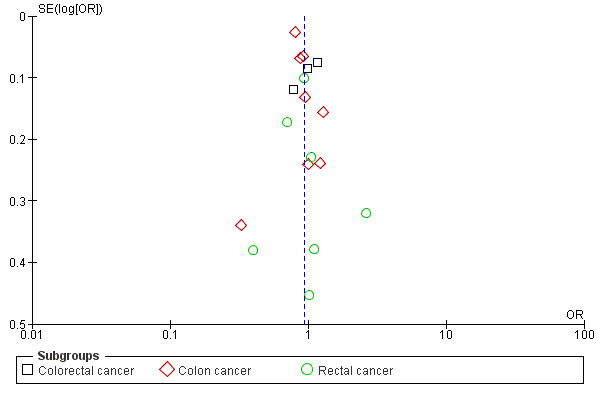
Funnel plot based on hospital volume and the adjusted operative mortality
4 Hospital volume (adjusted analysis), outcome: 4.2 Inpatient and 30 day mortality.
Effects of interventions
See: Table 1; Table 2; Table 3; Table 4; Table 5
Hospital volume
Overall 5‐year survival for unadjusted studies
1.1. Analysis.

Comparison 1 Hospital volume (unadjusted analysis), Outcome 1 Overall five year survival.
The meta‐analyses of two studies (Rabeneck 2004; Rogers 2006), including 36,858 colorectal cancer patients, showed a significant effect on the five‐year risk of death in favour of high volume hospitals (HR=0.88, 95 %CI 0.80 to 0.98), but had significant heterogeneity between the two studies (i2=94%). In contrast, there was no significant benefit associated with high‐volume hospitals for colon cancer surgery (HR=0.94, 95% CI 0.84 to 1.05) for 22,464 patients from three studies (Borowski 2010; Meyerhardt 2003; Mroczkowski 2011), and for rectal cancer surgery (HR=0.92, 95%CI 0.79 to 1.07) for 13,021 patients in seven studies (Borowski 2010; Harling 2005; Kressner 2009; Meyerhardt 2004; Schrag 2002; Simons 1997; Wibe 2005). There was significant heterogeneity between the colon cancer and rectal cancer studies (I2=97%, and I2=97%, respectively). When all patients from included colorectal, colon and rectal cancer studies with unadjusted data were combined, there was no significant hospital‐volume effect on 5‐year survival (HR=0.92, 95% CI 0.81 to 1.04). Interestingly, the meta‐analysis of the unadjusted data from studies originating from other countries than the United States (Borowski 2010; Harling 2005; Kressner 2009; Mroczkowski 2011; Wibe 2005) was not significant (HR=0.97, 95% CI 0.90 ‐ 1.04), whereas US data (Meyerhardt 2003; Meyerhardt 2004; Rabeneck 2004; Rogers 2006; Schrag 2002; Simons 1997) suggested a significant benefit for high‐volume hospitals (HR=0.87, 95% CI 0.78 to 0.96).
Overall 5‐survival year for studies with case‐mix adjustment
4.1. Analysis.

Comparison 4 Hospital volume (adjusted analysis), Outcome 1 Overall five year survival.
Two studies (Rabeneck 2004; Rogers 2006), including 36,858 colorectal cancer patients, and four studies (Borowski 2010; Meyerhardt 2004; Simunovic 2000; Wibe 2005), including 5,100 rectal cancer patients, used case‐mix adjustment. Both meta‐analyses demonstrated a significant benefit in 5‐year overall survival associated with high‐volume hospital care (HR=0.90, 95% CI 0.84 to 0.95, and HR=0.85, 95% CI 0.77 to 0.93, respectively); there was significant heterogeneity between colorectal cancer studies (I2=60%), but not between rectal cancer studies (I2=0%). In contrast, no significant volume‐outcome relationship was demonstrated in the meta‐analysis of two case‐mix adjusted studies (Borowski 2010; Meyerhardt 2003), assessing 5,211 patients with colon cancer (HR=0.97, 95% CI 0.77 to 1.22); there was significant heterogeneity between the two studies (I2=88%). Across all 55,169 patients included in the meta‐analysis, however, there remained a significant effect in favour of high volume hospitals (HR=0.90, 95% CI 0.85 to 0.96). Similar to the analysis of studies with unadjusted survival data, two non‐US based studies (Borowski 2010; Wibe 2005) demonstrated no significant effect (HR=0.93, 95% CI 0.77 to 1.13), whilst US data (Meyerhardt 2003; Meyerhardt 2004; Rabeneck 2004; Rogers 2006; Simunovic 2000) suggested better survival in high‐volume hospitals (HR=0.90, 95% CI 0.87 to 0.93).
Operative mortality for unadjusted studies
1.2. Analysis.

Comparison 1 Hospital volume (unadjusted analysis), Outcome 2 Inpatient and 30 day mortality.
Meta‐analyses of seven studies on colorectal cancer (Dimick 2003; Engel 2005A; Hannan 2002; Parry 1999; Rogers 2006; Urbach 2004; Zhang 2007), assessing 113,795 patients, and seven rectal cancer studies (Borowski 2010; Harling 2005; Hodgson 2003; Kressner 2009; Schrag 2002; Simunovic 2000; Wibe 2005), including 18,383 patients, did not show significant differences in mortality rates between high and low volume hospitals (OR=0.74, 95% CI 0.55 to 1.00, and OR=0.75, 95% CI 0.54 to 1.05, respectively). The analyses showed significant heterogeneity amongst the colorectal (I2=95%) and rectal cancer studies (I2=75%). Conversely, the meta‐analyses of 14 studies (Billingsley 2007; Birkmeyer 2002; Borowski 2010; COLOR Study Group; Drolet 2011; Finlayson 2003; Hannan 2002; Kuwabara 2009; Lin 2006; Marusch 2001B; Mroczkowski 2011; Schrag 2003; Simunovic 2006; Sjovall 2007), including 309,693 colon cancer patients, showed a significant difference in mortality rates in favour of high volume hospitals (OR=0.75, 95% CI 0.67 to 0.83), with significant heterogeneity between individual studies (I2=78%). Nonetheless, the overall effect of higher hospital volume for all colorectal, colon and rectal cancer patients was significant (OR=0.75, 95% CI 0.68 to 0.84). Of interest, most studies reporting unadjusted mortality data originated from the United States; the meta‐analysis of studies reporting from countries other that the US (Borowski 2010; COLOR Study Group; Engel 2005A; Harling 2005; Kressner 2009; Kuwabara 2009; Lin 2006; Marusch 2001A; Mroczkowski 2011; Parry 1999; Simunovic 2000; Simunovic 2006; Sjovall 2007; Urbach 2004; Wibe 2005) revealed no association between caseload and mortality (OR=0.93, 95% CI 0.81 to 1.06), whereas US‐based studies (Billingsley 2007; Birkmeyer 2002; Dimick 2003; Drolet 2011; Finlayson 2003; Hannan 2002; Harmon 1999; Hodgson 2003; Rogers 2006; Schrag 2002; Schrag 2003; Zhang 2007) overall suggested a significant effect (OR=0.63, 95% CI 0.57 to 0.70).
Operative mortality for studies with case‐mix adjustment
4.2. Analysis.
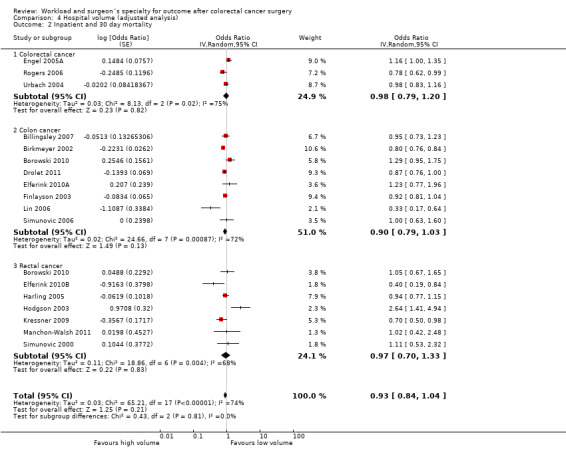
Comparison 4 Hospital volume (adjusted analysis), Outcome 2 Inpatient and 30 day mortality.
Including only studies that used case‐mix adjustment, there was no significant volume‐outcome relationship for operative mortality amongst three colorectal cancer studies (Engel 2005A; Rogers 2006; Urbach 2004), including a total of 77,823 patients (OR=0.98, 95% CI 0.79 to 1.20), eight colon cancer studies (Billingsley 2007; Birkmeyer 2002; Borowski 2010; Drolet 2011; Elferink 2010A; Finlayson 2003; Lin 2006; Simunovic 2006), including 302,978 patients (OR=0.90, 95% CI 0.79, 1.03), and seven rectal cancer studies (Borowski 2010; Elferink 2010B; Harling 2005; Hodgson 2003; Kressner 2009; Manchon‐Walsh 2011; Simunovic 2000), including 33,747 patients (OR=1.07, 95% CI 0.76 to 1.50). However there was significant heterogeneity between the studies for colorectal, colon and rectal cancer (I2=83%, I2=72%, I2=68%, respectively). The overall effect of hospital volume on in‐patient and 30 day mortality for all colorectal, colon and rectal cancer patients was not significant (OR=0.95, 95% CI 0.85 to 1.05). Stratified by country, adjusted data on hospital caseload from non‐US studies (Borowski 2010; Engel 2005A; Harling 2005; Kressner 2009; Lin 2006; Simunovic 2000; Simunovic 2006; Urbach 2004) equally did not suggest a significant association (OR=0.95, 95% CI 0.80 to 1.14), whereas US data (Billingsley 2007; Birkmeyer 2002; Drolet 2011; Finlayson 2003; Kressner 2009; Rogers 2006; Simunovic 2000; Simunovic 2006) suggested a greater, but still not a significant hospital effect (OR=0.89, 95% CI 0.79 to 1.01).
Five‐year local recurrence for unadjusted studies
1.3. Analysis.

Comparison 1 Hospital volume (unadjusted analysis), Outcome 3 Five year local recurrence rate.
Meta‐analyses of four rectal cancer studies (Engel 2005B; Meyerhardt 2004; Ptok 2007; Wibe 2005), totaling 3,870 patients, demonstrated significantly lower risk of local recurrence within five years in favour of high volume hospitals (HR=0.70, 95% CI 0.53 to 0.91). There was moderate heterogeneity between the studies (I2=55%).
Five‐year local recurrence for studies with case‐mix adjustment
4.3. Analysis.

Comparison 4 Hospital volume (adjusted analysis), Outcome 3 Five year local recurrence rate.
Although meta‐analysis on 2,986 patients in three rectal cancer studies (Meyerhardt 2004; Ptok 2007; Wibe 2005) demonstrated an effect in favour of high volume hospitals, this was not statistically significant (HR=0.77, 95% CI 0.51 to 1.16) and there was significant heterogeneity between the studies (I2=72%).
Anastomotic leak rate for unadjusted studies
1.4. Analysis.

Comparison 1 Hospital volume (unadjusted analysis), Outcome 4 Anastomotic leak rate.
Meta‐analyses of three colon cancer studies (Borowski 2010; COLOR Study Group; Marusch 2001B), assessing 4,568 patients, and five rectal cancer studies (Borowski 2010; Harling 2005; Manchon‐Walsh 2011; Marusch 2001A; Wibe 2005), assessing 4,962 patients, did not show significant effect attributable to high‐volume hospitals (OR=1.26, 95% CI 0.66 to 2.41, and OR=1.1, 95% CI 0.77‐1.61, respectively). There was moderate heterogeneity between the studies (I2=56%, and I2= 58%, respectively). The overall effect of hospital volume on colon and rectal cancer patients was not significant (OR=1.1, 95% CI 0.77 to 1.61).
Anastomotic leak rate for studies with case‐mix adjustment
4.4. Analysis.

Comparison 4 Hospital volume (adjusted analysis), Outcome 4 Anastomotic leak rate.
Using odds ratios to compare the risk of anastomotic leaks between high and low volume hospitals, one study (Borowski 2010) assessed 2,808 colon cancer patients and showed a greater risk for anastomotic leak in high volume hospitals (OR=1.44, 95% CI 0.80 to 2.59), but this was not statistically significant. In contrast, meta‐analysis of three studies (Borowski 2010; Harling 2005; Kressner 2009), assessing 13,040 rectal cancer patients, demonstrated significantly lower odds for anastomotic leaks in favour of high volume hospitals (OR=0.77, 95% CI 0.61 to 0.97). There was no heterogeneity between the rectal cancer studies (I2=0%). The overall effect of hospital volume on anastomotic leak rates for colon and rectal cancer surgery was in favour of high‐volume hospitals, but this was not significant (OR=0.87, 95% CI 0.63 to 1.18).
Permanent stoma rate for unadjusted studies
1.5. Analysis.
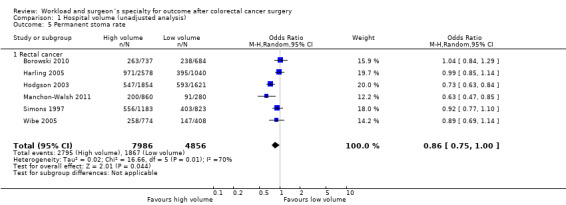
Comparison 1 Hospital volume (unadjusted analysis), Outcome 5 Permanent stoma rate.
Six rectal cancer studies (Borowski 2010; Harling 2005; Hodgson 2003; Manchon‐Walsh 2011; Simons 1997; Wibe 2005), including 12,852 patients, did not show a significant difference between high and low volume hospitals (OR=0.86, 95% CI 0.75 to 1.00); there was significant heterogeneity between the studies (I2=70%)
Permanent stoma rate for studies with case‐mix adjustment
4.5. Analysis.
Comparison 4 Hospital volume (adjusted analysis), Outcome 5 Permanent stoma rate.
In contrast to the findings in unadjusted analysis, the meta‐analysis of four studies (Harling 2005; Hodgson 2003; Meyerhardt 2004; Rogers 2006), assessing 15,475 rectal cancer patients, showed statistically significant lower risk of permanent stoma formation in favour of higher volume hospitals (OR=0.64, 95% CI 0.45 to 0.90). There was significant heterogeneity between the studies (I2=90%).
APER rate for unadjusted studies
1.6. Analysis.

Comparison 1 Hospital volume (unadjusted analysis), Outcome 6 Abdominoperineal excision of rectum rate.
Meta‐analysis of nine studies (Engel 2005B; Harmon 1999; Marusch 2001A; McGrath 2005; Meyerhardt 2004; Parry 1999; Ptok 2007; Schrag 2002; Wibe 2005), totaling 7,609 rectal cancer patients, showed significant differences between high and low volume hospitals (OR=0.80, 95% CI 0.65 to 0.99). There was significant heterogeneity between the studies (I2=76%)
APER rate for studies with case‐mix adjustment
4.6. Analysis.
Comparison 4 Hospital volume (adjusted analysis), Outcome 6 Abdominoperineal excision of the rectum rate.
One study of 1330 rectal cancer patients (Meyerhardt 2004) showed a statistically significant lower odds of APER (OR=0.55, 95% CI 0.42 to 0.72) in favour of high volume hospitals.
Surgeon volume
Overall 5‐year survival for unadjusted studies
2.1. Analysis.

Comparison 2 Surgeon volume (unadjusted analysis), Outcome 1 Overall five year survival.
Meta‐analysis of two colorectal cancer studies (McArdle 2004; Rogers 2006), assessing 17,232 patients, and three rectal cancer studies on 3,279 patients (Borowski 2010; Debes 2008; Schrag 2002) showed a lower risks of death within five years in favour of high volume surgeons (HR=0.86, 95% CI 0.82 to 0.90, and HR=0.85, 95% CI 0.78 to 0.94, respectively). There was no significant heterogeneity between the colon cancer and rectal cancer studies (I2=17% and I2=34%, respectively). Meta‐analysis of two studies (Borowski 2010; Morris 2007), assessing 3,670 colon cancer patients, did show similarly low risk of death in favour of high‐volume surgeons (HR=0.85, 95% CI 0.71 to 1.02), but failed to reach statistical significance. There was significant heterogeneity between the studies (I2=83%). The overall effect of surgeon volume on colorectal, colon and rectal cancer surgery for overall five year survival was significant, and in favour of higher caseload (HR=0.85, 95% CI 0.81 to 0.90). Contrasting with findings relating to hospital volume, there were no differences between US (Rogers 2006; Schrag 2002) and non‐US data (Borowski 2010; Debes 2008; McArdle 2004; Morris 2007) in stratified analysis of surgeon caseload (HR=0.84, 95% CI 0.81 to 0.88, and HR=0.87, 95% CI 0.80 to 0.95, respectively).
Overall 5‐year survival for studies with case‐mix adjustment
5.1. Analysis.

Comparison 5 Surgeon volume (adjusted analysis), Outcome 1 Overall five year survival.
Meta‐analyses of two colorectal cancer studies (McArdle 2004; Rogers 2006), assessing 17,232 patients, showed a lower risk of death within five years in favour of high volume surgeons (HR=0.87, 95%CI 0.82 to 0.92). There was no heterogeneity between the two studies (I2=0%). Using a hazard ratio to compare the survival between high volume and low volume surgeons, one study (Borowski 2010), study assessing 2,907 patients, showed a lower risk of death within five years (HR=0.84, 95% CI 0.76 to 0.93) for colon cancer surgery in favour of high volume surgeons. However for 1,903 rectal cancer patients in the same study (Borowski 2010), the relationship was not significant (HR=0.99, 95%CI 0.86 to 1.14). The overall effect of surgeon volume on colorectal, colon and rectal cancer surgery for overall five year survival, however, remained significant in favour of higher surgeon caseload (HR=0.88, 95% CI 0.83 to 0.93).
Five‐year disease specific survival for unadjusted studies
2.2. Analysis.
Comparison 2 Surgeon volume (unadjusted analysis), Outcome 2 Five year disease specific survival.
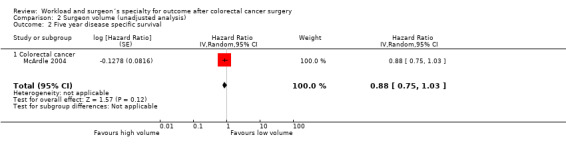
Only one study on 1,416 colorectal cancer patients (McArdle 2004) was found to report on the disease‐specific survival; it demonstrated no significant surgeon volume‐outcome association (HR=0.88, 95% CI 0.75 to1.03).
Five‐year disease specific survival for studies with case‐mix adjustment
5.2. Analysis.

Comparison 5 Surgeon volume (adjusted analysis), Outcome 2 Five year disease specific survival.
In case‐mix adjusted analysis, the same study (McArdle 2004) did also not demonstrate a significant effect for higher surgeon caseload, both for colon cancer (HR=0.99, 95% CI 0.76 to 1.29) and rectal cancer (HR=0.88, 95% CI 0.65 to 1.19).
Operative mortality for unadjusted studies
2.3. Analysis.

Comparison 2 Surgeon volume (unadjusted analysis), Outcome 3 Inpatient and 30 day mortality.
Meta‐analyses of five colorectal cancer studies (Harmon 1999; McArdle 2004; Mella 1997; Parry 1999; Rogers 2006), including 23,644 patients, seven colon cancer studies (Billingsley 2007; Borowski 2010; Drolet 2011; Finlayson 2003; Hannan 2002; Morris 2007; Schrag 2003) including 152,231 patients, and four rectal cancer studies (Borowski 2010; Martling 2002; McGrath 2005; Schrag 2002) including 5,740 patients, showed significant associations between surgeon caseload and mortality in favour of high volume (OR=0.65, 95% CI 0.56 to 0.76, OR=0.62, 95% CI 0.51 to 0.76, and OR=0.73, 95% CI 0.53 to 0.98, respectively). There was minimal heterogeneity between colorectal cancer studies and rectal cancer studies (I2=9% and I2=28%, respectively), and significant heterogeneity between colon cancer studies (I2=89%). The overall effect of surgeon volume on colon, rectal and colorectal patients across all studies was significant (OR=0.65, 95% CI 0.57 to 0.75). Both US based (Billingsley 2007; Drolet 2011; Finlayson 2003; Hannan 2002; Harmon 1999; Rogers 2006; Schrag 2002; Schrag 2003) and non‐US based studies (Borowski 2010; Martling 2002; McArdle 2004; McGrath 2005; Mella 1997; Morris 2007; Parry 1999) reported significant associations between surgeon caseload and mortality (OR=0.63, 95% CI 0.54 to 0.74, and OR=0.73, 95% CI 0.54 to 0.97, respectively)
Operative mortality for studies with case‐mix adjustment
5.3. Analysis.

Comparison 5 Surgeon volume (adjusted analysis), Outcome 3 Inpatient and 30 day mortality.
Meta‐analyses of four colon cancer studies (Borowski 2010; Billingsley 2007; Drolet 2011; Rogers 2006), including 57,995 patients, showed a significantly lower risk of operative death in favour of high volume surgeons (OR=0.75, 95% CI 0.62 to 0.92). There was significant heterogeneity between studies (I2=71%). However for rectal cancer surgery, meta‐analyses of two studies (Borowski 2010; Rogers 2006) assessing 5,537 patients did not show significant odds in favour of high volume surgeons (OR=0.86, 95% CI 0.62 to 1.19). There was no heterogeneity between the rectal cancer studies (I2=0%). The overall effect of surgeon volume on colon and rectal cancer surgery combined was significant in favour of higher caseload (OR=0.77, 95% CI 0.66 to 0.91), and there was no difference between US‐based (Billingsley 2007; Drolet 2011; Rogers 2006) and one non‐US based study (Borowski 2010) that reported case‐mix adjusted data (OR=0.81, 95% CI 0.66 to 0.99, and OR=0.66, 95% CI 0.51 to 0.87, respectively).
Anastomotic leak rate for unadjusted studies
2.4. Analysis.
Comparison 2 Surgeon volume (unadjusted analysis), Outcome 4 Anastomotic leak rate.
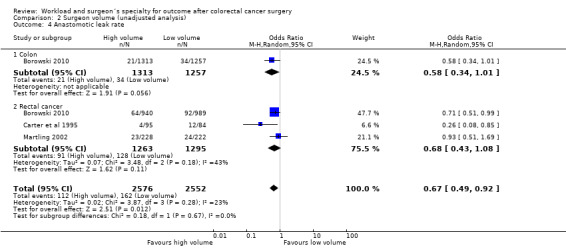
One study (Borowski 2010) assessed the risk of anastomotic leaks for 2,570 patients with colon cancer in favour of high volume surgeons, but this failed to reach statistical significance (OR=0.58, 95 %CI 0.34 to 1.01). Meta‐analyses of three rectal cancer studies (Borowski 2010; Carter et al 1995; Martling 2002) assessing a total of 2,558 patients did also not show a significant difference in anastomotic leak rate in favour of high volume surgeons (OR=0.68, 95%CI 0.43 to 1.08); there was moderate heterogeneity between the rectal cancer studies (I2=43%). However, the overall effect of surgeon volume on colon and rectal cancer surgery was significantly in favour of high‐volume surgeons (OR=0.67, 95% CI 0.49 to 0.92).
Anastomotic leak rate in studies with case‐mix adjustment
5.4. Analysis.
Comparison 5 Surgeon volume (adjusted analysis), Outcome 4 Anastomotic leak rate.
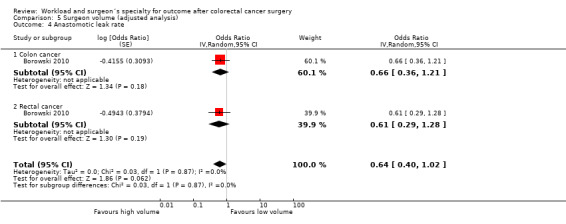
One study (Borowski 2010) assessed the risk of anastomotic leakage in a population of 2,570 colon cancer and 1,929 rectal cancer patients, with no significant effect in either group (OR=0.66, 95 %CI 0.36 to 1.21, and OR=0.61, 95 %CI 0.29 to 1.28, respectively), or combined for all included colorectal cancer patients (OR=0.64, 95%CI 0.40 to 1.02)
Permanent stoma rate for unadjusted studies
2.5. Analysis.

Comparison 2 Surgeon volume (unadjusted analysis), Outcome 5 Permanent stoma rate.
The meta‐analyses of three rectal cancer studies (Borowski 2010; Carter et al 1995; Martling 2002), including 2,235 patients, showed a significantly lower risk of permanent stoma for high‐volume surgeons (OR= 0.75, 95 % CI 0.62 to 0.89). There was no heterogeneity between the studies (I2=0%).
Permanent stoma rate for studies with case‐mix adjustment
5.5. Analysis.

Comparison 5 Surgeon volume (adjusted analysis), Outcome 5 Permanent stoma rate.
Two rectal cancer studies (Borowski 2010; Rogers 2006), assessing 8,955 patients, demonstrated showed significantly lower risk of a permanent stoma for surgery carried out by high‐volume surgeons (0.75, 95% CI 0.64 to 0.88) . There was no heterogeneity between the studies (I2=0%).
APER rate for unadjusted studies
2.6. Analysis.

Comparison 2 Surgeon volume (unadjusted analysis), Outcome 6 Abdominoperineal excision of the rectum.
In the meta‐analyses of seven rectal cancer studies (Harmon 1999; Martling 2002; Marwan 2010; McGrath 2005; Parry 1999; Purves 2005; Schrag 2002), assessing a total of 4,348 patients showed significantly lower risk of APER for patients operated on by a high‐volume surgeons (OR=0.66, 95%CI 0.52 to 0.84); there was significant heterogeneity between studies (I2=62%).
APER rate for studies with case‐mix adjustment
5.6. Analysis.

Comparison 5 Surgeon volume (adjusted analysis), Outcome 6 Abdominoperineal excision of rectum rate.
One study examined the risk of APER (Purves 2005) in a cohort of 180 rectal cancer patients, with significantly lower risk for those patients treated by high‐volume surgeons (OR=0.75, 95% CI 0.64 to 0.88).
Surgeon Specialization
Overall 5‐year survival for unadjusted studies
3.1. Analysis.

Comparison 3 Surgeon specialization (unadjusted analysis), Outcome 1 Overall five year survival.
Meta‐analyses of two colorectal cancer studies (Borowski 2007; McArdle 2004, Platell 2003), including 14,628 patients, one colon cancer study (Smith 2003), assessing 3,122 patients, and two rectal cancer studies (Ng 2006; Smith 2003), including 1,617 patients, showed significant reduction in the risk of death within five years of treatment in favour of specialist surgeons (HR=0.87, 95% CI 0.83 to 0.91, HR=0.89, 95% CI 0.84 to 0.94, and HR=0.78, 95% CI 0.72 to 0.85, respectively). There was no heterogeneity between colorectal cancer studies and rectal cancer studies (I2=0%), respectively. The total effect of surgeon specialization on colorectal, colon and rectal cancer surgery was significant in favour of specialist surgeons (HR=0.85, 9d% CI 0.82 to 0.89).
Overall 5‐year survival for studies with case‐mix adjustment
6.1. Analysis.

Comparison 6 Surgeon specialization (adjusted analysis), Outcome 1 Overall five year survival.
Meta‐analyses of four studies (Borowski 2007; McArdle 2004; Platell 2003; Smith 2003), including a total of 14,628 colorectal cancer patients, showed a significant reduction in the risk of death within five years after treatment in favour of specialist surgeons (HR=0.81, 95% CI 0.71 to 0.94). There was significant heterogeneity between the studies (I2=87%).
Five‐year disease specific survival for unadjusted studies
3.2. Analysis.

Comparison 3 Surgeon specialization (unadjusted analysis), Outcome 2 Five year disease specific survival.
Based on the reported hazard ratio to compare specialists and non‐specialist surgeons, one study (McArdle 2004) assessed 2,186 colorectal cancer patients and showed a significant reduction in cancer‐related death in favour of specialist surgeons (HR=0.75, 95% CI 0.65 to 0.87)
Five‐year disease specific survival for studies with case‐mix adjustment
6.2. Analysis.
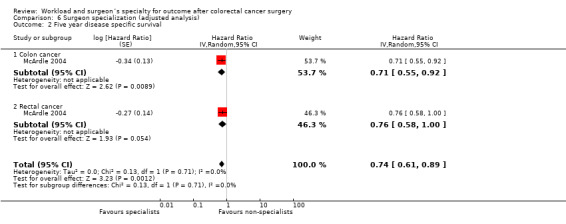
Comparison 6 Surgeon specialization (adjusted analysis), Outcome 2 Five year disease specific survival.
In case‐mix adjusted analysis, the same study (McArdle 2004) showed also a significant reduction in cancer‐related death for the subgroup of patients with colon cancer (HR=0.71, 95% CI 0.55 to 0.92). However, for rectal cancer, the difference in the risk of cancer‐related death failed to reach statistical significance (HR=0.76, 95%CI 0.58 to 1.00). The total effect of specialization on colon and rectal cancer, however, was significant in favour of specialist surgeons (HR=0.74, 95%CI 0.61 to 0.89).
Operative mortality for unadjusted studies
3.3. Analysis.

Comparison 3 Surgeon specialization (unadjusted analysis), Outcome 3 Inpatient and 30 day mortality.
The meta‐analysis of five colorectal cancer studies (Borowski 2007; Dorrance 2000; McArdle 2004; Mella 1997; Smith 2003) included 17,222 patients, and showed a significant difference in the risk of operative death in favour of specialist surgeons (HR=0.73, 95% CI 0.57 to 0.94). There was, however, significant heterogeneity between the studies (I2=65%).
Operative mortality for studies with case‐mix adjustment
6.3. Analysis.

Comparison 6 Surgeon specialization (adjusted analysis), Outcome 3 Inpatient and 30 day mortality.
Two colorectal cancer studies (Borowski 2007; Smith 2003), assessing 11,973 patients, showed a significant difference in the odds of mortality in favour of specialist surgeons (OR=0.74, 95% CI 0.60 to 0.91). There was no significant heterogeneity between within the studies (I2=31%).
Five‐year local recurrence for unadjusted studies
3.4. Analysis.

Comparison 3 Surgeon specialization (unadjusted analysis), Outcome 4 Five year local recurrence.
The meta‐analysis of two rectal cancer studies (Ng 2006; Smith 2003), assessing 1,028 patients, showed a lower risk of local recurrence within five years after surgery in favour of specialist surgeons (HR=0.55, 95% CI 0.40 to 0.75). There was no heterogeneity between the studies. Using the hazards ratio of one study (Smith 2003), reporting on 1,766 colon cancer patients, demonstrated a significantly lower risk of local recurrence of cancer within five years in favour of specialist surgeons (HR=0.61, 95% CI 0.48 to 0.78)
Five‐year local recurrence for studies with case‐mix adjustment
6.4. Analysis.

Comparison 6 Surgeon specialization (adjusted analysis), Outcome 4 Five year local recurrence rate.
One study (Smith 2003) with a total of 2,587 colorectal cancer patients demonstrated a significantly lower risk of local recurrence of cancer in favour of specialist surgeons (HR=0.56, 95% CI 0.44 to 0.71).
Anastomotic leak rate for unadjusted studies
3.5. Analysis.
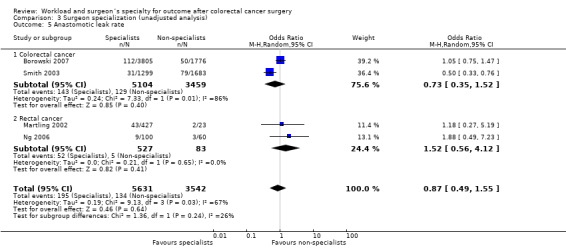
Comparison 3 Surgeon specialization (unadjusted analysis), Outcome 5 Anastomotic leak rate.
Across two colorectal cancer studies (Borowski 2007; Smith 2003), including 8,563 patients, and two rectal cancer studies (Martling 2002; Ng 2006), including 610 patients, there was no significant association between incidence of anastomotic leaks and surgical specialisation (OR=0.73, 95% CI 0.35 to 1.52, and OR=1.52, 95% CI 0.56 to 4.12, respectively). There was no heterogeneity between rectal cancer studies (I2=0%), however, there was significant heterogeneity between colorectal cancer studies (I2=86%). The total effect of surgeon specialization on colorectal and rectal cancer surgery remained not significant (OR=0.87, 95% CI 0.49 to 1.55).
Anastomotic leak rate for studies with case‐mix adjustment
6.5. Analysis.

Comparison 6 Surgeon specialization (adjusted analysis), Outcome 5 Anastomotic leak rate.
The meta‐analysis of two studies (Borowski 2007; Smith 2003), reporting on a total of 8,563 colorectal cancer patients, demonstrated no significant association between anastomotic leaks and specialisation (OR=0.71, 95% CI 0.31 to 1.63); there was significant heterogeneity between the studies (I2=90%).
Permanent stoma rate for unadjusted studies
3.6. Analysis.

Comparison 3 Surgeon specialization (unadjusted analysis), Outcome 6 Permanent stoma rate.
A total of 2,885 patients were included in the meta‐analysis of three rectal cancer studies (Borowski 2007; Martling 2002; Ng 2006); overall, there was a greater chance for patients of specialists to have restorative surgery and avoid a potentially permanent stoma, but this failed to reach statistical significance (OR=0.66, 95% CI 0.43 to 1.02). There was moderate heterogeneity between the studies (I2=58%).
Permanent stoma rate for studies with case‐mix adjustment
6.6. Analysis.

Comparison 6 Surgeon specialization (adjusted analysis), Outcome 6 Permanent stoma rate.
One study (Borowski 2007) assessed 2,026 colorectal cancer patients, and demonstrated a significantly lower risk of a potentially permanent stoma for patients of specialist surgeons (0.70, 95% CI 0.53 to 0.94).
APER rate for unadjusted studies
3.7. Analysis.

Comparison 3 Surgeon specialization (unadjusted analysis), Outcome 7 Abdominoperineal excision of the rectum rate.
Meta‐analysis of three rectal cancer studies (Borowski 2007; Martling 2002; Ng 2006), assessing 2,184 patients, did not show a significant difference in the odds of having an APER in favour of specialist surgeons (OR=0.74, 95% CI 0.52 to 1.04). There was moderate heterogeneity between the studies although not significant.
Discussion
The aim of this review and meta‐analyses was to determine the presence and size of the volume‐outcome relationship in colon and rectal cancer surgery, and to quantify the effect of specialist status on surgical outcomes. The most notable shortfall in the reviewing process was posed by the heterogeneity in volume and specialist definitions encountered in the individual studies, precluding an overall judgement on specific minimum volume standards and specialist credentials. Nonetheless, the findings of the meta‐analysis can direct the process of service organisation in a modern healthcare system, and inform the debate on further centralisation of colorectal cancer services.
Summary of main results
This review and meta‐analyses generally supported the suggestion that high‐volume care and specialisation is associated with better outcome; high‐volume providers and specialists achieved at least similar, and frequently better results than low‐volume hospitals, surgeons and non‐specialists, respectively. The majority of studies reported on one or both primary outcomes (5‐year overall survival and operative mortality), providing the best evidence; for some of the secondary outcomes, very few, or no studies were found to report the effects of volume or specialisation. There were more studies that reported on unadjusted outcomes than studies that reported on adjusted data, and most studies with adjusted data also provided data that were included in the analysis of unadjusted data. Meta‐analyses were carried out separately at the level of the hospital and surgeon, in order to distinguish their individual effects; due to the heterogeneity of the data, the use of multilevel modelling to allow for clustering (Leyland 2001), occasionally used in individual population studies, would therefore not be suitable.
Overall effect for colorectal cancer (including data on colon and rectum surgery)
Using case‐mix adjusted data, overall 5‐year survival was significantly improved for patients with colon, rectum and colorectal cancer treated in high‐volume hospitals (HR=0.90, 95% CI 0.85 to 0.96), by high‐volume surgeons (HR=0.88, 95% CI 0.83 to 0.93) and colorectal specialists (HR=0.81, 95% CI 0.71 to 0.94); the meta‐analysis of unadjusted data did support this further. Operative mortality across all studies in meta‐analysis of case‐mix adjusted data was significantly better for high‐volume surgeons (OR=0.77, 95% CI 0.66 to 0.91) and specialists (OR=0.74, 95% CI 0.60 to 0.91); the results of the unadjusted studies were similar. In contrast, there was no significant association between higher hospital caseload and operative mortality in analysis of case‐mix adjusted studies (OR=0.95, 95% CI 0.85 to 1.05), although the unadjusted data on a considerably larger number of patients suggested a significant association (OR=0.74, 95% CI 0.68 to 0.84).
It is of interest that the majority of hospital‐volume studies from the United States did report on unadjusted data only; if these studies were removed from the mortality analysis, the meta‐analysis of the unadjusted non‐US data revealed no significant association between hospital caseload and mortality (OR=0.93, 95% CI 0.81 to 1.06), whereas the US‐based data suggested a significant effect (OR=0.63, 95% CI 0.57 to 0.70). Stratified by their origin, case‐mix adjusted data from US and non‐US sources both did not suggest a significant association (OR=0.89, 95% CI 0.79 to 1.01, and OR=0.95, 95% CI 0.80 to 1.14, respectively), highlighting the importance of case‐mix adjustment. Five‐year overall survival was not associated with higher hospital caseload in non‐US studies for unadjusted (HR=0.97, 95% CI 0.90 to 1.04) and case‐mix adjusted data (HR=0.93, 95% CI 0.77 to 1.13), whereas US data suggested a significant hospital effect in unadjusted and adjusted analysis (HR=0.87, 95% CI 0.78 to 0.96, and HR=0.90, 95% CI 0.87 to 0.93, respectively). The mortality and survival analysis for surgeon caseload, in contrast, did not show differences between US and non‐US data, with a significant effect in both settings.
The examined secondary outcomes included the risk for anastomotic leaks as a major surgical complication; there was no significant association with hospital volume (OR=0.87, 95% CI 0.63 to 1.18), in fact, the association between higher hospital volume and anastomotic leak rate was somewhat inverse in the meta‐analysis of unadjusted data (OR=1.1, 95% CI 0.77 to 1.61). For surgeon caseload, the risk of anastomotic leaks was significantly lower for high‐volume surgeons across unadjusted studies (OR=0.67, 95% CI 0.49 to 0.92), but failed to reach statistical significance in the smaller cohort of patients included in the meta‐analysis of case‐mix adjusted studies (OR=0.64, 95% CI 0.40 to 1.02). There was further a considerable, but not significant benefit associated with specialist status of the surgeon (OR=0.71, 95% CI 0.31 to 1.63), based on two UK studies using the same definition for colorectal specialists
Colon cancer
Neither 5‐year survival (HR=0.97, 95% CI 0.77 to 1.22), nor operative mortality (OR=0.90, 95% CI 0.79, 1.03) was associated with higher hospital volume in the meta‐analysis of case‐mix adjusted data; the analysis of unadjusted studies, however, suggested the presence of a significant effect on mortality (OR=0.75, 95% CI 0.67 to 0.83), but not on 5‐year survival (HR=0.94, 95% CI 0.84 to 1.05). Higher surgeon caseload was associated with better 5‐year survival (HR=0.84, 95% CI 0.76 to 0.93), based on a single study; unadjusted data from two studies suggested a substantial, but not significant surgeon effect (HR=0.85, 95% CI 0.71 to 1.02). Operative mortality following case‐mix adjustment was significantly lower for surgeons with higher caseload (OR=0.75, 95% CI 0.62 to 0.92); this was supported by the evidence from unadjusted data. There was a notable paucity of studies reporting outcomes for colon cancer surgery in relationship to the specialist status of the surgeon; case‐mix adjusted 5‐year disease‐free survival was significantly improved when surgery was carried out by a specialist in a single UK‐based study (HR=0.71, 95% CI 0.55 to 0.92), whilst another UK study ‐ using a different definition of a specialist ‐ reported unadjusted 5‐year overall survival to be better for patients of specialist surgeons (HR=0.89, 95% CI 0.84 to 0.94). No data on operative mortality was found relating specifically to colon cancer surgery.
Very little evidence related to the incidence of anastomotic leaks ‐ only one study reported case‐mix adjusted data, with no significant effects relating to higher hospital (OR=1.44, 95% CI 0.80 to 2.59) and higher surgeon caseload (OR=0.66, 95 %CI 0.36 to 1.21); unadjusted data supported this finding. There was no study that examined the incidence of anastomotic leaks for colon surgery in relation to the surgeon's specialist status.
Rectal cancer
Contrasting with the review of colon cancer surgery, there was a significant association between high‐volume hospitals and improved 5‐year survival (HR=0.85, 95% CI 0.77 to 0.93), whereas no such association was demonstrated for operative mortality (OR=0.95, 95% CI 0.85 to 1.05); in the meta‐analysis of unadjusted data, neither outcome was significantly associated with hospital volume. As for surgeon caseload, neither 5‐year survival (HR=0.99, 95% CI 0.86 to 1.14), nor operative mortality (OR=0.86, 95% CI 0.62 to 1.19) showed significant associations for rectal cancer surgery when case‐mix adjusted studies were reviewed. However, few studies used case‐mix adjustment and could be included, and meta‐analysis of a larger number of studies with unadjusted data conversely demonstrated significantly better 5‐year survival (HR=0.85, 95% CI 0.78 to 0.94) and operative mortality (OR=0.73, 95% CI 0.57 to 0.75) for high‐volume surgeons. There was notable absence of case‐mix adjusted data and paucity of unadjusted data for assessment of the effect relating to specialisation, but meta‐analysis of unadjusted data from two studies revealed better 5‐year overall survival (HR=0.78, 95% CI 0.72 to 0.85) and 5‐year local recurrence rates (HR=0.55, 95% CI 0.40 to 0.75) for specialists, and improved 5‐year disease‐free survival (HR=0.76, 95%CI 0.58 to 1.00) based on one study.
Anastomotic leak rates for rectal cancer surgery were significantly lower in high‐volume hospitals (OR=0.77, 95% CI 0.61 to 0.97), but not for high‐volume surgeons (OR=0.61, 95 % CI 0.29 to 1.28); the latter was based on one single study, but was supported by the findings of meta‐analysis of unadjusted data from three studies. In two UK studies, using the same definition for specialists, there was also no significant effect attributable to specialisation (OR=0.71, 95% CI 0.31 to 1.63).
One outcome measure specific to rectal cancer surgery is the frequency or risk of a potentially permanent colostomy or use of an abdominoperineal excision of the rectum (APER). In the meta‐analysis of case‐mix adjusted data, higher hospital volume was associated with significantly lower rates of permanent stomas (OR=0.64, 95% CI 0.45 to 0.90) and APER (OR=0.55, 95% CI 0.42 to 0.72); although the latter was based on the findings of a single study, it reflected the results of the unadjusted analysis based on a much larger cohort (OR=0.80, 95% CI 0.65 to 0.99). High‐volume surgeons and specialists also achieved lower rates of permanent stoma formation (0.75, 95% CI 0.64 to 0.88, and (0.70, 95% CI 0.53 to 0.94, respectively); unadjusted data supported the findings of the case‐mix adjusted studies. Only one study reported on APER, with lower rates for high‐volume surgeons in case‐mix adjusted analysis (OR=0.75, 95% CI 0.64 to 0.88), but unadjusted data from seven studies supported a significant effect (OR=0.66, 95%CI 0.52 to 0.84).
Overall completeness and applicability of evidence
The review process aimed to include all relevant studies that examined the evidence for a volume‐outcome relationship for hospitals and surgeons in the context of colorectal, colon and rectal cancer, as well as the role of surgeon specialization. The search strategy was comprehensive, and resulted ‐ to our knowledge‐ in the largest number of studies included for meta‐analysis yet, despite restrictions to select only studies reporting on patients treated in and after 1990. This restrictive approach was employed to enable a more contemporary picture, assuming that modern management of colorectal cancer was employed in most settings. It was, however, impossible to comprehensively determine which specific surgical techniques and non‐surgical treatments were used for each individual study group.
Whilst many of the secondary outcomes were reported by only a comparatively small number of studies, the majority of authors reported on either long‐term survival, or operative mortality, or both. Thus, the here reported effects relating to hospitals and surgeons in the primary outcomes should be considered as important evidence.
The definition of high volume in particular ‐ both for hospitals and surgeons ‐ proved to be very heterogeneous, and was not always based on the study population itself (Meyerhardt 2003; Meyerhardt 2004); at institutional level, hospitals were considered as "high‐volume" by some authors with fewer than 20 operations per annum (COLOR Study Group; Larson 2008; Meyerhardt 2004; Morris 2007; Simons 1997; Simunovic 2006), while others considered hospitals to be "high‐volume" with more than 150 operations per annum (Billingsley 2007; Dimick 2003; Lin 2006). Similarly, surgeons were defined as high‐volume surgeons with fewer than ten annual operations (Debes 2008; McGrath 2005), whilst other authors defined high‐volume surgeons by annual caseloads in excess of 40 operations (Borowski 2010; Rogers 2006; Smith 2003). The definition of what constitutes a specialist also warrants further deliberation: although it is generally accepted that a specialist should have appropriate training, participate in continuous professional development and clinical governance, and that he should be aware of current knowledge, research and new treatment strategies within their field, there is no internationally agreed definition of a colorectal specialist. Throughout the examined studies, there was no universal approach on what credentials are required to be considered a colorectal specialist surgeon. Individual studies used a wide variety of definitions, including self‐declared interest (Mella 1997), voluntary membership to professional societies (Borowski 2007; Marwan 2010; Smith 2003), peer‐review (McArdle 2004), participation in technical workshops (Martling 2002) and fellowship programmes (Dorrance 2000; Platell 2003); not one single study required a specialist to have passed a specialist examination process leading to board certification ‐ such as that of the American Board of Coloproctology (Porter 1998). Although these considerations make a universal definition and application of international minimum volume standards and specialist characteristics impossible, the presence of a volume‐outcome relationship and the improved outcomes demonstrated for specialists compared to non‐specialists make a convincing case for concentration of work in the hand of specialists, carrying out a high colorectal caseload within local comparison.
Whilst the evidence for the benefit at surgeon level was seen throughout all considered outcomes and appears to be significant irrespective of the setting, the issue of the role of the hospital seems contentious. It appears that there were important differences between individual countries, particularly the US and other countries (including many from the UK and continental Europe). Rather than coming to a universal conclusion that centralisation of colorectal services in high‐volume units would by itself generate better outcomes, each country's individual healthcare setting should be examined for the potential benefits that could be achieved through service centralisation (Birkmeyer 2001; Dudley 2000). Furthermore, any move towards concentration of surgery in high‐volume centres is associated with an increase in demand on intensive care beds, operating facilities and staff requirements, potentially diluting and even attenuating the benefits of high‐volume care; this has to be considered carefully, particularly as ‐ in turn ‐ the financial viability of small hospitals may be threatened.
Quality of the evidence
Overall, according to the Grade Working Group 2004 grades of evidence, the quality of evidence presented in this review is low (Table 1; Table 2; Table 3; Table 4; Table 5) as all included studies were observational by design. However, the ethical concerns and practical difficulties associated with the conception of a randomised trial focusing on surgical quality and service organisation make evidence from observational data the best available. Thus, conclusions from the combined analysis of case‐mix adjusted and unadjusted individual studies warrant consideration particularly in this large cohort of patients (n= 943,728) and somewhat justifies generalization of the findings.
Unexplained heterogeneity between subgroups of the meta‐analysed studies predominantly accounted for the reduction in quality of the evidence overall. Heterogeneity between studies introduces inconsistencies, results in relatively wide confidence intervals, and thus leads to a less precise effect measure. For the majority of primary outcomes under scrutiny, namely 5‐year survival and operative mortality, the evidence across all colorectal, colon and rectal cancer studies appeared to be robust, as reflected by relatively narrow confidence intervals of less than 0.1 deviation in either direction; the larger sample sizes in the combined analyses somewhat alleviated the effects of significant heterogeneity between the individual studies. It is of importance to note that the patient cohorts derived from case‐mix adjusted studies were generally smaller than those derived from unadjusted studies; the results of the analysis of unadjusted data therefore will need to be considered as important, particularly when narrow confidence intervals were encountered.
Subgroup analysis for colon and rectal cancer somewhat suffered from the comparatively smaller sample size. For example, evidence for the effect of hospital volume on 5‐year overall survival in rectal cancer appeared to be robust, with no significant heterogeneity and a significant narrow confidence interval; thus, it can be fairly certain that hospital volume has a beneficial effect in the context of rectal cancer surgery, whilst the non‐significant effect observed for colon cancer, characterised by a large confidence interval and significant heterogeneity, may yet be alleviated by use of larger samples. In addition, it is noteworthy that studies judged to be high‐risk in the risk of bias assessment contributed to the low quality of evidence on the effect of hospital volume on overall 5‐year survival for the colon cancer subgroup (Meyerhardt 2003), but also did affect the assessment of 5‐year overall survival, 5‐year local recurrence and APER rates for the rectal cancer subgroup (Meyerhardt 2004). Some analyses, particularly for secondary outcomes that were based on few studies, or even a single study, suffered not only from small sample size, but also from low quality in these studies; for example, the assessment of APER rates from case‐mix adjusted studies relied exclusively on evidence obtained from studies judged as low‐quality (Meyerhardt 2004; Purves 2005), hence lowering the quality of evidence for APER.
Potential biases in the review process
The main threat to bias in the presented review is the potential for within‐study selective reporting, as described by Hahn 2002. Within‐study selective reporting is usually examined qualitatively, by comparing study reports with their protocols; however, observational studies rarely have a published protocol. Observational studies are by design susceptible to bias through their design; there is a potential for flaws such as incomplete or selective patient inclusion, longitudinal comparisons across time with failure to recognise other effects that are not measured by the collected data (Dent 1998), and the risk of application of differing definitions as times and circumstances change (Feinstein 1985) ‐ many of these potential sources of bias have to be taken as inherent and can not be entirely eliminated.
A comprehensive search strategy was used, and the literature review process included a thorough search of the "grey" literature; all studies were sifted and data extracted by two reviewers independently, in order to reduce bias in the review process. Bias in the case‐ascertainment of this review may be due to the lack of an internationally standardised definition of the rectum, as different distances from the anal verge were considered as determinants of the rectum. There were also considerable variations in the definitions of hospital and surgeon volume groups, and the definitions of the colorectal specialists; this issue has been elaborated on earlier. By protocol, we excluded data other than the highest and the lowest hospital and surgeon volume groups in studies reporting on more than two intervention groups; the exclusion of such data by default is likely to serve as a potential source of bias, as it could have attenuated a volume‐outcomes effect that manifested itself largely within the less extreme categories of an individual study, but is necessary to enable comparative meta‐analysis.
Few included studies adjusted for clustering of patients and surgeons. The effects of clustering are observed where patients receiving treatment from the same healthcare provider tend to have similar outcomes in common. Consideration of the effect of patient clustering in analyses is thought to be imperative in the investigation of the volume‐outcome relationship (Panageas 2003A), because clustering introduces the concept of variability in outcomes amongst the examined healthcare providers. Failure to allow for clustering would result in 95% confidence intervals (and standard errors) that are spuriously over‐precise, hence giving a study undue weight in the meta‐analytic process.
Seven studies (Elferink 2010A; Elferink 2010B; Kressner 2009; Manchon‐Walsh 2011; Meyerhardt 2004, Rogers 2006; Simunovic 2000) had to be excluded in the summary of findings table, because no data was published on the number of patients experiencing the outcome and the total number of patients in either control or intervention group.
Agreements and disagreements with other studies or reviews
In 1994, Stiller (Stiller 1994A) observed in a review of cancer outcome studies, that no high‐volume provider had worse outcomes than their respective low‐volume comparators; the present meta‐analysis confirms this finding. However, one study based on a national data‐set in The Netherlands, has since demonstrated significantly higher operative mortality figures for high‐volume providers, indicating that a more complex case‐mix in such specialist centres could lead to an inverse volume‐outcome association (Engel 2005A). Killeen and colleagues (Killeen 2005) reported in their review of 16 colorectal cancer studies in 2006 that ten of 15 hospital volume‐outcome studies reported a beneficial association, and that three of seven surgeon volume‐outcome studies reported beneficial associations; the authors concluded, however, that the relative contribution of hospitals and surgeons remained to be elucidated. In a previous meta‐analysis, including studies on patient populations treated prior the cut‐off employed in the present meta‐analysis, Iversen et al (Iversen 2006A) were able to demonstrate a significant relationship between operative mortality in colon cancer surgery and both surgeon and hospital volume, but failed to detect a relationship in rectal cancer surgery. In the present study, case‐mix adjusted data on hospital volume did indicate a significant association for rectal cancer surgery for overall five year survival. The beneficial effect of higher caseload and specialisation on long‐term outcomes reported by Iversen et al (Iversen 2006B) were somewhat reflected in this present review, although we were unable to demonstrate a similarly significant hospital effect for colon cancer, when case‐mix adjustment was taken into account. Salz et al (Salz 2008) suggested in their narrative review that, for rectal cancer, the effects of higher hospital volume may be strongest for short‐term outcomes; our findings refute this to some extent.
Three studies were excluded from the meta‐analysis: Using trial data, Larson 2008 reported no difference in long term outcome with higher surgeon volume for colon cancer. Grabham 1996 reported lower anastomotic leak rate with higher surgeon volume and Gort 2010 demonstrated some beneficial effect for higher hospital volume on postoperative complications.
Authors' conclusions
Implications for practice.
Although there was substantial heterogeneity between the individual studies that were included in this review and meta‐analysis, the presented results confirm clearly the presence of a volume‐outcome relationship in modern colorectal cancer surgery, for both the hospital and the individual surgeon. Specialists also achieved generally better outcomes than non‐specialists, although the large variability in the definition of the colorectal specialist reduces the applicability of this concept substantially. Nonetheless, if the difference in the definition is considered largely to be semantic, and one accepts the common‐sense assumption that colorectal specialists, under normal circumstances, perform a comparatively high number of colorectal cancer operations, the evidence for the benefits of surgeon specialisation and higher surgeon volume are somewhat mutually supportive.
The volume‐outcome relationship appears somewhat stronger for the individual surgeon than for the hospital; it was more consistent and it's effect size generally larger. Particularly for the primary outcomes of 5‐year survival and operative mortality, there were differences between US and non‐US data, suggesting that ‐ at hospital level ‐ provider variability was less of a problem outside the US than within the US. Furthermore, case‐mix adjustment frequently attenuated the effects observed in unadjusted analysis, indicating the importance of case‐mix adjustment in comparative analysis. Whilst the heterogeneity observed for this meta‐analysis precludes the definition of recommended minimum‐volume standard for colorectal surgery, it seems imperative that every country or healthcare system must establish audit of current practice and outcome to ensure that the benefits of high‐volume care can be translated into service organisation, and lead to centralisation of colorectal surgery, where necessary.
Implications for research.
The concept of randomisation is unlikely to be used in assessing the relationship between healthcare provider characteristics and patient outcomes due to ethical reasons. The current best available evidence is primarily based on observational non‐experimental data. In the light of this, it is advocated that all volume/specialization‐outcome studies be performed to the highest level of quality (See Figure 1; Figure 2), thus minimizing the risk of bias. It is imperative that all volume/specialization‐outcome studies adjust for the important prognostic factors to eliminate variation in outcomes due to inconsistent differences in patient characteristics across healthcare providers. The concept of clustering has to be considered in statistical analyses relating to healthcare provider characteristics and patient outcomes as the lack of this tends to exaggerate the differences in outcomes, however, it's use in meta‐analysis is limited. Furthermore, studies reporting on surgeon volume and hospital volume should adjust for both hospital volume and surgeon volume, as the effects of surgeons and hospital volume are neither entirely independent, nor synonymous. Finally, all volume/specialization‐outcome studies should attempt to fully report on the essential statistical summary estimates, including confidence intervals, to facilitate meta‐analysis.
History
Protocol first published: Issue 3, 2005 Review first published: Issue 3, 2012
| Date | Event | Description |
|---|---|---|
| 17 October 2010 | New search has been performed | Protocol substantially updated |
| 14 January 2010 | New citation required and major changes | Protocol revised |
Acknowledgements
DA and DWB would like to acknowledge the great help provided by Mr Seamus B Kelly (Northumbria Healthcare NHS Foundation Trust, North Shields, UK) and the late Mr Alastair Gunn (Northern Region Colorectal Cancer Audit Group, Newcastle upon Tyne, UK), who awakened both author's interest in the issues of healthcare organisation and surgical audit.
Appendices
Appendix 1. Search strategy
Free text search words (as well as MESH‐terms)
work‐load, Surgery, Colo*, Rect*, Outcome, High‐volume, Cancer, Special*, with relevant AND or OR discriminators in the searches
MEDLINE and Cochrane Library databases (PUbmed) search using MeSH terms
#1 “Colorectal neoplasms” AND “Surgery” #2 “Colorectal neoplasms” AND “Education”(subheading) #3 “Colorectal surgery”/education/mortality/organisation and administration/ standards #4 “Colorectal neoplasms” AND “Surgical Procedures, Operative”/ education, mortality/standards #5 “Colorectal neoplasms” AND “Colorectal surgery” #6 “Colorectal neoplasms”/surgery AND “Utilization”(subheading) #7 “Colorectal neoplasms”/surgery AND Volume (Text word) #8 “Colectomy”/ education/methods/mortality/standards/statistics and numerical data/utilization AND Volume (Text word) #9 “Surgical Procedures, Operative”/education/mortality AND Colectomy (Text word) AND (Cancer OR Carcinoma) (Text words)
Appendix 2. Data extraction form
WORKLOAD‐REVIEW DATA EXTRACTION FORM:
Study:
Primary author:
Title:
Study ID in “workload”‐review:
Included in review. Yes…. No… Maybe…
1) Finale decision. Yes…(1) No…(2)
2) The authors (origin of article?)
Specialists in colorectal surgery: ….(1)
General surgeons: …..(2)
Non colorectal doctors: ….(3)
Unknown: ….(4)
Data extracted by: …………….
Description of study
Study method:
3) Planned intervention…(1) Descriptive…(2) Other…(3)
4) Prospective…(1) Retrospective…(2) Mixed…(3)
5) Case‐control…(1) Cohort…(2) Randomized…(3)
6) No control…(1) Historical control…(2) Structure/individual control…(3)
7) Department load…(1) Surgeon load…(2) Surgeon education/interest…(3)
(1)+(2)=(4) (1)+(3)=5 (2)+(3)=(6) (1)+(2)+(3)=(7)
8) Single department…(1) Area…(2) Country…(3)
9) Cases…(1) Databases…(2) Register…(3)
(1)+(2)=(4) (1)+(3)=5 (2)+(3)=(6) (1)+(2)+(3)=(7)
Patients:
10) Colon…(1) Rectum…(2) Colorectal…(3)
(1)+(2)=(4) (1)+(3)=5 (2)+(3)=(6) (1)+(2)+(3)=(7)
Outcomes:
11) Operative mortality: Yes…(1) No…(2)
12) Anastemotic leakage: Yes…(1) No…(2)
13) Long‐term survival (total): No of years…. Not declared…(99)
14) Long‐term survival (cancer specific): No of years…. Not declared…(99)
15) Local recurrence: No… Not declared…(99)
Result evaluator:
16) Blinded observer…(1) Non‐blinded observer…(2) Unknown…(3)
Overall assessment of study quality:
17) Optimal methodology…(1) Acceptable methodology…(2) Unacceptable…(3)
AD 5.
Department workload (question 7=1 or >3): as defined in the article –
Discriminator = discriminator for high‐ and low‐volume
18) Number of departments with high volume: … Number of departments with low volume…
19) Discriminator (N)…floating discriminator…(9) No discriminator…(99)
Patients:
20) Colon high volume (N) …
21) Colon low volume (N) …
22) Rectum high volume (N)…
23) Rectum low volume (N)…
24) Colorectal High volume (N)…
25) Colorectal low volume (N)…
Surgeon’s volume: (question 7 = 2 or >3)
26) Number of surgeons high volume: … number of surgeons low volume: …
27) Discriminator: … floating discriminator: …(9) Non: …(99)
Patients:
28) Colon high volume (N)…
29) Colon low volume (N)…
30) Rectum high volume (N)…
31) Rectum low volume (N)…
32) Colorectal High volume (N)…
33) Colorectal low volume (N)…
Ad 5 continued.
Surgeon’s education/interest: (question 7 = 3 or >3)
34) Number of surgeons educated/interest: … Number of surgeons without education/interest: …
35) Discriminator: … Floating discriminator: …(9) Non: …(99)
Patients (N):
36) Colon with education/interest (N)…
37) Colon without education/interest (N)…
38) Rectum with education/interest (N)…
39) Rectum without education/interest (N)…
40) Colorectal with education/interest (N)…
41) Colorectal without education/interest (N)…
Outcomes: The groups with intervention (meaning more operations per department or per head or with better education are always listed first (a), control group (b)
42a) Death < 30 days (N)…
43a) Number observed: …
44a) % Dead –if not N and observed are declared …
45b) Dead < 30 days (N) …
46b) Number observed: …
47b) % Dead –if not N and observed are declared
48a) Anastemotic leakage (N) …
49a) Number Observed: …
50a) % Anastemotic leakage –if not N and observed are declared ……%
51b) Anastemotic leakage (N) …
52b) Number Observed: …
53b) % Anastemotic leakage –if not N and observed are declared ……%
54a) Long‐term survival (total): …(number)
55a) Number observed: …
56a) % Long‐term survivors –if not N and observed are declared ……%
57b) Long‐term survival (total): …(number)
58b) Number observed: …
59b) % Long‐term survivors –if not N and observed are declared ……%
60a) Long‐term survival (cancer specific): …(number)
61a) Number observed: …
62a) % Long‐term survivors (cancer specific) –if not N and observed are declared ……%
63b) Long‐term survival (cancer specific): …(number)
64b) Number observed: …
65b) % Long‐term survivors (cancer specific) –if not N and observed are declared ……%
66a) Local recurrence (number): …
67a) Number observed: …
68a) % Local recurrence –if not N and observed are declared ……%
69b) Local recurrence (number): …
70b) Number observed: …
71b) % Local recurrence –if not N and observed are declared ……%
Declaration of other outcomes: (in prose)
………………………………………………………………………………………………………………………………………………………………………………………………………………………………………………………………………………………………………………………………
Data and analyses
Comparison 1. Hospital volume (unadjusted analysis).
| Outcome or subgroup title | No. of studies | No. of participants | Statistical method | Effect size |
|---|---|---|---|---|
| 1 Overall five year survival | 11 | Hazard Ratio (Random, 95% CI) | 0.92 [0.81, 1.04] | |
| 1.1 Colorectal cancer | 2 | Hazard Ratio (Random, 95% CI) | 0.88 [0.80, 0.98] | |
| 1.2 Colon cancer | 3 | Hazard Ratio (Random, 95% CI) | 0.94 [0.84, 1.05] | |
| 1.3 Rectal cancer | 7 | Hazard Ratio (Random, 95% CI) | 0.92 [0.79, 1.07] | |
| 2 Inpatient and 30 day mortality | 27 | 441871 | Odds Ratio (M‐H, Random, 95% CI) | 0.75 [0.68, 0.84] |
| 2.1 Colorectal cancer | 7 | 113795 | Odds Ratio (M‐H, Random, 95% CI) | 0.74 [0.55, 1.00] |
| 2.2 Colon cancer | 14 | 309693 | Odds Ratio (M‐H, Random, 95% CI) | 0.75 [0.67, 0.83] |
| 2.3 Rectal cancer | 7 | 18383 | Odds Ratio (M‐H, Random, 95% CI) | 0.75 [0.54, 1.05] |
| 3 Five year local recurrence rate | 4 | Hazard Ratio (Random, 95% CI) | 0.70 [0.53, 0.91] | |
| 3.1 Rectal cancer | 4 | Hazard Ratio (Random, 95% CI) | 0.70 [0.53, 0.91] | |
| 4 Anastomotic leak rate | 7 | 9530 | Odds Ratio (M‐H, Random, 95% CI) | 1.18 [0.87, 1.58] |
| 4.1 Colon cancer | 3 | 4568 | Odds Ratio (M‐H, Random, 95% CI) | 1.26 [0.66, 2.41] |
| 4.2 Rectal cancer | 5 | 4962 | Odds Ratio (M‐H, Random, 95% CI) | 1.11 [0.77, 1.61] |
| 5 Permanent stoma rate | 6 | 12842 | Odds Ratio (M‐H, Random, 95% CI) | 0.86 [0.75, 1.00] |
| 5.1 Rectal cancer | 6 | 12842 | Odds Ratio (M‐H, Random, 95% CI) | 0.86 [0.75, 1.00] |
| 6 Abdominoperineal excision of rectum rate | 9 | 7609 | Odds Ratio (M‐H, Random, 95% CI) | 0.80 [0.65, 0.99] |
| 6.1 Rectal cancer | 9 | 7609 | Odds Ratio (M‐H, Random, 95% CI) | 0.80 [0.65, 0.99] |
Comparison 2. Surgeon volume (unadjusted analysis).
| Outcome or subgroup title | No. of studies | No. of participants | Statistical method | Effect size |
|---|---|---|---|---|
| 1 Overall five year survival | 6 | Hazard Ratio (Random, 95% CI) | 0.85 [0.81, 0.90] | |
| 1.1 Colorectal cancer | 2 | Hazard Ratio (Random, 95% CI) | 0.86 [0.82, 0.90] | |
| 1.2 Colon cancer | 2 | Hazard Ratio (Random, 95% CI) | 0.85 [0.71, 1.02] | |
| 1.3 Rectal cancer | 3 | Hazard Ratio (Random, 95% CI) | 0.85 [0.78, 0.94] | |
| 2 Five year disease specific survival | 1 | Hazard Ratio (Random, 95% CI) | 0.88 [0.75, 1.03] | |
| 2.1 Colorectal cancer | 1 | Hazard Ratio (Random, 95% CI) | 0.88 [0.75, 1.03] | |
| 3 Inpatient and 30 day mortality | 15 | 181615 | Odds Ratio (M‐H, Random, 95% CI) | 0.65 [0.57, 0.75] |
| 3.1 Colorectal cancer | 5 | 23644 | Odds Ratio (M‐H, Random, 95% CI) | 0.65 [0.56, 0.76] |
| 3.2 Colon cancer | 7 | 152231 | Odds Ratio (M‐H, Random, 95% CI) | 0.62 [0.51, 0.76] |
| 3.3 Rectal cancer | 4 | 5740 | Odds Ratio (M‐H, Random, 95% CI) | 0.73 [0.53, 0.98] |
| 4 Anastomotic leak rate | 3 | 5128 | Odds Ratio (M‐H, Random, 95% CI) | 0.67 [0.49, 0.92] |
| 4.1 Colon | 1 | 2570 | Odds Ratio (M‐H, Random, 95% CI) | 0.58 [0.34, 1.01] |
| 4.2 Rectal cancer | 3 | 2558 | Odds Ratio (M‐H, Random, 95% CI) | 0.68 [0.43, 1.08] |
| 5 Permanent stoma rate | 3 | 2235 | Odds Ratio (M‐H, Random, 95% CI) | 0.75 [0.62, 0.89] |
| 5.1 Rectal cancer | 3 | 2235 | Odds Ratio (M‐H, Random, 95% CI) | 0.75 [0.62, 0.89] |
| 6 Abdominoperineal excision of the rectum | 7 | 4348 | Odds Ratio (M‐H, Random, 95% CI) | 0.66 [0.52, 0.84] |
| 6.1 Rectal cancer | 7 | 4348 | Odds Ratio (M‐H, Random, 95% CI) | 0.66 [0.52, 0.84] |
Comparison 3. Surgeon specialization (unadjusted analysis).
| Outcome or subgroup title | No. of studies | No. of participants | Statistical method | Effect size |
|---|---|---|---|---|
| 1 Overall five year survival | 5 | Hazard Ratio (Random, 95% CI) | 0.85 [0.82, 0.89] | |
| 1.1 Colorectal cancer | 3 | Hazard Ratio (Random, 95% CI) | 0.87 [0.83, 0.91] | |
| 1.2 Colon cancer | 1 | Hazard Ratio (Random, 95% CI) | 0.89 [0.84, 0.94] | |
| 1.3 Rectal cancer | 2 | Hazard Ratio (Random, 95% CI) | 0.78 [0.72, 0.85] | |
| 2 Five year disease specific survival | 1 | Hazard Ratio (Random, 95% CI) | 0.75 [0.65, 0.87] | |
| 2.1 Colorectal cancer | 1 | Hazard Ratio (Random, 95% CI) | 0.75 [0.65, 0.87] | |
| 3 Inpatient and 30 day mortality | 5 | 17222 | Odds Ratio (M‐H, Random, 95% CI) | 0.73 [0.57, 0.94] |
| 3.1 Colorectal cancer | 5 | 17222 | Odds Ratio (M‐H, Random, 95% CI) | 0.73 [0.57, 0.94] |
| 4 Five year local recurrence | 2 | Hazard Ratio (Random, 95% CI) | 0.59 [0.48, 0.71] | |
| 4.1 Colon cancer | 1 | Hazard Ratio (Random, 95% CI) | 0.61 [0.48, 0.78] | |
| 4.2 Rectal cancer | 2 | Hazard Ratio (Random, 95% CI) | 0.55 [0.40, 0.75] | |
| 5 Anastomotic leak rate | 4 | 9173 | Odds Ratio (M‐H, Random, 95% CI) | 0.87 [0.49, 1.55] |
| 5.1 Colorectal cancer | 2 | 8563 | Odds Ratio (M‐H, Random, 95% CI) | 0.73 [0.35, 1.52] |
| 5.2 Rectal cancer | 2 | 610 | Odds Ratio (M‐H, Random, 95% CI) | 1.52 [0.56, 4.12] |
| 6 Permanent stoma rate | 3 | 2885 | Odds Ratio (M‐H, Random, 95% CI) | 0.66 [0.43, 1.02] |
| 6.1 Rectal cancer | 3 | 2885 | Odds Ratio (M‐H, Random, 95% CI) | 0.66 [0.43, 1.02] |
| 7 Abdominoperineal excision of the rectum rate | 3 | 2184 | Odds Ratio (M‐H, Random, 95% CI) | 0.74 [0.52, 1.04] |
| 7.1 Rectal cancer | 3 | 2184 | Odds Ratio (M‐H, Random, 95% CI) | 0.74 [0.52, 1.04] |
Comparison 4. Hospital volume (adjusted analysis).
| Outcome or subgroup title | No. of studies | No. of participants | Statistical method | Effect size |
|---|---|---|---|---|
| 1 Overall five year survival | 7 | Hazard Ratio (Random, 95% CI) | 0.90 [0.85, 0.96] | |
| 1.1 Colorectal cancer | 2 | Hazard Ratio (Random, 95% CI) | 0.90 [0.84, 0.95] | |
| 1.2 Colon cancer | 2 | Hazard Ratio (Random, 95% CI) | 0.97 [0.77, 1.22] | |
| 1.3 Rectal cancer | 4 | Hazard Ratio (Random, 95% CI) | 0.85 [0.77, 0.93] | |
| 2 Inpatient and 30 day mortality | 17 | Odds Ratio (Random, 95% CI) | 0.93 [0.84, 1.04] | |
| 2.1 Colorectal cancer | 3 | Odds Ratio (Random, 95% CI) | 0.98 [0.79, 1.20] | |
| 2.2 Colon cancer | 8 | Odds Ratio (Random, 95% CI) | 0.90 [0.79, 1.03] | |
| 2.3 Rectal cancer | 7 | Odds Ratio (Random, 95% CI) | 0.97 [0.70, 1.33] | |
| 3 Five year local recurrence rate | 3 | Hazard Ratio (Random, 95% CI) | 0.77 [0.51, 1.16] | |
| 3.1 Rectal cancer | 3 | Hazard Ratio (Random, 95% CI) | 0.77 [0.51, 1.16] | |
| 4 Anastomotic leak rate | 3 | Odds Ratio (Random, 95% CI) | 0.87 [0.63, 1.18] | |
| 4.1 Colon cancer | 1 | Odds Ratio (Random, 95% CI) | 1.44 [0.80, 2.59] | |
| 4.2 Rectal cancer | 3 | Odds Ratio (Random, 95% CI) | 0.77 [0.61, 0.97] | |
| 5 Permanent stoma rate | 4 | Odds Ratio (Random, 95% CI) | 0.64 [0.45, 0.90] | |
| 5.1 Rectal cancer | 4 | Odds Ratio (Random, 95% CI) | 0.64 [0.45, 0.90] | |
| 6 Abdominoperineal excision of the rectum rate | 1 | Odds Ratio (Random, 95% CI) | 0.55 [0.42, 0.72] | |
| 6.1 Rectal cancer | 1 | Odds Ratio (Random, 95% CI) | 0.55 [0.42, 0.72] |
Comparison 5. Surgeon volume (adjusted analysis).
| Outcome or subgroup title | No. of studies | No. of participants | Statistical method | Effect size |
|---|---|---|---|---|
| 1 Overall five year survival | 3 | Hazard Ratio (Random, 95% CI) | 0.88 [0.83, 0.93] | |
| 1.1 Colorectal cancer | 2 | Hazard Ratio (Random, 95% CI) | 0.87 [0.82, 0.92] | |
| 1.2 Colon cancer | 1 | Hazard Ratio (Random, 95% CI) | 0.84 [0.76, 0.93] | |
| 1.3 Rectal cancer | 1 | Hazard Ratio (Random, 95% CI) | 0.99 [0.86, 1.14] | |
| 2 Five year disease specific survival | 1 | Hazard Ratio (Random, 95% CI) | 0.94 [0.77, 1.15] | |
| 2.1 Colon cancer | 1 | Hazard Ratio (Random, 95% CI) | 0.99 [0.76, 1.29] | |
| 2.2 Rectal cancer | 1 | Hazard Ratio (Random, 95% CI) | 0.88 [0.65, 1.19] | |
| 3 Inpatient and 30 day mortality | 4 | Odds Ratio (Random, 95% CI) | 0.77 [0.66, 0.91] | |
| 3.1 Colon cancer | 4 | Odds Ratio (Random, 95% CI) | 0.75 [0.62, 0.92] | |
| 3.2 Rectal cancer | 2 | Odds Ratio (Random, 95% CI) | 0.86 [0.62, 1.19] | |
| 4 Anastomotic leak rate | 1 | Odds Ratio (Random, 95% CI) | 0.64 [0.40, 1.02] | |
| 4.1 Colon cancer | 1 | Odds Ratio (Random, 95% CI) | 0.66 [0.36, 1.21] | |
| 4.2 Rectal cancer | 1 | Odds Ratio (Random, 95% CI) | 0.61 [0.29, 1.28] | |
| 5 Permanent stoma rate | 2 | Odds Ratio (Random, 95% CI) | 0.75 [0.64, 0.88] | |
| 5.1 Rectal cancer | 2 | Odds Ratio (Random, 95% CI) | 0.75 [0.64, 0.88] | |
| 6 Abdominoperineal excision of rectum rate | 1 | Odds Ratio (Random, 95% CI) | 0.20 [0.10, 0.40] | |
| 6.1 Rectal cancer | 1 | Odds Ratio (Random, 95% CI) | 0.20 [0.10, 0.40] |
Comparison 6. Surgeon specialization (adjusted analysis).
| Outcome or subgroup title | No. of studies | No. of participants | Statistical method | Effect size |
|---|---|---|---|---|
| 1 Overall five year survival | 4 | Hazard Ratio (Random, 95% CI) | 0.81 [0.71, 0.94] | |
| 1.1 Colorectal cancer | 4 | Hazard Ratio (Random, 95% CI) | 0.81 [0.71, 0.94] | |
| 2 Five year disease specific survival | 1 | Hazard Ratio (Random, 95% CI) | 0.74 [0.61, 0.89] | |
| 2.1 Colon cancer | 1 | Hazard Ratio (Random, 95% CI) | 0.71 [0.55, 0.92] | |
| 2.2 Rectal cancer | 1 | Hazard Ratio (Random, 95% CI) | 0.76 [0.58, 1.00] | |
| 3 Inpatient and 30 day mortality | 2 | Odds Ratio (Random, 95% CI) | 0.74 [0.60, 0.91] | |
| 3.1 Colorectal cancer | 2 | Odds Ratio (Random, 95% CI) | 0.74 [0.60, 0.91] | |
| 4 Five year local recurrence rate | 1 | Hazard Ratio (Random, 95% CI) | 0.56 [0.44, 0.71] | |
| 4.1 Colorectal cancer | 1 | Hazard Ratio (Random, 95% CI) | 0.56 [0.44, 0.71] | |
| 5 Anastomotic leak rate | 2 | Odds Ratio (Random, 95% CI) | 0.71 [0.31, 1.63] | |
| 5.1 Colorectal cancer | 2 | Odds Ratio (Random, 95% CI) | 0.71 [0.31, 1.63] | |
| 6 Permanent stoma rate | 1 | Odds Ratio (Random, 95% CI) | 0.70 [0.53, 0.94] | |
| 6.1 Rectal cancer | 1 | Odds Ratio (Random, 95% CI) | 0.70 [0.53, 0.94] |
Characteristics of studies
Characteristics of included studies [ordered by study ID]
Billingsley 2007.
| Methods | Retrospective population based registry study (USA). | |
| Participants | n=22,672 colon cancer patients aged 66 years and older that underwent resective surgery between 1992‐1996 Patient characteristics according to volume/caseload groups LV, MV, HV, VHV Surgeon Volume Sex M=43.5%, 44.3%, 45.6%, 43.6% F=56.5%, 55.7%, 54.4%, 56.4% Age (years) 66‐70=19.2%, 18.5%, 19.2%, 18.1% 71‐75=23.8%, 23.4%, 24.2%, 24.9% 76‐80=24.3%, 24.5%, 24.0%, 23.9% >81=32.6%, 33.5%, 32.5%, 33.2% Tumour stage (AJCC) I=22.3%, 23.7%, 24.9%, 24.9% II= 46.1%, 46.1%, 44.2%, 44.5% III= 31.7%, 30.2%, 30.9% 30.6% Comorbidity index (Romano‐Charlson score) 0= 62.0%, 62.1%, 63.5%, 64.6% 1= 24.9%, 25.7%, 25.4%, 22.9% 2= 13.1%, 12.2%, 11.1%, 12.4% Urgent procedures 19.5%, 16.1%, 18.4%, 15.6% Ethnicity White= 81.0%, 86.1%, 90.0%, 89.6% Black= 8.3%, 6.0%, 4.8%, 5.7% Asian/Pacific Islander= 5.3% 3.6% 2.5% 2.7% Hispanic= 4.5%, 3.8%, 2.3%, 1.7% Other= 0.9%, 0.6%, 0.4%, 0.4% Median age and race‐specific household income ($) <25 000= 53.0%, 52.7%, 54.0%, 52.2% 25 001‐35 000= 28.0%, 26.3%, 27.4%, 28.0% 35 001‐45 000= 10.9%, 12.6%, 11.8%, 12.0% >45 000= 8.0%, 8.4%, 6.8%, 7.8% Hospital volume Sex M=44.3%, 44.9%, 44.0%, 44.4% F=56.7%, 55.1%, 56.0%, 55.6% Mean age (years) 66‐70=18.7%, 19.6%, 18.5%, 19.2% 71‐75= 23.4%, 24.2%, 24.2%, 24.4% 76‐80=23.6%, 24.3%, 24.7%, 24.3% >81=34.3%, 32.0%, 32.7%, 32.1% Tumour stage (AJCC) I=24.5%, 22.8%, 24.0%, 24.6% II= 45.0%, 45.9%, 45.5%, 44.3% III= 30.5%, 31.4%, 30.5%, 31.2% Comorbidity index (Romano‐Charlson score) 0= 61.4% 62.1% 63.3% 64.4% 1= 25.3%, 25.8%, 24.8%, 24.2% 2= 13.3%, 12.2%, 11.8%, 11.4% Urgent procedures 15.3%, 16.5%, 17.4%, 22.1% Ethnicity White=84.6%, 84.3%, 88.3%, 87.6% Black= 6.4%, 6.2%, 5.5%, 8.3% Asian/Pacific Islander= 3.5%, 5.0%, 3.2%, 2.6% Hispanic= 4.8%, 3.8%, 2.4%, 1.2% Other= 0.8%, 0.8%, 0.7%, 0.2% Median age‐ and race‐specific household income ($) <25 000= 65.0%, 53.2%, 47.3%, 46.5% 25 001‐35 000=22.2%, 29.1%, 28.7% 29.8% 35 001‐45 000= 8.4%, 11.1%, 13.8%, 13.8% >45 000= 4.4%, 6.6%, 10.2%, 9.9% |
|
| Interventions | Total number of hospitals /units=661
Total number of surgeons=2,677 Caseload defined as average colorectal cancer procedures over a 5 year study period Hospital volume VLV=1‐58 LV=59‐107 MV=108‐150 HV=151‐341 Surgeon volume VLV=1‐9 LV=10‐16 MV=17‐26 HV=27‐85 |
|
| Outcomes | Outcomes for colon cancer only 30 day mortality | |
| Notes | Prognostic factors adjusted for included patient characteristics, environmental characteristics, postoperative complications, surgeons specialty and hospital characteristics | |
| Risk of bias | ||
| Bias | Authors' judgement | Support for judgement |
| Population based study? | Low risk | |
| Multicentre study? | Low risk | |
| Prospective design? | High risk | |
| Representativeness of study cohort | High risk | Selected population > 66 yr old |
| Ascertainment of intervention | Low risk | |
| Comparability of intervention and comparison group | Low risk | |
| Assessments of outcomes | Low risk | |
| Addressing incomplete data <20% | Low risk | |
| Missing data on primary interventions/outcomes | Low risk | |
| Other bias | Unclear risk | Cannot be ruled out |
Birkmeyer 2002.
| Methods | Retrospective multicentre study of Medicare population (USA) | |
| Participants | n=304,285 colon cancer patients that underwent resective surgery between 1994 ‐1999.
Patient characteristics according to volume/caseload groups
VLV, LV, MV, HV, VHV
Hospital volume Sex M= 43.8%, 43.9%, 44.1%, 44.0%, 45.4% F= 56.2%, 56.1%, 55.9%, 56.0%, 54.6% Age (years) <75= 59.1%, 59.5%, 60.1%, 60.3%, 60.7% >75= 60.9%, 60.5%, 59.9%, 59.7%, 59.3% Co‐morbidity status (Charlson score) 0‐2= 58.9%, 55.7%, 54.7%, 54.9%, 54.1% >2= 41.1%, 44.3%, 45.3%, 45.1%, 45.9% Emergency admission= 55.7%, 47.4%, 48.5%, 44.4%, 43.0% Ethnicity Black=8.8%, 7.3%, 7.6%, 6.9%, 7.2% Other=91.2%, 92.7%, 92.4%, 93.1%, 92.8% |
|
| Interventions | Total no of hospitals=4,587
Caseload defined as estimated number of procedures in a year
Hospital volume VLV=<33 LV=33‐56 MV=57‐84 HV=85‐124 VHV=>124 |
|
| Outcomes |
Outcomes for colon cancer only 30 day mortality |
|
| Notes | Prognostic factors adjusted for included sex, age comorbidity, mode of presentation and ethnicity | |
| Risk of bias | ||
| Bias | Authors' judgement | Support for judgement |
| Population based study? | High risk | |
| Multicentre study? | Low risk | |
| Prospective design? | High risk | |
| Representativeness of study cohort | Low risk | |
| Ascertainment of intervention | Unclear risk | Volume calculations based on national inpatient sample; patient cohort on medicare (59% of national sample) |
| Comparability of intervention and comparison group | Low risk | |
| Assessments of outcomes | Low risk | |
| Addressing incomplete data <20% | Low risk | |
| Missing data on primary interventions/outcomes | Low risk | |
| Other bias | Unclear risk | Cannot be ruled out |
Borowski 2007.
| Methods | Prospective population based study (UK) | |
| Participants | n=7,411 colorectal cancer patients undergoing resective surgery between 1998‐2002.
Definition of rectum=15 cm from anal verge
Patient characteristics according to surgeon specialization
Nonspecialist, Specialist Specialisation Sex M=57.0%, 57.6% F=43.0%, 42.4% Age (years) <65= 27.0%, 29.6% 65‐74= 35.5%, 35.8% 75‐84= 30.8%, 28.5% 85+= 6.6%, 6.1% Tumour stage (Dukes') A= 10.6%, 16.0% B= 32.1%, 31.0% C= 26.2%, 27.1% D=22.2%, 17.7% No resection=7.1%, 5.8% Unknown=1.9%, 2.3% Comorbidity (ASA) 1=10.8%, 13.3% 2=39.3%, 45.2% 3=31.5%, 29.7% 4/5=8.0%, 5.1% Unknown=9.5%, 6.7% Tumour site Colon= 70.7%, 55.7% Rectum= 28.1%, 43.9% Unknown=1.1%, 0.4% Urgent procedures 33.8%, 13.1% |
|
| Interventions | Specialization Definition of Specialists= ACPGBI (Association of Coloproctologists of Great Britain and Ireland) membership | |
| Outcomes |
Outcomes for colorectal cancer only
Overall five year survival 30 day and inpatient mortality, Anastomotic leak rate Outcomes for rectal cancer only Permanent stoma rate |
|
| Notes | Prognostic factors adjusted for included sex, age, stage, comorbidity and presentation | |
| Risk of bias | ||
| Bias | Authors' judgement | Support for judgement |
| Population based study? | Low risk | |
| Multicentre study? | Low risk | |
| Prospective design? | Low risk | |
| Representativeness of study cohort | Low risk | |
| Ascertainment of intervention | Low risk | |
| Comparability of intervention and comparison group | Low risk | |
| Assessments of outcomes | Low risk | |
| Addressing incomplete data <20% | Low risk | |
| Missing data on primary interventions/outcomes | Low risk | |
| Other bias | Unclear risk | Cannot be ruled out |
Borowski 2010.
| Methods | Prospective population based registry study (UK) | |
| Participants | n=7,411 colorectal cancer patients undergoing resective surgery between 1998‐2002.
Definition of rectum=15 cm from anal verge.
Patient characteristics according to volume/caseload groups
LV, MV, HV Surgeon volume Sex M=57.1%, 57.7%, 57.5% F=42.9%, 42.3%, 42.5% Age (years) <65= 26.4%, 29.6%, 30.5% 65‐74= 35.8%, 35.1%, 36.2% 75‐84= 31.2%, 28.2%, 28.2% 85+= 6.6%, 7.2%, 5.1% Tumour stage (Dukes') A= 11.4%, 15.2%, 16.4% B= 30.8%, 32.0%, 31.3% C= 27.5%, 26.2%, 26.7% D=21.7%, 18.3%, 17.3% No resection=6.6%, 6.2%, 5.9% Unknown=2.1%, 2.1%, 2.4% Comorbidity (ASA) 1=11.2%, 15.0%, 11.3% 2=38.1%, 44.2%, 47.8% 3=32.7%, 28.7%, 29.3% 4/5=8.1%, 6.0%, 4.0% Unknown=9.9%, 6.1%, 7.5% Tumour site Right= 38.0%, 29.4%, 27.3% Left= 31.6%, 27.4%, 27.4% Rectum= 29.3%, 42.8%, 45.0% Unknown=1.1%, 0.5%, 0.3% Urgent procedures 32.7%, 12.8%, 12.8% Hospital volume Sex M=57.4%, 56.8%, 58.0% F=42.6%, 43.2%, 42.0% Age (years) <65= 28.4%, 28.2%, 29.7% 65‐74= 34.1%, 35.8%, 37.3% 75‐84= 30.9%, 28.5%, 28.3% 85+= 6.7%, 7.5%, 4.8% Tumour stage (Dukes') A= 14.1%, 14.5%, 14.3% B= 31.9%, 31.1%, 31.0% C= 26.9%, 25.3%, 28.1% D=18.8%, 20.7%, 18.0% No resection=6.2%, 6.2%, 6.3% Unknown=2.1%, 2.2%, 2.3% Comorbidity (ASA) 1=13.7%, 13.2%, 10.7% 2=42.5%, 43.8%, 43.6% 3=29.3%, 31.6%, 30.1% 4/5=5.6%, 7.2%, 5.5% Unknown=8.9%, 4.3%, 10.1% Tumour site Right= 30.8%, 33.1%, 31.1% Left= 31.1%, 27.3%, 28.0% Rectum= 37.6%, 38.8%, 40.3% Unknown=0.6%, 0.8%, 0.6% Urgent procedures 17.4%, 20.0%, 21.6% |
|
| Interventions | Total number of hospitals /units=17
Total number of surgeons=140. Caseload defined as average number of colorectal cancer operations in a year. Hospital volume LV=<87 MV=87‐109 HV=>109 Surgeon volume LV=<27 MV=27‐40 HV=>40 |
|
| Outcomes |
Outcomes for colorectal cancer only Overall five year survival 30 day and inpatient mortality, Anastomotic leak rate Outcomes for colon cancer only Overall five year survival 30 day and inpatient mortality Anastomotic leak rate Outcomes for rectal cancer only Overall five year survival 30 day and inpatient mortality Anastomotic leak rate Permanent stoma rate |
|
| Notes | Prognostic factors adjusted for included sex, age, stage, comorbidity and presentation | |
| Risk of bias | ||
| Bias | Authors' judgement | Support for judgement |
| Population based study? | Low risk | |
| Multicentre study? | Low risk | |
| Prospective design? | Low risk | |
| Representativeness of study cohort | Low risk | |
| Ascertainment of intervention | Low risk | |
| Comparability of intervention and comparison group | Low risk | |
| Assessments of outcomes | Low risk | |
| Addressing incomplete data <20% | Low risk | |
| Missing data on primary interventions/outcomes | Low risk | |
| Other bias | Unclear risk | Cannot be ruled out |
Carter et al 1995.
| Methods | Prospective population based registry study (UK) | |
| Participants | n=251 rectal cancer patients of a cohort of 750 colorectal patients undergoing abdominal resection of large bowel cancer between 1990‐1992. n=168 curative rectal cancer resections.
No reported definition of rectum Patient characteristics for entire patient cohort Surgeon volume Sex M=47.6% F=52.4% Median age=72 range (20‐95) Tumour stage (Dukes') A=9.2% B=43.1% C1=29.5% C2=0.9% D=16.8% Unknown=4 Emergency procedures for colorectal patients= 23.1% Emergency procedures for rectal cancer patients only=11.9%. |
|
| Interventions | Total number of surgeons=28
Actual definitions of volumes not stated
Surgeon volume 5 HV surgeons performed 131/260 rectal resections over study period. 23 LV surgeons performed 129/260 of rectal resections over study period. |
|
| Outcomes | Outcomes for rectal cancer only Anastomotic leak rate Permanent stoma rate | |
| Notes | No case mix adjustments performed | |
| Risk of bias | ||
| Bias | Authors' judgement | Support for judgement |
| Population based study? | Low risk | |
| Multicentre study? | Low risk | |
| Prospective design? | Low risk | |
| Representativeness of study cohort | Low risk | |
| Ascertainment of intervention | Unclear risk | Unclear |
| Comparability of intervention and comparison group | High risk | |
| Assessments of outcomes | Low risk | |
| Addressing incomplete data <20% | Low risk | |
| Missing data on primary interventions/outcomes | Low risk | |
| Other bias | Unclear risk | Cannot be ruled out |
COLOR Study Group.
| Methods | Selected cohort for COLOR (Colon cancer laparoscopic or open resection) trial (Netherlands) | |
| Participants | n=536 colon cancer patients undergoing laparoscopic resective surgery for a primary tumour diagnosed between 1997‐2003.
Patient characteristics according to volume/caseload groups
LV, MV, HV
Hospital volume Sex M=47%, 51%, 57% F=53%, 49%, 43% Mean age (years), 70.3%, 70.2%, 69.3% Tumour stage (AJCC) 1=24%, 23%, 26% 2=41%, 45%, 38% 3=35%, 31%, 36% Comorbidity index (ASA) 1= 24%, 32%, 23% 2= 58%, 58%, 56% 3=18%, 10%, 21% Tumour site Right colon=53%, 57%, 37% Left colon=6%, 8%, 18% Sigmoid= 38%, 33%, 38% Other= 4%, 3%, 5% |
|
| Interventions | Total number of hospitals=29 Caseload defined as average number of operations in a year and trial volume Hospital volume LV= <5/year and <10 in trial MV=5‐10/year and >10 in trial HV=>10/year and > in trial | |
| Outcomes | Outcomes for colon cancer only 28 day mortality Anastomotic leak rate | |
| Notes | No case mix adjustments performed | |
| Risk of bias | ||
| Bias | Authors' judgement | Support for judgement |
| Population based study? | High risk | |
| Multicentre study? | Low risk | |
| Prospective design? | Low risk | |
| Representativeness of study cohort | High risk | |
| Ascertainment of intervention | High risk | Hospital volume defined both annually and from trial data. |
| Comparability of intervention and comparison group | High risk | No adjustments with respect to mortality data |
| Assessments of outcomes | High risk | Study did not report independent reporting of data |
| Addressing incomplete data <20% | Low risk | |
| Missing data on primary interventions/outcomes | Low risk | |
| Other bias | Unclear risk | Cannot be ruled out |
Debes 2008.
| Methods | Retrospective single centre study (Norway) | |
| Participants | n= 102 rectal cancer patients that underwent curative resection between 1993‐2002.
Definition of rectum =15cm from anal verge
Patient characteristics according to volume/caseload groups
Surgeon volume
Sex
M=54.9%
F=45.1% Age (years) <60=20.6% 60‐69=21.6% 70‐79=38.2% > 80= 19.6% Tumour stage (Dukes') A= 8.8% B=56.8% C=32.4% D=2.0% Tumour grade/differentiation High= 5.9% Moderate=77.4% Low=14.7% Unknown= 2.0% Distance from anal verge 0‐5cm=25.5% 6‐10cm=40.2% 11‐15=34.3% Total mesorectal excision (TME) was performed in 59% and 97% of cohort in first and second half of study period respectively. |
|
| Interventions | Total number of surgeons=13 Caseload defined as average annual rectal cancer procedures Surgeon volume HV surgeons (HV)= >4 LV surgeons (LV)= <4 | |
| Outcomes | Outcomes for rectal cancer only 5 year overall survival | |
| Notes | No case mix adjustments performed | |
| Risk of bias | ||
| Bias | Authors' judgement | Support for judgement |
| Population based study? | High risk | |
| Multicentre study? | High risk | |
| Prospective design? | High risk | |
| Representativeness of study cohort | Low risk | |
| Ascertainment of intervention | Low risk | |
| Comparability of intervention and comparison group | High risk | |
| Assessments of outcomes | Low risk | |
| Addressing incomplete data <20% | Unclear risk | Unclear |
| Missing data on primary interventions/outcomes | Low risk | |
| Other bias | Unclear risk | Cannot be ruled out |
Dimick 2003.
| Methods | Retrospective population based audit (USA) | |
| Participants | n=20,862 colorectal cancer patients that underwent surgery in 1997
Definition of rectum=ICD‐9 CM codes Patient characteristics according to volume/caseload groups LV, MV, HV, VHV Hospital volume Sex M=53%, 53%, 51%, 52% F=47%, 47%, 51%, 52% Mean age (years) 71, 71, 70, 70 Comorbidity index (Charlson score) 0=33%, 29%, 30%, 26% 1=29%, 31%, 30%, 31% 2= 23%, 24%, 24%, 25% >3=15%, 17%, 17%, 18% Urgent procedures 25%, 19%, 18%, 17% Non‐white 14%, 12%, 14%, 11% Median income ($) 0‐25,000= 46%, 29%, 33%, 28% 25,001‐35,000= 32%, 38%, 28%, 32% 35,001‐45,000= 10%, 17%, 18%, 22% >45,000= 7%, 12%, 15%, 14% |
|
| Interventions | Total no of hospitals=842
Caseload defined as number of procedures in a year
Hospital volume LV=55 MV=55‐100 HV=101‐150 VHV=>151 |
|
| Outcomes | Outcomes for colorectal cancer only 30 day mortality (Not included in case mix adjustments) | |
| Notes | Prognostic factors adjusted for in study included sex, age, comorbidity and mode of presentation | |
| Risk of bias | ||
| Bias | Authors' judgement | Support for judgement |
| Population based study? | Low risk | |
| Multicentre study? | Low risk | |
| Prospective design? | Low risk | |
| Representativeness of study cohort | Low risk | |
| Ascertainment of intervention | Low risk | |
| Comparability of intervention and comparison group | Low risk | |
| Assessments of outcomes | Low risk | |
| Addressing incomplete data <20% | Low risk | |
| Missing data on primary interventions/outcomes | Low risk | |
| Other bias | Unclear risk | Cannot be ruled out |
Dorrance 2000.
| Methods | Retrospective single centre study (UK) | |
| Participants | n= 378 colorectal cancer patients that underwent resective surgery between 1990‐1993.
No reported definition for rectum Patient characteristics according to surgeon specialization Nonspecialist, Specialist Specialization Sex M=41.1%, 40% F=58.9%, 60% Age (years) 67, 71 Tumour stage (Dukes') A=6.3%, 9% B=52.7%, Unclear C=44.2%, 37% Tumour site Colon= 77.7%, 73.0% Rectum= 22.3%, 27% Urgent procedures 10.7%, 5% |
|
| Interventions | Specialization Definition of specialists= Fellowship training Total number of surgeons=12 | |
| Outcomes |
Outcomes for colorectal cancer only
30 day mortality
Anastomotic leak rate Outcomes for rectal cancer only APER rate |
|
| Notes | Inadequate data for meta‐analysis of anastomotic leak and APER rate | |
| Risk of bias | ||
| Bias | Authors' judgement | Support for judgement |
| Population based study? | High risk | |
| Multicentre study? | High risk | |
| Prospective design? | High risk | |
| Representativeness of study cohort | Low risk | |
| Ascertainment of intervention | Low risk | |
| Comparability of intervention and comparison group | Unclear risk | Unclear |
| Assessments of outcomes | Low risk | |
| Addressing incomplete data <20% | Low risk | |
| Missing data on primary interventions/outcomes | Low risk | |
| Other bias | Unclear risk | Cannot be ruled out |
Drolet 2011.
| Methods | Retrospective population based study (USA) | |
| Participants | n=54,000 colon cancer patients that underwent resective surgery between 2003‐2007.
Patient characteristics according to volume/caseload groups
LV, MV, HV Surgeon volume Sex M=47.3%, 47.9%, 47.8% F=52.7%, 52.1%, 52.2% Median age (years) 70.9, 71.2, 71.3 Tumour stage (TNM) Local (Any T, N0, M0) = 59.8%, 62.1%, 64.4% Nodal (Any T, N1/2, M0= 23.9%, 22.9%, 22.1% Metastasis (M1)= 16.3%, 15.0%, 13.4% Comorbidity (Elixhauser) 0=17.2%, 16.9%, 17.9% 1=24.5%, 24.8%, 25.4% 2=24.9%, 24.6%, 24.5% 3+=33.5%, 33.8%, 32.3% Hospital volume Sex M=47.5%, 48.5%, 47.0% F=52.5%, 51.5%, 53.0% Median age (years) 71.6, 71.1, 70.4 Tumour stage (TNM) Local (Any T, N0, M0) = 63.2%, 61.6%, 61.7% Nodal (Any T, N1/2, M0= 22.1%, 23.6%, 23.2% Metastasis (M1)= 14.7%, 14.8%, 15.1% Comorbidity (Elixhauser) 0=16.8%, 16.5%, 18.6% 1=24.1%, 24.9%, 25.7% 2=24.5%, 24.7%, 24.7% 3+=34.6%, 34.0%, 31.0% |
|
| Interventions | Total number of hospitals /units=1,398
Total number of surgeons=7,313. Caseload defined as average number of colon cancer operations in a year. Hospital volume LV=0‐30 MV=31‐60 HV=61+ Surgeon volume LV=0‐4 MV=5‐9 HV=10+ |
|
| Outcomes | Outcomes for colon cancer 30 day and inpatient mortality | |
| Notes | Prognostic factors adjusted for included sex, age, stage, comorbidity, nutritional status, presentation (perforation and obstruction) laparoscopy, type of resection, race and insurance status | |
| Risk of bias | ||
| Bias | Authors' judgement | Support for judgement |
| Population based study? | High risk | |
| Multicentre study? | Low risk | |
| Prospective design? | High risk | |
| Representativeness of study cohort | Low risk | |
| Ascertainment of intervention | High risk | |
| Comparability of intervention and comparison group | Low risk | |
| Assessments of outcomes | Low risk | |
| Addressing incomplete data <20% | Low risk | |
| Missing data on primary interventions/outcomes | Low risk | |
| Other bias | Unclear risk | Cannot be ruled out |
Elferink 2010A.
| Methods | Retrospective population based registry study (Netherlands) | |
| Participants | n=39,907 invasive colon cancer patients diagnosed between 2001‐2006.
Patient characteristics for entire colon cancer cohort
Hospital volume
Sex
M=49.8%
F=50.2%
Age (years),
<60=18.2%
60‐74=41.5%
>74=40.3% Tumour stage (UICC) I=15.6% II=34.6% III= 25.1% IV=21.7% Unknown=3.0% Tumour site Right side=36.2% Left side=23.4% Sigmoid=37.8% Unknown=2.7% |
|
| Interventions | Total number of hospitals /units=97 Caseload defined as average annual number of colon cancer diagnosis Hospital volume LV=<50 MV= 50‐100 HV=>100 |
|
| Outcomes | Outcomes for colon cancer only 30 day mortality | |
| Notes | Prognostic factors adjusted for included sex, age, stage, cancer region and hospital status | |
| Risk of bias | ||
| Bias | Authors' judgement | Support for judgement |
| Population based study? | Low risk | |
| Multicentre study? | Low risk | |
| Prospective design? | High risk | |
| Representativeness of study cohort | Low risk | |
| Ascertainment of intervention | Low risk | |
| Comparability of intervention and comparison group | Low risk | |
| Assessments of outcomes | Unclear risk | Unclear |
| Addressing incomplete data <20% | Low risk | |
| Missing data on primary interventions/outcomes | Low risk | |
| Other bias | Unclear risk | Cannot be ruled out |
Elferink 2010B.
| Methods | Retrospective population based registry study (Netherlands) | |
| Participants | n=16,039 rectal cancer patients diagnosed between 2001‐2006.
No reported definition for rectum
Patient characteristics for entire rectal cancer cohort
Hospital volume
Sex
M=58.5%
F=41.5%
Age (years),
<60=26.2%
60‐74=43.4%
>74=30.3% Tumour stage (UICC) T0/IS‐M0=0.3% T1‐M0=8.6% T2/T3‐M0=58.6% T4‐M0=10.3% Tany‐Nany‐M1=17.4% Unknown=4.8% |
|
| Interventions | Total number of hospitals /units=97 Caseload defined as average annual number of rectal cancer diagnosis Hospital volume LV=<25 MV= 25‐50 HV=>50 |
|
| Outcomes | Outcomes for rectal cancer only 30 day mortality | |
| Notes | Prognostic factors adjusted for included sex, age, stage, type of procedure, hospital status and cancer region | |
| Risk of bias | ||
| Bias | Authors' judgement | Support for judgement |
| Population based study? | Low risk | |
| Multicentre study? | Low risk | |
| Prospective design? | High risk | |
| Representativeness of study cohort | Low risk | |
| Ascertainment of intervention | Low risk | |
| Comparability of intervention and comparison group | Low risk | |
| Assessments of outcomes | Unclear risk | Unclear |
| Addressing incomplete data <20% | Low risk | |
| Missing data on primary interventions/outcomes | Low risk | |
| Other bias | Unclear risk | Cannot be ruled out |
Engel 2005A.
| Methods | Prospective population based registry study (Netherlands) | |
| Participants | n=67,594 colorectal cancer patients undergoing surgery between 1994 ‐1999.
No reported definition of rectum
Patient characteristics according to volume/caseload for entire colon cancer cohort
LV, MV, HV
Hospital volume Sex M= 48.0% F= 52.0% Mean age (years) 69.9, 69.4, 69.0 Emergency admission= 29.0%, 30.0%, 30.0% |
|
| Interventions | Total no of hospitals/units=128
Caseload defined as number of procedures throughout study period
Hospital volume LV=1‐540 MV=541‐773 HV=>773 |
|
| Outcomes |
Outcomes for colorectal cancer only In‐patient death |
|
| Notes | Prognostic factors adjusted for included age, sex and urgency of surgery | |
| Risk of bias | ||
| Bias | Authors' judgement | Support for judgement |
| Population based study? | Low risk | |
| Multicentre study? | Low risk | |
| Prospective design? | Low risk | |
| Representativeness of study cohort | Low risk | |
| Ascertainment of intervention | Low risk | |
| Comparability of intervention and comparison group | Low risk | |
| Assessments of outcomes | Low risk | |
| Addressing incomplete data <20% | Low risk | |
| Missing data on primary interventions/outcomes | Low risk | |
| Other bias | Unclear risk | Cannot be ruled out |
Engel 2005B.
| Methods | Retrospective population based registry study (Munich, Germany) | |
| Participants | n=884 primary invasive rectal cancer diagnosed between 1996‐1998 undergoing resective surgery Definition of rectum=16cm from anal verge Patient characteristics according to volume/caseload groups LV, MV, HV Hospital volume Sex M=55.4%, 52.3%, 59.8% F=44.6, 47.7%, 40.2% Age (years) <70= 54.5%, 53.5%, 68.6% >70= 45.5%, 46.5%, 31.4% Tumour stage (UICC) I=27.9%, 23.3%, 27.1% II= 23.4%, 24.6% 22.2% III= 30.6%, 34.3% 33.7% IV= 18.0%, 17.85, 17.0% Tumour grade/differentiation 1 and 2= 90.6%, 83.2%, 81.6% 3 and 4= 9.4%, 16.8%, 18.4% Distance from anal verge (cm) <4cm=7.1%, 5.4%, 6.6% 4‐8cm=31.3%, 31.3%, 34.0% 8‐12cm=25.9%, 32.9%, 35.3% 12‐16cm=35.7%, 30.4%, 24.1% Neoadjuvant therapy: 4.1%, 2.9%, 13.6% | |
| Interventions | Total no of hospitals/units=39
Caseload defined as average annual rectal cancer procedures in a year Hospital volume LV= <10 MV=10‐30 HV=>30 |
|
| Outcomes |
Outcomes for rectal cancer only Five year local recurrence rate (Not included in case mix adjustments) |
|
| Notes | Prognostic factors adjusted for in study included sex, age, stage, grade and neoadjuvant treatment | |
| Risk of bias | ||
| Bias | Authors' judgement | Support for judgement |
| Population based study? | Low risk | |
| Multicentre study? | Low risk | |
| Prospective design? | High risk | |
| Representativeness of study cohort | Low risk | |
| Ascertainment of intervention | Low risk | |
| Comparability of intervention and comparison group | Low risk | |
| Assessments of outcomes | Low risk | |
| Addressing incomplete data <20% | Low risk | |
| Missing data on primary interventions/outcomes | Low risk | |
| Other bias | Unclear risk | Cannot be ruled out |
Finlayson 2003.
| Methods | Retrospective population based audit (USA) | |
| Participants | n=120,270 colon cancer patients that underwent surgery between1995‐1997 Patient characteristics according to volume/caseload groups LV, MV, HV Hospital volume Sex M=56.6%, 46.1%, 47.4% F=53.4%, 53.9%, 52.6% Age (years) <65=24.2%, 24.7% 25.6% >65=75.8%, 75.3%, 74.4% Comorbidity index (Charlson score) <3=57.6%, 54.6%, 53.2% 3+=42.4%, 45.4%, 46.8% Urgent procedures 43.3%, 38.1%, 38.2% Ethnicity Non‐black= 93.8%, 92.5%, 95.7% Black=6.2%, 7.5%, 6.3% Median income ($) 0‐25,000= 39.9%, 25.0%, 22.8% >25,000=60.1%, 75.0%, 77.2% |
|
| Interventions | Total no of hospitals=1,082
Caseload defined as number of procedures in a year
Hospital volume LV=<61 MV=61‐116 HV=>116 |
|
| Outcomes | Outcomes for colon cancer only Inpatient mortality | |
| Notes | Prognostic factors adjusted for included sex, age, comorbidity, presentation, year of procedure, ethnicity, socioeconomic status/income | |
| Risk of bias | ||
| Bias | Authors' judgement | Support for judgement |
| Population based study? | Low risk | |
| Multicentre study? | Low risk | |
| Prospective design? | High risk | |
| Representativeness of study cohort | Low risk | |
| Ascertainment of intervention | Low risk | |
| Comparability of intervention and comparison group | Low risk | |
| Assessments of outcomes | Low risk | |
| Addressing incomplete data <20% | Low risk | |
| Missing data on primary interventions/outcomes | Low risk | |
| Other bias | Unclear risk | Cannot be ruled out |
Gort 2010.
| Methods | Prospective population based study (Netherlands) | |
| Participants | n=819 rectal cancer patients undergoing resective surgery from 2001‐2005.
No reported definition of rectum.
Patient characteristics across entire cohort Hospital and surgeon volume Sex M=61.8% F=38.2% Age (years) <70= 58.1% 70+= 41.9% Tumour stage (UICC) I= 32.0% II= 30.4% III= 37.6% Comorbidity (Modified Charlson index) 0= 43.8% 1= 28.8% 2+= 27.4% Distance from anal verge (cm) Low (0‐5)= 30.0% Middle (5‐10)= 37.1% High (>10)=32.8% |
|
| Interventions | Total number of hospitals /units=16
Total number of surgeons=76 Caseload defined as average number of rectal cancer operations in a year. Hospital volume LV=<20 MV=20‐40 HV=>= 40 Surgeon volume LV=<5 MV=5‐10 HV=>=10 |
|
| Outcomes | Outcomes for rectal cancer Five year disease specific survival | |
| Notes | Study included but not meta‐analysed on account of insufficient data | |
| Risk of bias | ||
| Bias | Authors' judgement | Support for judgement |
| Population based study? | Low risk | |
| Multicentre study? | Low risk | |
| Prospective design? | Low risk | |
| Representativeness of study cohort | Low risk | |
| Ascertainment of intervention | Low risk | |
| Comparability of intervention and comparison group | Low risk | |
| Assessments of outcomes | Low risk | |
| Addressing incomplete data <20% | Low risk | |
| Missing data on primary interventions/outcomes | Low risk | |
| Other bias | Unclear risk | Cannot be ruled out |
Grabham 1996.
| Methods | Prospective population based audit (Wessex colorectal cancer audit) (UK) | |
| Participants | n=1,326 rectal cancer patients diagnosed between 1991‐1994 undergoing resective surgery.
No definition of rectum stated No other characteristics were provided for cohort Urgent procedures 723 |
|
| Interventions | Total number of surgeons not stated. Caseload defined as average annual number of rectal cancer procedures in a year Surgeon volume LV= <10 HV= >10 | |
| Outcomes | Outcomes for rectal cancer only Anastomotic leak rate | |
| Notes | Study included but not meta‐analysed on account of insufficient data | |
| Risk of bias | ||
| Bias | Authors' judgement | Support for judgement |
| Population based study? | Low risk | |
| Multicentre study? | Low risk | |
| Prospective design? | Low risk | |
| Representativeness of study cohort | Low risk | |
| Ascertainment of intervention | Low risk | |
| Comparability of intervention and comparison group | Unclear risk | Unclear |
| Assessments of outcomes | Low risk | |
| Addressing incomplete data <20% | Unclear risk | Unclear |
| Missing data on primary interventions/outcomes | Unclear risk | Unclear |
| Other bias | Unclear risk | Cannot be ruled out |
Hannan 2002.
| Methods | Retrospective population based registry study (USA) | |
| Participants | n=22,128 colon cancer patients undergoing resective surgery between 1994‐1997.
Patient characteristics according to volume/caseload groups ? entire cohort
LV, MV, HV, VHV
Hospital volume and Surgeon volume Sex M= 45.4% F= 54.6% Age (years) <65= 25.6% >65= 74.4% Ethnicity Black=8.8% Other=91.2% |
|
| Interventions | Total no of hospitals=229
Total no of surgeons=2,052 Caseload defined as estimated number of procedures over study period Hospital volume LV=1‐83 MV=84‐144 HV=145‐253 VHV=254‐619 Surgeon volume LV=1‐11 MV=12‐20 HV=21‐34 VHV=35‐262 |
|
| Outcomes |
Outcomes for colon cancer only In‐hospital mortality |
|
| Notes | Prognostic factors adjusted for included sex, age, organ metastasis, individual comorbidities and race Not included in case mix adjusted analysis as confidence intervals not published |
|
| Risk of bias | ||
| Bias | Authors' judgement | Support for judgement |
| Population based study? | Low risk | |
| Multicentre study? | Low risk | |
| Prospective design? | High risk | |
| Representativeness of study cohort | Low risk | |
| Ascertainment of intervention | Low risk | |
| Comparability of intervention and comparison group | Unclear risk | Unclear |
| Assessments of outcomes | Low risk | |
| Addressing incomplete data <20% | Unclear risk | Unclear |
| Missing data on primary interventions/outcomes | Unclear risk | Unclear |
| Other bias | Unclear risk | Cannot be ruled out |
Harling 2005.
| Methods | Retrospective population based registry study (Denmark) | |
| Participants | n=5,021 rectal cancer patients undergoing resective surgery between 1994‐1999
No definition stated for rectum Patient characteristics according to volume/caseload groups LV, MV, HV Tumour stage (Dukes') A=15%, 15.1%, 12.9% B= 28.1%, 28.6%, 30.7% C= 29.6%, 26.5%, 27% D=15.8%, 19.3%, 17.7% Tumour site (Height <5cm) 21.5%, 21.1%, 24.2% Preoperative radiotherapy 1.7%, 7.8%, 11.4% |
|
| Interventions | Total no of hospitals=53 Caseload defined as average annual number of rectal cancer procedures Hospital volume LV=<15 MV=15‐30 HV=>30 | |
| Outcomes | Outcomes for rectal cancer only Overall five year survival (Not included in case mix adjustments) 30 day mortality Anastomotic leak rate, Permanent stoma rate | |
| Notes | Prognostic factors adjusted for included sex, age and tumour height. | |
| Risk of bias | ||
| Bias | Authors' judgement | Support for judgement |
| Population based study? | Low risk | |
| Multicentre study? | Low risk | |
| Prospective design? | High risk | |
| Representativeness of study cohort | Low risk | |
| Ascertainment of intervention | Low risk | |
| Comparability of intervention and comparison group | Low risk | |
| Assessments of outcomes | Low risk | |
| Addressing incomplete data <20% | Low risk | |
| Missing data on primary interventions/outcomes | Low risk | |
| Other bias | Unclear risk | Cannot be ruled out |
Harmon 1999.
| Methods | Retrospective multicentre study (USA) | |
| Participants | n=1,821 rectal cancer patients of a cohort of 9,739 adult patients that underwent surgery for colorectal cancer between 1992‐1996.
Defintion of rectum=ICD‐9‐CM code Patient characteristics according to volume/caseload groups LV, MV, HV Hospital volume Sex M=47.8%, 46.6%, 48.7% F=52.2%, 53.4%, 51.3% Mean age (years) 69.1%, 69.5%, 68.8% Tumour stage Localised= 56.6%, 59.2%, 56.6%, Lymph node involvement=18.7%, 21.0%, 19.9% Organ metastases=24.7%, 19.8%, 23.6% Mean comorbidity score 0.45, 0.43, 0.39 Urgent procedures 51.6%, 36.0%, 39.8% Ethnicity White=74.9%, 81.7%, 84.7% Black=23.3%, 16.5%, 13.5% Surgeon volume LV, MV, HV Sex M=47.0%, 48.6%, 47.2% F=53%, 51.4%, 52.8% Mean age (years) 68.7%, 69.2%, 69.3% Tumour stage Localised= 56.8%, 57.0%, 59.3%, Lymph node involvement=19.4%, 20.0%, 20.4% Organ metastases=23.9%, 23.0%, 20.4% Mean comorbidity score 0.43, 0.42, 0.41 Urgent procedures 46.0%, 41.1%, 38.8% Ethnicity White=74.4%, 83.8%, 84.1% Black=23.8%, 14.8%, 13.7% |
|
| Interventions | Total number of hospitals /units= 50
Total number of surgeons=812 Caseload defined as colorectal cancer operations in a year Hospital volume LV =<40 MV=40‐70 HV=>70 Surgeon volume LV= 1‐5 MV=6‐10 HV= >11 |
|
| Outcomes |
Outcomes for colorectal cancer only
30 day mortality Outcomes for rectal cancer only APER rate |
|
| Notes | No case mix adjustments performed | |
| Risk of bias | ||
| Bias | Authors' judgement | Support for judgement |
| Population based study? | High risk | |
| Multicentre study? | Low risk | |
| Prospective design? | High risk | |
| Representativeness of study cohort | Unclear risk | Excluded federal hospitals |
| Ascertainment of intervention | Low risk | |
| Comparability of intervention and comparison group | Low risk | |
| Assessments of outcomes | Low risk | |
| Addressing incomplete data <20% | Low risk | |
| Missing data on primary interventions/outcomes | Low risk | |
| Other bias | Unclear risk | Cannot be ruled out |
Hodgson 2003.
| Methods | Retrospective population based registry study (USA) | |
| Participants | n=7,257 rectal cancer patients undergoing surgical resection between 1994‐1997
No reported definition for rectum
Patient characteristics according to volume/caseload groups
LV, MV, HV, VHV
Hospital volume
Sex
M=54.7%, 57.4%, 55.3%, 54.8%
F=45.3%, 42.6%, 44.7%, 45.2%
Median age (years) (range)
68.7 (61–78), 68.8 (61–78), 67.5 (60–77), 67.6 (60–76) Tumour stage (AJCC) I= 31.6%, 33.6%, 36.0%, 34.4% II= 36.7%, 34.0%, 31.7%, 31.3% III= 31.7%, 32.4%, 32.3%, 34.4% Comorbidity index (Deyo modification of Charlson index) 0= 65.6%, 67.0%, 71.1%, 70.1% 1= 22.1%, 21.9%, 19.0%, 20.2% >2=12.3,% 11.1%, 9.9%, 9.7% Tumour site Rectum= 57.3%, 57.9%, 57.5%, 58.7% Rectosigmoid= 42.%7, 42.1%, 42.5%, 41.3% Ethnicity White= 70.7%, 75.6%, 76.8%, 76.4% Black= 5.3%, 5.0%, 3.7%, 5.7% Hispanic=14.9%, 11.2%, 9.9%, 8.45 Asian=8.5%, 7.8%, 9.3%, 9.2% Other= 0.6%, 0.4%, 0.3%, 0.3% Socioeconomic quartile (Ascending order) 1= 34.5%, 28.9%, 21.9%, 16.1% 2= 27.1%, 27.1%, 24.5%, 21.8% 3= 23.7%, 27.1%, 22.6%, 25.9% 4= 14.7%, 16.9%, 31.0%, 36.2% |
|
| Interventions | Total number of hospitals=367 Caseload defined as average annual number of rectal cancer operations performed in a year Hospital volume LV=<7 MV= 7‐13 HV= 14‐20 VHV= >20 | |
| Outcomes | Outcomes for rectal cancer only 30 day mortality Permanent stoma rate | |
| Notes | Prognostic factors adjusted for included sex, age, race, comorbidity, deprivation, tumour site, stage and number of examined lymph nodes | |
| Risk of bias | ||
| Bias | Authors' judgement | Support for judgement |
| Population based study? | Low risk | |
| Multicentre study? | Low risk | |
| Prospective design? | High risk | |
| Representativeness of study cohort | Low risk | |
| Ascertainment of intervention | Low risk | |
| Comparability of intervention and comparison group | Low risk | |
| Assessments of outcomes | Low risk | |
| Addressing incomplete data <20% | Low risk | |
| Missing data on primary interventions/outcomes | Low risk | |
| Other bias | Unclear risk | Cannot be ruled out |
Kressner 2009.
| Methods | Prospective population based registry study (Sweden) | |
| Participants | n=10,425 rectal cancer patients undergoing resective surgery between 1995‐2003
Definition of rectal cancer= 15 cm from anal verge. Patient characteristics according to volume/caseload groups LV, MV, HV Hospital volume Sex M=60%, 57%, 57% F=40%, 43%, 43% Mean age (years) 70.4, 69.6, 69.4 Tumour stage (UICC) Stage 1=22%, 23%, 23% Stage 2=35%, 32%, 31% Stage 3= 30%, 33%, 31% Stage 4=12%, 11%, 13% Missing= 1%, 1%, 2% Distance from anal verge (cm) 0‐5= 32%, 30%, 30% 6‐10= 37%, 39%, 38% 10‐15= 29%, 30%, 31% missing=2%, 1%, 1% |
|
| Interventions | All hospitals in Sweden
Caseload defined as average annual number of procedures in a year
Hospital volume LV=<11 MV=11‐25 HV=>25 |
|
| Outcomes | Outcomes for rectal cancer only Overall five year survival 30 day mortality (Not included in case mix adjustments) Five year local recurrence rate (Not included in case mix adjustments) Anastomotic leak rate | |
| Notes | Prognostic factors adjusted for included sex, age, stage and radiotherapy | |
| Risk of bias | ||
| Bias | Authors' judgement | Support for judgement |
| Population based study? | Low risk | |
| Multicentre study? | Low risk | |
| Prospective design? | Low risk | |
| Representativeness of study cohort | Low risk | |
| Ascertainment of intervention | Low risk | |
| Comparability of intervention and comparison group | Low risk | |
| Assessments of outcomes | Low risk | |
| Addressing incomplete data <20% | Low risk | |
| Missing data on primary interventions/outcomes | Low risk | |
| Other bias | Unclear risk | Cannot be ruled out |
Kuwabara 2009.
| Methods | Retrospective population based study (Japan) | |
| Participants | n=3,765 colon cancer patients that underwent laparoscopic resective surgery in between July‐December 2007
Patient characteristics according to volume/caseload groups
LV, MV, HV, VHV Hospital volume Sex M=57.7%, 54.3%, 55.0%, 54.9% F=42.3%, 45.7%, 45.0%, 45.1% Mean age (years) 67.3, 67.7, 67.6, 67.2 Comorbidity (Charlson) 1=14.0%, 12.4%, 13.3%, 6.2% 2=7.1%, 6.9%, 7.1%, 4.0% 3+=4.0%, 6.3%, 8.0%, 5.5% Tumour site Right colon= 37.8%, 41.2%, 38.4%, 37.4% Transverse=13.1%, 11.8%, 12.9%, 15.7% Left= 6.9%, 8.0%, 7.3%, 7.2% Sigmoid=42.3%, 39.1%, 41.3%, 39.7% |
|
| Interventions | Total number of hospitals /units=567 Caseload defined as average number of colon cancer operations in a month. Hospital volume LV=<1 MV=1 or 2 HV=3 or 4 VHV=5+ |
|
| Outcomes | Outcomes for colon cancer 30 day and inpatient mortality | |
| Notes | No case mix adjustments performed | |
| Risk of bias | ||
| Bias | Authors' judgement | Support for judgement |
| Population based study? | Low risk | |
| Multicentre study? | Low risk | |
| Prospective design? | High risk | |
| Representativeness of study cohort | Low risk | |
| Ascertainment of intervention | Low risk | |
| Comparability of intervention and comparison group | Low risk | |
| Assessments of outcomes | Low risk | |
| Addressing incomplete data <20% | High risk | |
| Missing data on primary interventions/outcomes | Low risk | |
| Other bias | Unclear risk | Cannot be ruled out |
Larson 2008.
| Methods | Selected cohort for COST (Clinical outcomes of surgical therapy) trial (USA) | |
| Participants | n=871 colon cancer patients undergoing resective surgery from 1994‐2001.
Patient characteristics according to caseload/volume groups
LV, MV, HV Surgeon volume Sex M=53%, 51%, 46% F=47%, 49%, 54% Median Age (years) 67.9, 65.9, 69.6 Tumour stage (AJCC) I= 30%, 29%, 32% II= 34%, 34%, 31.0% III= 29.0%, 27.0%, 26.0% IV=0%, 4%, 4% Comorbidity (ASA) 1or 2=85.0%, 88.0%, 85.0% 3,4,5=15.0%, 12.0%, 15.0% Site of tumour Right= 53.0%, 46.0%, 63.0% Left= 8.0%, 9.0%, 6.0% Sigmoid= 39.0%, 45.0%, 32.0% |
|
| Interventions | Total number of surgeons=53. Caseload defined as average number of colon cancer operations in a year. Surgeon volume LV=<5 MV=6‐10 HV=>10 |
|
| Outcomes | Outcomes for colon cancer only Overall five year survival | |
| Notes | Study included but not meta‐analysed on account of insufficient data | |
| Risk of bias | ||
| Bias | Authors' judgement | Support for judgement |
| Population based study? | High risk | |
| Multicentre study? | Low risk | |
| Prospective design? | Low risk | |
| Representativeness of study cohort | High risk | |
| Ascertainment of intervention | Low risk | |
| Comparability of intervention and comparison group | Low risk | |
| Assessments of outcomes | Low risk | |
| Addressing incomplete data <20% | Low risk | |
| Missing data on primary interventions/outcomes | Low risk | |
| Other bias | Unclear risk | Cannot be ruled out |
Lin 2006.
| Methods | Retrospective population based registry study (Taiwan) | |
| Participants | n=13,054 colon cancer patients that underwent resective surgery between 2000‐2003
Patient characteristics according to volume/caseload VLV, LV, MV, HV, VHV Hospital volume Sex M=58.0%, 53.0%, 52.0%, 56.0%, 56.0% F=42.0%, 47.0%, 48.0%, 44.0%, 44.0% Mean age (years) 68.0, 67.0, 65.0, 66.0, 65 Comorbidity (Charlson) 1+2=65.0%, 53.0%, 50.0%, 52.0%, 47.0% 3+=35.0%, 47.0%, 50.0%, 48.0%, 53.0% |
|
| Interventions | Total number of hospitals /units=not reported Caseload defined as average number of colon cancer operations over study period. Hospital volume VLV=<82 LV=82‐193 MV=194‐338 HV=339‐668 VHV=>668 |
|
| Outcomes | Outcomes for colon cancer only 30 day and inpatient mortality | |
| Notes | Prognostic factors adjusted for included sex, age and comorbidity | |
| Risk of bias | ||
| Bias | Authors' judgement | Support for judgement |
| Population based study? | Low risk | |
| Multicentre study? | Low risk | |
| Prospective design? | High risk | |
| Representativeness of study cohort | Low risk | |
| Ascertainment of intervention | Low risk | |
| Comparability of intervention and comparison group | Low risk | |
| Assessments of outcomes | Low risk | |
| Addressing incomplete data <20% | Unclear risk | Unclear |
| Missing data on primary interventions/outcomes | Low risk | |
| Other bias | Unclear risk | Cannot be ruled out |
Manchon‐Walsh 2011.
| Methods | Retrospective population based registry study (Spain) | |
| Participants | n=1,831 rectal cancer patients that underwent curative intent surgery between 2005‐2007
Definition of rectum=16cm from anal verge Patient characteristics for entire cohort Hospital volume Sex M=65.2%, F=34.8% Median age (years) 70 Tumour stage (UICC) 0=1.0% I=12.3% II=28.0% III=43.3% IV=7.4% Missing=8.1% Comorbidity index (ASA) 1=7.6% 2= 55.3% 3=33.4% 4=3.6% Missing=0.2% Tumour site Lower third=28.6% Middle third=31.3% Upper third=18.6% Rectosigmoid=6.4% Missing=15.1% Urgent procedures 5.6% |
|
| Interventions | Total no of hospitals=51
Caseload defined as number of procedures in a year Hospital volume LV=<11 MV=12‐30 HV=>30 |
|
| Outcomes |
Outcomes for rectal cancer only 30 day mortality Anastomotic leak rate (Not included in case mix adjustments) Permanent stoma rate (Not included in case mix adjustments) |
|
| Notes | Prognostic factors adjusted for included sex, age, stage, comorbidity and presentation | |
| Risk of bias | ||
| Bias | Authors' judgement | Support for judgement |
| Population based study? | Low risk | |
| Multicentre study? | Low risk | |
| Prospective design? | High risk | |
| Representativeness of study cohort | Low risk | |
| Ascertainment of intervention | Low risk | |
| Comparability of intervention and comparison group | Low risk | |
| Assessments of outcomes | Unclear risk | Unclear |
| Addressing incomplete data <20% | Low risk | |
| Missing data on primary interventions/outcomes | Low risk | |
| Other bias | Unclear risk | Cannot be ruled out |
Martling 2002.
| Methods | Prospective population based registry study (Sweden) | |
| Participants | All rectal cancer patients (n=652) undergoing abdominal resection for rectal cancer in Stockholm between 1995‐1997.
No reported definition for rectum
Patient characteristics according to volume/caseload
LV, HV
Surgeon volume
Sex
M=54%, 59%
F=46%, 41% Median age (years) 72, 70 Tumour stage (UICC) I= 28%, 26% II= 34%, 31% III= 27%, 29% IV= 10%, 13% Missing= 1%, 0% Tumour site 0‐5cm=30%, 29% 6‐10cm=36%, 35% >10cm= 33%, 33% Missing data=1%,3%. Preoperative radiotherapy 53%, 60% Total mesorectal excision (TME) 76%, 87% Surgeon specialisation Non‐specialist/ specialist Sex M=35%, 58% F=65%, 42% Median age (years) 74, 71 Tumour stage (UICC) I= 26%, 27% II= 33%, 33% III= 30%, 28% IV= 11%, 12% Missing= 0%, 1% Distance of tumour from anal verge, 0‐5cm=26%, 30% 6‐10cm=43%, 35% >10cm= 28%, 33% Missing data=2%,2%. Preoperative radiotherapy 39%, 58% |
|
| Interventions | Total number of surgeons= 46
Caseload defined as average annual number of rectal cancer operations in a year Surgeon volume LV=<12 HV=>12 Specialization Definition of specialist= Attendance at TME workshop |
|
| Outcomes | Outcomes for rectal cancer only 30 day mortality Anastomotic leak rate Stoma rate APER rate | |
| Notes | No case mix adjustments performed however authors stated no difference between volume groups | |
| Risk of bias | ||
| Bias | Authors' judgement | Support for judgement |
| Population based study? | Low risk | |
| Multicentre study? | Low risk | |
| Prospective design? | Low risk | |
| Representativeness of study cohort | Low risk | |
| Ascertainment of intervention | Low risk | |
| Comparability of intervention and comparison group | Low risk | |
| Assessments of outcomes | Low risk | |
| Addressing incomplete data <20% | Low risk | |
| Missing data on primary interventions/outcomes | Low risk | |
| Other bias | Unclear risk | Cannot be ruled out |
Marusch 2001A.
| Methods | Prospective multicentre study (Germany) | |
| Participants | n=1,463 rectal cancer patients undergoing surgical excision in 1999. Definition of rectal cancer= 16 cm from anal verge Patient characteristics according to volume/caseload LV, MV, HV Hospital volume Distance from anal margin 0‐4cm=13.1%, 17.7%, 14.7% 4‐8cm=29.5%, 26.0%, 30.2% 8‐12cm= 30.7%, 32.6%, 34.7% 12‐16cm= 26.7%, 23.7%, 20.4% TME performed 58.6%, 61.5%, 61.8% | |
| Interventions | Total number of hospitals=75
Caseload defined as average number of operations over study period
Hospital volume LV=<20 MV=20‐40 HV=>40 |
|
| Outcomes | Outcomes for rectal cancer only Anastomotic leak rate APER rate | |
| Notes | No case mix adjustments performed however authors stated no difference between volume groups with respect to sex, age, BMI, individual risk factors, ASA and stage (UICC) | |
| Risk of bias | ||
| Bias | Authors' judgement | Support for judgement |
| Population based study? | High risk | |
| Multicentre study? | Low risk | |
| Prospective design? | Low risk | |
| Representativeness of study cohort | Low risk | |
| Ascertainment of intervention | Low risk | |
| Comparability of intervention and comparison group | Low risk | |
| Assessments of outcomes | Low risk | |
| Addressing incomplete data <20% | Low risk | |
| Missing data on primary interventions/outcomes | Low risk | |
| Other bias | Unclear risk | Cannot be ruled out |
Marusch 2001B.
| Methods | Prospective multicentre study (Germany) | |
| Participants | n=2,293 colon cancer patients undergoing surgery in 1999.
Patient characteristics according to volume/caseload
LV, MV, HV
Hospital volume Sex M=49.9%, 50.5%, 55.4% F=51.1%, 49.5%, 44.6% Median age (years) 69, 69, 68 Tumour stage (UICC) I=16.4%, 19.5%, 19.3% II=31.0%, 32.2%, 29.2% III=32.6%, 25.8%, 30.4% IV=18.1%, 19.8%, 19.9% Missing= 1.6%, 2.6%, 1.2% Comorbidity index (ASA) I=6.9%, 3.7%, 7.8% II=46.1%, 42.4%, 57.4% III=43.2%, 47.7%, 32.5% IV=3.9%, 6.2%, 2.3% Missing=0%, 0.005%, 0.003% Urgent procedures 9.5%, 11.6%, 8.1% |
|
| Interventions | Total number of hospitals=75
Caseload defined as average number of operations over study period
Hospital volume LV=<30 MV=31‐60 HV=>60 |
|
| Outcomes | Outcomes for colon cancer only 30 day mortality Anastomotic leak rate, | |
| Notes | No case mix adjustments performed | |
| Risk of bias | ||
| Bias | Authors' judgement | Support for judgement |
| Population based study? | High risk | |
| Multicentre study? | Low risk | |
| Prospective design? | Low risk | |
| Representativeness of study cohort | Low risk | |
| Ascertainment of intervention | Low risk | |
| Comparability of intervention and comparison group | Low risk | |
| Assessments of outcomes | Low risk | |
| Addressing incomplete data <20% | Low risk | |
| Missing data on primary interventions/outcomes | Low risk | |
| Other bias | Unclear risk | Cannot be ruled out |
Marwan 2010.
| Methods | Retrospective population based registry study (Australia) | |
| Participants | n= 582 rectal cancer patients who underwent resective surgery in 2005 Definition of rectum=ICD for oncology 3 ed. C20 Patient characteristics across entire rectal cancer cohort Surgeon volume and Specialization Sex M=66.0% F=34.0% Age (years) <60=32.3% 60‐69=27.3% >70=40.4 Tumour stage (T stage only) 0=0.3% I=6.9% II=19.2% III=42.3% IV= 6.2% Missing=25.1% |
|
| Interventions | Total number of surgeons=129
Caseload defined as average annual number of rectal cancer operations performed in a year
Surgeon volume LV=1‐4 HV=>5 Specialization Definition of Specialists= CSSANZ (Colorectal surgical society of Australia and New‐Zealand) membership |
|
| Outcomes | Outcomes for rectal cancer only APER rate | |
| Notes | No case mix adjustments performed | |
| Risk of bias | ||
| Bias | Authors' judgement | Support for judgement |
| Population based study? | Low risk | |
| Multicentre study? | Low risk | |
| Prospective design? | High risk | |
| Representativeness of study cohort | Low risk | |
| Ascertainment of intervention | Low risk | |
| Comparability of intervention and comparison group | High risk | |
| Assessments of outcomes | Unclear risk | Unclear |
| Addressing incomplete data <20% | Low risk | |
| Missing data on primary interventions/outcomes | Low risk | |
| Other bias | Unclear risk | Cannot be ruled out |
McArdle 2004.
| Methods | Combined retrospective and prospective population based study (UK) | |
| Participants | n= 3,200 colorectal cancer patients undergoing resective surgery between 1991‐1994.
No reported definition for rectum provided Patient characteristics across entire colorectal cohort Surgeon volume and specialization Sex M=50.2% F=49.8% Age (years) <55=10.1%, 55‐64=20.7%, 65‐74=34.2% >75=35.1%. Tumour stage (Dukes') A =6.7% B=44.0% C=30.2% D=19.1%. Tumour site Right sided=28.0% Left sided=15.4% Sigmoid colon=21.2% Rectum=34.1% Urgent procedures 30.8% Level of deprivation (Carstairs Index) Affluent=18.7% Intermediate=62.1% Deprived=19.2% |
|
| Interventions | Total number of surgeons= 84.
Caseload defined as average number of colorectal cancer procedures over study period
Surgeon volume LV= <30 M= 30‐60 HV= >60 Specialization Definition of specialist= Assigned by dedicated panel based on commitment to specialty, access to colonoscopy sessions, and development of new specialist techniques and treatments |
|
| Outcomes |
Outcomes for colorectal cancer only
Overall five year survival Five year cancer specific survival 30 day mortality (Not included in case mix adjustments) |
|
| Notes | Prognostic factors adjusted for included sex, age, stage, site, mode of presentation and deprivation | |
| Risk of bias | ||
| Bias | Authors' judgement | Support for judgement |
| Population based study? | Low risk | |
| Multicentre study? | Low risk | |
| Prospective design? | High risk | |
| Representativeness of study cohort | Low risk | |
| Ascertainment of intervention | Low risk | |
| Comparability of intervention and comparison group | Low risk | |
| Assessments of outcomes | Low risk | |
| Addressing incomplete data <20% | Low risk | |
| Missing data on primary interventions/outcomes | Low risk | |
| Other bias | Unclear risk | Cannot be ruled out |
McGrath 2005.
| Methods | Prospective population based study (Australia) | |
| Participants | n=523 rectal cancer patients of a cohort of 1911 colorectal patients undergoing resective surgery from February‐April 2000.
No reported definition of rectum. Patient characteristics of entire colorectal cohort according to volume/caseload LV, HV Surgeon volume Sex M=55.2%, 54.2% F=44.8%, 45.8% Mean age (years) 66.8, 66.4 Tumour stage (Dukes') A=23.1%, 23.7% B=27.2%, 28% C=26.2%,28.2% D=19.2%,15.5% Distance from anal margin (rectal cancer only) upper third=23.7%, 16.4% middle third=30.1%, 36.1% lower third=44.6%, 46.7% Urgent procedures 14.1%, 7.4% Hospital volume No patient data reported for hospital volume groups |
|
| Interventions | Total number of hospitals=285
Total number of surgeons=550
Caseload defined as colorectal cancer operations over 3 month period
Hospital volume LV=1‐12 HV=>13 Surgeon volume LV = <6 HV = >6. |
|
| Outcomes | Outcomes for colorectal cancer only 30 day mortality (Not included in case mix adjustments) Outcomes for rectal cancer only APER rate (Not included in case mix adjustments) | |
| Notes | Prognostic factors adjusted for in study included age and stage of disease. | |
| Risk of bias | ||
| Bias | Authors' judgement | Support for judgement |
| Population based study? | Low risk | |
| Multicentre study? | Low risk | |
| Prospective design? | Low risk | |
| Representativeness of study cohort | Low risk | |
| Ascertainment of intervention | Low risk | |
| Comparability of intervention and comparison group | Low risk | |
| Assessments of outcomes | Low risk | |
| Addressing incomplete data <20% | Low risk | |
| Missing data on primary interventions/outcomes | Low risk | |
| Other bias | Unclear risk | Cannot be ruled out |
Mella 1997.
| Methods | Prospective population based registry study (UK) | |
| Participants | n= 3,221 colorectal cancer patients undergoing surgery between 1992‐1993. Definition of rectum=15 cm from anal verge Patient characteristics across entire colorectal cohort Surgeon volume and Specialization Tumour stage (Dukes') A =8% B=31% C=21% D=21% Missing= 7% No resection=4% No operation=8% Comorbidity index (ASA) 1=17.6% 2=42.9% 3=22.8% 4 and 5=3.5% Missing=13.1% Tumour site Caecum=14% Ascending colon=7% Hepatic flexure=3% Transverse colon=4% Splenic flexure=3% Descending colon=5% Sigmoid colon=21% Rectosigmoid=10% Rectum=1% Urgent procedures 17.1% |
|
| Interventions | Total number of surgeons=161
Caseload defined as average annual number of colorectal cancer operations performed in a year
Surgeon volume LV= 1‐10 MV=11‐30 HV= >30 Specialization Definition of Specialists= Self declared interest |
|
| Outcomes | Outcomes for colorectal cancer 30 day mortality | |
| Notes | No case mix adjustments performed | |
| Risk of bias | ||
| Bias | Authors' judgement | Support for judgement |
| Population based study? | Low risk | |
| Multicentre study? | Low risk | |
| Prospective design? | Low risk | |
| Representativeness of study cohort | Low risk | |
| Ascertainment of intervention | Low risk | |
| Comparability of intervention and comparison group | Unclear risk | Unclear |
| Assessments of outcomes | Low risk | |
| Addressing incomplete data <20% | Low risk | |
| Missing data on primary interventions/outcomes | Low risk | |
| Other bias | Unclear risk | Cannot be ruled out |
Meyerhardt 2003.
| Methods | Selected cohort for chemotherapy trial (Intergroup 0089) (USA) | |
| Participants | n=3,161 colon cancer patients undergoing resective surgery for a primary tumour diagnosed between 1988‐1992.
Patient characteristics according to volume/caseload
LV, MV, HV
Hospital volume Sex M=50.6%, 52.6%, 52.9% F=49.4%, 47.4%, 47.1% Mean age (years), 61.3%, 62.3%, 61.9% T stage T1=1.1%, 1.5%, 3.3% T2=8.6%, 9.4%, 9.3% T3=62.0%, 62.8%, 64.6% T4= 28.3%, 26.3%, 22.8% N stage N0= 20.7%, 21.1%, 16.5% N1=58.7%, 58.7%, 65.6% N2=20.6%,20.2%, 17.9% Tumour grade/differentiation Well=12.1%, 7.6%, 7.5% Moderate=67.6% 68.4%, 68.2% Poor=20.3%, 24.0%, 24.3% Performance status 0=66.3%, 67.2%, 68.8% 1=30.4%, 29.2%, 28.9% 2+=3.3%, 3.6%, 2.3% Tumour site Right colon=49.3%, 50.2%, 50.7% Left colon=50.3%, 49.1%, 49.0% Left and right colon= 0.4%, 0.7%, 0.3% Ethnicity White=81.6%, 90.2%, 87.4% Black=12.3%, 7.7%, 8.3% Other=6.1%, 2.1%, 4.3% |
|
| Interventions | Total number of hospitals /units=1,078
Caseload not derived from study but from medicare data Hospital volume LV=<46 MV= 47‐84 HV=>85 |
|
| Outcomes | Outcomes for colon cancer only Overall five year survival | |
| Notes | Prognostic factors adjusted for included sex, age, stage, grade, comorbidity, presentation, ethnicity, hospital volume and clustering | |
| Risk of bias | ||
| Bias | Authors' judgement | Support for judgement |
| Population based study? | High risk | |
| Multicentre study? | Low risk | |
| Prospective design? | Low risk | |
| Representativeness of study cohort | High risk | |
| Ascertainment of intervention | High risk | |
| Comparability of intervention and comparison group | Low risk | |
| Assessments of outcomes | Low risk | |
| Addressing incomplete data <20% | High risk | |
| Missing data on primary interventions/outcomes | High risk | |
| Other bias | Unclear risk | Cannot be ruled out |
Meyerhardt 2004.
| Methods | Selected cohort for chemotherapy trial 0114 (USA) | |
| Participants | n=1,330 rectal cancer patients undergoing resective surgery for a primary tumour diagnosed between 1990 ‐1992.
Definition of rectum=ICD codes
Patient characteristics according to volume/caseload for entire rectal cancer cohort
LV, MV, HV
Hospital volume Sex M=62.4%, 64.7%, 65.6% F=37.6%, 35.3%, 34.4% Mean age (years), 60.1%, 60.7%, 62.1% T stage T0, T1, T2=15.4%, 15.8%, 14.8% T3=73.2%, 76.8%, 77.2% T4= 11.4%, 7.4%, 8.0% N stage N0= 32.9%, 32.1%, 30.8% N1=44.5%, 41.7%, 46.0% N2=22.6%,26.2%, 24.0% Tumour grade/differentiation Well=9.4%, 7.8%, 7.6% Moderate=69.7% 71.0%, 73.0% Poor=19.3%, 19.1%, 18.7% Other=1.6% 2.1%, 0.7% Performance status 0=66.4%, 66.5%, 66.0% 1=30.7%, 32.8%, 31.5% 2+=2.9%, 0.7%, 2.5% Tumour site Lower third=28.9%, 29.1%, 23.8% Middle third=54.7%, 51.2%, 55.1% Upper third= 16.4%, 19.7%, 21.1% Ethnicity White=87.2%, 92.7%, 92.6% Black=6.5%, 4.1%, 2.2% Other=6.3%, 3.2%, 5.2% |
|
| Interventions | Total number of hospitals /units=646
Caseload not derived from study but from medicare data
Hospital volume LV=0‐8 MV= 9‐16 HV=17‐92 |
|
| Outcomes | Outcomes for rectal cancer only Overall five year survival Five year local recurrence rate APER rate | |
| Notes | Prognostic factors adjusted for included sex, age, stage, harvested lymph nodes, comorbidity, presentation, ethnicity, hospital volume and clustering | |
| Risk of bias | ||
| Bias | Authors' judgement | Support for judgement |
| Population based study? | High risk | |
| Multicentre study? | Low risk | |
| Prospective design? | Low risk | |
| Representativeness of study cohort | High risk | Trial data, excluded Canadians and VA hospitals |
| Ascertainment of intervention | High risk | Volume levels derived from administrative data (medicare) not from study data |
| Comparability of intervention and comparison group | Low risk | |
| Assessments of outcomes | Low risk | |
| Addressing incomplete data <20% | High risk | |
| Missing data on primary interventions/outcomes | High risk | Excluded 462= (1792‐1330) due to unavailability of hospital volume ranking |
| Other bias | Unclear risk | Cannot be ruled out |
Morris 2007.
| Methods | Retrospective population based registry study (Australia) | |
| Participants | n=1,467 stage (AJCC) II colon cancer patients who underwent surgical resection between 1993‐2003. Patient characteristics according to volume groups LV, MV, HV, unknown Surgeon volume Sex M=49%, 49%, 54%, 45% F=51%, 51%, 46%, 55% Mean age (years) 71, 72, 68, 78 |
|
| Interventions | Total number of surgeons=68 Caseload defined as average number of colon cancer operations over study period Surgeon volume LV= <10 MV= 11‐25 HV= >25 Unknown= No volume calculation for 19% of cases |
|
| Outcomes |
Outcomes for colon cancer only
Overall five year survival 30 day mortality (Not included in case mix adjustments) |
|
| Notes | Prognostic factors adjusted for included sex, age, vascular invasion, perineural invasion, adjuvant chemotherapy in survival analysis | |
| Risk of bias | ||
| Bias | Authors' judgement | Support for judgement |
| Population based study? | Low risk | |
| Multicentre study? | Low risk | |
| Prospective design? | High risk | |
| Representativeness of study cohort | Low risk | |
| Ascertainment of intervention | Low risk | |
| Comparability of intervention and comparison group | Low risk | |
| Assessments of outcomes | Low risk | |
| Addressing incomplete data <20% | Low risk | |
| Missing data on primary interventions/outcomes | Low risk | |
| Other bias | Unclear risk | Cannot be ruled out |
Mroczkowski 2011.
| Methods | Prospective population based study (Germany) | |
| Participants | n=31,261 colon cancer patients undergoing resective surgery between 2000‐2004.
Patient characteristics according to Volume/caseload groups
LV, MV, HV Hospital volume Tumour stage (UICC) 0=1.3%, 1.2%, 2.0% I= 17.6%, 17.3%, 19.3% II= 32.8%, 32.3%, 30.4% III= 29.0%, 29.0%, 27.3% IV=19.3%, 20.3%, 20.9% Comorbidity index (ASA) 1=7.8%, 7.4%, 7.5% 2=47.1%, 49.3%, 49.4% 3=41.1%, 39.3%, 40.1% 4=4.0%, 4.0%, 3.1% |
|
| Interventions | Total number of hospitals /units=345
Caselaod defined as average number of colon cancer operations in a year. Hospital volume LV=<30 MV=30‐60 HV=>60 |
|
| Outcomes |
Outcomes for colon cancer only
Overall five survival 30 day and inpatient mortality |
|
| Notes | No case mix adjustments performed | |
| Risk of bias | ||
| Bias | Authors' judgement | Support for judgement |
| Population based study? | High risk | |
| Multicentre study? | Low risk | |
| Prospective design? | Low risk | |
| Representativeness of study cohort | Low risk | |
| Ascertainment of intervention | Unclear risk | Unclear |
| Comparability of intervention and comparison group | High risk | |
| Assessments of outcomes | Unclear risk | Unclear |
| Addressing incomplete data <20% | Low risk | |
| Missing data on primary interventions/outcomes | Low risk | |
| Other bias | Unclear risk | Cannot be ruled out |
Ng 2006.
| Methods | Retrospective single unit study (UK) | |
| Participants | n=207 rectal cancer patients that underwent resective surgery between 1995‐1999
Definiiton of rectum=15cm
Patient characteristics for entire cohort
Specialization Median age (years) 64 Tumour stage (Dukes') A=28 B=76 C=88 D=15 |
|
| Interventions |
Specialization
No definition of specialist reported Total no of surgeons=6 |
|
| Outcomes |
Outcomes for rectal cancer only
Overall five year survival Post‐operative mortality Five year local recurrence rate |
|
| Notes | No case mix adjustments performed | |
| Risk of bias | ||
| Bias | Authors' judgement | Support for judgement |
| Population based study? | High risk | |
| Multicentre study? | High risk | |
| Prospective design? | High risk | |
| Representativeness of study cohort | Low risk | |
| Ascertainment of intervention | Unclear risk | Unclear |
| Comparability of intervention and comparison group | Unclear risk | Unclear |
| Assessments of outcomes | Low risk | |
| Addressing incomplete data <20% | Low risk | |
| Missing data on primary interventions/outcomes | Low risk | |
| Other bias | Unclear risk | Cannot be ruled out |
Parry 1999.
| Methods | Retrospective population based registry study (UK) | |
| Participants | n=379 rectal cancer derived from a cohort of 927 colorectal patients undergoing resective surgery between January‐June 1993.
Definition of rectum=ICD‐9 codes Patient characteristics for entire colorectal cohort Hospital and surgeon volume Sex M=50.4% F=49.6% Age (years) <59=16% 60‐69=29% >70=56% Tumour stage (Dukes') A=12% B= 30% C=22% D=20% Unknown=15% Tumour grade/differentiation Poor=11% Moderate=46% Well differentiated=21%. Unknown=22% Urgent surgery 29.2% |
|
| Interventions | Total number of hospitals /units= 39
Total number of surgeons=112
Caseload defined as colorectal cancer operations over study period Hospital volume LV= <30 MV= 31‐45 HV=45‐55 VHV=>56 Surgeon volume LV= 1‐6 MV= 7‐12 HV=13‐18 VHV=>19 |
|
| Outcomes | Outcome for colorectal cancer only 30 day mortality Outcome for rectal cancer only APER rate | |
| Notes | Prognostic factors adjusted for included age, stage and grade of tumour and mode of admission | |
| Risk of bias | ||
| Bias | Authors' judgement | Support for judgement |
| Population based study? | Low risk | |
| Multicentre study? | Low risk | |
| Prospective design? | Low risk | |
| Representativeness of study cohort | Low risk | |
| Ascertainment of intervention | Low risk | |
| Comparability of intervention and comparison group | Low risk | |
| Assessments of outcomes | Low risk | |
| Addressing incomplete data <20% | Low risk | |
| Missing data on primary interventions/outcomes | Low risk | |
| Other bias | Unclear risk | Cannot be ruled out |
Platell 2003.
| Methods | Prospective single centre study (UK) | |
| Participants | n= 499 colorectal cancer patients undergoing resective surgery between 1996‐2001. Definition of rectum=18cm Patient characteristics across entire colorectal cohort Specialization Nonspecialist, Specialist Sex M=58.5%, 56.5% F=41.5%, 43.5% Mean age (years) 70, 69 Tumour site Colon= 66.0%, 47.0% Rectum= 34.0%, 53.0% Comorbidity index (ASA) 1 and 2= 61.0%, 60.0% 3 and 4= 39%, 40% Urgent procedures 18%, 12% |
|
| Interventions | Specialization Definition of specialists= Fellowship trainee Total number of surgeons=11 | |
| Outcomes | Outcomes for colorectal cancer only Overall five year survival | |
| Notes | Prognostic factors adjusted for included age, stage, comorbidity and chemotherapy | |
| Risk of bias | ||
| Bias | Authors' judgement | Support for judgement |
| Population based study? | High risk | |
| Multicentre study? | High risk | |
| Prospective design? | Low risk | |
| Representativeness of study cohort | Low risk | |
| Ascertainment of intervention | Low risk | |
| Comparability of intervention and comparison group | Low risk | |
| Assessments of outcomes | Low risk | |
| Addressing incomplete data <20% | Low risk | |
| Missing data on primary interventions/outcomes | Low risk | |
| Other bias | Unclear risk | Cannot be ruled out |
Ptok 2007.
| Methods | Prospective multicentre study (Germany) | |
| Participants | n=1,557 low rectal cancer patients undergoing resective surgery between 2000‐2001.
Definition of rectum=16 cm.
Patient characteristics according to volume/caseload groups
LV, MV, HV Hospital volume Sex M=60.5%, 60.8% 62.7%, F=39.5%, 39.2%, 37.3% Median age (years) 67.0, 66.0, 65.0 Tumour stage (UICC) I= 33.0%, 35.2%, 33.0% II= 25.9%, 26.0%, 32.2% III= 41.1%, 38.7%, 34.8% Comorbidity (ASA) 1=11.0%, 15.0%, 15.6% 2=51.1%, 54.3%, 57.9% 3=36.3%, 30.0%, 25.2% 4=1.6%, 0.7%, 1.3% Distance from anal verge (cm) <4=39.1% , 40.7%, 38.8% 4‐8=60.9%, 59.3%, 61.2% |
|
| Interventions | Total number of hospitals /units= 75 Caseload defined as average number of potentially curative low rectal resections in a year. Hospital volume LV=<10 MV=10‐19 HV=>19 |
|
| Outcomes | Outcomes for low rectal cancer only Five year local recurrence rate APER rate (Not included in case mix adjustments) | |
| Notes | Prognostic factors adjusted for included stage, tumour perforation, procedure, and CRM (circumferential resection margin) | |
| Risk of bias | ||
| Bias | Authors' judgement | Support for judgement |
| Population based study? | Unclear risk | Unclear |
| Multicentre study? | Low risk | |
| Prospective design? | Low risk | |
| Representativeness of study cohort | Low risk | |
| Ascertainment of intervention | Low risk | |
| Comparability of intervention and comparison group | Low risk | |
| Assessments of outcomes | Low risk | |
| Addressing incomplete data <20% | Low risk | |
| Missing data on primary interventions/outcomes | Low risk | |
| Other bias | Unclear risk | Cannot be ruled out |
Purves 2005.
| Methods | Retrospective multicentre study (USA) | |
| Participants | n=477 patients with a primary diagnoses of rectal cancer who underwent either abdominoperineal resection (APR) or a sphincter saving procedure in 1997. Defintion of rectum=ICD‐9 code Patient characteristics of rectal cancer patient cohort Surgeon volume M=57.9% F=42.9% Mean age (years) 67.6 Comorbidity index (Deyo) 0‐7=48% 8‐15=43.6% >16=8.4% Ethnicity White=70.4 % Non‐white=11.5% Missing=18% Household income < $ 30,000=43.4% > $ 30,000=40.9 Missing=15.7% |
|
| Interventions | Total number of surgeons= 229 Caseload defined as rectal cancer operations in the study year Surgeon volume LV= 1‐3 MV= 4‐9 HV= >10 |
|
| Outcomes |
Outcomes for rectal cancer only APER rate |
|
| Notes | Prognostic factors adjusted for included sex, age, ethnicity, comorbidity and income | |
| Risk of bias | ||
| Bias | Authors' judgement | Support for judgement |
| Population based study? | High risk | |
| Multicentre study? | Low risk | |
| Prospective design? | High risk | |
| Representativeness of study cohort | Unclear risk | Unclear |
| Ascertainment of intervention | Low risk | |
| Comparability of intervention and comparison group | Low risk | |
| Assessments of outcomes | Low risk | |
| Addressing incomplete data <20% | High risk | |
| Missing data on primary interventions/outcomes | High risk | Surgeon volume was missing for 43% of patients |
| Other bias | Unclear risk | Unclear |
Rabeneck 2004.
| Methods | Retrospective cohort study (USA) | |
| Participants | n=22,633 colorectal cancer patients who underwent resective surgery for a primary tumour diagnosed between 1991‐2000
Definition of rectum=ICD‐9 procedure codes
Patient characteristics according to volume/caseload
LV, HV
Hospital volume Sex M=98%, 98% F=2%, 2% Age (years) <50= 4%, 4% 50‐64=28%, 28% 65‐79=59%, 59% 80+=9%, 9% Tumour stage (UICC) I, II, III=88%, 88% IV= 12%, 12% Comorbidity (Deyo scale) 0=56%, 58% 1‐2=36%, 35% 3‐4=6%, 5% 5+=2%, 2% Tumour site Colon=68%, 69% Rectum=32%, 31% Ethnicity White=79%, 70% Black=15%, 19% Hispanic=2%, 6% Other=1%, 1% Unknown= 3%, 4% |
|
| Interventions | Total number of hospitals=172
Caseload defined as average number of operations in a year
Hospital volume LV= <25 HV=>25 |
|
| Outcomes | Outcomes for colorectal cancer only Overall 5 year survival | |
| Notes | Prognostic factors adjusted for included sex, age, site, ethnicity, comorbidity, marital status | |
| Risk of bias | ||
| Bias | Authors' judgement | Support for judgement |
| Population based study? | High risk | |
| Multicentre study? | Low risk | |
| Prospective design? | High risk | |
| Representativeness of study cohort | High risk | |
| Ascertainment of intervention | Low risk | |
| Comparability of intervention and comparison group | Low risk | |
| Assessments of outcomes | Low risk | |
| Addressing incomplete data <20% | Low risk | |
| Missing data on primary interventions/outcomes | Low risk | |
| Other bias | Unclear risk | Cannot be ruled out |
Rogers 2006.
| Methods | Retrospective population based registry study (USA). | |
| Participants | n=7,052 rectal cancer cases derived from a cohort of 28,644 newly diagnosed colorectal cancer patients that underwent resective surgery between 1996‐1999 No reported definition for rectum Patient characteristics according to volume/caseload for entire colorectal cohort VLV, LV, MV, HV Surgeon Volume Sex M=49.6%, 49.8%,49.0%, 50.4% F=50.4%, 50.2%, 51.0%, 49.6% Mean age (years) 69.7, 70.2, 70.7, 70.6 Tumour stage(AJCC) I=23.4%, 24.2%, 25.8%, 28.5% II=42.7%, 43.1%, 40.3%, 39.1% III=33.9%, 32.7%, 33.9%, 32.4% Comorbidity index (Charlson‐Deyo) 0=55.8%, 58.2%, 58.4%, 60.7% 1=22.9%, 22.4%, 22.5%, 21.7% 2=11.1%, 10.9%, 10.3%, 9.2% 3=5.1%, 4.7%, 4.7%, 4.5% >4=5.1%, 3.8%, 4.1%, 3.8% Ethnicity Non‐Hispanic /white=69.6%, 74.4%, 78.0%, 80.0% Non‐Hispanic /Black=6.9%, 5.7%, 4.8 %, 5 4.1% Hispanic=12.2% 11.3%, 10.1%, 7.9% Asian=10.7%, 8.2%, 6.5%, 7.4% Other=0.6%, 0.4%, 0.5%, 0.6% Median income, $5000‐25,000=26.1%, 25.4%, 29.1%, 21.3% $30,000‐35,000=23.5%, 23.4%, 23.8%, 23.5% $40,000‐50,000=25.9%, 28.3%, 28.1%, 28.2% >$ 55,000=22.2%, 20.7%, 23.8%, 25.1% Missing=2.2%, 2.2%, 2.4%, 1.9% Hospital volume Sex M=48.9%, 50.2%, 49.5%, 50.0% F=51.1%, 49.8%, 50.5%, 50.0% Mean age (years) 70.2, 70.5, 70.5, 70.1 Tumour stage (AJCC) I=24.5%, 24.2%, 26.7%, 26.6% II=42.7%, 41.7%, 40.8%, 40.1% III=32.8%, 34.1%, 32.5%, 33.3% Comorbidity index (Charlson‐Deyo) 0=56.3%, 56.5%, 60.1%, 60.4% 1=23.1%, 23.1%, 21.3%, 21.8% 2=10.8%, 11.0%, 9.8%, 9.8% 3=5.1%, 4.9%, 4.7%, 4.3% >4=4.7%, 4.4%, 4.0%, 3.6% Ethnicity, Non‐Hispanic /white=74.0%, 70.9%, 80.6%, 77.0% Non‐Hispanic /Black=4.9%, 6.5%, 5.0 %, 4.9% Hispanic=12.8% 10.9%, 8.6%, 9.2% Asian=7.8%, 11.3%, 5.2%, 8.2% Other=0.5%, 0.4%, 0.5%, 0.7% Median income, $5000‐25,000=30.2%, 24.2%, 20.6%, 19.7% $30,000‐35,000=25.0%, 23.8%, 24.1%, 21.3% $40,000‐50,000=25.6%, 28.9%, 26.6%, 29.3% >$ 55,000=16.2%, 20.8%, 26.5%, 28.1% Missing=2.9%, 2.2%, 2.1%, 1.6% |
|
| Interventions | Total number of hospitals /units= 2,993
Total number of surgeons=140. Caseload defined as average colorectal cancer procedures study period Hospital volume VLV=<83 LV=84‐151 MV=152‐219 HV=>219 Surgeon volume VLV=1‐12 LV=13‐24 MV=24‐40 HV=>40 |
|
| Outcomes |
Outcomes for colorectal cancer only
Overall five year survival 30 day mortality, Outcomes for rectal cancer only Permanent stoma rate |
|
| Notes | Prognostic factors adjusted for included sex, age, comorbidity index, ethnicity, median household income | |
| Risk of bias | ||
| Bias | Authors' judgement | Support for judgement |
| Population based study? | Low risk | |
| Multicentre study? | Low risk | |
| Prospective design? | High risk | |
| Representativeness of study cohort | Low risk | |
| Ascertainment of intervention | Low risk | |
| Comparability of intervention and comparison group | Low risk | |
| Assessments of outcomes | Low risk | |
| Addressing incomplete data <20% | Low risk | |
| Missing data on primary interventions/outcomes | Low risk | |
| Other bias | Unclear risk | Cannot be ruled out |
Schrag 2002.
| Methods | Retrospective population based study (USA) | |
| Participants | n=2,815 rectal cancer patients (excluding rectosigmoid) aged 65 and over who underwent resective surgery for a primary tumour diagnosed between 1992 ‐1996
Definition of rectum=ICD‐9 procedure codes
Patient characteristics according to volume/caseload groups
VLV, LV, MV, HV, Unknown
Surgeon volume Sex M=52%, 57%, 56%, 50%, 56% F=48%, 43%, 44%, 50%, 44% Age (years), 65‐69= 29%, 25%, 23%, 24%, 28% 70‐74=25%, 26%, 28%, 29%, 27% 75‐79=19%, 21%, 25%, 25%, 20% 80‐84=18%, 18%, 16%, 15%, 15% 85‐90=7%, 7%, 7%, 5%, 6% 90+=2.0%, 3%, 2%, 2%, 4% Tumour stage(AJCC) I=29%, 29%, 33%,27%, 29% II=27%, 25%, 27%, 29%, 30% III= 29%, 30%, 28%, 29%, 27% IV=9%, 10%, 7%, 9%, 6% Not staged= 6%, 5%, 4%, 5%, 8% Comorbidity index (Romano‐Charlson scale) 0=67%, 67%, 67%, 66%, 68% 1=27%, 26%, 24%, 24%, 25% 2+=6%, 7%, 10%, 10%, 8% Urgent procedures 12%, 8%, 8%, 7%, 10% Ethnicity White=81%, 81%, 87%, 93%, 78% Black=5%, 5%, 3%, 3%, 8% Other=14%, 14%, 11%, 3%, 13% Median income Top quartile=24%, 22%, 22%, 26%, 26% 3rd quartile=23%, 24%, 24%, 25%, 28% 2nd quartile=24%, 25%, 25%, 27%, 20% 1st quartile=25%, 26%, 26%, 21%, 21% Unknown=4%, 4%, 3%, 2%, 5% Hospital volume VLV, LV, MV, HV Sex M=53%, 55%, 53%, 54% F=47%, 45%, 47%, 46% Age (years) 65‐69= 27%, 25%, 26%, 24% 70‐74=26%, 27%, 27%, 28% 75‐79=20%, 23%, 24%, 23% 80‐84=18%, 18%, 14%, 16% 85‐90=8%, 7%, 7%, 6% 90+=2%, 2%, 2%, 3% Tumour stage (AJCC) I=29%, 32%, 31%,27% II=24%, 27%, 29%,30% III= 31%, 28%, 28%, 30% IV=9%, 8%, 8%, 8% Not staged= 8%, 5%, 4%, 4%. Comorbidity index (Romano‐Charlson scale) 0=68%, 67%, 65%, 68% 1=24%, 25%, 27%, 23% 2+=8%, 7%, 9%, 8% Urgent procedures 11%, 7%, 9%, 8% Ethnicity White=77%, 82%, 89%, 92% Black=6%, 5%, 4%, 3% Other=18%, 13%, 7%, 5% Median income Top quartile=21%, 22%, 28%, 25% 3rd quartile=19%, 22%, 25%, 28% 2nd quartile=22%, 24%, 26%, 23% 1st quartile=32%, 26%, 19%, 22% Unknown=6%, 5%, 2%, 2% |
|
| Interventions | Total number of hospitals /units=420
Total number of surgeons=1,121
Caseload defined as average number of rectal cancer operations over study period
Hospital volume
VLV=1‐5
LV= 6‐11
MV=12‐20
HV=21‐57 Surgeon volume VLV=1 LV= 2 MV=3‐5 HV=6‐26 |
|
| Outcomes |
Outcomes for rectal cancer only
Five year overall survival 30 day mortality APER rate |
|
| Notes | Prognostic factors adjusted for included sex, age, stage, comorbidity, hospital volume, mode of presentation, ethnicity and median income. Insufficient statistical data published for inclusion in case mix adjusted analyses. |
|
| Risk of bias | ||
| Bias | Authors' judgement | Support for judgement |
| Population based study? | Low risk | |
| Multicentre study? | Low risk | |
| Prospective design? | Low risk | |
| Representativeness of study cohort | Low risk | |
| Ascertainment of intervention | Low risk | |
| Comparability of intervention and comparison group | Low risk | |
| Assessments of outcomes | Low risk | |
| Addressing incomplete data <20% | Low risk | |
| Missing data on primary interventions/outcomes | Low risk | |
| Other bias | Unclear risk | Cannot be ruled out |
Schrag 2003.
| Methods | Retrospective population based cohort study (USA) | |
| Participants | n=24,166 colon cancer patients that underwent resective surgery for a primary tumour diagnosed between 1991 ‐1996.
Patient characteristics according to volume/caseload groups
LV, MV, HV, VHV
Hospital and surgeon volume Sex M=44.1%, 43.6%, 45.5%, 44.4% F=55.9%, 56.4%, 54.5%, 55.6% Age (years) 65‐69= 19.4%, 17.9%, 18.2%, 18.8% 70‐74=23.2%, 24.0%, 24.1%, 23.9% 75‐79=23.2%, 24.0%, 24.1%, 23.3% 80+=33.6, 34.5%, 34.5%, 34.1% Tumour stage (AJCC) I=17.9%, 19.6%, 20.7%, 21.5% II=37.2%, 37.0%, 36.6%, 36.8% III= 26.0%, 26.2%, 26.4%, 25.9% IV=15.0%, 14.1%, 13.5%, 13.8% Not staged= 3.9%, 3.1%, 2.8%, 2.0% Comorbidity index (Romano scale) 0=71.6%, 71.1%, 70.7%, 71.6% 1=22.4%, 23.6%, 23.6%, 23.1% 2+=6.0%, 5.3%, 5.7%, 5.3% Urgent procedures 22.5%, 18.1%, 19.3%, 19.0% Ethnicity White=80.3%, 87.8%, 91.1%, 89.6% Black=9.2%, 6.7%, 4.7%, 5.7% Other=10.5%, 3.1%, 2.4%, 2.7% Median income Top quartile=25.4%, 25.1%, 21.9%, 25.2% 3rd quartile=23.8%, 24.8%, 22.2%, 25.8% 2nd quartile=23.1%, 25.2%, 24.6%, 24.9% 1st quartile=23.1%, 21.5%, 28.6%, 22.6% Unknown=4.3%, 3.5%, 2.7%, 1.5% |
|
| Interventions | Total number of hospitals /units=579
Total number of surgeons=2,682. Caseload defined as average number of colon cancer operations over study period Hospital volume LV=1‐61 MV= 62‐116 HV=117‐167 HV=169‐383 Surgeon volume LV=1‐9 MV= 10‐16 HV=17‐27 VHV=28‐85 |
|
| Outcomes | Outcomes for colon cancer only, 30 day mortality | |
| Notes | Prognostic factors adjusted for included sex, age, stage, race, comorbidity, median income, hospital volume and mode of presentation. Insufficient statistical data published for inclusion in case mix adjusted meta‐analysis |
|
| Risk of bias | ||
| Bias | Authors' judgement | Support for judgement |
| Population based study? | Low risk | |
| Multicentre study? | Low risk | |
| Prospective design? | High risk | |
| Representativeness of study cohort | High risk | Medicare patients |
| Ascertainment of intervention | Low risk | |
| Comparability of intervention and comparison group | Low risk | |
| Assessments of outcomes | Low risk | |
| Addressing incomplete data <20% | Low risk | |
| Missing data on primary interventions/outcomes | Low risk | |
| Other bias | Unclear risk | Cannot be ruled out |
Simons 1997.
| Methods | Retrospective population based registry study (USA) | |
| Participants | n=2,006 rectal cancer patients diagnosed in 1990 undergoing resective surgery No definition of rectum stated No patient characteristics provided | |
| Interventions | Total no of hospitals=124 Caseload defined as average annual rectal cancer procedures in a year Hospital volume LV= <1‐5 HV=>5 |
|
| Outcomes | Outcomes for rectal cancer only Five year overall survival Permanent stoma rate | |
| Notes | No case mix adjustments performed | |
| Risk of bias | ||
| Bias | Authors' judgement | Support for judgement |
| Population based study? | Low risk | |
| Multicentre study? | Low risk | |
| Prospective design? | High risk | |
| Representativeness of study cohort | Low risk | |
| Ascertainment of intervention | Low risk | |
| Comparability of intervention and comparison group | High risk | |
| Assessments of outcomes | Low risk | |
| Addressing incomplete data <20% | Unclear risk | Unclear |
| Missing data on primary interventions/outcomes | Low risk | |
| Other bias | Unclear risk | Cannot be ruled out |
Simunovic 2000.
| Methods | Retrospective population based registry study (Canada) | |
| Participants | n=1,072 primary invasive rectal cancer patients diagnosed in 1990 and undergoing resective surgery No reported definition of rectum Patient characteristics according to volume/caseload groups LV, MV, HV Hospital volume Sex M=64.5%, 63.0%, 61.8% F=35.5%, 37.0%, 38.2% Age (years) 20‐59= 23.4%, 25.1%, 31.5% 60‐69= 34.5%, 35.2%, 30.6% >70=42.1%, 39.7%, 37.9% Comorbidity index (Deyo) 0= 82.7%, 86.0%%, 85.4% 1= 13.5%, 11.1%, 10.5% 2+=3.8%, 3.0%, 4.1% | |
| Interventions | Total no of hospitals=124
Caseload defined as average annual rectal cancer procedures in a year Hospital volume LV= <12 MV=12‐17 HV=>17 |
|
| Outcomes |
Outcomes for rectal cancer only
Overall five year survival Inpatient mortality |
|
| Notes | Prognostic factors adjusted for included sex, stage, comorbidity, procedure type, teaching hospital status for mortality. Referral to regional cancer centre added on for five year overall survival | |
| Risk of bias | ||
| Bias | Authors' judgement | Support for judgement |
| Population based study? | Low risk | |
| Multicentre study? | Low risk | |
| Prospective design? | High risk | |
| Representativeness of study cohort | Low risk | |
| Ascertainment of intervention | Low risk | |
| Comparability of intervention and comparison group | Low risk | |
| Assessments of outcomes | Low risk | |
| Addressing incomplete data <20% | Low risk | |
| Missing data on primary interventions/outcomes | Low risk | |
| Other bias | Unclear risk | Cannot be ruled out |
Simunovic 2006.
| Methods | Retrospective population based registry study (Canada) | |
| Participants | n=8,398 colon cancer patients that underwent resective surgery between 1990‐2000
Patient characteristics according to volume/caseload groups LV, MV, HV, VHV Hospital volume Median age (years) 70.0, 70.0, 70.0, 70.0 Tumour stage (Node positive) 42.6%, 39.2%, 38.6%, 35.7% |
|
| Interventions | Total number of hospitals /units=151 Caseload defined as average number of colon cancer operations over three years. Hospital volume LV=<62 MV=63‐90 HV=91‐137 VHV=138+ |
|
| Outcomes | Outcomes for colon cancer 30 day and inpatient mortality | |
| Notes | Prognostic factors adjusted for included sex, age, comorbidity, place of residence and socioeconomic status. | |
| Risk of bias | ||
| Bias | Authors' judgement | Support for judgement |
| Population based study? | Low risk | |
| Multicentre study? | Low risk | |
| Prospective design? | High risk | |
| Representativeness of study cohort | Low risk | |
| Ascertainment of intervention | Low risk | |
| Comparability of intervention and comparison group | Low risk | |
| Assessments of outcomes | Low risk | |
| Addressing incomplete data <20% | Unclear risk | Unclear |
| Missing data on primary interventions/outcomes | Low risk | |
| Other bias | Unclear risk | Cannot be ruled out |
Sjovall 2007.
| Methods | Prospective population based registry study (Sweden) | |
| Participants | n=2,775 colon cancer patients undergoing resective surgery between 1996‐2000 Patient characteristics according to volume/caseload groups LV, HV Hospital volume Sex M=47.7%, 48.7% F=52.3%, 51.3% Median age (years) 74, 74 Tumour stage (UICC) I=10.3%, 12.0% II=39.6%, 37.5% III=23.9%, 27.7% IV=22.4%, 20.3% Unknown=3.9%, 2.4% Tumour site Right=39.0%, 43.7% Transverse=8.8%, 10.4 Left=48.0%, 43.7% Multiple=3.6%, 2.2% Unknown=0.6, 0.1% Urgent procedures 23.7%, 21.4% |
|
| Interventions | Total no of hospitals=9
Caseload defined as number of colon cancer diagnosed in a year
Hospital volume LV=<25 HV=60‐90 |
|
| Outcomes | Outcomes for colon cancer only 30 day mortality | |
| Notes | No case mix adjustments performed | |
| Risk of bias | ||
| Bias | Authors' judgement | Support for judgement |
| Population based study? | Low risk | |
| Multicentre study? | Low risk | |
| Prospective design? | Low risk | |
| Representativeness of study cohort | Low risk | |
| Ascertainment of intervention | Low risk | |
| Comparability of intervention and comparison group | Low risk | |
| Assessments of outcomes | Low risk | |
| Addressing incomplete data <20% | Low risk | |
| Missing data on primary interventions/outcomes | Low risk | |
| Other bias | Unclear risk | Cannot be ruled out |
Smith 2003.
| Methods | Prospective population based registry study (UK) | |
| Participants | n=1,414 rectal cancer patients of a cohort 4,562 colorectal cancer patients undergoing resective surgery between 1991‐1994. Definition of rectum=15 cm Patient characteristics according to surgeon specialization Nonspecialist, Specialist Specialization Sex M=51%, 53.3% F=48.7%, 46.7% Age (years) <45=2%, 2.3% 45‐64=23.4%, 26.7% 65‐74=33.6%, 33.5% >75=41%, 37.5% Tumour stage (Dukes') A =11%, 14.6% B=37.2%, 35.7% C=22.5%, 21.6% D=24.9%, 24.0% Unstaged= 4.4%, 4.2% Comorbidity index (Deyo modification of Charlson index) 0= 66.4%, 67.2% 1= 25.7%, 24.3% 2=6.6%, 7.0% 3=1.1%, 1.4% 4=0.2%, 0% 5=0.1%, 0% Tumour site Colon= 73.2%, 64.1% Rectum= 26.8%7, 35.9% Urgent procedures 16.5%, 10.1% |
|
| Interventions | Total number of surgeons=77
Caseload defined as average annual number of colorectal cancer operations performed in a year
Surgeon volume VLV=<5 LV=5‐9 MV= 10‐19 HV= 20‐29 VHV=30‐49 VVHV=>50 Specialization Definition of Specialists= ACPGBI (Association of Coloproctologists of Great Britain and Ireland) membership |
|
| Outcomes |
Outcomes for colorectal cancer
Overall five year survival Five year disease specific survival 30 day mortality Anastomotic leak rate Outcomes for rectal cancer APER rate (Not included in case mix adjustments) |
|
| Notes | Prognostic factors adjusted for included sex, age, stage, comorbidity, site and presentation Volume not analysed on account of insufficient data provided | |
| Risk of bias | ||
| Bias | Authors' judgement | Support for judgement |
| Population based study? | Low risk | |
| Multicentre study? | Low risk | |
| Prospective design? | Low risk | |
| Representativeness of study cohort | Low risk | |
| Ascertainment of intervention | Low risk | |
| Comparability of intervention and comparison group | Low risk | |
| Assessments of outcomes | Low risk | |
| Addressing incomplete data <20% | Unclear risk | Unclear |
| Missing data on primary interventions/outcomes | Unclear risk | Unclear |
| Other bias | Unclear risk | Cannot be ruled out |
Urbach 2004.
| Methods | Retrospective multi‐centre study (Canada) | |
| Participants | n=18,898 colorectal cancer patients that underwent resective surgery between 1994‐1999 No reported definition of rectum Patient characteristics of entire colorectal cohort Hospital volume Sex M=54% F=46% Mean age (years) 68.8 Median Charlson score (interquartile range) 0 (0‐6) | |
| Interventions | Total number of hospitals=134 Caseload defined as median annual number of procedures Hospital volume LV=< 53 HV=>53 | |
| Outcomes | Outcomes for colorectal cancer 30 day mortality | |
| Notes | Prognostic factors adjusted for included sex, age, Charlson score and hospital volume clustering | |
| Risk of bias | ||
| Bias | Authors' judgement | Support for judgement |
| Population based study? | Low risk | |
| Multicentre study? | Low risk | |
| Prospective design? | High risk | |
| Representativeness of study cohort | Low risk | |
| Ascertainment of intervention | Low risk | |
| Comparability of intervention and comparison group | Low risk | |
| Assessments of outcomes | Low risk | |
| Addressing incomplete data <20% | Low risk | |
| Missing data on primary interventions/outcomes | Low risk | |
| Other bias | Unclear risk | Cannot be ruled out |
Wibe 2005.
| Methods | Prospective population based registry study (Norway). | |
| Participants | n=3,388 rectal cancer patients undergoing curative resective surgery between 1993‐1999.
Definition of rectum=15 cm from anal verge
Patient characteristics according to volume/caseload groups
LV, MV, HV, VHV
Hospital volume
Sex
M=58.6%, 60.0%, 55.9%, 55.9%
F=41.45, 40.0%, 44.1%, 44.1%
Age(years)
<60= 17.6%, 18%, 20.6%, 19.6%
60‐69= 27.2%, 25.9%, 28.2%, 27%
70‐79= 35.8%, 39.1%, 34.3%, 36.4%
>80= 19.4%, 16.9%, 16.9%, 16.9% Tumour stage (Dukes') A= 26.2%, 28.2%, 30.6%, 32.3% B= 38%, 37.9%, 37.2%, 35.8% C= 35.8%, 33.9%, 32.2%, 31.9% Tumour grade/differentiation High= 6.6%, 10.1%, 5.4%, 7.4% Moderate= 79.2%, 72.6%, 78.3% 76.6% Low= 8.8%, 10.2%, 8.8%, 10.1% Distance from anal verge (cm) 11‐15= 38.5%, 28.6%, 29.3%, 33.2% 6‐10= 33.8%, 40.5%, 40.5%, 35.9% 0‐5= 26.7%, 28.1%, 29.3%, 29.3% Preoperative radiotherapy 1.5%, 8.1%, 1.9%, 5.8% TME rate 67.2%, 94.7% |
|
| Interventions | Total number of hospitals=54
Caseload defined as annual hospital volume Hospital volume LV=<10 MV=10‐19 HV=20‐29 VHV=>30 |
|
| Outcomes | Outcomes for rectal cancer only Overall five year survival 30 day mortality (Not included in case mix adjustments) Five year local recurrence rate Anastomotic leak rate (Not included in case mix adjustments) APER rate (Not included in case mix adjustments) | |
| Notes | Prognostic factors adjusted for included sex, age, stage, grade and site | |
| Risk of bias | ||
| Bias | Authors' judgement | Support for judgement |
| Population based study? | Low risk | |
| Multicentre study? | Low risk | |
| Prospective design? | Low risk | |
| Representativeness of study cohort | Low risk | |
| Ascertainment of intervention | Low risk | |
| Comparability of intervention and comparison group | Low risk | |
| Assessments of outcomes | Low risk | |
| Addressing incomplete data <20% | Low risk | |
| Missing data on primary interventions/outcomes | Low risk | |
| Other bias | Unclear risk | Cannot be ruled out |
Zhang 2007.
| Methods | Retrospective population based registry study (USA) | |
| Participants | n=38,237 colorectal cancer patients that underwent resective surgery for a primary tumour diagnosed between 1994‐1996.
No reported definition of rectum.
Patient characteristics according to volume/caseload for entire rectal cancer cohort
VLV, LV, MV, HV Hospital volume Sex M=49.0%, 51.3%, 50.0%, 50.9% F=51.0%, 48.7%, 50.0%, 49.1%, Age (years), <45= 3.9%, 3.3%, 3.8%, 4.0%, 45‐54=7.7%, 7.5%, 7.9%, 8.6% 55‐64=15.5%, 15.3%, 15.0%, 17.6% 65‐74=29.5%, 31.4%, 30.5%, 31.0% 75‐84=31.9%, 31.2%, 31.2%, 29.6% >84=11.6%, 11.3%, 11.6%, 9.2% Tumour stage (AJCC) I=29%, 29%, 33%,27%, 29% II=27%, 25%, 27%, 29%, 30% III= 29%, 30%, 28%, 29%, 27% IV=9%, 10%, 7%, 9%, 6% Not staged= 6%, 5%, 4%, 5%, 8% Comorbidity index (Charlson scale) 0=44.4%, 47.2%, 50.6%, 51.7% 1=22.3%, 21.3%, 20.5%, 21.1% >2=33.2%, 31.5%, 28.9%, 27.2% Ethnicity White=71.1%, 75.9%, 78.4%, 78.1% Black=6.0%, 5.6%, 4.9%, 7.0% Hispanic=13.7%, 9.2%, 9.7%, 7.6% Asians=8.8%, 8.9% 6.6%, 6.8% Others=0.4%, 0.4%, 0.4%, 0.5% Median income <$25,000=36.0%, 28.4%, 26.2%, 22.3% $25,000‐35,000 quartile=24.7%, 23.0%, 22.7%, 22.5% $35,000‐$50,000=23.7%, 27.9%, 26.8%, 28.3% >$50,000=15.6%, 20.7%, 24.3%, 26.9% |
|
| Interventions | Total no of hospitals=383
Caseload defined as average annual colorectal cancer procedures in a year Hospital volume VLV= <35 LV=35‐67 MV=68‐91 HV=>91 |
|
| Outcomes | Outcomes for colorectal cancer only 30 day mortality | |
| Notes | No case mix adjustments performed | |
| Risk of bias | ||
| Bias | Authors' judgement | Support for judgement |
| Population based study? | Low risk | |
| Multicentre study? | Low risk | |
| Prospective design? | High risk | |
| Representativeness of study cohort | Low risk | |
| Ascertainment of intervention | Low risk | |
| Comparability of intervention and comparison group | Low risk | |
| Assessments of outcomes | Low risk | |
| Addressing incomplete data <20% | Low risk | |
| Missing data on primary interventions/outcomes | Low risk | |
| Other bias | Unclear risk | Cannot be ruled out |
Characteristics of excluded studies [ordered by study ID]
| Study | Reason for exclusion |
|---|---|
| Beart 1995 | Study period from 1983‐1988 |
| Bokey 1997 | Study period from 1971‐1993 |
| Callahan 2003 | No distinction between cancer and non cancer resections. |
| Crocetti 1996 | Study period from 1985‐1987 |
| Dahlberg 1998 | Study period from 1960‐1989. No analysis on specialisation or volume/caseload performed between groups. |
| Dorrance 1997 | Local recurrence over 3 years |
| Easson 2002 | No caseload/volume analysis performed |
| Haward 2004 | Study period from 1986‐1994 with majority of patients before 1990 |
| Hayanga 2010 | Not exclusively cancer surgery, interventions were teaching and non teaching hospital status. |
| Hermanek 1995 | Study period from 1984‐1986 |
| Hermanek 1996 | Study period from 1984‐1986 and no caseload/volume analysis performed |
| Hermanek 1998 | Study period from 1984‐1986 |
| Hermanek 1999 | Study period from 1984‐1986 |
| Hermanek 2000 | Study period from 1984‐1986 |
| Hilska 2004 | Study period between 1981‐1990 |
| Ho 2006 | No reference group provided |
| Holm 1997 | Study period from 1980‐1993 (Stockholm I and II trials) |
| Jestin 2004 | No reference to hospital caseload; only identification and analysis of hospital type |
| Kapiteijn 1998 | Local recurrence rate not reported at 5 years |
| Kee 1999 | Overall survival at 2 years |
| Luna‐Perez 1999 | Study period from 1980‐1995 |
| Machado 2000 | Local recurrence and cancer specific survival at 2 years |
| Mander 2002 | Study period from 1971‐1979 |
| Martling 2000 | Intervention group compared with historical group (Stockholm I & II trials) |
| Matthiessen 2006 | Study period 1987‐1995 |
| McArdle 1991 | Study period from 1974‐1979 |
| McArdle 2002 | No volume analysis performed |
| Miller 2004 | No outcomes of interest included (lymph node detection) |
| Mohner 1990 | Study period from 1976‐1980 |
| Paquette 2010 | Study period from 1988‐2006 |
| Pata 2008 | Comparism with historical group (1975‐1984) |
| Porter 1998 | Study period from 1983‐1990 |
| Read 2002 | Study period from 1977‐1995 |
| Renzulli 2006 | Study period from 1981‐1993 |
| Schrag 2000 | Same data set used in later study (Schrag 2003) |
| Shankar 2001 | No caseload/volume analysis performed |
| Singh 1995 | No caseload/volume analysis performed |
| Smedh 2001 | No caseload/volume analysis performed |
| Stocchi 2001 | Study period between 1979‐1992 |
| Syk 2010 | Local recurrence rate with follow up to 34.5 months |
| Ubhi 1995 | Study period from 1979‐1990 |
| Yasunaga 2009a | No outcomes of interest reported |
| Yasunaga 2009b | No outcomes of interest reported |
Differences between protocol and review
Types of participants
We planned to include studies that had a definition for the rectum where outcomes for colorectal cancer or rectal cancer were being reported. However in the case‐mix adjusted meta‐analyses we included seven retrospective studies that did not report an ICD definition and three prospective studies that had no definition for rectum.
Search methods for identification of studies
Electronic searches were performed from January 1990 to September 2011. We chose 1990 as the study cut off point to capture the effects of volume and outcome in the context of modern colorectal cancer management as this has changed dramatically over the years.
Assessment of risk of bias in included studies
The responses Yes, No and Unclear in risk of bias assessment were replaced by Low risk, High risk and Unclear risk respectively in the review. We modified our assessment of risk of bias in included studies by adding on the item "study design" which assigned studies as, low risk, high risk and unclear risk based on whether studies were population based, multi‐centred and prospective in design.
Subgroup analyses
We did not perform case‐mix adjusted analyses for the outcome APER rate for rectal cancer with respect to tumour site (e.g.. true rectal and rectosigmoid) as no more than one case‐mix adjusted study was identified. We performed subgroup analyses based on continent of origin of the studies based on a case‐mix adjusted primary outcome to demonstrate any underlying differences between the different healthcare systems.
Sensitivity analyses
If randomised controlled studies had been identified, sensitivity analyses would have been performed excluding observational studies. Sensitivity analyses was not performed in the included observational studies because all included studies adjusted for important prognostic factors.
Contributions of authors
DA and DWB performed the literature searches based on the Cochrane group's search strategy, and reviewed the abstracts; both authors reviewed the relevant studies and independently considered studies for inclusion. DA drafted the methodological and results sections of the review. LH and DWB drafted the introduction, and DB the discussion section. PWJ and LH supervised the review process.
Declarations of interest
The contact author (DA) is a UK specialist trainee with interest in colorectal surgery. DWB is a consultant colorectal surgeon working in a specialist colorectal unit within a university teaching hospital in the UK. The supervising authors (PWJ) and (LH) are colorectal consultants working in specialised colorectal centres in Denmark.
New
References
References to studies included in this review
Billingsley 2007 {published data only}
- Billingsley K, Morris A, Dominitz J, Matthews B, Dobie S, Barlow W, Wright G, Baldwin L. Surgeon and Hospital Characteristics as Predictors of Major Adverse Outcomes Following Colon Cancer Surgery. Understanding the Volume‐Outcome Relationship. Archives of Surgery 2007;142:23‐31. [DOI] [PubMed] [Google Scholar]
Birkmeyer 2002 {published data only}
- Birkmeyer J, Siewers A, Finlayson E, Stukel T, Lucas F, Batista I, Welch H, Wennberg D. Hospital volume and surgical mortality in the United States. The New England Journal of Medicine 2002;346:1128‐1137. [DOI] [PubMed] [Google Scholar]
Borowski 2007 {published and unpublished data}
- Borowski DW, Kelly SB, Bradburn DM, Wilson RG, Gunn A, Ratcliffe AA. Impact of surgeon volume and specialization on short‐term outcomes in colorectal cancer surgery. British Journal of Surgery 2007;94:880‐889. [DOI] [PubMed] [Google Scholar]
Borowski 2010 {published and unpublished data}
- Borowski DW, Bradburn DM, Mills SJ, Bharanthan B, Wilson RG, Gunn A, Ratcliffe AA, Kelly SB on behalf of the members of the Northern Region Colorectal Cancer Audit Group (NORCCAG). Volume‐outcome analysis of colorectal cancer‐related outcomes. British Journal of Surgery 2010;97(9):1416‐30. [DOI] [PubMed] [Google Scholar]
Carter et al 1995 {published data only}
- The Consultant surgeons and pathologists of the Lothian and Borders Health Boards. Lothian and Borders large bowel cancer project: immediate outcome after surgery. British Journal of Surgery 1995;82:888‐90. [DOI] [PubMed] [Google Scholar]
COLOR Study Group {published data only}
- COLOR Study Group. Impact of hospital case volume on short‐term outcome after laparoscopic operation for colonic cancer. Surgical Endoscopy 2005;19:687‐92. [DOI] [PubMed] [Google Scholar]
Debes 2008 {published data only}
- Debes AJ, Storkson RH, Jacobsen MB. Curative rectal cancer surgery in a low‐volume hospital: a quality assessment. European Journal of Surgical Oncology 2008;34:382‐9. [DOI] [PubMed] [Google Scholar]
Dimick 2003 {published data only}
- Dimick JB, Cowan JA, Upchurch JR, Colletti LM. Hospital volume and surgical outcomes for elderly patients with colorectal cancer in the United States. Journal of Surgical Research 2003;114(1):50‐6. [DOI] [PubMed] [Google Scholar]
Dorrance 2000 {published data only}
- Dorrance H, Docherty G, O'Dwyer P. effect of surgeon specialty interest on patient outcome after potentially curative colorectal cancer surgery. Diseases of the Colon and Rectum 2000;43:492‐98. [DOI] [PubMed] [Google Scholar]
Drolet 2011 {published data only}
- Drolet S, Maclean A, Myers R, Shaheen A, Dixon E, Buie W. Elective resection of colon cancer by high‐volume surgeons is associated with decreased morbidity and mortality. Journal of Gastrointestinal Surgery 2011;15:541‐50. [DOI] [PubMed] [Google Scholar]
Elferink 2010A {published data only}
- Elferink M, Wouters M, Krijnen P, Lemmens V, Jansen‐Landheer M, Velde C, Siesling S, Tollenaar R. Disparities in quality of care for colon cancer between hospitals in the Netherlands. European Journal of Surgical Oncology 2010;36:S64‐S73. [DOI] [PubMed] [Google Scholar]
Elferink 2010B {published data only}
- Elferink M, Krijnen P, Wouters M, Lemmens V, Jansen‐Landheer M, Velde C, Langendijk J, Marijnen C, Siesling S, Tollenaar R. Variation in treatment and outcome of patients with rectal cancer by region, hospital type and volume in the Netherlands. European Journal of Surgical Oncology 2010;36:S74‐S82. [DOI] [PubMed] [Google Scholar]
Engel 2005A {published data only}
- Engel A, Oomen J, Knol D, Cuesta M. Operative mortality after colorectal resection in the Netherlands. British Journal of Surgery 2005;92:1526‐1532. [DOI] [PubMed] [Google Scholar]
Engel 2005B {published data only}
- Engel J, Kerr J, Eckel R, Gunther B, Heiss M, Heitland W, Siewert JR, Jauch KW, Holzel, D. Influence of hospital volume on local recurrence and survival in a population sample of rectal cancer patients. European Journal of Surgical Oncology 2005;31(5):512‐20. [DOI] [PubMed] [Google Scholar]
Finlayson 2003 {published data only}
- Finalyson E, Goodney P, Birkmeyer J. Hospital volume and operative mortality in cancer. Archives of Surgery 2003;138:721‐25. [DOI] [PubMed] [Google Scholar]
Gort 2010 {published data only}
- Gort M, Otter R, Plukker J, Broekhius M. Actionable indicators for short and long term outcomes in rectal cancer. European Journal of Cancer 2010;46:1808‐14. [DOI] [PubMed] [Google Scholar]
Grabham 1996 {published data only}
- Grabham JA, Coleman MG, Moss S, Thompson MR, Lane RHS. Wessex colorectal cancer audit: anastomotic leakage following elective anterior resection. British Journal of Surgery 1996;83(Suppl. 1):22‐3. [Google Scholar]
Hannan 2002 {published data only}
- Hannan E, Radzyner M, Rubin D, Dougherty J, Brennan M. The influence of hospital and surgeon volume on in‐hospital mortality for colectomy, gastrectomy and lung lobectomy in patients for cancer.. Surgery 2002;131:6‐15. [DOI] [PubMed] [Google Scholar]
Harling 2005 {published data only}
- Harling H, Bulow S, Moller LN, Jorgensen T, Group DCC. . Hospital volume and outcome of rectal cancer surgery in Denmark 1994‐1999.. Colorectal Disease 2005;7(1):90‐5. [DOI] [PubMed] [Google Scholar]
Harmon 1999 {published data only}
- Harmon JW, Tang DG, Gordon TA, Bowman HM, Choti MA, Kaufman HS, et al. Hospital volume can serve as a surrogate for surgeon volume for achieving excellent outcomes in colorectal resection. Annals of Surgery 1999;230:404‐11. [DOI] [PMC free article] [PubMed] [Google Scholar]
Hodgson 2003 {published data only}
- Hodgson DC, Zhang W, Zaslavsky AM, Fuchs CS, Wright WE, Ayanian JZ. Relation of hospital volume to colostomy rates and survival for patients with rectal cancer. 2003;95(10):708‐716. Journal of the National Cancer Institute 2003;95(10):708‐16. [DOI] [PubMed] [Google Scholar]
Kressner 2009 {published data only}
- Kressner M, Bohe M, Cedermark B, Dahlberg M, Damber L, Lindmark G, Ojerskog B, Sjodahl R, Johansson R, Påhlman L. The Impact of Hospital Volume on Surgical Outcome in Patients with Rectal Cancer. Diseases of the colon and rectum 2009;52(9):1542‐49. [DOI] [PubMed] [Google Scholar]
Kuwabara 2009 {published data only}
- Kuwabara K, Matsuda S, Fushimi K, Ishikawa K, Horiguchi H, Fujimori K. Impact of hospital case volume on the quality of laparoscopic colectomy in Japan. Journal of Gastrointestinal Surgery 2009;13:1619‐26. [DOI] [PubMed] [Google Scholar]
Larson 2008 {published data only}
- Larson D, Marcello P, Larach S, Wexner S, Park A, Marks J, Senagore A, Thorson A, Young‐Fadok T, Green E, Sargent D, Nelson H. Surgeon volume does not predict outcomes in the setting of technical credentialing. Annals of Surgery 2008;248:746‐50. [DOI] [PubMed] [Google Scholar]
Lin 2006 {published data only}
- Lin H, Xirasagar S, Lee H Chai C. Hospital volume and inpatient mortality after cancer‐related gastrointestinal resections: The experience of an Asian country. Annals of Surgical Oncology 2006;13(9):1182‐88. [DOI] [PubMed] [Google Scholar]
Manchon‐Walsh 2011 {published data only}
- Manchon‐Walsh P, Borras J, Espinas J, Aliste L and Catalonian Rectal Cancer Group. Variability in the quality of rectal cancer care in public hospitals in Catalonia (Spain): Clinical audit as a basis for action. European Journal of Surgical Oncology 2011;37:325‐33. [DOI] [PubMed] [Google Scholar]
Martling 2002 {published data only}
- Martling A, Cedermark B, Johansson H, Rutqvist LE, Holm T. The surgeon as a prognostic factor after the introduction of total mesorectal excision in the treatment of rectal cancer. British Journal of Surgery 2002;89(8):1008‐13. [DOI] [PubMed] [Google Scholar]
Marusch 2001A {published data only}
- Marusch F, Koch A, Schmidt U, Pross M, Gastinger I, Lippert H. Hospital caseload and the results achieved in patients with rectal cancer. British Journal of Surgery 2001;88:1397‐402. [DOI] [PubMed] [Google Scholar]
Marusch 2001B {published data only}
- Marusch F, Koch A, Schmidt, Zippel R, Lehmann M, Czarnetzki H, Knoop M, Geissler S, Pross M, Gastinger I, Lippert H. Effect of caseload on the short‐term outcome of colon surgery: results of a multicenter study. International Journal of Colorectal disease 2001;16:362‐69. [DOI] [PubMed] [Google Scholar]
Marwan 2010 {published data only}
- Marwan K, Staples M, Thursfield V, Bell S. The rate of abdominoperineal resections for rectal cancer in the state of Victoria, Australia. Diseases of the Colon and Rectum 2010;53(12):1645‐51. [DOI] [PubMed] [Google Scholar]
McArdle 2004 {published data only}
- McArdle CS, Hole DJ. Influence of volume and specialisation on survival following surgery for colorectal disease. British Journal of Surgery 2004;91:610‐17. [DOI] [PubMed] [Google Scholar]
McGrath 2005 {published data only}
- McGrath DR, Leong DC, Gibberd R, Armstrong B, Spigelman AD. Surgeon and hospital volume and the management of colorectal cancer patients in Australia. Australian and New Zealand Journal of Surgery 2005;75:901‐10. [DOI] [PubMed] [Google Scholar]
Mella 1997 {published data only}
- Mella J, Biffin A, Radcliffe A, Stamatakis J, Steele R. Population‐based audit of colorectal cancer management in two UK health regions. British Journal of Surgery 1997;84:1731‐36. [PubMed] [Google Scholar]
Meyerhardt 2003 {published data only}
- Meyerhardt J, Catalano P, Schrag D, Ayanian J, Haller D, Mayer R, MacDonald J, Benson A, Fuchs C. Association of hospital procedure volume and outcomes in patients with colon cancer at high risk of recurrence. Annals of Internal Medicine 2003;139(8):649‐57. [DOI] [PubMed] [Google Scholar]
Meyerhardt 2004 {published data only}
- Meyerhardt J, Tepper J, Niedzwiecki D, Hollis D, Schrag D, Ayanian J, O'Connel M, Weeks J, Mayer R, Willet C, MacDonald J, Benson A, Fuchs C. Imppact of hospital procedure volume on surgical operation and long term outcomes in high risk curatively resected rectal cancer: findings from the Intergroup 0114 study. Journal of Clinical Oncology 2004;22:166‐74. [DOI] [PubMed] [Google Scholar]
Morris 2007 {published data only}
- Morris M, Platell C. Surgical volume influences survival in patients undergoing resections for stage II colon cancer. Australian and New Zealand Journal of Surgery 2007;77:902‐6. [DOI] [PubMed] [Google Scholar]
Mroczkowski 2011 {published data only}
- Mroczkowski P, Kube R, Ptok H, Schmidt U, Has S, Kockerling F, Gastinger I, Lippert H. Low‐volume center vs. high‐volume:the role of a quality assurance program in colon cancer surgery. Colorectal Disease 2011;13:276‐283. [DOI] [PubMed] [Google Scholar]
Ng 2006 {published data only}
- Ng VV, Tytherleigh MG, Fowler L, Farouk R. Subspecialisation and its effect on the management of rectal cancer. Annals of Royal College of Surgeons England 2006;88:181‐4. [DOI] [PMC free article] [PubMed] [Google Scholar]
Parry 1999 {published data only}
- Parry JM, Collins S, Mathers J, Scott NA, Woodman CB. Influence of volume of work on the outcome of treatment for patients with colorectal cancer. British Journal of Surgery 1999;86:475‐81. [DOI] [PubMed] [Google Scholar]
Platell 2003 {published data only}
- Platell C, Lim D, Nazreem T, Ji‐Li T, Wong K. Does surgical subspecialization influence survival in patients with colorectal cancer. World Journal of Gastroenterology 2003;9(5):961‐64. [DOI] [PMC free article] [PubMed] [Google Scholar]
Ptok 2007 {published data only}
- Ptok H, Marusch F, Kuhn R, Gastinger I, Lippert H, the study group " Colon/Rectum carcinoma (Primary Tumour). Influence of hospital volume on the frequency of abdominoperineal resections and long‐term oncological outcomes in low rectal cancer. European Journal of Surgical Oncology 2007;33:854‐61. [DOI] [PubMed] [Google Scholar]
Purves 2005 {published data only}
- Purves H, Pietrobon R, Hervey S, Guller U, Miller W, Ludwig K. Relationship between surgeon caseload and sphincter preservation in patients with rectal cancer. Diseases of the Colon and Rectum 2005;48:195‐202. [DOI] [PubMed] [Google Scholar]
Rabeneck 2004 {published data only}
- Rabeneck L, Davila, J, Thompson M, El‐Serag H. Surgical volume and long‐term survival following surgery for colorectal cancer in the veterans affairs health‐care system. American Journal of Gastroenterology 2004;99(4):668‐75. [DOI] [PubMed] [Google Scholar]
Rogers 2006 {published data only}
- Rogers Jr SO, Wolf RE, Zaslavsky AM, Wright WE, Ayanian JZ. Relation of surgeon and hospital volume to processes and outcomes of colorectal cancer surgery. Annals of Surgery 2006;244:1003‐11. [DOI] [PMC free article] [PubMed] [Google Scholar]
Schrag 2002 {published data only}
- Schrag D, Panageas KS, Riedel E, Cramer LD, Guillem JG, Bach PB, et al. Hospital and surgeon procedure volume as predictors of outcome following rectal cancer resection. Annals of Surgery 2002;236:583‐92. [DOI] [PMC free article] [PubMed] [Google Scholar]
Schrag 2003 {published data only}
- Shrag D, Panageas K, Riedel E, Hsieh L, Bach P, Guillem J, Begg C. Surgeon volume compared to hospital volume as a predictor of outcome following primary colon cancer resection. Journal of Surgical Oncology 2003;83:68‐79. [DOI] [PubMed] [Google Scholar]
Simons 1997 {published data only}
- Simons A, Ker R, Groshen S, Gee C, Anthone G, Ortega A, Vukasin P, Ross R, Beart R. Variations in treatment of rectal cancer. Diseases of colon and rectum 1997;40(6):641‐46. [DOI] [PubMed] [Google Scholar]
Simunovic 2000 {published data only}
- Simunovic M, To T, Baxter N, Balshem A, Ross E, Cohen Z, McLeod R, Engstrom P, Sigurdson E. Hospital procedure volume and teaching status do not influence treatment and outcome measures of rectal cancer surgery in a large general population. Journal of Gastrointestinal Surgery 2000;4(3):324‐30. [DOI] [PubMed] [Google Scholar]
Simunovic 2006 {published data only}
- Simunovic M, Rempell E, Theriault M, Coates A, Whelan T, Holowarty E, Langer B, Levine M. Influence of hospital characteristics on operative death and survival of patients after major cancer surgery in Ontario. Canadian Journal of Surgery 2006;49(4):251‐58. [PMC free article] [PubMed] [Google Scholar]
Sjovall 2007 {published data only}
- Sjovall A, Holm T, Singnomklao T, Granath F, GlimeliusF, Glimelius B, Cedermark B. Colon cancer management and outcome in relation to individual hospitals in a defined population. British Journal of Surgery 2007;94(4):491‐99. [DOI] [PubMed] [Google Scholar]
Smith 2003 {published data only}
- Smith J, King P, Lane R, Thompson M. Evidence of the effect of specialization on the management, surgical outcome and survival from colorectal cancer in Wessex.. British Journal of Surgery 2003;90:583‐92. [DOI] [PubMed] [Google Scholar]
Urbach 2004 {published data only}
- Urbach DR, Baxter NN. Does it matter what a hospital is "high‐volume" for? Specificity of hospital volume‐outcome associations for surgical procedures: analysis of administrative data. British Medical Journal 2004;328:737‐40. [DOI] [PMC free article] [PubMed] [Google Scholar]
Wibe 2005 {published data only}
- Wibe A, Eriksen MT, Syse A, Tretli S, Myrvold HE, Soreide O, et al. Effect of hospital caseload on long‐term outcome after standardisation of rectal cancer surgery at a national level. British Journal of Surgery 2005;92:217‐24. [DOI] [PubMed] [Google Scholar]
Zhang 2007 {published data only}
- Zhang W, Ayanian J, Zaslavsky A. Patient characteristics and hospital quality for colorectal cancer surgery. International Journal for quality and healthcare 2007;19:11‐20. [DOI] [PubMed] [Google Scholar]
References to studies excluded from this review
Beart 1995 {published data only}
- Beart R, Steele G, Menck H, Chmiel J, Ocweija K. Management and survival of patients with adenocarcinoma of the colon and rectum:a national survey of the commission on cancer. Journal of the American College of Surgeons 1995;181:235‐236. [PubMed] [Google Scholar]
Bokey 1997 {published data only}
- Bokey E, Chapuis S, Dent O, Newland R, Koorey S, Zelas P, Stewart P. Factors affecting survival after excision of the rectum for cancer. Diseases of the Colon and Rectum 1996;40:3‐10. [DOI] [PubMed] [Google Scholar]
Callahan 2003 {published data only}
- Callahan M, Christos P, Gold H, Mushlin A, Daly J. Influence of surgical subspecialty training on in‐hospital mortality for gastrectomy and colectomy patients. Annals of Surgery 2003;238:629‐39. [DOI] [PMC free article] [PubMed] [Google Scholar]
Crocetti 1996 {published data only}
- Crocetti E, Barchielli A, Buiatti E, Castiglione G, Zappa M. Colorectal cancer survival‐population based rates in the province of Florence. European Journal of Cancer Prevention 1996;5:189‐95. [DOI] [PubMed] [Google Scholar]
Dahlberg 1998 {published data only}
- Dahlberg M, Pahlman L, Bergstrom R, Glimelius B. Improved survival in patients with rectal cancer:a population‐based register study. British Journal of Surgery 1998;85:515‐20. [DOI] [PubMed] [Google Scholar]
Dorrance 1997 {published data only}
- Dorrance H, O'Dwyer P. Effect of surgeon's specialty interest on outcome following curative colorectal cancer surgery. British Journal of Surgery 1997;84(Suppl 1):37. [Google Scholar]
Easson 2002 {published data only}
- Easson A, Cotterchio M, Crosby J, Sutherland H, Dale D, Aronson M, Holowaty E, Gallinger S. A population‐based study of the extent of surgical resection. Annals of Surgical Oncology 2002;94(4):380‐87. [DOI] [PubMed] [Google Scholar]
Haward 2004 {published data only}
- Haward R, Morris E, Monson J, Johnston, Forman D. The long term survival of rectal cancer patients following abdominoperineal and anterior resection: results of a population‐based observational study. European Journal of Surgical Oncology 2005;31:22‐28. [DOI] [PubMed] [Google Scholar]
Hayanga 2010 {published data only}
- Hayanga A, Mukherjee D, Chang D, Kaiser H, Lee T, Gearhart S, Ahuja N, Freischlag J. Teaching hospital status and operative mortality in the United States. Archives of Surgery 2010;145(4):346‐50. [DOI] [PMC free article] [PubMed] [Google Scholar]
Hermanek 1995 {published data only}
- Hermamnek P, Wiebelt H, Staimmer D, Riedel S, and the German Study Group Colo‐rectal Carcinoma (SGCRC). Prognostic factors of rectum carcinoma‐Experience of the German Multicentre Study (SGCRC). Tumori 1995;81:60‐4. [PubMed] [Google Scholar]
Hermanek 1996 {published data only}
- Hermanek P, Hohenberger W. The importance of volume in colorectal cancer surgery. European Journal of Surgical Oncology 1996;22:213‐15. [DOI] [PubMed] [Google Scholar]
Hermanek 1998 {published data only}
- Hermanek P. A critical analysis of different results of colon cancer surgery. Lagenbecks Archive der Chirurgie 1998;115:323‐26. [PubMed] [Google Scholar]
Hermanek 1999 {published data only}
- Hermanek P. Impact of surgeons's technique on outcome after treatment of rectal carcinoma. Diseases of the Colon and Rectum 1999;42(5):559‐62. [DOI] [PubMed] [Google Scholar]
Hermanek 2000 {published data only}
- Hermanek P, Mansmann U, Staimmer D, Riedl S, Hermanek P. The German Experience. The surgeon as a prognostic factor in colon and rectal cancer surgery. Surgical Oncology Clinics of North America 2000;9(1):33‐49. [PubMed] [Google Scholar]
Hilska 2004 {published data only}
- Hilska M, Roberts JR, Kossi Jyrki, Paajanen H, Collan Yrjo, Laato M. The influence of training level and surgical experience on survival in colorectal cancer. Langenbecks Arch Surg 2004;389:524‐31. [DOI] [PubMed] [Google Scholar]
Ho 2006 {published data only}
- Ho V, Heslin M, Yun H, Howard L. Trends in hospital and surgeon volume and operative mortality for cancer surgery. Annals of Surgical Oncology 2006;13(6):851‐58. [DOI] [PubMed] [Google Scholar]
Holm 1997 {published data only}
- Holm T, Johansson H, Cedermark B, Ekuland G. Influence of hospital‐ and surgeon‐related factors on outcome after treatment of rectal cancer with or without preoperative radiotherapy. British Journal of Surgery 1997;84:657‐63. [PubMed] [Google Scholar]
Jestin 2004 {published data only}
- Jestin P, Heurgren M, Pahlman L, Glimelius B, Gunnarsson U. Elective surgery for colorectal cancer in a defined Swedish population. European Journal of Surgical Oncology 2004;30:26‐33. [DOI] [PubMed] [Google Scholar]
Kapiteijn 1998 {published data only}
- Kapiteijn E, Marijnen C, Colenbrander A. Local recurrence in patients with rectal cancer diagnosed between 1988 and 1992. European Journal of Surgical Oncology 1998;24:528‐35. [DOI] [PubMed] [Google Scholar]
Kee 1999 {published data only}
- Kee F, Wilson R, Harper C, Patterson C, McCallion K, Houston R, Moorehead R, Sloan J, Rowlands B. Influence of hospital and clinician workload on survival from colorectal cancer:cohort study. British Medical Journal 1999;318:1381‐86. [DOI] [PMC free article] [PubMed] [Google Scholar]
Luna‐Perez 1999 {published data only}
- Luna‐Perez P, Huelga A, Almendaro S, Rodriguez‐Coria D, Macouzet J, Gallardo S. The surgeon as a prognostic factor for local recurrence and survival in the anal sphincter preservation for mid‐rectal cancer. Revista de Investigacion Clinica 1999;51:205‐13. [PubMed] [Google Scholar]
Machado 2000 {published data only}
- Machado M, Goldman S, Jarhult J. Improved results in rectal cancer surgery‐an effect of specialisation. Colorectal Disease 2000;2:264‐69. [DOI] [PubMed] [Google Scholar]
Mander 2002 {published data only}
- Mander B, Bokey E, Chapuis P, Dent O, Bisset I, Newland R. The impact of subspecialization on survival in patients undergoing potentially curative resection of colonic carcinoma. Colorectal disease 2002;Suppl 1:11. [Google Scholar]
Martling 2000 {published data only}
- Martling A, Holm T, Rutquist L, Moran B, Heald R, Cedermark B, for the Stockholm Colorectal Cancer Study group and the Basingstoke Bowel Research Project. Effect of a training programme on outcome of rectal in the County of Stockholm. Lancet 2000;356:93‐6. [DOI] [PubMed] [Google Scholar]
Matthiessen 2006 {published data only}
- Matthiessen P, Hallbook O, Rutegard J, Sjodahl R. Population‐based study of risk factors for postoperative death after anterior resection of the rectum. British Journal of Surgery 2006;93:498‐503. [DOI] [PubMed] [Google Scholar]
McArdle 1991 {published data only}
- McArdle C, Hole D. Impact of variability among surgeons on postoperative morbidity and mortality and ultimate survival. British Medical Journal 1991;302:1501‐505. [DOI] [PMC free article] [PubMed] [Google Scholar]
McArdle 2002 {published data only}
- McArdle C, Hole D. Outcome following surgery for colorectal cancer: analysis by hospital after adjustment for case‐mix and deprivation. British Journal of Cancer 2002;86:331‐35. [DOI] [PMC free article] [PubMed] [Google Scholar]
Miller 2004 {published data only}
- Miller E, Woosley J, Martin C, Sandler R. Hospital‐to‐hospital variation in lymph node detection after colorectal resection. Cancer 2004;101(5):1065‐71. [DOI] [PubMed] [Google Scholar]
Mohner 1990 {published data only}
- Mohner M, Slisow W. Influence of regional‐centralised treatment on the end results demonstrated in rectum carcinoma in GDR. Zentralblatt Chirurgie 1990;115:801‐12. [PubMed] [Google Scholar]
Paquette 2010 {published data only}
- Paquette I, Kemp J, Finlayson S. Patient and Hospital Factors Associated With Use of Sphincter‐Sparing Surgery for Rectal Cancer. Diseases of the colon & rectum 2010;53(2):115‐20. [DOI] [PubMed] [Google Scholar]
Pata 2008 {published data only}
- Pata G, Casella C, Nascimbeni R, Cirillo L, Salerni B. Modifiable risk factors in colorectal surgery: central role of surgeon's volume. Annali Italiani Chirurgia 2008;79:427‐33. [PubMed] [Google Scholar]
Porter 1998 {published data only}
- Porter G, Soskolne C, Yakimets W, Newman S. Surgeon‐related factors and outcome in rectal cancer. Annals of Surgery 1998;227(2):157‐67. [DOI] [PMC free article] [PubMed] [Google Scholar]
Read 2002 {published data only}
- Read T, Myerson R, Fleshman J, Fry R, Birnbaum E, Walz B, Kodner I. Surgeon specialty is associated with outcome in rectal cancer treatment. Diseases of the Colon and Rectum 2002;45(7):904‐14. [DOI] [PubMed] [Google Scholar]
Renzulli 2006 {published data only}
- Renzulli P, Lowry A, Maibach R, Egeli R, Metzger U, Laffer U. The influence of the surgeon's and the hospital's caseload on survival and local recurrence after colorectal cancer surgery. Surgery 2006;139(3):296‐304. [DOI] [PubMed] [Google Scholar]
Schrag 2000 {published data only}
- Schrag D, Cramer L, Bach P, Cohen A, Warren J, Begg C. Influence of hospital procedure volume on outcomes following surgery for colon cancer. JAMA 2000;284(23):3028‐35. [DOI] [PubMed] [Google Scholar]
Shankar 2001 {published data only}
- Shankar P, Achuthan R, Haray P. Colorectal subspecialization in a DGH. The way forward!. Colorectal Disease 2001;3:396‐401. [DOI] [PubMed] [Google Scholar]
Singh 1995 {published data only}
- Singh S, Morgan BF, Broughton M, Caffarey S, Topham C, Marks CG. A 10 year prospective audit of outcome of surgical treatment for colorectal carcinoma. British Journal of Surgery 1995;82:1486‐90. [DOI] [PubMed] [Google Scholar]
Smedh 2001 {published data only}
- Smedh K, Olsson L, Johansson H, Aberg C, Andersom M. Reduction of postoperative morbidity and mortality in patients with rectal cancer following the introduction of a colorectal unit. British Journal of Surgery 2001;88:273‐77. [DOI] [PubMed] [Google Scholar]
Stocchi 2001 {published data only}
- Stocchi L, Nelson H, Sargent D, O'Connell M, Tepper J, Krook J, Beart R and the North Central Cancer Treatment Group. Impact of surgical and pathologic variables in rectal cancer: A United States Community and Co‐operative Group Report. Journal of Clinical Oncology 2001;19(18):3895‐902. [DOI] [PubMed] [Google Scholar]
Syk 2010 {published data only}
- Syk E, Glimelius B, Nilsson P. Factors Influencing Local Failure in Rectal Cancer:Analysis of 2315 Patients From a Population‐Based Series. Diseases of the Colon and Rectum 2010;53:744‐52. [DOI] [PubMed] [Google Scholar]
Ubhi 1995 {published data only}
- Ubhi S, Kent J. Which surgeons in a district general hospital should treat patients with carcinoma of the rectum?. Journal of the Royal College of Surgeons of Edinburgh 1995;40:52‐4. [PubMed] [Google Scholar]
Yasunaga 2009a {published data only}
- Yasunaga H, Matsuyama Y, Ohe K and Japan Surgical Society. Effects of hospital and surgeon volumes on operating times, postoperative complications, and length of stay following laparoscopic colectomy. Surgery Today 2009;39:955‐61. [DOI] [PubMed] [Google Scholar]
Yasunaga 2009b {published data only}
- Yasunaga H, Matsuyama Y, Ohe K and Japan Surgical Society. Volume‐outcome relationship in rectal cancer surgery: A new perspective. Surgery Today 2009;39:663‐68. [DOI] [PubMed] [Google Scholar]
Additional references
ACPGBI 2007
- ACPGBI. Guidelines for the management of colorectal cancer. 3rd Edition. The Association of Coloproctologists of Great Britain and Ireland, 2007. [Google Scholar]
Birkmeyer 2001
- Birkmeyer J, Finlayson E, Birkmeyer C. Volume standards for high‐risk surgical procedures: potential benefits of the Leapfrog initiative. Surgery 2001;130:415‐422. [DOI] [PubMed] [Google Scholar]
Chowdhury 2007
- Chowdhury MM, Dagash H, Pierro A. A systematic review of the impact of volume of surgery and specialization on patient outcome. British Journal of Surgery 2007;94:145‐161. [DOI] [PubMed] [Google Scholar]
Deeks 2001
- Deeks JJ, Altman DG, Bradburn MJ. Statistical methods for examining heterogeneity and combining results from several studies in meta‐analysis. Statististical methods for examining heterogeneity and combining results from several studies in meta‐analysis. In: Egger M, Davey Smith G,Altman DG (eds), editor(s). Systematic Reviews in Healthcare: Meta‐analysis in context. 2nd Edition. London: British Medical Journal Publication Group, 2001. [Google Scholar]
Dent 1998
- Dent D. Cancer surgery: why some survival benefits may be artefactual. British Journal of Surgery 1998;85:433‐434. [DOI] [PubMed] [Google Scholar]
Dube 1997
- Dube S, Heyen F, Jenicek M. Adjuvant chemotherapy in colorectal carcinoma: results of a meta‐analysis. Diseases of the Colon and Rectum 1997;40(1):35‐41. [DOI] [PubMed] [Google Scholar]
Dudley 2000
- Dudley R A, Johansen, K L, Brand R, Rennie, D J, Milstein, A. Selective referral to high‐volume hospitals. JAMA 2000;283(9):1159‐1166. [DOI] [PubMed] [Google Scholar]
Feinstein 1985
- Feinstein A, Sosin D, Wells C. Stage migration and new diagnostic techniques as source of misleading statistics for survival in cancer. New England Journal of Medicine 1985;312(25):1604‐1608. [DOI] [PubMed] [Google Scholar]
Fong 2005
- Fong Y, Gonen M, Rubin D, Radzyner M, Brennan M F. Long‐term survival is superior after resection for cancer in high‐volume centres. Annals of Surgery 2005;242(4):540‐544. [DOI] [PMC free article] [PubMed] [Google Scholar]
Globocan 2002 [Computer program]
- Ferlay J, Bray F, Pisani P, Parkin DM. Globocan 2002. Cancer incidence, mortality and prevalence worldwide. Lyon: IARC press, 2004.
Grade Working Group 2004
- Grade Working Group. Grading quality of evidence and strength of recommendations. British Medical Journal 2004;328(7454):1490‐1494. [DOI] [PMC free article] [PubMed] [Google Scholar]
Gruen 2009
- Gruen R L, Pitt V, Green S, Parkhill A, Campbell D, Jolley D. The Effect of Provider Case Volume on Cancer Mortality: Systematic Review and Meta‐Analysis. CA. A Cancer Journal for Clinicians 2009;59:192‐211. [DOI] [PubMed] [Google Scholar]
Hahn 2002
- Hahn S, Williamson PR, Hutton JL. Investigation of within‐study selective reporting in clinical research:follow up of applications submitted to a local research ethics committee. Journal of evaluation in Clinical Practice 2002;8(3):353‐59. [DOI] [PubMed] [Google Scholar]
Hall 2009
- Hall BL, Bilimoria KY, Ko CY. Investigations using clinical data registries: Observational studies and risk adjustment. Surgery 2009;145(6):602‐610. [DOI] [PubMed] [Google Scholar]
Haynes 1995
- Haynes SR, Lawler PG. An assessment of the consistency of ASA physical status classification allocation. Anaesthesia 1995;50:195–199. [DOI] [PubMed] [Google Scholar]
Heald 1988
- Heald RJ. The "Holy Plane" of rectal surgery. Journal of the Royal Society of Medicine 1988;81:503‐508. [DOI] [PMC free article] [PubMed] [Google Scholar]
Higgins 2003
- Higgins JPT, Thompson SG, Deeks JJ Altman DG. Measuring inconsistency in meta‐analyses. British Medical Journal 2003;327:557‐560. [DOI] [PMC free article] [PubMed] [Google Scholar]
Higgins 2008
- Higgins JPT, Deeks JJ. Chapter 7: Selecting studies and collecting data. In: Higgins JPT, Green S editor(s). Cochrane handbook for systematic reviews of interventions. 5.0.2. The Cochrane Collaboration, 2009. [Google Scholar]
Hogan 2009
- Hogan AM, Kennelly R, Winter DC. Volume‐outcome analysis in rectal cancer: A plea for enquiry, evidence and evolution. European Journal of Surgical Oncology 2009;35(2):111‐2. [DOI] [PubMed] [Google Scholar]
Ihse 2003
- Ihse I. The volume‐outcome relationship in cancer surgery:A hard sell. Annals of Surgery 2003;238(6):777‐781. [DOI] [PMC free article] [PubMed] [Google Scholar]
Iversen 2006A
- Iversen L, Harling H, Laurberg S, Wille‐Jorgensen P. Influence of caseload and surgical speciality on outcome following surgery for colorectal cancer: a review of the evidence. Part I: short term outcome. Colorectal Disease 2006;9:28‐37. [DOI] [PubMed] [Google Scholar]
Iversen 2006B
- Iversen L, Harling H, Laurberg, Wille‐Jorgensen P. Influence of caseload and surgical speciality on outcome following surgery for colorectal cancer: a review of the evidence. Part II: long term outcome. Colorectal Disease 2006;9:38‐46. [DOI] [PubMed] [Google Scholar]
Iversen 2007
- Iversen LH, Norgaard M, Jepsen P, Jacobson J, Christen sen MM, et al. Trends in colorectal cancer survival in northern Denmark: 1985‐2004. Colorectal Disease 2007;9(3):210. [DOI] [PubMed] [Google Scholar]
Kapiteijn 2001
- Kapiteijn E, Marijnen CAM, Nagtegaal ID, Putter H, Steup WH, Wiggers T, Rutten HJT, Pahlman L, Glimelius B, Krieken HJM, Leer JWH, Velde CJH. Preoperative Radiotherapy combined with total mesorectal excision for resectable rectal cancer. The New England Journal of Medicine 2001;345(9):638‐646. [DOI] [PubMed] [Google Scholar]
Keating 2003
- Keating J, Pater P, Lolohea S, Wickremesekera K. The epidemiology of colorectal cancer: what can we learn from the New Zealand Cancer Registry?. New Zealand Medical Journal 2003;116:U437. [PubMed] [Google Scholar]
Killeen 2005
- Killeen S, O'Sullivan M, Coffey J, Kirwan W, Redmond H. Provider and outcomes for oncological procedures. British Journal of Surgery 2005;92:389‐402. [DOI] [PubMed] [Google Scholar]
Lee 1957
- Lee JAH, Morrison SL, Morris JN. Fatality from three common surgical conditions in teaching and non‐teaching hospitals. Lancet 1957;11:285‐291. [DOI] [PubMed] [Google Scholar]
Leyland 2001
- Leyland A, Goldstein H. Multilevel Modelling of Health StatisticsSeries: Wiley series in probability and statistics. Vol. Leyland, A.H. and Goldstein, H., eds. (2001) Multilevel Modelling of Health Statistics. Series: Wiley series in probability and statistics, Chichester: Wiley, 2001. [Google Scholar]
Lipworth 1963
- Lipworth L, Lee JAH, Morris JN. Case‐fatality in teaching and non‐teaching hospitals 1956‐59. Medical Care 1963;1:71‐76. [Google Scholar]
Luft 1979
- Luft HS, Bunker JP, Enthoven AC. Should Operations be regionalized?. The New England Journal of Medicine 1979;301:1364‐1369. [DOI] [PubMed] [Google Scholar]
Luft 1987
- Luft H, Hunt S, Maerki S. The volume‐outcome relationship: Practice‐makes‐perfect or Selective‐referral pattern. Health Services Research 1987;22(2):157‐182. [PMC free article] [PubMed] [Google Scholar]
Mamounas 1999
- Mamounas E, Wienand S, Wolmark N, Bear HD, Atkins JN, Song K, Jones J, Rockette H. Comparative efficacy of adjuvant chemotherapy in patients with Dukes' B versus Dukes' C colon cancer: results from four National Surgical Adjuvant Breast and Bowel Project adjuvant studies (C‐01,C‐02,C‐03 and C‐04). Journal of Clinical Oncology 1999;17(5):1349‐1355. [DOI] [PubMed] [Google Scholar]
Midgley 2000
- Midgley RS, Kerr DJ. ABC of colorectal cancer: adjuvant therapy. British Medical Journal 2000;321:1208‐1211. [DOI] [PMC free article] [PubMed] [Google Scholar]
Newcastle‐Ottawa Scale
- Wells GA, Shea B, O'connell, Petersen J, Welch V, LososM, Tugwell P. The Newcastle‐Ottawa scale for assessing the quality of non‐randomised studies in meta‐analysis. http://www.ohri.ca/programs/clinical_epidemiology/oxford.htm.
Panageas 2003A
- Panageas K, Schrag D, Riedel E, Bach P, Begg C. The effect of clustering of outcomes on the association of procedure volume and surgical outcomes. Annals of Internal Medicine 2003;139(8):658‐665. [DOI] [PubMed] [Google Scholar]
Parmar 1998
- Parmar MK, TorriV, Stewart L. Extracting summary statistics to perform meta‐analyses of the published literature for survival endpoints. Statistics in Medicine 1998;17(24):2815‐34. [DOI] [PubMed] [Google Scholar]
Ranta 1997
- Ranta S, Hynynen M, Tammisto T. A survey of the ASA physical status classification: significant variation in allocation among Finnish anaesthesiologists.. Acta Anaesthesiologica Scandinavica 1997;41:629‐632. [DOI] [PubMed] [Google Scholar]
Salz 2008
- Salz T, Sandler RS. The effect of Hospital and Surgeon Volume on outcomes for Rectal Cancer Surgery. Clinical Gastroenterology and Hepatology 2008;6:1185‐93. [DOI] [PMC free article] [PubMed] [Google Scholar]
Sant 2009
- Sant M, Allemani C, Santaquilani M, Knijn A, Marchesi F, Capocaccia R. Eurocare‐4. Survival of cancer patients diagnosed in 1995‐1999. Results and commentary. European Journal of Cancer 2009;45:931‐991. [DOI] [PubMed] [Google Scholar]
Skegg 2002
- Skegg DC, McCredie MR. Comparison of cancer mortality and incidence in New Zealand and Australia. New Zealand Medical Journal 2002;115:205‐208. [PubMed] [Google Scholar]
Soljak 2002
- Soljak M. Volume of procedures and outcome of treatment. British Medical Journal 2002;325:787‐788. [DOI] [PMC free article] [PubMed] [Google Scholar]
Stiller 1994A
- Stiller C. Centralised treatment, entry to trials and survival. British Journal of Cancer 1994;70:352‐362. [DOI] [PMC free article] [PubMed] [Google Scholar]
Swedish Rectal Cancer Trial 1997
- Swedish Rectal Cancer Trial. Improved survival with preoperative radiotherapy in resectable rectal cancer. The New England Journal of Medicine 1997;336(14):980‐987. [DOI] [PubMed] [Google Scholar]
Verdecchia 2007
- Verdecchia A, Franciscia S, Brenner H, Gatta G, Micheli A, Mangone L, Kunkler I. Recent cancer survival in Europe: a 2000–02 period analysis of EUROCARE‐4 data. Lancet Oncology 2007;8(9):784‐96. [DOI] [PubMed] [Google Scholar]
Wille‐Jørgensen 2001
- Wille‐Jørgensen P, Grinsted P, Harling H, Pihl J. Status for incidence, prognosis and diagnostics in colorectal cancer [Status for forekomst, prognose og diagnostik af kolorektal cancer]. Kræft i Tyktarm og Endetarm. Diagnostik og Screening. Vol. 3, Copenhagen: Statens Institut for Medicinsk Teknologivurdering, 2001:45‐94. [ISBN:87‐90951‐56‐3] [Google Scholar]