

ABSTRACT
Cytoplasmic aggregation and nuclear depletion of TAR DNA‐binding protein 43 (TDP‐43) is a hallmark pathology of several neurodegenerative diseases including amyotrophic lateral sclerosis (ALS), frontotemporal lobar degeneration (FTLD) and limbic‐predominant age‐related TDP‐43 encephalopathy (LATE). However, the protein interactome of TDP‐43 remains incompletely defined. In this study, we aimed to identify putative TDP‐43 protein partners within the nucleus and the cytoplasm and with different disease models of TDP‐43 by comparing TDP‐43 interaction partners in three different cell lines. We verified the levels of interaction of protein partners under stress conditions as well as after introducing TDP‐43 variants containing ALS missense mutations (G294V and A315T). Overall, we identified 58 putative wild‐type TDP‐43 interactors, including novel binding partners responsible for RNA metabolism and splicing. Oxidative stress exposure broadly led to changes in TDP‐43WT interactions with proteins involved in mRNA metabolism, suggesting a dysregulation of the transcriptional machinery early in disease. Conversely, although G294V and A315T mutations are both located in the C‐terminal domain of TDP‐43, both mutants presented different interactome profiles with most interaction partners involved in translational and transcriptional machinery. Overall, by correlating different cell lines and disease‐simulating interventions, we provide a list of high‐confidence TDP‐43 interaction partners, including novel and previously reported proteins. Understanding pathological changes to TDP‐43 and its specific interaction partners in different models of stress is critical to better understand TDP‐43 proteinopathies and provide novel potential therapeutic targets and biomarkers.

Keywords: ALS, APEX, interactomics, MND, proteomics, TDP‐43
Cytoplasmic aggregation and nuclear depletion of TAR DNA‐binding protein 43 (TDP‐43) is a hallmark pathology of several neurodegenerative diseases including amyotrophic lateral sclerosis (ALS), frontotemporal lobar degeneration (FTLD) and limbic‐predominant age‐related TDP‐43 encephalopathy (LATE). However, the protein interactome of TDP‐43 remains incompletely defined. In this study, we aimed to identify putative TDP‐43 protein partners within the nucleus and the cytoplasm and with different disease models of TDP‐43 by comparing TDP‐43 interaction partners in three different cell lines. We verified the levels of interaction of protein partners under stress conditions as well as after introducing TDP‐43 variants containing ALS missense mutations (G294V and A315T). Overall, we identified 58 putative wild‐type TDP‐43 interactors, including novel binding partners responsible for RNA metabolism and splicing. Oxidative stress exposure broadly led to changes in TDP‐43WT interactions with proteins involved in mRNA metabolism, suggesting a dysregulation of the transcriptional machinery early in disease. Conversely, although G294V and A315T mutations are both located in the C‐terminal domain of TDP‐43, both mutants presented different interactome profiles with most interaction partners involved in translational and transcriptional machinery. Overall, by correlating different cell lines and disease‐simulating interventions, we provide a list of high‐confidence TDP‐43 interaction partners, including novel and previously reported proteins. Understanding pathological changes to TDP‐43 and its specific interaction partners in different models of stress is critical to better understand TDP‐43 proteinopathies and provide novel potential therapeutic targets and biomarkers.

Abbreviations
- ALS
amyotrophic Lateral Sclerosis
- BioID
proximity‐dependent Biotin
- DMEM
Dulbecco's Modified Eagle's Medium
- DMSO
diMethylsulfoxide
- FA
formic acid
- FBS
fetal bovine albumin
- FDR
false discovery rate
- FTLD
frontotemporal lobar degeneration
- HBSS
Hank's balanced salt solution
- IP
immunoprecipitation
- LATE‐NC
limbic‐predominant age‐related TDP‐43 encephalopathy neuropathological change
- LC–MS/MS
liquid chromatography–tandem mass spectrometry
- LSB
low salt buffer
- MND
motor neuron disease
- NaAsO2
sodium arsenite
- RRID
Research Resource Identifier (see scicrunch.org)
- RT
room temperature
- TBS
tris‐buffered saline
- WT
wild‐type
1. Introduction
Amyotrophic lateral sclerosis (ALS), the most common form of motor neuron disease (MND), is a devastating neurodegenerative disease characterised by the progressive loss of upper motor neurons in the brain and lower motor neurons in the spinal cord (Hardiman et al. 2017). ALS subtypes are generally grouped into two categories: familial ALS (fALS), where the disease can be inherited in a Mendelian pattern, and sporadic ALS (sALS), representing > 90% of ALS cases with no currently identified causes (Masrori and Van Damme 2020).
Cytoplasmic aggregation and nuclear depletion of Tar DNA‐binding Protein 43 (TDP‐43) are a hallmark pathology of MND, observed in ~97% of ALS and ~45% of frontotemporal lobar degeneration (FTLD) cases (Ling et al. 2013; Tan et al. 2017). In addition to being mislocalised to the cytoplasm in affected neurons in ALS and FTLD postmortem tissues, TDP‐43 is hyperphosphorylated, ubiquitinated and often cleaved, generating C‐terminal fragments (Arai et al. 2010; Neumann et al. 2006). The estimated lifetime risk of developing ALS is estimated to be 1:350 in men and 1:400 in women (Kiernan et al. 2011; Masrori and Van Damme 2020; Ryan et al. 2019; Strong et al. 2017). TDP‐43 pathology is also the most common hallmark in LATE/LATE‐NC (Limbic‐predominant age‐related TDP‐43 encephalopathy), a brain disorder introduced by Nelson et al. (2019) to describe TDP‐43 proteinopathy of advanced age, especially in subjects older than age 80 (Cheng et al. 2024; Nelson et al. 2019). In a large study cohort, more than 20% of subjects over the age of 80 were identified to have pathological features consistent with LATE‐NC (Nelson et al. 2019).
Structurally, TDP‐43 is composed of a N‐terminal domain with a nuclear localisation sequence, two RNA‐recognition motifs, and a glycine‐rich sequence at the C‐terminus that mediates protein–protein interactions (François‐Moutal et al. 2019). The N‐terminal domain promotes self‐oligomerisation required for RNA splicing activity (Chang et al. 2012; Oiwa et al. 2023). The nuclear localisation sequence facilitates TDP‐43 to shuttle into the nucleus, and mutation or deletion of this signal sequence leads to cytoplasmic localisation of TDP‐43 in cells and animal models (Barmada et al. 2010; Walker et al. 2015; Winton et al. 2008). The RNA‐recognition motifs 1 and 2 are considered to bind UG/TG‐rich single‐stranded or double‐stranded DNA/RNA to undertake a range of functions related to RNA metabolism (Dunker et al. 2021; François‐Moutal et al. 2019; Kuo et al. 2009; Lagier‐Tourenne et al. 2010; Lukavsky et al. 2013). The C‐terminal is critical for liquid–liquid phase separation, mRNA splicing and protein–protein interactions (Conicella et al. 2016; Li et al. 2018). Missense mutations in TARDBP in ALS are found in around ~3% of fALS and 2% of sALS cases, with most of these mutations located in the glycine‐rich C‐terminal domain (Prasad et al. 2019; Radford et al. 2015) and FTD cases (Kabashi et al. 2008; Williams et al. 2009).
In a significant majority of ALS cases, motor neurons exhibit pathologic accumulation of insoluble cytoplasmic and nuclear inclusions containing TDP‐43 (Arai et al. 2006; Neumann et al. 2006). On the other hand, TDP‐43 undergoes demixing in the cell and forms biomolecular condensates through phase separation, a process where proteins and nucleic acids come together to form dense, membraneless structures in cells (Koehler et al. 2022; Scherer et al. 2024; Wang et al. 2018). This can occur under certain conditions, such as stress or changes in the cellular environment, and TDP‐43 responds to such events by altering its localisation, such as relocating into the cytoplasm or being recruited into stress granules (Jung et al. 2023; Udan‐Johns et al. 2014). Although we now have a more comprehensive understanding of end‐stage TDP‐43 pathologies through postmortem tissue studies, there remains limited knowledge regarding the protein‐interaction changes of TDP‐43 within the nucleus and under stress conditions, which play an important role in further defining disease characteristics.
Previous studies have sought to elucidate the binding partners of TDP‐43 to better understand the molecular mechanisms responsible for the aggregation propensities of TDP‐43. These studies used biochemical techniques such as immunoprecipitations (IP) (Evangelista et al. 2023) or proximity labeling techniques like proximity‐dependent biotin identification (BioID) followed by liquid chromatography–tandem mass spectrometry (LC–MS/MS) (Chou et al. 2018). Immunoprecipitation uses primary antibodies that bind to a specific antigenic site on protein(s) for enrichment. When coupled with LC–MS/MS, it allows for the identification of cointeractors of the target protein, giving us insights into the network of protein–protein interactions (interactome). However, this method does not necessarily capture the protein interactions that occur at different stages and may fail to identify transient interaction partners, as well as weak binding partners that can be lost during sample processing. Conversely, IP LC–MS/MS may also identify nonspecific protein–protein interactions that may occur post lysis that would not normally occur.
To address such limitations in IP LC–MS/MS, BioID was developed (Roux et al. 2012) to enable the identification of the proteins near the protein‐of‐interest under native cellular conditions. This method utilises a DNA plasmid of a biotin ligase (BirA) in frame with the protein‐of‐interest, and when expressed together with exogenously added biotin in live cells, this ligase biotinylates proteins in close proximity. These biotinylated interacting proteins can be subsequently pulled down using streptavidin‐coated beads and washed stringently under higher detergent conditions, followed by LC–MS/MS identification (Rayner et al. 2020; Sears et al. 2019). One limitation of BioID is its labeling kinetics, relying on the activity of BirA over a period of hours. An improved technique called APEX represents a significant advancement, where these kinetics are reduced to < 1 millisecond by catalysing the oxidation of biotin using added hydrogen peroxide—enabling precise temporal control of labeling binding partners at a specific point in time (Rhee et al. 2013). APEX was employed by Yu et al. (2021) to identify TDP‐43 interaction partners within TDP‐43 anisosomes formed in age‐related neurodegenerative diseases (Yu et al. 2021). Another study also generated high‐confidence interactors of TDP‐43 identified using APEX in order to compare it with another proximity‐dependent biotinylation technique using biotin ligase (Schreiber et al. 2024).
While these studies provided important insights into the TDP‐43 interactome, the aim of this study was to identify a common suite of interactors in one of the most commonly employed human cell lines (human embryonic kidney HEK293) and two mouse neuronal cell lines (mouse neuroblastoma neuro2A and mouse primary neurons) and compare TDP‐43 protein interactors in the cytoplasm and the nucleus when mutated or under stress conditions. We selected the non‐neuronal HEK293 cell line for our mechanistic and interaction studies because of its high transfection efficiency, strong growth characteristics, and capacity to express recombinant proteins. These attributes were essential for our investigation into TDP‐43 interactors. Although neuro2A cells more closely mimic neuronal environments, using fundamentally different cell lines enabled us to identify common TDP‐43 interactors, reinforcing our confidence in the relevance of these interactors across three distinct cell model systems. Identified putative interactors were further examined in neuro2A cells expressing wild‐type TDP‐43 (TDP‐43WT) after oxidative stress. We also compared the protein interactions of the missense mutations G294V and A315T. In summary, we performed a cross‐analysis across multiple cell models to compile a comprehensive and high‐confidence list of TDP‐43 interactors, including novel binding partners. Our analysis provides evidence that specific proteins involved in translational and transcriptional regulation show altered affinity for TDP‐43 when mutated or under stress, conceivably contributing to neurodegeneration over time.
2. Method and Materials
2.1. Ethics Statement
All experiments were carried out in accordance with the Australian Code of Practice for the Care and Use of Animals for Scientific Purposes. Mice were housed in a specified pathogen‐free (SPF) animal facility with a 12 h light/dark cycle (lights on at 06:00 h) with the room temperature at 21°C ± 1°C and humidity maintained at 55% ± 5%. Animal experiments were conducted with approval from the Animal Ethics Committee of The University of Queensland (QBI/131/18).
2.2. Plasmids and Cloning
Expression constructs encoding wild‐type TDP‐43 fused to a C‐terminal flag‐APEX2 (TDP‐43‐APEX) or green fluorescence protein (GFP) (TDP‐43‐GFP) fluorophore were cloned into pcDNA5/FRT/TO (cat. no. V601020, Thermo Fisher Scientific). Mutations (G294V and A315T) were introduced into the plasmids by GenScript.
Expression lentiviral constructs encoding wild‐type hTDP‐43 fused to a C‐terminal DYKDDDDK(Flag)‐tag‐(GGS)×3‐linker‐APEX2 were cloned into pLenti wild‐type hTDP‐43‐mGFP reported previously (Keating et al. 2023). Synthesis of the APEX2 gene, subcloning into the pLenti‐TDP‐43 WT backbone, and mutations (G294V, A315T) to the plasmids were conducted by Genscript.
2.3. Cell Culture
We generated stably transfected cell lines, Flp‐In T‐Rex‐293 (T‐Rex, RRID:CVCL U427, cat. no. R78007, Thermo Fisher Scientific) expressing TDP‐43WT‐GFP and control GFP alone, as previously done by Rayner et al. (2020).
Neuro2A cells (RRID:CVCL_0470, cat. no. CCL‐131, ATCC) were grown and maintained in Dulbecco's modified Eagle's medium (DMEM, cat. no. 11965092, Gibco) supplemented with 10% (v/v) heat‐inactivated fetal bovine serum (FBS, cat. no. A5670801, Gibco). The stable T‐Rex cells were grown and maintained in the same conditions with the addition of 15 μg/mL blasticidin (cat. no. ant‐bl, Invivogen) and 100 μg/mL hygromycin B Gold (cat. no. ant‐hg, Invivogen). Cells were incubated in a 37°C heat‐jacked humidified incubator under a 5% CO2 atmosphere. Routine mycoplasma testing confirmed negative contamination using the MycoStrip Detection Kit (cat. no. rep‐mys, Invivogen).
In neuro2A cells, TDP‐43WT‐APEX was transiently transfected using lipofectamine 2000 (cat. no. 11668019, Invitrogen) according to the manufacturer's instructions for 24 h. Empty vector GFP was used as the negative control, similarly to a TDP‐43 BioID experiment conducted on neuro2A to eliminate any false‐positive hits (Chou et al. 2018). Expression of the TDP‐43WT‐GFP and control GFP alone was induced in T‐Rex cells by adding 0.1 μg/mL tetracycline (cat. no. T7660, Sigma) in DMEM for 24 h.
The maximum number of passages was 25 from the original cell line passage obtained from the manufacturer. The neuro2A and Flp‐In T‐Rex‐293 cell lines were purchased from ATCC and Thermo Fisher Scientific, respectively, and were not further authenticated upon receipt. In addition, these cell lines are not listed as commonly misidentified cell lines by the International Cell Line Authentication Committee (ICLAC; http://iclac.org/databases/cross‐contaminations/).
2.4. Lentivirus Production
Flag‐(GGS)x3‐APEX2 tagged lentiviral plasmids, for TDP‐43WT, disease mutants A315T and G294V and control were complexed alongside lentiviral packaging constructs Gag and Pol (pMDLg/pRRE, RRID:Addgene_12251), Rev. (pRSV‐Rev, RRID:Addgene_12253) and VSV‐G envelope (pMD2.G, RRID:Addgene_12259) in Opti‐MEM Reduced Serum Medium (cat. no. 31985088, Gibco) and introduced to HEK293T cells (RRID:CVCL_0063) using TransIT‐Lenti transfection reagent (cat. no. 6600, Mirus MIR). Viral supernatants were collected at 48 h post transfection, cleared of cell debris with centrifugation at 1500 rpm for 5 min at 4°C, and virus particles concentrated by ultracentrifugation at 25000 rpm for 2 h at 4°C (cat. no. Optima L‐100 XP, rotor cat. no. SW32Ti, Beckman) through 20% sucrose/PBS cushion (cat. no. S0389S, Sigma). Pelleted virus was resuspended overnight at 4°C in Neurobasal Medium, aliquoted, snap frozen and stored at −80°C. HEK293T cells were transduced to assess transduction efficiency of prepared lentivirus in a serial titration of virus in DMEM/F12‐10%/Polybrene‐10ug/mL (cat. no. H9268, Sigma). Cells were collected, and immunoblot and GFP imaging performed to determine optimal transduction levels.
Time‐mated female C57BL/6J mice were euthanised at 15 days by cervical dislocation, followed by embryo collection. Recovered embryos were euthanised by fetal decapitation then transferred into cold Hibernate E medium (cat. no. A1247601, Gibco) + 1% penicillin–streptomycin (cat. no. 15140122, Gibco). Cortical neuronal culture dissection and fixation were performed based on previous studies (Kaech and Banker 2006; Sahu et al. 2019). In brief, the embryonic brains were microdissected, the meninges carefully removed, and the cortical regions isolated. Biological replicates were produced from neurons isolated from pooled embryos from each pregnant dam. Comparison samples were produced in each biological replicate to compare across cultures. Cortex tissue from up to eight embryos was pooled into 1.5 mL tubes containing Hank's balanced salt solution (HBSS) (cat. no. 14170‐112, Gibco), rinsed twice with fresh HBSS, then resuspended into 270 μL of HBSS. The tissue was subsequently digested using 0.25% (v/v) trypsin (cat. no. 15090046, Gibco) and incubated at 37°C for 15 min. Trypsinisation was stopped by adding horse serum (cat. no. 26050070, Gibco) to a final concentration of 30% (v/v). DNA was then digested using 0.1% (w/v) DNase I (cat. no. DN25, Sigma), followed by incubation at 37°C for 10 min. Mechanical trituration was performed to achieve cell dissociation. The resulting cell suspension was centrifuged at room temperature for 7 min at 1500 rpm. The cell pellet was resuspended in neuronal plating medium, consisting of Neurobasal Medium (cat. no. 21103049, Gibco) supplemented with 10% (v/v) fetal bovine serum (cat. no. 10099141, Gibco), 2 mM L‐glutamine (cat. no. 25030081, Gibco) and 1% v/v penicillin/streptomycin. The medium was prepared and equilibrated overnight at 37°C in a CO2 incubator. Cell counts were conducted, and neurons were seeded in neuronal plating medium onto 24‐well plates (5 × 10⁴ cells/well) for immunohistochemistry or 10 cm (3 × 10⁶ cells/plate) for protein interaction analysis to achieve endpoint cell viability and required protein yields from a total of 8 pregnant dams or 51 embryos. The plates were precoated with poly‐L‐lysine hydrobromide (cat. no. P2636, Sigma) at a concentration of 1 mg/mL for glass coverslips or 0.1 mg/mL for plastic surfaces. Cells were incubated for 4 h at 37 °C in a CO2 incubator to promote attachment. Lentiviral transduction of neuronal cultures was performed during the media change at 4 h postplating, using neuronal maintenance medium (Neurobasal Medium supplemented with 2% (v/v) B27 supplement (cat. no. 17504044, Gibco), 2 mM L‐glutamine, and 1% v/v penicillin/streptomycin) containing lentiviral particles for either pLenti construct expressing TDP‐43WT or associated mutants. Cultures were subsequently maintained with a half‐medium exchange at DIV 3–4 prior to Biotin–APEX‐proximity labeling and cell harvest at DIV 8. Comparison samples were produced in each biological replicate to compare across cultures.
2.5. Cellular In Vivo biotin–APEX‐Proximity Labeling
Biotin–APEX‐proximity labeling was performed based on previous studies (Hung et al. 2016) in live neuro2A cells and DIV8 primary neurons expressing APEX constructs. Cultures requiring treatment to induce oxidative stress were treated with 0.5 mM sodium arsenite (NaAsO2, cat. no. S7400, Sigma) in culture media (CM) at 37°C for 1 h. To initiate biotinylation of proteins, cells were incubated in the substrate biotin phenol (cat. no. SML2135, Sigma) at a final concentration of 0.5 mM (Stock biotin phenol 500 mM) in DMSO (cat. no. D2650, Sigma) for 30 min at 37°C in CM. Biotin phenol/CM was removed and the biotinylating reaction catalysed with the addition of 1 mM hydrogen peroxide (H2O2, cat. no. 1072980500, Sigma) in CM for 1 min at room temperature (RT). H2O2 media was then removed and biotinylation halted with 3× washes in quenching solution [10 mM sodium ascorbate (cat. no. A4034, Sigma), 5 mM Trolox (cat. no. 93510, Sigma) and 10 mM sodium azide (cat. no. S2002, Sigma)]. Cells were harvested in ice‐cold PBS, pelleted at 500 rcf for 5 min at 4°C and cell pellets stored at −80°C until further analysis. Confirmation of APEX biotinylation of cellular proteins was assessed by immunoblotting.
2.6. Nuclear‐Cytoplasmic Fractionation
To separate the cytoplasmic and nuclear fractions, frozen pellets from a T75 flask were resuspended in 400 μL of low salt buffer (LSB; 20 mM HEPES pH 7.3 [cat. no. H3375, Sigma], 1 mM EDTA (cat. no. E4884, Sigma), 1 mM EGTA [cat. no. 324626, Sigma], phosphate [cat. no. 4906845001, Sigma] and protease [cat. no. 11697498001, Sigma] inhibitors) and incubated for 20 min with brief pipetting on ice. The mixture was then centrifuged at 14000 rcf for 1 min at 4°C. The supernatant was collected and centrifuged again at 14000 rcf for 1 min at 4°C to obtain the clarified cytoplasmic fraction. The pellets from the first centrifugation step were rinsed with 500 μL LSB and centrifuged at 14000 rcf for 1 min at 4°C. This washing step was repeated twice more. The pellets were resuspended in 200 μL RIPA buffer (50 mM Tris–HCl pH 7.4 [cat. no. 10812846001, Sigma], 1% Nonidet P‐40 [cat. no. 74385, Sigma], 0.25% Na‐deoxycholate [cat. no. D6750, Sigma], 150 mM NaCl [cat. no. S9888, Sigma], 1 mM EDTA, phosphate and protease inhibitors) and incubated for 30 min on ice. The samples were sonicated for 10 s on Setting 3 (Sonic Ruptor 250, Omni International), then centrifuged at 14000 rcf for 20 min at 4°C. The supernatant was transferred to a new tube. Protein concentration in the cytoplasmic and nucleic fractions were determined using the Pierce BCA protein quantification kit (cat. no. 23225, Thermo Fisher Scientific).
2.7. Total Cell Lysis
For global proteomics and for immunoprecipitation, frozen pellets were resuspended in NP‐40 lysis buffer (Tris‐buffered saline [TBS], 1% (v/v) Nonidet P‐40, 2 mM EDTA, phosphate and protease inhibitors). After vortexing, cells were probe sonicated for 10 s on Setting 3 (Sonic Ruptor 250, Omni International). To remove cell debris, the cell lysates were centrifuged at 14 000 rcf for 15 min at 4°C. Protein concentration was determined using the Pierce BCA protein quantification kit (cat. no. 23225, Thermo Fisher Scientific).
2.8. Streptavidin Pulldown and Immunoprecipitation
Streptavidin pulldown was performed on equal amounts of cellular protein by incubation at 4°C with 20 μL of streptavidin‐coated magnetic beads (cat. no. 88816, Thermo Fisher Scientific) overnight. Beads were washed twice in RIPA buffer, once with 1 M KCl (cat. no. P3911, Sigma), once with 0.1 M Na2CO3 (cat. no. 223530, Sigma), once with 2 M urea (cat. no. U5128, Sigma) in 10 mM Tris–HCl pH 8.0 and twice with RIPA buffer on a magnetic rack.
Immunoprecipitation was performed on 500 μg of whole cell protein lysate by incubation at 4°C with 20 μL of GFP magnetic beads (cat. no. gtma, Chromotek) for 1 h. GFP beads were washed three times in 1 mL NP‐40 lysis buffer on a magnetic rack.
Finally, beads were boiled at 95°C for 10 min in 1× loading buffer (cat. no. 1610747, BioRad) containing 1× reducing reagent (cat. no. NP0004, Invitrogen). Approximately 20% of the eluate was used for validation by immunoblotting.
2.9. In‐Gel Trypsin Digestion
The remaining 80% of the eluted proteins and 20 μg of initial protein lysates were subject to in‐gel digestion following the protocol (Cheng et al. 2021). In short, the proteins were run 1‐3 cm into a 4%–12% SDS‐PAGE gel (cat. no. WG1402BOX, Invitrogen) and excised from the gel into three fractions for whole cell lysate global proteomics or into a single fraction for IP or streptavidin pulldown samples. Proteins were reduced and alkylated with 10 mM dithiothreitol (cat. no. D0632, Sigma) and 55 mM iodoacetamide (cat. no. I1149, Sigma), respectively, and digested with trypsin (1:50, enzyme: protein) (cat. no. 90057, Thermo Fisher Scientific) overnight at 37°C. The digestion was inactivated by the addition of formic acid (FA, cat. no. 5330020050, Sigma) to a final concentration of 1%. Tryptic peptides were desalted on a preequilibrated C18 Omix tip (cat. no. A57003100K, Agilent) and eluted in 50% (v/v) acetonitrile (ACN, cat. no. 1000292500), 0.1% (v/v) FA, and dried under vacuum centrifugation. The peptides were resuspended in 0.1% FA, bath sonicated for 15 min and centrifuged at 14000 rcf for 15 min at 4°C to remove any insoluble debris. The clarified peptides were transferred into glass vials for liquid chromatography–tandem mass spectrometry (LC–MS/MS) analysis.
2.10. Reverse Phase Liquid Chromatography–Tandem Mass Spectrometry (LC–MS/MS)
The tryptic peptides were separated on an Ultimate 3000 nano‐LC (Thermo Fisher Scientific), fitted with the Acclaim PepMap C18 reversed‐phase column (15 cm length, 75 μm diameter and 2 μm particle size, cat. no. 164534, Thermo Fisher Scientific) and eluted with a linear gradient from 2% to 80% ACN containing 0.1% (FA) for 60 min. Eluted peptides were subsequently ionised into the Q‐Exactive Plus mass spectrometer (Thermo Fisher Scientific). Precursor ions were selected for MS/MS fragmentation using a data‐dependent ‘Top 10’ method operating in Fourier transform (FT) acquisition mode with higher‐energy C‐trap dissociation (HCD) fragmentation. FT‐MS analysis on the Q‐Exactive Plus was carried out at 70 000 resolutions and an automated gain control (AGC) target of 3 × 10⁶ ions in full MS. MS/MS scans were carried out at 17 500 resolutions with an AGC target of 2 × 10⁵ ions. Maximum injection times are set to 50 and 45 ms, respectively. The charge exclusion was set to unassigned and 1+ charged state with a dynamic exclusion of 20 s. The ion selection threshold for triggering MS/MS fragmentation was set to 44 000 counts, and an isolation width of 2.0 m/z was used to perform HCD fragmentation with a normalised collision energy of 27.
2.11. Data Analysis
Raw spectra files were processed using the Proteome Discoverer software 2.2 (Thermo Fisher Scientific) incorporating the SEQUEST search algorithm. Peptide identifications were determined using a 20‐ppm precursor ion tolerance and a 0.1‐Da MS/MS fragment ion tolerance for FT‐MS and HCD fragmentation. Carbamidomethylation modification (+57.021 Da) of cysteines was considered a static modification while oxidation (+15.995 Da) of methionine, biotin (+226.078 Da) of lysine and acetyl (+42.011 Da) modification on N‐terminal residues were set as variable modifications allowing for a maximum of two missed cleavages. The data were processed through Percolator to estimate false discovery rates (FDR). Protein identifications were validated employing a q‐value of 0.01. Label‐free quantitation (LFQ) using intensity‐based quantification was carried out according to default parameter settings in the Proteome Discoverer 2.2 software. Briefly, peptide spectral matches (PSM) were filtered using a maximum delta Cn of 0.05, rank of 0, and delta mass of 0 ppm. PSMs and peptides were validated using a strict FDR for PSMs of 0.01 and 0.05 for a relaxed FDR, respectively. Peptides shorter than six amino acids were filtered out. PSMs were chromatographically aligned for each input file in a sample set with a mass tolerance of 10 ppm and a maximum retention time shift of 10 min. Peptide groups used for protein quantification were analysed using the default parameters which set a peptide as unique if it is included in only one protein group. The quantification was processed using unique and razor peptides (peptides shared among multiple proteins group or proteins) with the precursor abundance based on the intensity. Protein abundance was calculated as a sum of the individual peptide group abundances, and the ratio was based on a pairwise ratio using a geometric median of the peptide group ratios. A student t‐test was used for the hypothesis test and used the background population of ratios for all peptides and proteins to determine whether any given single peptide or protein is significantly changing relative to that background, and the p‐value was adjusted using Benjamini–Hochberg correction. The MS proteomics data have been deposited to the ProteomeXchange Consortium via the PRIDE (Perez‐Riverol et al. 2022) partner repository with the dataset identifier PXD054023 and 10.6019/PXD054023.
2.12. Immunoblotting
Confirmation of APEX biotinylation of cellular proteins was assessed by immunoblotting of 1% NP‐40 cytosol extracts. Equal amounts of protein were loaded onto a 4%–12% or 10% Bis‐Tris SDS‐PAGE gel. The separated proteins were then transferred onto a nitrocellulose membrane (cat. no. 88018, Thermo Fisher Scientific) using a Bio‐Rad Trans‐blot Turbo semi‐dry transfer cell (Settings: 2.5 A, 25 V, 10 min) or Mini Trans‐Blot Cell (Settings: 100 V, 60 min) in transfer buffer (300 mM Tris pH 9.0, 300 mM Glycine [cat. no. G7126, Sigma], 0.05% SDS [cat. no. 436143, Sigma], 20% Methanol [cat. no. 179957, Sigma]). The membrane was blocked with 3% bovine serum albumin (BSA, cat. no. A4737, Sigma) in tris‐buffered saline containing Tween‐20 (TBST, cat. no. P1379, Sigma) for 30 min. Subsequently, the membrane was incubated with primary antibodies overnight at 4°C or 1 h at RT. The primary antibodies used in this study were IRDye‐800‐Streptavidin (1:1000 dilution, cat. no. 926‐32230, LI‐COR Biosciences), anti‐GFP (1:1000 dilution, RRID:AB_259941), NSUN2 (1:500, RRID:AB_10670532), anti‐EFTUD2 (1:1000 dilution, RRID:AB_2095834) and anti‐HNRNPM (1:1000 dilution, RRID:AB_2880673).
Following the primary antibody incubation, the membrane was washed 3 × 10 min with TBST. Then, either fluorescently labelled IRDye 800CW Goat Anti‐Rabbit IgG Secondary Antibody (1:10000 dilution, RRID:AB_2651127) or IRDye 680RD Goat anti‐Mouse IgG Secondary Antibody (1:10000 dilution, RRID:AB_2651128) was applied to the membrane for 30 min at RT, depending on the primary antibody used. Finally, the immunoblots were imaged using a LI‐COR Biosciences Odyssey CLx imaging system at the appropriate wavelength.
2.13. Immunocytochemistry
Immunocytochemistry was performed on 4% Paraformaldehyde (PFA, cat. no. 15710, Electron Microscopy Sciences) fixed APEX biotinylated DIV8 cultures and neuro2A cells plated to coverslips. Fixed cells were permeabilised using 0.2% Triton X‐100 in 1X PBS for 10 min, washed with 1X PBS and blocked in 5% normal goat serum in 1X PBS for 60 min. The cells were stained for Flag (RRID:AB_262044), NSUN2 (1:500, RRID:AB_10670532), Streptavidin (cat. no. S112233, Thermo Fisher Scientific), Alexa Fluor 488 conjugate antibody (antimouse, RRID:AB_141607), Alexa Fluor 594 conjugate antibody (antimouse, RRID:AB_2535789 or antirabbit, RRID:AB_141637) and MAP2 (polyclonal antibody 17 028, gifted from Professor Virginia Lee, University of Pennsylvania), DAPI (cat. no. 62247, Thermo Fisher Scientific) for nuclei visualisation and imaged using confocal microscopy (cat. no. LSM510, Zeiss or cat. no. LSM880, Zeiss).
2.14. Colocalisation Analysis
For image analysis, Fiji (ImageJ) was used to establish macros to process each channel and generate masks and regions of interest (ROI) across replicates. Channels were split and processed using the maximum, median and mean filters, convoluted background subtraction, and watershed irregular feature function. Masks were then generated through Li thresholding to obtain cell body and nuclear regions from the green and blue channel, respectively. These regions were used to create nuclear ROIs of transfected cells which were subsequently analysed for colocalisation. The Coloc2 module of Fiji (ImageJ) was used to compute pixel intensity‐based colocalisation through Manders' correlation, following Costes threshold regression. The resulting thresholded Manders' coefficients were plotted using GraphPad Prism and statistically analysed using a nonparametric t‐test with a Kolmogorov–Smirnov posttest to compare cumulative distribution.
3. Results
3.1. Identification of 58 Putative Interaction Partners of TDP‐43WT
To compare TDP‐43 interactors between different cell lines, we first performed global proteomics on lysates from mouse and human cell lines expressing TDP‐43WT. We used two cell lines, neuroblastoma (neuro2A) cells that were transiently transfected with TDP‐43WT‐APEX and human kidney Flp‐In T‐Rex‐293 (T‐Rex) cells that were treated with 0.1 μg/mL of tetracycline to induce expression of TDP‐43WT‐GFP (Figure 1). At 24 h post‐transfection/induction, APEX‐proximity labeling was performed in neuro2A, and cells were harvested, lysed and analysed using LC–MS/MS. Raw files were searched using Proteome discoverer 2.2 (Thermo Fisher Scientific) and protein identifications were filtered with FDR confidence equal to ‘high’ (q‐value < 0.01) for subsequent analysis (Tables S1 and S2). Proteomics analysis identified 5292 proteins in neuro2A and 4080 proteins in T‐Rex cell lysates. 2043 proteins (38.6%) were unique to neuro2A, 831 (20.4%) proteins were unique to T‐Rex, and 3,249 proteins were shared between the two cell lines (Table S3).
FIGURE 1.

Schematic illustrating the workflow used in this study. Traditional immunoprecipitation coupled with LC–MS/MS was performed in T‐Rex cells stably expressing human TDP‐43WT to identify its in vitro interactome. Interactors were validated in neuro2A cells using Biotin–APEX‐proximity labeling coupled with LC–MS/MS.
To characterise TDP‐43 interactome, neuro2A cells were transiently transfected with either TDP‐43WT‐APEX or GFP only (empty) control for 24 h. APEX biotinylation was performed before harvesting the cells. Nuclear and cytoplasmic fractions of neuro2A cells were separated, and streptavidin pulldowns were done on each fraction before subjecting them to LC–MS/MS analysis (Tables S5 and S6). Using the same filtering criteria (q‐value < 0.01) with the addition of a ratio cut‐off (TDP‐43WT/Control) higher or equal to 1.5, we identified 435 putative interactors with TDP‐43WT‐APEX in neuro2A cells, with 294 and 141 proteins uniquely found in the nuclear and cytoplasmic fractions respectively, and 25 proteins shared between the two cellular compartments (Figure 2A blue and orange circles).
FIGURE 2.
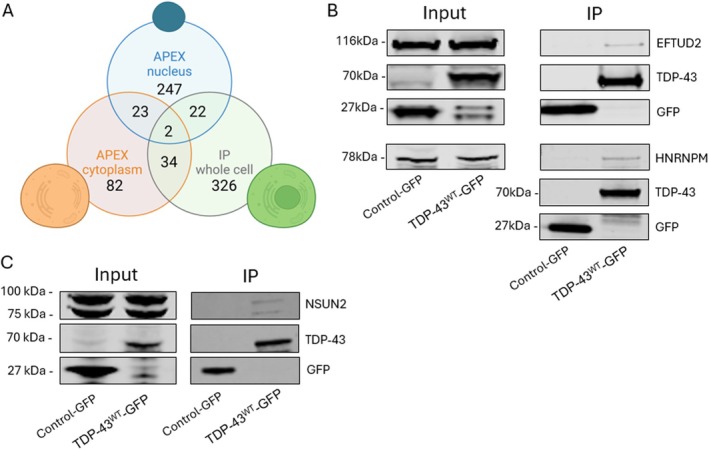
(A) Venn diagram showing the number of proteins found and common interactors between mouse neuro2A (n = 4) and human T‐Rex cells (n = 3) expressing TDP‐43WT and control in the cytoplasmic and nuclear compartments. (B) Western blot analysis representing the IP eluted proteins from T‐Rex cells expressing TDP‐43WT‐GFP and control GFP. This shows EFTUD2 and HNRNPM as binding partners of TDP‐43, which do not immunoprecipitate with the GFP control. (C) Western blot representing the IP eluted proteins from neuro2A cell expressing TDP‐43WT‐GFP and control GFP. We show the binding of NSUN2 with TDP‐43, which does not immunoprecipitate with the GFP control.
Even though APEX labeling has a small labeling radius (< 20 nm) (Bendayan 2001; Mayer and Bendayan 1997), proteins in close proximity are not necessarily direct interactors of the protein of interest, with one reason being due to molecular crowding in the cellular environment. To eliminate false positive TDP‐43WT interactors, we next performed IP on the same T‐Rex cell lysates used for global proteomics (Figure 1) and compared the resulting dataset with the one obtained from the APEX‐proximity labeling on neuro2A cells . T‐Rex cells were treated with 0.1 μg/mL tetracycline in DMEM for 24 h to induce expression of either TDP‐43WT‐GFP or the GFP only (empty) control. Cells were harvested and GFP IP was performed on the lysates. Eluted proteins were processed for proteomics and analysed using LC–MS/MS (Table S4). We identified 384 proteins that were found to interact with TDP‐43WT‐GFP in T‐Rex cells using the same high‐confidence filtering criteria as mentioned above (Figure 2A green circle).
Both dataset generated using IP from T‐Rex cells and streptavidin pulldown from neuro2A cells were compared, and between these two datasets, 58 putative interactors were found to be in common (Figure 2A, Table 1). From those 58 proteins, we validated EFTUD2 and HNRNPM by immunoblotting in the T‐Rex lysates (Figure 2B) and NSUN2 in lysates from neuro2A cells transiently expressing TDP43WT‐GFP or the GFP only control (Figure 2C).
TABLE 1.
TDP‐43 putative interactors, found in both IP and biotin–APEX labeling in T‐Rex and neuro2A cells expressing TDP‐43WT.
| Gene symbol | Protein name | Nuclear | Cytoplasmic | Reference |
|---|---|---|---|---|
| ALDH1B1 | Aldehyde dehydrogenase X, mitochondrial | Yes | No | |
| ATP5ME | ATP synthase subunit e, mitochondrial | Yes | No | |
| CAPZA1 | F‐Actin‐capping protein subunit alpha‐1 | Yes | No | |
| DYNC1I2 | Cytoplasmic dynein 1 intermediate chain 2 | Yes | No | (Feneberg et al. 2020) |
| EFTUD2 | 116 kDa U5 small nuclear ribonucleoprotein component | Yes | No | Freibaum et al. (2010), Blokhuis et al. (2016), Chou et al. (2018) |
| GRSF1 | G‐rich sequence factor 1 | Yes | No | Freibaum et al. (2010) |
| HNRNPD | Heterogeneous nuclear ribonucleoprotein D0 | Yes | No | Freibaum et al. (2010), Blokhuis et al. (2016), Feneberg et al. (2020), Schreiber et al. (2024), Chou et al. (2018) |
| HNRNPDL | Heterogeneous nuclear ribonucleoprotein D‐like | Yes | No | Freibaum et al. (2010), Schreiber et al. (2024), Chou et al. (2018) |
| LRRC47 | Leucine‐rich repeat‐containing protein 47 | Yes | No | |
| NDUFA10 | NADH dehydrogenase (ubiquinone) 1 alpha subcomplex subunit 10, mitochondrial | Yes | No | |
| PABPC1 | Polyadenylate‐binding protein 1 | Yes | No | Freibaum et al. (2010), Blokhuis et al. (2016), Feneberg et al. (2020), Riemenschneider et al. (2021) |
| PCNA | Proliferating cell nuclear antigen | Yes | No | Feneberg et al. (2020) |
| PSMC2 | 26S proteasome regulatory subunit 7 | Yes | No | Riemenschneider et al. (2021) |
| PTCD3 | pentatricopeptide repeat domain‐containing protein 3, mitochondrial | Yes | No | |
| RAB21 | Ras‐related protein Rab‐21 | Yes | No | |
| RPL32 | 60S ribosomal protein L32 | Yes | No | Freibaum et al. (2010) |
| SF3B1 | splicing factor 3B subunit 1 | Yes | No | Blokhuis et al. (2016), Chou et al. (2018) |
| SLC25A3 | Phosphate carrier protein, mitochondrial | Yes | No | Feneberg et al. (2020) |
| TMX1 | Thioredoxin‐related transmembrane protein 1 | Yes | No | |
| TP53 | Cellular tumour antigen p53 | Yes | No | |
| TRMT2A | tRNA (uracil‐5‐)‐methyltransferase homologue A | Yes | No | |
| YLPM1 | YLP motif‐containing protein 1 | Yes | No | Schreiber et al. (2024), Chou et al. (2018) |
| EIF4A1 | Eukaryotic initiation factor 4A‐I | Yes | Yes | Freibaum et al. (2010), Blokhuis et al. (2016), Feneberg et al. (2020) |
| TARDBP | TAR DNA‐binding protein 43 | Yes | Yes | Freibaum et al. (2010), Schreiber et al. (2024), Chou et al. (2018) |
| ACLY | ATP‐citrate synthase | No | Yes | Feneberg et al. (2020) |
| ALDH16A1 | Aldehyde dehydrogenase family 16 member A1 | No | Yes | |
| ARHGEF2 | Rho guanine nucleotide exchange factor 2 | No | Yes | |
| COPG1 | Coatomer subunit gamma‐1 | No | Yes | Chou et al. (2018) |
| EEF1D | Elongation factor 1‐delta | No | Yes | Feneberg et al. (2020) |
| EIF4G1 | Eukaryotic translation initiation factor 4 gamma 1 | No | Yes | Freibaum et al. (2010), Blokhuis et al. (2016), Chou et al. (2018) |
| EPRS1 | Bifunctional glutamate/proline–tRNA ligase | No | Yes | |
| FUS | RNA‐binding protein FUS | No | Yes | Freibaum et al. (2010), Schreiber et al. (2024) |
| GPHN | Gephyrin | No | Yes | |
| HNRNPF | Heterogeneous nuclear ribonucleoprotein F | No | Yes | Blokhuis et al. (2016), Schreiber et al. (2024) |
| HNRNPM | Heterogeneous nuclear ribonucleoprotein M | No | Yes | Freibaum et al. (2010), Blokhuis et al. (2016), Feneberg et al. (2020), Schreiber et al. (2024), Chou et al. (2018) |
| HNRNPU | Heterogeneous nuclear ribonucleoprotein U | No | Yes | Freibaum et al. (2010), Blokhuis et al. (2016), Schreiber et al. (2024) |
| MAP1B | Microtubule‐associated protein 1B | No | Yes | Freibaum et al. (2010) |
| MCM6 | DNA replication licencing factor MCM6 | No | Yes | |
| MCM7 | DNA replication licencing factor MCM7 | No | Yes | Feneberg et al. (2020), Schreiber et al. (2024) |
| NSUN2 | tRNA (Cytosine(34)‐C(5))‐methyltransferase | No | Yes | |
| PFKP | ATP‐dependent 6‐phosphofructokinase, platelet type | No | Yes | Chou et al. (2018) |
| PSMC3 | 26S proteasome regulatory subunit 6A | No | Yes | Riemenschneider et al. (2021) |
| PSMC6 | 26S proteasome regulatory subunit 10B | No | Yes | Riemenschneider et al. (2021) |
| PSME3 | Proteasome activator complex subunit 3 | No | Yes | |
| RANBP1 | Ran‐specific GTPase‐activating protein | No | Yes | Feneberg et al. (2020) |
| RARS1 | Arginine–tRNA ligase, cytoplasmic | No | Yes | |
| RPL12 | 60S ribosomal protein L12 | No | Yes | Freibaum et al. (2010) |
| RPL4 | 60S ribosomal protein L4 | No | Yes | Freibaum et al. (2010), Feneberg et al. (2020) |
| RPL6 | 60S ribosomal protein L6 | No | Yes | Freibaum et al. (2010), Feneberg et al. (2020) |
| RPS16 | 40S ribosomal protein S16 | No | Yes | Freibaum et al. (2010), Blokhuis et al. (2016), Feneberg et al. (2020) |
| RPS17 | 40S ribosomal protein S17 | No | Yes | Freibaum et al. (2010), Blokhuis et al. (2016) |
| RPSA | 40S ribosomal protein SA | No | Yes | Freibaum et al. (2010), Blokhuis et al. (2016) |
| RUVBL1 | RuvB‐like 1 | No | Yes | Chou et al. (2018) |
| SQSTM1 | Sequestosome‐1 | No | Yes | Tanji et al. (2012) |
| TCP1 | T‐complex protein 1 subunit alpha | No | Yes | Chou et al. (2018) |
| TRAP1 | Heat shock protein 75 kDa, mitochondrial | No | Yes | |
| TRIM28 | Transcription intermediary factor 1‐beta | No | Yes | Freibaum et al. (2010), Chou et al. (2018) |
| VARS1 | Valine–tRNA ligase | No | Yes |
Note: Novel interactors are written in red, green highlights proteins only found in the nucleus, yellow shows protein only found in the cytoplasm, and blue are the proteins found in both nucleus and cytoplasm.
To further interrogate the common 58 putative interactors of TDP‐43 found in both cell lines using the traditional IP and biotin–APEX labeling methods, the proteins were subjected to Gene Ontology (GO) annotation using PANTHER.db (Figure 3). Most proteins were found to be classified as translational proteins (PC00263), RNA metabolism proteins (PC00031) and protein modifying enzymes (PC00260). 34 out of 58 proteins belong to a protein‐containing complex (GO:0032991) such as a ribonucleoprotein complex (12 proteins, GO:1990904), a catalytic complex (12 proteins, GO:1902494) and an intracellular protein‐containing complex (7 proteins, GO:0140535). 32 out of 58 can bind to organic cyclic compounds (GO:0097159) or proteins (GO:0005515) and a few pathways were assigned to those putative interactors, with the main one being Huntington disease (DYNC1I2 and TP53, P00029) and 5‐hydroxytryptamine degradation (ALDH16A1 and ALDH1B1, P04372).
FIGURE 3.

Gene Oncology annotation of the 58 putative interactors of TDP‐43 found in both T‐Rex and neuro2A cells using two different methods (IP and biotin–APEX labeling). Proteins annotated by protein class (left), molecular function (top right) and pathway (bottom right). Novel putative TDP‐43 interactors found in this study are highlighted in red. Proteins with no PANTHER category assigned are excluded.
Finally, we compared the proteins found in previous TDP‐43 interactome studies (Blokhuis et al. 2016; Chou et al. 2018; Evangelista et al. 2023; Feneberg et al. 2020; Freibaum et al. 2010; Riemenschneider et al. 2021) to our list and identified 20 previously unreported interactors of TDP‐43 (Table 1—highlighted in red).
3.2. The TDP‐43WT Interactome Changes Under Oxidative Stress Conditions
Given the incomplete understanding of the temporal changes of TDP‐43 interaction partners, we next aimed to explore how an induced stressor alters the TDP‐43 interactome in the nucleus and the cytoplasm. We overexpressed TDP‐43WT‐APEX in neuro2A cells for 24 h and treated the cells with an oxidative stressor, 0.5 mM of NaAsO2 for 1 h to induce TDP‐43 aggregation. As shown in Figure 4A, upon exposure to sodium arsenite treatment, TDP‐43WT formed condensate/aggregate‐like structures. While we have not further characterised these TDP‐43 clusters, for the purpose of this manuscript, we refer to them as condensates. Proteins in close proximity to TDP‐43 were biotinylated and nuclear‐cytoplasmic fractionation was performed on the harvested cells (Figure 4B). Biotinylated proteins were enriched using streptavidin‐coated magnetic beads (Figure 4C) and eluted proteins were analysed using LC–MS/MS. We applied the same protein identification filtering criteria (as above) to obtain a refined list of TDP‐43WT interactors upon acute oxidative stress (Tables S7 and S8).
FIGURE 4.

(A) Immunofluorescence images of neuro2A cells expressing TDP‐43WT‐GFP or GFP control stained with DAPI (blue) and NSUN2 to assess colocalisation with TDP‐43WT‐GFP or GFP control. UNT represents vehicle control and SA represents 0.5 mM NaAsO2 treatment for 1 h to induce TDP‐43 aggregation in the nucleus. All images were acquired through confocal microscopy at 100× magnification. (B) Western blot representing the initial lysates of neuro2A cells expressing a vector control or TDP‐43WT‐Flag‐APEX untreated or treated with 0.5 mM NaAsO2 (SA). Immunoblotted with anti‐Lamin B1 (nuclear marker), anti‐Flag for TDP‐43WT‐Flag‐APEX and anti‐Tubulin (cytoplasmic marker) antibodies. (C) Western blot probed with streptavidin antibody showing the biotinylation profile of the cytoplasmic and nuclear fractions from neuro2A cells expressing TDP‐43WT‐APEX untreated (UNT) or treated with 0.5 mM NaAsO2 (SA). (C—cytoplasmic fraction, N—nuclear fraction, SP—streptavidin pulled down proteins). (D) Mean ± standard deviation of thresholded Manders coefficient over neuro2A cells untreated (UNT) or treated with 0.5 mM NaAsO2 for 1 h (SA), in the presence of GFP control or TDP‐43WT‐GFP. Statistical analysis: Kolmogorov–Smirnov t‐test, n = 3, D‐statistic = 0.5, ****p < 0.0001.
From the 714 proteins found specifically in the nucleus, we identified 18 putative interactors that were differentially bound (either ≥ 1.5‐ or ≤ −1.5‐fold) to TDP‐43WT during oxidative stress. PTCD3, PFKP, COPG1, PABPC1, NDUFA10 and TRAP1 were found to bind less (≤ −1.5‐fold) to TDP‐43,WT while MCM6, RAB21, EFTUD2, PSMC2, NSUN2, HNRNPDL, ALDH1B1, RPL32, SF3B1, MCM7, RANBP1 and TDP‐43 itself were found to bind more (≥ 1.5‐fold) to TDP‐43WT. In the cytoplasmic fraction, when treated with sodium arsenite, 868 proteins were identified to change their level of interaction with TDP‐43WT. From those proteins, putative interactors such as HNRNPD, TRIM28, RANBP1, TP53, SQSTM1, HNRNPU, HNRNPF and HNRNPM were found to lose binding to TDP‐43WT.
We conducted microscopy to assess the interaction between NSUN2 and TDP‐43WT‐GFP in neuro2A cells upon oxidative stress. Under normal conditions, no statistically significant difference in colocalisation between NSUN2 and the GFP control, or NSUN2 and TDP‐43WT‐GFP, was observed. However, after oxidative stress, there was a statistically significant increase in interaction between NSUN2 and TDP‐43WT‐GFP compared to the GFP control (Figure 4D). Given the advantages of APEX‐proximity labeling and IP, which can capture transient and low‐affinity protein–protein interactions, we speculate that immunocytochemistry using a confocal microscopy approach may not capture the same interaction given the time and transient nature of these protein–protein interactions. Nevertheless, immunofluorescence microscopy confirmed the enhanced interaction between NSUN2 and TDP‐43WT‐GFP, validating the same observation as APEX‐proximity labeling.
3.3. Arsenite Treatment Alters TDP‐43 Interactions and Induces Specific Cell Signaling Pathways
To determine whether the change of TDP‐43 interactome affected by acute oxidative stress is due to differential expression of proteins, we performed quantitative label‐free LC–MS/MS on neuro2A cells expressing TDP‐43WT‐APEX treated with or without NaAsO2. In total, we identified 5629 proteins (q‐value < 0.01) (Table S9), of which 206 dysregulated proteins (protein abundance cut‐off of ≤ −2‐ or ≥ 2‐fold with an adjusted p‐value < 0.05). From the 25 proteins found to bind TDP‐43WT differently when exposed to sodium arsenite treatment, none of them were found to be dysregulated (Table S9). This suggests to us that the loss or gain of interaction with TDP‐43WT is oxidative stress‐dependent and not expression dependent.
Of the 206 dysregulated proteins, we further analysed them by Ingenuity Pathway Analysis (IPA, Qiagen) and 113 were found downregulated and 93 upregulated in response to acute oxidative stress with NaAsO2. Based on this information, IPA predicted that pathway regulations, such as mitochondrial dysfunction and activation of the ribonucleotide reductase signalling pathway (Figure 5), are driven by significant changes in proteins associated with the intrinsic apoptosis pathways and ROS accumulation (Figure S1). This IPA analysis predicted pathways such as p38 MAPK and JNK activation that have been previously reported (Namgung and Xia 2000) that contribute to the activation of apoptosis (Figure S1).
FIGURE 5.

Ingenuity pathway analysis of the label‐free global proteomics on neuro2A cells expressing TDP‐43WT‐APEX treated with 0.5 mM NaAsO2 for 1 h revealed activation of the intrinsic pathway of apoptosis and ROS accumulation.
3.4. Mutations in the C‐Terminal Domain Affect TDP‐43 Binding With Putative Interactors
TARDBP missense mutations in ALS are commonly found to cluster in the glycine‐rich C‐terminal domain, which is a necessary domain for protein–protein interactions, including HNRNPs, as well as liquid–liquid phase separation (Conicella et al. 2016; Li et al. 2018; Scherer et al. 2024). To evaluate whether mutations in this region affected the interaction of specific proteins (and potentially downstream processes), we next transiently transfected neuro2A cells with TDP‐43WT, TDP‐43G294V and TDP‐43A315T‐APEX for 24 h. The TDP‐43G294V mutation is found in both sALS and fALS patient cases, while the TDP‐43A315T mutation is mostly found in fALS patient cases. After performing APEX biotinylation, the nuclear and cytoplasmic fractions were separated, followed by streptavidin pulldowns and LC–MS/MS analysis (Tables S10 and S11). Using the same filtering criteria as described above, we focused solely on the putative TDP‐43WT interactors and high‐confidence proteins with an abundance ratio (TDP‐43mutant/TDP‐43WT) equal or higher than 1.5‐fold (binding more to mutant TDP‐43) or equal or lower than −1.5‐fold (binding less to mutant TDP‐43).
To assess TDP‐43 mutants protein interactors in the subcellular locations, we compared our above identified TDP‐43WT putative interactors with this new list of interactors. Out of the 58 previously identified putative interactors, 19 proteins were found to have a higher binding affinity to TDP‐43G294V in the cytoplasm (Figure 6). These proteins include PABPC1, LRRC47, PCNA, RANBP1, EIF4G1, RUVBL1, ACLY, PSME3, RPS16, PSMC2, VARS1, MCM7, RPL6, EPRS1, HNRNPU, RPSA, RARS1, FUS and NSUN2. For TDP‐43A315T, 6 proteins (PCNA, FUS, RANBP1, RPS16, PSMC2 and RPL6) demonstrated increased binding in the cytoplasm, while 8 proteins (PFKP, HNRNPF, EIF4A1, RUVBL1, COPG1, PSMC6, HNRNPM and NSUN2) showed decreased binding in the cytoplasm.
FIGURE 6.

Venn diagram showing mutant TDP‐43A315T and TDP‐43G294V interactomes in primary mouse neurons (n = 3) and neuro2A (n = 4). Proteins in red or green present weaker or stronger affinity to TDP‐43. Underlined are proteins that were consistently altered for both mutations in either primary mouse neurons or Neuro2A cells.
In the nucleus of neuro2A cells, TRMT2A, DYNC1I2 and HNRNPDL were found to bind more to TDP‐43G294V, while PCNA, PSMC2, TMX1 and RPS16 showed less binding. PFKP exhibited increased binding to TDP‐43A315T in the nucleus, whereas PSMC2, PABPC1, CAPZA1, GRSF1 and TMX1 showed decreased binding in the nucleus.
To validate this data, we performed the same proteomic analysis for mouse primary neurons expressing TDP‐43WT, TDP‐43G294V and TDP‐43A315T‐APEX (lentiviral transduction; Tables S12 and S13). Transduction of TDP‐43WT and TDP‐43G294V‐APEX was confirmed using immunofluorescence (Figure 7A,C) and biotinylation labeling was validated using western blot (Figure 7B). The presence of a strong streptavidin staining in FLAG‐negative cells shown in Figure 7A is possibly due to nonspecific binding of streptavidin to other molecules or structures of the cells or endogenous biotinylated proteins leading to false positives, as previously reported (Mount and Cooper 2001). The false‐positive hits were eliminated using a negative control (EV‐GFP) and by cross‐comparing with a different protein–protein interaction technique such as immunoprecipitation, as described in the method section.
FIGURE 7.

(A) Immunofluorescence of primary cortical neurons transduced with TDP‐43 WT–Flag‐APEX and stained with Flag to detect TDP‐43 WT–Flag‐APEX, Streptavidin for biotin detection and DAPI (blue) for nuclei visualisation (B) Western blot showing the biotinylation profile of the cytosolic extract from primary neuronal culture transduced with TDP‐43WT‐Flag‐APEX or GFP as control (C) Immunofluorescence of mouse primary neuronal cells transduced with TDP‐43WT‐ and G294V‐APEX and stained with MAP2‐594 for neuron‐specific cytoskeletal visualisation, Flag to detect TDP‐43 –Flag‐APEX and DAPI (Blue) for nuclei visualisation.
Of the 58 putative interactors identified previously, in the cytoplasm, 4 proteins (TCP1, EPRS1, HNRNPU and PABPC1) were found to be binding more to TDP‐43G294V in mouse primary neurons, and 6 proteins (GPHN, ACLY, HNRNPM, EIF4A1, HNRNPD and TRIM28) were found to bind less to TDP‐43G294V in the cytoplasm (Table S14 and Figure 6). A similar pattern was found for HNRNPU, EPRS1 and PABPC1 in neuro2A cells. 2 proteins were found to bind more to TDP‐43A315T in the cytoplasm (HNRNPF and EPRS1) with 5 proteins (GPHN, EIF4A1, HNRNPD, HNRNPM and TRIM28) binding less to TDP‐43 in the cytoplasm. EIF4A1 and HNRNPM were also found to bind less to TDP‐43A315T in neuro2A cells.
In the nucleus of mouse primary neurons, eight of these proteins (PTCD3, RANBP1, RPSA, TCP1, PSMC6, DYNC1I2, COPG1 and ACLY) were found to bind more to TDP‐43G294V and eight proteins (NDUFA10, RPL6, HNRNPU, HNRNPF, RPL4, ATP5ME, RPS17 and RPS16) bound less to TDP‐43G294V in the nucleus. A similar pattern was found with DYNC1I2 and RPS16 in neuro2A cells. Seven proteins (YLPM1, RANBP1, EIF4A1, PSMC6, ACLY, HNRNPDL and DYNC1I2) had enhanced binding to TDP‐43A315T in the nucleus, while seven other proteins (NDUFA10, RPS17, RPS16, RPL6, GPHN, RUVBL1 and RPL4) showed weaker interactions with TDP‐43A315T.
3.5. Mutating the Nuclear Localisation Signal of TDP‐43 Reveals Different TDP‐43 Interactome Profile
In addition to looking at the two missense ALS‐linked mutations G294V and A315T, we also analysed the interactome of an NLS mutated form of TDP‐43 which mimics the mislocalisation of TDP‐43. TDP‐43ΔNLS‐APEX was transfected in neuro2A cells for 24 h. APEX biotinylation was performed followed by nuclear‐cytoplasmic fractionation on the harvested cells. Biotinylated proteins were enriched using streptavidin‐coated magnetic beads for each fraction and eluted proteins were analysed using LC–MS/MS. We applied the same protein identifications filtering criteria (as previously mentioned) to obtain a list of TDP‐43ΔNLS interactors (Tables S10 and S11). In the cytoplasm, TDP‐43ΔNLS was found to have a different binding profile with 165 proteins, including 17 that are classified as putative interactors in this study. From those 17 proteins, PABPC1, RPS16, EIF4G1 and TDP‐43 itself were found to bind more to TDP‐43ΔNLS in the cytoplasm. The remaining 13 were found to bind less TDP‐43ΔNLS in the cytoplasm (RPS17, FUS, PFKP, PSMC3, RPL4, HNRNPU, TRIM28, HNRNPF, COPG1, MCM6, RUVBL1, PSMC6 and HNRNPM). 357 proteins were found to bind less to TDP‐43ΔNLS in the nucleus with eight of them being found as putative interactors. TRMT2A and DYNC1I2 were found to bind more to TDP‐43ΔNLS in the nucleus whereas GRSF1, TP53, CAPZA1, PTCD2, YLPM1 and PSMC2 were found to bind less to TDP‐43ΔNLS in the nucleus.
4. Discussion
In this study, we combined a traditional IP approach with a targeted biotinylation labeling (APEX) in three different cell lines (HEK293, neuro2A and mouse primary neurons) to identify matching interactors. APEX was chosen as a fast‐labeling approach to evaluate the early interactome changes of TDP‐43. We analysed the nuclear and cytoplasmic fractions separately and revealed 58 putative interactors, of which most were translational proteins, RNA metabolism proteins and protein‐modifying enzymes. Oxidative stress experiments to recapitulate TDP‐43 aggregation and to identify changes in TDP‐43 protein interactors under stress conditions showed a higher amount of TDP‐43 interaction changes in the nucleus compared to the cytoplasm, suggesting an initial dysfunction of nuclear TDP‐43 under stress conditions. However, further validation is needed to identify which specific interactions are the primary contributors to TDP‐43 pathogenesis. Overall, this study provides a list of high‐confidence interaction partners of TDP‐43, including previously unreported interactors, thus providing valuable insights into the dynamically changing TDP‐43 interactome in response to mutations and to stressors. By focusing on these interactions, we can gain a deeper understanding of how they contribute to the cascade of cellular events leading to the formation of TDP‐43 pathology and ultimately neurodegeneration. Investigating these relationships may reveal critical insights into the mechanisms driving neuronal cell death, ultimately contributing to the knowledge for improved therapeutic strategies.
4.1. Limitations of Previous Approaches to Identify TDP‐43 Interactors
Previous studies have already reported TDP‐43 interactors involved in transcription, splicing and translation (Blokhuis et al. 2016; Chou et al. 2018; Freibaum et al. 2010; Kawaguchi et al. 2020). However, generally, these approaches were carried out in whole cell lysates, which do not allow discrimination of the different interaction partners of TDP‐43 within the nucleus and cytoplasm, respectively. Chou and colleagues used a BioID approach to identify 254 interactors within live cells and to characterise TDP‐43 aggregation in neuro2a, with 64 proteins being in common with the cytoplasmic and nuclear APEX data set and 13 proteins being in common with the 58 putative TDP‐43 interactors found in this current study (Chou et al. 2018). Similarly, the majority of the interactors found in Chou et al. (2018) study are classified as RNA metabolism proteins (PC00031, 20.5%), protein modifying enzyme (PC00260, 9.3%), metabolite interconversion enzyme (PC00262, 8.5%) and translational protein (PC00263, 8.5%). One difference of this BioID approach is the longer labeling time (> 18 h) required to achieve sufficient biotinylation levels, and therefore, it is likely to capture common and unique TDP‐43 interactors based on the different labeling dynamics. This can also increase the amount of false‐positive proteins and does not allow researchers to study the rapidly occurring protein interactions that govern many cellular processes. Two other studies utilised APEX labeling to identify wild‐type TDP‐43 or TDP‐43 within anisosomes interaction partners (Schreiber et al. 2024; Yu et al. 2021). Here, we sought to dive further into the TDP‐43 interactome of wild‐type and mutant forms as well as determine the interactors within each cellular compartment.
4.2. Combining Immunoprecipitation and APEX Labeling in T‐Rex and neuro2A Cells Reveals Known and Novel Interactors
We demonstrated that the list of TDP‐43 protein interactors differed between IP from T‐Rex cells and streptavidin pulldown from neuro2A cells, indicating that a single method is insufficient to validate putative interactors within live cells. Therefore, by combining both methods and examining nuclear and cytoplasmic fractions separately, we increased the confidence that the identified proteins were likely to bind and interact with human TDP‐43 in both human and mouse cell models. A bottleneck with all such studies is the extensive validation that is required to confidently validate these interactors.
Not surprisingly, proteomic profiling of both neuro2a and T‐Rex models revealed differences in their proteomes (Figure 2A). This was anticipated due to the different cell types (neuroblastoma and kidney, respectively) and species (mouse and human, respectively). Despite these differences, TDP‐43 was found to interact with 58 mutual proteins in both mouse and human cell lines using the two different approaches for identifying protein–protein interactions. Ingenuity pathway analysis revealed that these interactors were classified into RNA metabolism proteins, including the RNA splicing factors like HNRNPF, EFTUD2, SF3B1 and GRSF1, with the latter three interacting with TDP‐43 only in the nucleus. Translational proteins such as ribosomal proteins and translation initiation factors (e.g., RPL12, EIFG1, RPL6, RPS17, VARS1, RPSA, RARS1, EPRS1, EEF1D and RPS16) were found to have increased affinity with TDP‐43 in the cytoplasm. EPRS1, RARS1 and VARS1 are aminoacyl‐tRNA synthetases that are essential to the correct synthesis of proteins by coupling the correct amino acid and tRNA molecules. However, they are also known to associate in higher‐order complexes with proteins involved in other processes such as splicing, apoptosis, DNA damage response and regulation of transcription (Gupta et al. 2023; Lambowitz and Perlman 1990).
Twenty novels interactors were found in this study while the 38 other proteins were consistent with previous TDP‐43 interactome studies (Chou et al. 2018; Feneberg et al. 2020; Freibaum et al. 2010; Riemenschneider et al. 2021; Schreiber et al. 2024). Among all these identified interactors, 40 identified in this study (e.g., NSUN2, EFTUD2 and HNRNPM) were previously reported to be enriched in insoluble TDP‐43 aggregates (Evangelista et al. 2023), suggesting they may be promising candidates for future investigation.
4.3. Alternative Interactions of Pathological TDP‐43
The purpose of this study was to investigate interactors of TDP‐43 after exposure to oxidative stress. While we acknowledge the limitations inherent to our cell models, the cells provide an excellent model to perform targeted characterisation of their interactors at specific time points. Various studies examining the role of stress granules in TDP‐43 proteinopathy used acute high‐dosage treatment of sodium arsenite between 0.25–5 mM for 0.5–1 h for stress granule formation (Liu‐Yesucevitz et al. 2010; Ratti et al. 2020). Our results confirmed that acute arsenite treatment induced rapid condensation of TDP‐43WT (within 1 h) in the nucleus. Similarly to previous studies, arsenite stress has been shown to induce nuclear aggregation of TDP‐43, exhibiting a distinct granular appearance in both overexpressed and endogenous forms within the nucleus (Cohen et al. 2015; Huang et al. 2024; Walker et al. 2013). This nuclear TDP‐43 pathology was shown to be an early event, occurring prior to cytoplasmic accumulation, leading to the loss of interactions with its protein binding partners and disrupting its splicing function, as evidenced by concurrent STMN2 cryptic splicing pathology (Spence et al. 2024).
Using this approach, we were able to identify changes in the interactions of TDP‐43WT in the nucleus and cytoplasm under stress conditions. Specifically, several proteins have been shown to be affected in our analysis. HNRNPs are known RNA‐binding proteins involved in nucleic acid metabolism including alternative splicing, mRNA stabilisation, mRNA transportation and transcriptional and translational regulation (Geuens et al. 2016; Hovhannisyan and Carstens 2007) and shuttle between the nucleus and cytoplasm to exert their biological functions. Interestingly, in the cytoplasm, under stress conditions, TDP‐43 was found to have a weaker affinity to HNRNPD, HNRNPU, HNRNPM and HNRNPF. Another protein that lost its binding affinity to TDP‐43 in the cytoplasm under stress conditions is SQSTM1, also known as p62. P62 possesses a dual role in directing substrates to degradation via autophagy and the UPS, including the degradation of fragmented TDP‐43 formed under stress conditions (Tanji et al. 2012). Reduced binding of p62 to full‐length TDP‐43 was also reported in a p62 immunoprecipitation study in the brains of patients with FTLD‐TDP (Tanji et al. 2012), suggesting that this disrupted interaction may contribute to the pathogenesis of TDP‐43. In the nucleus and under stress conditions, TDP‐43 was found to bind more to proteins classified as RNA metabolism proteins (HNRNPDL and NSUN2) and proteins involved in mRNA splicing factors (EFTUD2), suggesting a dysregulation of the transcriptional machinery, conceivably before the mislocalisation of TDP‐43.
We have further confirmed the enhanced interaction of NSUN2, a novel putative interactor found in this study, with TDP‐43WT upon arsenite treatment by immunofluorescence microscopy. This protein was selected due to the important role of N6‐methyladenosine (m6A) RNA methylation, one of the most abundant RNA modifications, in regulating RNA stability, transport and translation. Additionally, the cytoplasmic mislocalisation and nuclear depletion of TDP‐43 in ALS are closely associated with RNA mis‐splicing, impaired translation and widespread RNA instability (Melamed et al. 2019). Dysregulation of the RNA methyltransferase NSUN2 has been implicated in triggering stress responses and neuronal apoptosis (Blanco and Frye 2014), a substantial reduction in global translation (Tuorto et al. 2012) and the misregulation of miRNAs, which are critical regulators of translation, as well as RNA‐binding proteins (Komara et al. 2015).
We explored the interactome of cytoplasmically accumulated TDP‐43 using APEX biotin labeling, as a model to investigate the implication of the increased level of cytoplasmic TDP‐43 level as seen in postmortem ALS and FTD patient tissues (Neumann et al. 2006). We observed that increased cytoplasmic TDP‐43 alters its protein binding capabilities. Specifically, TDP‐43 shows a reduced affinity to RPS17 and RPL4 and a stronger affinity to EIF4G1 and RPS16, all of which are translational proteins. Since TDP‐43 is mainly located in the nucleus and is involved in mRNA translation, splicing and cryptic exon retention, this data may suggest that, along with the loss of its nuclear functions, in addition to the loss of the nuclear functions, mislocalisation and elevation of cytoplasmic TDP‐43 levels might disrupt the translational, leading to the dysregulation of specific protein levels.
4.4. Alternative Interactions of Mutant TDP‐43 in Early Disease Stage
Despite extensive in vitro and in vivo studies, the precise mechanisms through which TDP‐43 mutations contribute to ALS remain unclear. Recent evidence shows that TDP‐43 monomerisation plays an essential role in inducing TDP‐43 pathology in ALS, an event that precedes TDP‐43 mislocalisation, solubility changes and phosphorylation (Oiwa et al. 2023). The authors suggested that spliceosomal integrity is essential for TDP‐43 multimerisation under stress conditions; however, the mechanism behind this remains unknown.
Given that most TDP‐43 mutations found in ALS patients are in the C‐terminal domain, a domain known to be important for protein–protein interactions, it raises the question of whether alterations in the TDP‐43 interactome might be an early trigger for downstream defects that eventually lead to disease pathogenesis. This is particularly relevant when trying to understand why mutations persist over long periods without immediately causing motor neuron defects. We sought to investigate the binding ability of the putative interactors with the mutant variants TDP‐43G294V and TDP‐43A315T across two different cell lines. Overexpression of these variants did not result in the cytoplasmic mislocalisation of TDP‐43, similar to previous in vitro and in vivo reports (Herdewyn et al. 2014; Kreiter et al. 2018; Sabatelli et al. 2015; Scherer et al. 2024; Wegorzewska et al. 2009). However, some studies highlighted that the A315T mutation led to increasing size and the distribution density of TDP‐43 RNA granules in neuronal processes during stress (Liu‐Yesucevitz et al. 2014), as opposed to G294V presenting no significant alteration in the nuclear condensates compared to WT.
Our proteomic analysis identified two HNRNPs as potential contributors to TDP‐43 pathology, HNRNPU and HNRNPM, which were both also found to bind differently to TDP‐43 under stress conditions. TDP‐43G294V was found to bind more to HNRNPU and TDP‐43A315T was found to bind less to HNRNPM. TDP‐43 is a member of the HNRNP protein family and like many members of this family, the C‐terminal region contains glycine‐rich sequences that may be essential to recruit cellular factors that can modulate TDP‐43 function (Ayala et al. 2005; Buratti et al. 2005; D'Ambrogio et al. 2009). In addition, HNRNPs are also known to suppress cryptic exon inclusions (Bampton et al. 2021) and can often regulate TDP‐43 RNA targets when TDP‐43 is either absent of dysfunctional (Koike et al. 2023). While no studies have yet demonstrated the functional significance of TDP‐43's interaction with the two mentioned HNRNPs, further analysis is needed to determine whether this interaction plays a role in regulating RNA splicing.
Cargo transport along the cytoplasmic microtubular network is essential for neuronal function, and cytoplasmic dynein‐1 is an established molecular motor that is critical for neurogenesis and homeostasis (Ansar et al. 2019). DYNC1I2 encodes for an important component of the cytoplasmic dynein 1 complex, which plays a role in cell cycle regulation via mitotic spindle organisation in neurodevelopment and was found to be binding more to TDP‐43G294V which may hinder its function in the cytoplasm. Similar to Feneberg et al. (2020), who looked at the interactome of TDP‐43M337V, we also found a reduction of EIF4A1 interaction with TDP‐43A315T, suggesting translational dysregulation in pathology (Feneberg et al. 2020). A proteomics analysis of the TDP‐43‐associated insoluble fraction from mouse brain tissue identified EPRS1 as one of the proteins associated with TDP‐43 aggregates (Dunlop et al. 2024), a protein that we also identified to show increased binding to TDP‐43G294V in the cytoplasm. EPRS1 is a multifunctional aminoacyl‐tRNA synthetase that catalyses the aminoacylation of glutamic acid and proline tRNA species, and the increased binding with TDP‐43 in the cytoplasm may suggest that EPRS1 might be sequestered or have its function altered in ALS. Lastly, PABPC1, an RNA‐binding protein involved in various aspects of RNA metabolism, was observed to be mislocalised into robust cytoplasmic inclusions (Prpar Mihevc et al. 2016) and TDP‐43 and PABPC1 were shown to colocalise in stress granules, leading to translation repression (Dammer et al. 2012; Fang et al. 2019).
Given the high heterogeneity of MND, mutations in TDP‐43, such as A315T and G294V, may serve as risk factors that heighten susceptibility to the disease. These mutations likely disrupt interactions with proteins essential for regulating translation and transcription. Over time, this disruption could result in the nuclear loss of TDP‐43, eventually leading to the formation of aggregates observed in the end stage of the disease.
Previous research has demonstrated that TDP‐43 ALS variants, such as D169G and M337V, exhibit defects in stress‐induced nuclear condensation compared with the wild‐type form. Additionally, repetitive stress results in a persistent loss of splicing function and chronic depletion of the normal form of STMN2 mRNA and protein, contributing to the disease hallmark (Huang et al. 2024). Since D169G and M337V did not significantly impact RNA‐binding under normal conditions (Chiang et al. 2016; Grese et al. 2021), investigating TDP‐43 ALS‐linked mutants' interactors following arsenite treatment could provide valuable insights into the specific dysregulated proteins in mutant TDP‐43‐expressing cells under oxidative stress, and this expanded comparison should be explored in future research.
5. Conclusion
A major hypothesis of TDP‐43 dysfunction is the loss of its nuclear functions, resulting in aberrant splicing and the emergence of cryptic exons (Agra Almeida Quadros et al. 2024; Ayuso et al. 2023; Baughn et al. 2023; Cao and Scotter 2022). As previously shown, genetic and environmental factors can lead to nuclear loss of TDP‐43 followed by the formation of aggregates; however, the exact mechanisms leading to these hallmark pathologies remain unclear. By combining cell models to compare the interactome of TDP‐43, specifically by evaluating the different cellular compartments of TDP‐43 mutants and under stress conditions, we were able to identify 58 putative interactors occurring within cells. We extended this validation to cellular models aiming to model pathological features (such as stress responses and disease‐related mutations) and matched putative interactors and pathways between these different scenarios.
This approach allowed us to explore changes of the TDP‐43 interactome when mutated or when subjected to acute arsenite treatment to provide insights into ALS and FTLD mechanisms. Like in any model system, we have identified certain limitations that may impact the accuracy of identifying TDP‐43 interactors. For example, while NaAsO2 does induce TDP‐43 aggregation in the nucleus, it also activates many other pathways. Additionally, APEX labeling requires a 1‐minute incubation in H2O2, and despite being brief, this exposure can cause oxidative stress (Ransy et al. 2020).
Nevertheless, insights into the interaction partners of TDP‐43 in their respective compartments or disease scenarios will undoubtedly help to provide insights into disease mechanisms, as well as potential therapeutic targets or future biomarkers.
Author Contributions
Flora Cheng: writing – original draft, writing – review and editing, methodology, validation, investigation, formal analysis, visualization, data curation, conceptualization. Tyler Chapman: investigation, formal analysis, conceptualization, data curation, validation. Juliana Venturato: formal analysis, methodology, resources, data curation, investigation, validation. Jennilee M. Davidson: writing – review and editing, investigation. Stella A. Polido: investigation, writing – review and editing, validation, formal analysis. Livia Rosa‐Fernandes: data curation, methodology. Rebecca San Gil: methodology, writing – review and editing. Hannah J. Suddull: investigation. Selina Zhang: writing – review and editing, conceptualization. Chiara Y. Macaslam: writing – review and editing, conceptualization. Paulina Szwaja: writing – review and editing, conceptualization. Roger Chung: supervision, formal analysis. Adam K. Walker: writing – review and editing, project administration, funding acquisition, supervision, resources, conceptualization. Stephanie L. Rayner: writing – review and editing, project administration, supervision, formal analysis, investigation, data curation. Marco Morsch: writing – review and editing, project administration, funding acquisition, supervision, resources, conceptualization. Albert Lee: writing – review and editing, project administration, funding acquisition, supervision, resources, conceptualization.
Conflicts of Interest
The authors declare no conflicts of interest.
Peer Review
The peer review history for this article is available at https://www.webofscience.com/api/gateway/wos/peer‐review/10.1111/jnc.70079.
Supporting information
Figure S1.
Table S1.
Acknowledgements
Open access publishing facilitated by Macquarie University, as part of the Wiley ‐ Macquarie University agreement via the Council of Australian University Librarians.
Funding: This work was supported by the MND Research Australia Betty Laidlaw MND Research Grant (M.M., A.L. and A.W.), FightMND Angie Cunningham PhD Scholarship and Grant‐In‐Aid (F.C.), FightMND Early‐Career Research Fellowship (S.L.R.), FightMND Bill Guest Mid‐Career Research Fellowship (A.W.), MND Research Australia Innovator Grant (IG2308) (J.M.D.) and donations to Macquarie University Motor Neuron Disease Research Centre. Aspects of this research were funded by the US Department of Defence Amyotrophic Lateral Sclerosis Research Program (ALSRP) AL230125.
Flora Cheng and Tyler Chapman contributed equally and are considered co‐first authors.
Stephanie L. Rayner, Marco Morsch, and Albert Lee—co‐senior authors.
Contributor Information
Flora Cheng, Email: flora.cheng@mq.edu.au.
Marco Morsch, Email: marco.morsch@mq.edu.au.
Albert Lee, Email: albert.lee@mq.edu.au.
Data Availability Statement
The data that support the findings of this study are openly available in ProteomeXchange at https://doi.org/10.6019/PXD054023, reference number PXD054023.
References
- Agra Almeida Quadros, A. R. , Li Z., Wang X., et al. 2024. “Cryptic Splicing of Stathmin‐2 and UNC13A mRNAs Is a Pathological Hallmark of TDP‐43‐Associated Alzheimer's Disease.” Acta Neuropathologica 147, no. 1: 9. 10.1007/s00401-023-02655-0. [DOI] [PMC free article] [PubMed] [Google Scholar]
- Ansar, M. , Ullah F., Paracha S. A., et al. 2019. “Bi‐Allelic Variants in DYNC1I2 Cause Syndromic Microcephaly With Intellectual Disability, Cerebral Malformations, and Dysmorphic Facial Features.” American Journal of Human Genetics 104, no. 6: 1073–1087. 10.1016/j.ajhg.2019.04.002. [DOI] [PMC free article] [PubMed] [Google Scholar]
- Arai, T. , Hasegawa M., Akiyama H., et al. 2006. “TDP‐43 Is a Component of Ubiquitin‐Positive Tau‐Negative Inclusions in Frontotemporal Lobar Degeneration and Amyotrophic Lateral Sclerosis.” Biochemical and Biophysical Research Communications 351, no. 3: 602–611. 10.1016/j.bbrc.2006.10.093. [DOI] [PubMed] [Google Scholar]
- Arai, T. , Hasegawa M., Nonoka T., et al. 2010. “Phosphorylated and Cleaved TDP‐43 in ALS, FTLD and Other Neurodegenerative Disorders and in Cellular Models of TDP‐43 Proteinopathy.” Neuropathology 30, no. 2: 170–181. 10.1111/j.1440-1789.2009.01089.x. [DOI] [PubMed] [Google Scholar]
- Ayala, Y. M. , Pantano S., D'Ambrogio A., et al. 2005. “Human, Drosophila, and C.Elegans TDP43: Nucleic Acid Binding Properties and Splicing Regulatory Function.” Journal of Molecular Biology 348, no. 3: 575–588. 10.1016/j.jmb.2005.02.038. [DOI] [PubMed] [Google Scholar]
- Ayuso, V. E. , Pickles S., Todd T., et al. 2023. “TDP‐43‐Regulated Cryptic RNAs Accumulate in Alzheimer's Disease Brains.” Molecular Neurodegeneration 18: 57. 10.1186/s13024-023-00646-z. [DOI] [PMC free article] [PubMed] [Google Scholar]
- Bampton, A. , Gatt A., Humphrey J., et al. 2021. “HnRNP K Mislocalisation Is a Novel Protein Pathology of Frontotemporal Lobar Degeneration and Ageing and Leads to Cryptic Splicing.” Acta Neuropathologica 142, no. 4: 609–627. 10.1007/s00401-021-02340-0. [DOI] [PMC free article] [PubMed] [Google Scholar]
- Barmada, S. J. , Skibinski G., Korb E., Rao E. J., Wu J. Y., and Finkbeiner S.. 2010. “Cytoplasmic Mislocalization of TDP‐43 Is Toxic to Neurons and Enhanced by a Mutation Associated With Familial Amyotrophic Lateral Sclerosis.” Journal of Neuroscience 30, no. 2. 10.1523/JNEUROSCI.4988-09.2010. [DOI] [PMC free article] [PubMed] [Google Scholar]
- Baughn, M. W. , Melamed Z., López‐Erauskin J., et al. 2023. “Mechanism of STMN2 Cryptic Splice‐Polyadenylation and Its Correction for TDP‐43 Proteinopathies.” Science (New York, N.Y.) 379, no. 6637: 1140–1149. 10.1126/science.abq5622. [DOI] [PMC free article] [PubMed] [Google Scholar]
- Bendayan, M. 2001. “Worth Its Weight in Gold.” Science 291, no. 5507: 1363–1365. 10.1126/science.291.5507.1363. [DOI] [PubMed] [Google Scholar]
- Blanco, S. , and Frye M.. 2014. “Role of RNA Methyltransferases in Tissue Renewal and Pathology.” Current Opinion in Cell Biology 31: 1–7. 10.1016/j.ceb.2014.06.006. [DOI] [PMC free article] [PubMed] [Google Scholar]
- Blokhuis, A. M. , Koppers M., Groen E. J. N., et al. 2016. “Comparative Interactomics Analysis of Different ALS‐Associated Proteins Identifies Converging Molecular Pathways.” Acta Neuropathologica 132, no. 2: 175–196. 10.1007/s00401-016-1575-8. [DOI] [PMC free article] [PubMed] [Google Scholar]
- Buratti, E. , Brindisi A., Giombi M., Tisminetzky S., Ayala Y. M., and Baralle F. E.. 2005. “TDP‐43 Binds Heterogeneous Nuclear Ribonucleoprotein A/B Through Its C‐Terminal Tail: AN IMPORTANT REGION FOR THE INHIBITION OF CYSTIC FIBROSIS TRANSMEMBRANE CONDUCTANCE REGULATOR EXON 9 SPLICING*.” Journal of Biological Chemistry 280, no. 45: 37572–37584. 10.1074/jbc.M505557200. [DOI] [PubMed] [Google Scholar]
- Cao, M. C. , and Scotter E. L.. 2022. “Transcriptional Targets of Amyotrophic Lateral Sclerosis/Frontotemporal Dementia Protein TDP‐43 – Meta‐Analysis and Interactive Graphical Database.” Disease Models & Mechanisms 15, no. 9: dmm049418. 10.1242/dmm.049418. [DOI] [PMC free article] [PubMed] [Google Scholar]
- Chang, C. , Wu T.‐H., Wu C.‐Y., et al. 2012. “The N‐Terminus of TDP‐43 Promotes Its Oligomerization and Enhances DNA Binding Affinity.” Biochemical and Biophysical Research Communications 425, no. 2: 219–224. 10.1016/j.bbrc.2012.07.071. [DOI] [PubMed] [Google Scholar]
- Cheng, F. , Chapman T., Zhang S., et al. 2024. “Understanding Age‐Related Pathologic Changes in TDP‐43 Functions and the Consequence on RNA Splicing and Signalling in Health and Disease.” Ageing Research Reviews 96: 102246. 10.1016/j.arr.2024.102246. [DOI] [PubMed] [Google Scholar]
- Cheng, F. , De Luca A., Hogan A. L., et al. 2021. “Unbiased Label‐Free Quantitative Proteomics of Cells Expressing Amyotrophic Lateral Sclerosis (ALS) Mutations in CCNF Reveals Activation of the Apoptosis Pathway: A Workflow to Screen Pathogenic Gene Mutations.” Frontiers in Molecular Neuroscience 14. 10.3389/fnmol.2021.627740. [DOI] [PMC free article] [PubMed] [Google Scholar]
- Chiang, C.‐H. , Grauffel C., Wu L.‐S., et al. 2016. “Structural Analysis of Disease‐Related TDP‐43 D169G Mutation: Linking Enhanced Stability and Caspase Cleavage Efficiency to Protein Accumulation.” Scientific Reports 6, no. 1: 21581. 10.1038/srep21581. [DOI] [PMC free article] [PubMed] [Google Scholar]
- Chou, C.‐C. , Zhang Y., Umoh M. E., et al. 2018. “TDP‐43 Pathology Disrupts Nuclear Pore Complexes and Nucleocytoplasmic Transport in ALS/FTD.” Nature Neuroscience 21, no. 2. 10.1038/s41593-017-0047-3. [DOI] [PMC free article] [PubMed] [Google Scholar]
- Cohen, T. J. , Hwang A. W., Restrepo C. R., Yuan C.‐X., Trojanowski J. Q., and Lee V. M. Y.. 2015. “An Acetylation Switch Controls TDP‐43 Function and Aggregation Propensity.” Nature Communications 6: 5845. 10.1038/ncomms6845. [DOI] [PMC free article] [PubMed] [Google Scholar]
- Conicella, A. E. , Zerze G. H., Mittal J., and Fawzi N. L.. 2016. “ALS Mutations Disrupt Phase Separation Mediated by α‐Helical Structure in the TDP‐43 Low‐Complexity C‐Terminal Domain.” Structure 24, no. 9: 9. 10.1016/j.str.2016.07.007. [DOI] [PMC free article] [PubMed] [Google Scholar]
- D'Ambrogio, A. , Buratti E., Stuani C., et al. 2009. “Functional Mapping of the Interaction Between TDP‐43 and hnRNP A2 In Vivo.” Nucleic Acids Research 37, no. 12: 4116–4126. 10.1093/nar/gkp342. [DOI] [PMC free article] [PubMed] [Google Scholar]
- Dammer, E. B. , Fallini C., Gozal Y. M., et al. 2012. “Coaggregation of RNA‐Binding Proteins in a Model of TDP‐43 Proteinopathy With Selective RGG Motif Methylation and a Role for RRM1 Ubiquitination.” PLoS One 7, no. 6: e38658. 10.1371/journal.pone.0038658. [DOI] [PMC free article] [PubMed] [Google Scholar]
- Dunker, W. , Ye X., Zhao Y., Liu L., Richardson A., and Karijolich J.. 2021. “TDP‐43 Prevents Endogenous RNAs From Triggering a Lethal RIG‐I‐Dependent Interferon Response.” Cell Reports 35, no. 2: 108976. 10.1016/j.celrep.2021.108976. [DOI] [PMC free article] [PubMed] [Google Scholar]
- Dunlop, F. , Mason S., Tsitkanou S., and Russell A. P.. 2024. “Proteomic Analysis of the TDP‐43‐Associated Insoluble Fraction From NEFH‐TDP‐43 Mouse Brain Suggests Sustained Stress Granule Formation, CLUH Granule Recruitment and Impaired Mitochondrial Metabolism (p. 2024.05.23.595607).” bioRxiv. 10.1101/2024.05.23.595607. [DOI]
- Evangelista, B. A. , Cahalan S. R., Ragusa J. V., et al. 2023. “Tandem Detergent‐Extraction and Immunoprecipitation of Proteinopathy: Scalable Enrichment of ALS‐Associated TDP‐43 Aggregates.” iScience 26, no. 5: 106645. 10.1016/j.isci.2023.106645. [DOI] [PMC free article] [PubMed] [Google Scholar]
- Fang, M. Y. , Markmiller S., Vu A. Q., et al. 2019. “Small Molecule Modulation of TDP‐43 Recruitment to Stress Granules Prevents Persistent TDP‐43 Accumulation in ALS/FTD.” Neuron 103, no. 5: 802–819. 10.1016/j.neuron.2019.05.048. [DOI] [PMC free article] [PubMed] [Google Scholar]
- Feneberg, E. , Gordon D., Thompson A. G., et al. 2020. “An ALS‐Linked Mutation in TDP‐43 Disrupts Normal Protein Interactions in the Motor Neuron Response to Oxidative Stress.” Neurobiology of Disease 144: 105050. 10.1016/j.nbd.2020.105050. [DOI] [PubMed] [Google Scholar]
- François‐Moutal, L. , Perez‐Miller S., Scott D. D., Miranda V. G., Mollasalehi N., and Khanna M.. 2019. “Structural Insights Into TDP‐43 and Effects of Post‐Translational Modifications.” Frontiers in Molecular Neuroscience 12. 10.3389/fnmol.2019.00301. [DOI] [PMC free article] [PubMed] [Google Scholar]
- Freibaum, B. D. , Chitta R., High A. A., and Taylor J. P.. 2010. “Global Analysis of TDP‐43 Interacting Proteins Reveals Strong Association With RNA Splicing and Translation Machinery.” Journal of Proteome Research 9, no. 2. 10.1021/pr901076y. [DOI] [PMC free article] [PubMed] [Google Scholar]
- Geuens, T. , Bouhy D., and Timmerman V.. 2016. “The hnRNP Family: Insights Into Their Role in Health and Disease.” Human Genetics 135: 851–867. 10.1007/s00439-016-1683-5. [DOI] [PMC free article] [PubMed] [Google Scholar]
- Grese, Z. R. , Bastos A. C., Mamede L. D., French R. L., Miller T. M., and Ayala Y. M.. 2021. “Specific RNA Interactions Promote TDP‐43 Multivalent Phase Separation and Maintain Liquid Properties.” EMBO Reports 22, no. 12: e53632. 10.15252/embr.202153632. [DOI] [PMC free article] [PubMed] [Google Scholar]
- Gupta, S. , Jani J., Vijayasurya M., et al. 2023. “Aminoacyl‐tRNA Synthetase – A Molecular Multitasker.” FASEB Journal 37, no. 11: e23219. 10.1096/fj.202202024RR. [DOI] [PubMed] [Google Scholar]
- Hardiman, O. , Al‐Chalabi A., Chio A., et al. 2017. “Amyotrophic Lateral Sclerosis.” Nature Reviews Disease Primers 3, no. 1: 1–19. 10.1038/nrdp.2017.71. [DOI] [PubMed] [Google Scholar]
- Herdewyn, S. , Cirillo C., Van Den Bosch L., Robberecht W., Vanden Berghe P., and Van Damme P.. 2014. “Prevention of Intestinal Obstruction Reveals Progressive Neurodegeneration in Mutant TDP‐43 (A315T)mice.” Molecular Neurodegeneration 9, no. 1: 24. 10.1186/1750-1326-9-24. [DOI] [PMC free article] [PubMed] [Google Scholar]
- Hovhannisyan, R. H. , and Carstens R. P.. 2007. “Heterogeneous Ribonucleoprotein M Is a Splicing Regulatory Protein That Can Enhance or Silence Splicing of Alternatively Spliced Exons*.” Journal of Biological Chemistry 282, no. 50: 36265–36274. 10.1074/jbc.M704188200. [DOI] [PubMed] [Google Scholar]
- Huang, W.‐P. , Ellis B. C. S., Hodgson R. E., et al. 2024. “Stress‐Induced TDP‐43 Nuclear Condensation Causes Splicing Loss of Function and STMN2 Depletion.” Cell Reports 43, no. 7. 10.1016/j.celrep.2024.114421. [DOI] [PubMed] [Google Scholar]
- Hung, V. , Udeshi N. D., Lam S. S., et al. 2016. “Spatially Resolved Proteomic Mapping in Living Cells With the Engineered Peroxidase APEX2.” Nature Protocols 11, no. 3: 456–475. 10.1038/nprot.2016.018. [DOI] [PMC free article] [PubMed] [Google Scholar]
- Jung, K. H. , Sun J., Hsiung C.‐H., Lian X. L., Liu Y., and Zhang X.. 2023. “Nuclear Bodies Protect Phase Separated Proteins From Degradation in Stressed Proteome (p. 2023.04.19.537522).” bioRxiv. 10.1101/2023.04.19.537522. [DOI]
- Kabashi, E. , Valdmanis P. N., Dion P., et al. 2008. “TARDBP Mutations in Individuals With Sporadic and Familial Amyotrophic Lateral Sclerosis.” Nature Genetics 40, no. 5: 572–574. 10.1038/ng.132. [DOI] [PubMed] [Google Scholar]
- Kaech, S. , and Banker G.. 2006. “Culturing Hippocampal Neurons.” Nature Protocols 1, no. 5: 2406–2415. 10.1038/nprot.2006.356. [DOI] [PubMed] [Google Scholar]
- Kawaguchi, T. , Rollins M. G., Moinpour M., et al. 2020. “Changes to the TDP‐43 and FUS Interactomes Induced by DNA Damage.” Journal of Proteome Research 19, no. 1: 360–370. 10.1021/acs.jproteome.9b00575. [DOI] [PMC free article] [PubMed] [Google Scholar]
- Keating, S. S. , Bademosi A. T., San Gil R., and Walker A. K.. 2023. “Aggregation‐Prone TDP‐43 Sequesters and Drives Pathological Transitions of Free Nuclear TDP‐43.” Cellular and Molecular Life Sciences: CMLS 80, no. 4: 95. 10.1007/s00018-023-04739-2. [DOI] [PMC free article] [PubMed] [Google Scholar]
- Kiernan, M. C. , Vucic S., Cheah B. C., et al. 2011. “Amyotrophic Lateral Sclerosis.” Lancet 377, no. 9769: 942–955. 10.1016/S0140-6736(10)61156-7. [DOI] [PubMed] [Google Scholar]
- Koehler, L. C. , Grese Z. R., Bastos A. C. S., Mamede L. D., Heyduk T., and Ayala Y. M.. 2022. “TDP‐43 Oligomerization and Phase Separation Properties Are Necessary for Autoregulation.” Frontiers in Neuroscience 16: 818655. 10.3389/fnins.2022.818655. [DOI] [PMC free article] [PubMed] [Google Scholar]
- Koike, Y. , Pickles S., Ayuso V. E., et al. 2023. “TDP‐43 and Other hnRNPs Regulate Cryptic Exon Inclusion of a Key ALS/FTD Risk Gene, UNC13A.” PLoS Biology 21, no. 3: e3002028. 10.1371/journal.pbio.3002028. [DOI] [PMC free article] [PubMed] [Google Scholar]
- Komara, M. , Al‐Shamsi A. M., Ben‐Salem S., Ali B. R., and Al‐Gazali L.. 2015. “A Novel Single‐Nucleotide Deletion (c.1020delA) in NSUN2 Causes Intellectual Disability in an Emirati Child.” Journal of Molecular Neuroscience 57, no. 3: 393–399. 10.1007/s12031-015-0592-8. [DOI] [PubMed] [Google Scholar]
- Kreiter, N. , Pal A., Lojewski X., et al. 2018. “Age‐Dependent Neurodegeneration and Organelle Transport Deficiencies in Mutant TDP43 Patient‐Derived Neurons Are Independent of TDP43 Aggregation.” Neurobiology of Disease 115: 167–181. 10.1016/j.nbd.2018.03.010. [DOI] [PubMed] [Google Scholar]
- Kuo, P.‐H. , Doudeva L. G., Wang Y.‐T., Shen C.‐K. J., and Yuan H. S.. 2009. “Structural Insights Into TDP‐43 in Nucleic‐Acid Binding and Domain Interactions.” Nucleic Acids Research 37, no. 6. 10.1093/nar/gkp013. [DOI] [PMC free article] [PubMed] [Google Scholar]
- Lagier‐Tourenne, C. , Polymenidou M., and Cleveland D. W.. 2010. “TDP‐43 and FUS/TLS: Emerging Roles in RNA Processing and Neurodegeneration.” Human Molecular Genetics 19, no. R1. 10.1093/hmg/ddq137. [DOI] [PMC free article] [PubMed] [Google Scholar]
- Lambowitz, A. M. , and Perlman P. S.. 1990. “Involvement of Aminoacyl‐tRNA Synthetases and Other Proteins in Group I and Group II Intron Splicing.” Trends in Biochemical Sciences 15, no. 11: 440–444. 10.1016/0968-0004(90)90283-H. [DOI] [PubMed] [Google Scholar]
- Li, H.‐R. , Chen T.‐C., Hsiao C.‐L., Shi L., Chou C.‐Y., and Huang J.. 2018. “The Physical Forces Mediating Self‐Association and Phase‐Separation in the C‐Terminal Domain of TDP‐43.” Biochimica et Biophysica Acta (BBA) ‐ Proteins and Proteomics 1866, no. 2: 214–223. 10.1016/j.bbapap.2017.10.001. [DOI] [PubMed] [Google Scholar]
- Ling, S.‐C. , Polymenidou M., and Cleveland D. W.. 2013. “Converging Mechanisms in ALS and FTD: Disrupted RNA and Protein Homeostasis.” Neuron 79, no. 3: 416–438. 10.1016/j.neuron.2013.07.033. [DOI] [PMC free article] [PubMed] [Google Scholar]
- Liu‐Yesucevitz, L. , Bilgutay A., Zhang Y.‐J., et al. 2010. “Tar DNA Binding Protein‐43 (TDP‐43) Associates With Stress Granules: Analysis of Cultured Cells and Pathological Brain Tissue.” PLoS One 5, no. 10: e13250. 10.1371/journal.pone.0013250. [DOI] [PMC free article] [PubMed] [Google Scholar]
- Liu‐Yesucevitz, L. , Lin A. Y., Ebata A., et al. 2014. “ALS‐Linked Mutations Enlarge TDP‐43‐Enriched Neuronal RNA Granules in the Dendritic Arbor.” Journal of Neuroscience 34, no. 12: 4167–4174. 10.1523/JNEUROSCI.2350-13.2014. [DOI] [PMC free article] [PubMed] [Google Scholar]
- Lukavsky, P. J. , Daujotyte D., Tollervey J. R., et al. 2013. “Molecular Basis of UG‐Rich RNA Recognition by the Human Splicing Factor TDP‐43.” Nature Structural & Molecular Biology 20, no. 12. 10.1038/nsmb.2698. [DOI] [PubMed] [Google Scholar]
- Masrori, P. , and Van Damme P.. 2020. “Amyotrophic Lateral Sclerosis: A Clinical Review.” European Journal of Neurology 27, no. 10: 1918–1929. 10.1111/ene.14393. [DOI] [PMC free article] [PubMed] [Google Scholar]
- Mayer, G. , and Bendayan M.. 1997. “Biotinyl‐Tyramide: A Novel Approach for Electron Microscopic Immunocytochemistry.” Journal of Histochemistry and Cytochemistry: Official Journal of the Histochemistry Society 45, no. 11: 1449–1454. 10.1177/002215549704501101. [DOI] [PubMed] [Google Scholar]
- Melamed, Z. , López‐Erauskin J., Baughn M. W., et al. 2019. “Premature Polyadenylation‐Mediated Loss of Stathmin‐2 Is a Hallmark of TDP‐43‐Dependent Neurodegeneration.” Nature Neuroscience 22, no. 2. 10.1038/s41593-018-0293-z. [DOI] [PMC free article] [PubMed] [Google Scholar]
- Mount, S. L. , and Cooper K.. 2001. “Beware of Biotin: A Source of False‐Positive Immunohistochemistry.” Current Diagnostic Pathology 7, no. 3: 161–167. 10.1054/cdip.2001.0069. [DOI] [Google Scholar]
- Namgung, U. , and Xia Z.. 2000. “Arsenite‐Induced Apoptosis in Cortical Neurons Is Mediated by c‐Jun N‐Terminal Protein Kinase 3 and p38 Mitogen‐Activated Protein Kinase.” Journal of Neuroscience 20, no. 17: 6442–6451. 10.1523/JNEUROSCI.20-17-06442.2000. [DOI] [PMC free article] [PubMed] [Google Scholar]
- Nelson, P. T. , Dickson D. W., Trojanowski J. Q., et al. 2019. “Limbic‐Predominant Age‐Related TDP‐43 Encephalopathy (LATE): Consensus Working Group Report.” Brain: A Journal of Neurology 142, no. 6: 1503–1527. 10.1093/brain/awz099. [DOI] [PMC free article] [PubMed] [Google Scholar]
- Neumann, M. , Sampathu D. M., Kwong L. K., et al. 2006. “Ubiquitinated TDP‐43 in Frontotemporal Lobar Degeneration and Amyotrophic Lateral Sclerosis.” Science 314, no. 5796. 10.1126/science.1134108. [DOI] [PubMed] [Google Scholar]
- Oiwa, K. , Watanabe S., Onodera K., et al. 2023. “Monomerization of TDP‐43 Is a Key Determinant for Inducing TDP‐43 Pathology in Amyotrophic Lateral Sclerosis.” Science Advances 9, no. 31: eadf6895. 10.1126/sciadv.adf6895. [DOI] [PMC free article] [PubMed] [Google Scholar]
- Perez‐Riverol, Y. , Bai J., Bandla C., et al. 2022. “The PRIDE Database Resources in 2022: A Hub for Mass Spectrometry‐Based Proteomics Evidences.” Nucleic Acids Research 50, no. D1: D543–D552. 10.1093/nar/gkab1038. [DOI] [PMC free article] [PubMed] [Google Scholar]
- Prasad, A. , Bharathi V., Sivalingam V., Girdhar A., and Patel B. K.. 2019. “Molecular Mechanisms of TDP‐43 Misfolding and Pathology in Amyotrophic Lateral Sclerosis.” Frontiers in Molecular Neuroscience 12. 10.3389/fnmol.2019.00025. [DOI] [PMC free article] [PubMed] [Google Scholar]
- Prpar Mihevc, S. , Baralle M., Buratti E., and Rogelj B.. 2016. “TDP‐43 Aggregation Mirrors TDP‐43 Knockdown, Affecting the Expression Levels of a Common Set of Proteins.” Scientific Reports 6: 33996. 10.1038/srep33996. [DOI] [PMC free article] [PubMed] [Google Scholar]
- Radford, R. A. , Morsch M., Rayner S. L., Cole N. J., Pountney D. L., and Chung R. S.. 2015. “The Established and Emerging Roles of Astrocytes and Microglia in Amyotrophic Lateral Sclerosis and Frontotemporal Dementia.” Frontiers in Cellular Neuroscience 9: 414. 10.3389/fncel.2015.00414. [DOI] [PMC free article] [PubMed] [Google Scholar]
- Ransy, C. , Vaz C., Lombès A., and Bouillaud F.. 2020. “Use of H2O2 to Cause Oxidative Stress, the Catalase Issue.” International Journal of Molecular Sciences 21, no. 23: 9149. 10.3390/ijms21239149. [DOI] [PMC free article] [PubMed] [Google Scholar]
- Ratti, A. , Gumina V., Lenzi P., et al. 2020. “Chronic Stress Induces Formation of Stress Granules and Pathological TDP‐43 Aggregates in Human ALS Fibroblasts and iPSC‐Motoneurons.” Neurobiology of Disease 145: 105051. 10.1016/j.nbd.2020.105051. [DOI] [PubMed] [Google Scholar]
- Rayner, S. L. , Cheng F., Yang S., et al. 2020. “BioID Analysis of the Cyclin F Interactome Reveals That ALS‐Variant Cyclin F Alters the Homeostasis of Paraspeckle‐Associated Proteins (p. 2020.04.30.071365).” bioRxiv. 10.1101/2020.04.30.071365. [DOI]
- Rhee, H.‐W. , Zou P., Udeshi N. D., et al. 2013. “Proteomic Mapping of Mitochondria in Living Cells via Spatially‐Restricted Enzymatic Tagging.” Science (New York, N.Y.) 339, no. 6125: 1328–1331. 10.1126/science.1230593. [DOI] [PMC free article] [PubMed] [Google Scholar]
- Riemenschneider, H. , Guo Q., Bader J., et al. 2021. “Gel‐Like Inclusions of C‐Terminal Fragments of TDP‐43 Sequester and Inhibit Proteasomes in Neurons (p. 2021.03.15.435268).” bioRxiv. 10.1101/2021.03.15.435268. [DOI]
- Roux, K. J. , Kim D. I., Raida M., and Burke B.. 2012. “A Promiscuous Biotin Ligase Fusion Protein Identifies Proximal and Interacting Proteins in Mammalian Cells.” Journal of Cell Biology 196, no. 6: 801–810. 10.1083/jcb.201112098. [DOI] [PMC free article] [PubMed] [Google Scholar]
- Ryan, M. , Heverin M., McLaughlin R. L., and Hardiman O.. 2019. “Lifetime Risk and Heritability of Amyotrophic Lateral Sclerosis.” JAMA Neurology 76, no. 11: 1367–1374. 10.1001/jamaneurol.2019.2044. [DOI] [PMC free article] [PubMed] [Google Scholar]
- Sabatelli, M. , Zollino M., Conte A., et al. 2015. “Primary Fibroblasts Cultures Reveal TDP‐43 Abnormalities in Amyotrophic Lateral Sclerosis Patients With and Without SOD1 Mutations.” Neurobiology of Aging 36, no. 5: 2005.e5–2005.e13. 10.1016/j.neurobiolaging.2015.02.009. [DOI] [PubMed] [Google Scholar]
- Sahu, M. P. , Nikkilä O., Lågas S., Kolehmainen S., and Castrén E.. 2019. “Culturing Primary Neurons From Rat Hippocampus and Cortex.” Neuronal Signaling 3, no. 2: NS20180207. 10.1042/NS20180207. [DOI] [PMC free article] [PubMed] [Google Scholar]
- Scherer, N. M. , Maurel C., Graus M. S., et al. 2024. “RNA‐Binding Properties Orchestrate TDP‐43 Homeostasis Through Condensate Formation In Vivo.” Nucleic Acids Research 52, no. 9: 5301–5319. 10.1093/nar/gkae112. [DOI] [PMC free article] [PubMed] [Google Scholar]
- Schreiber, K. J. , Kadijk E., and Youn J.‐Y.. 2024. “Exploring Options for Proximity‐Dependent Biotinylation Experiments: Comparative Analysis of Labeling Enzymes and Affinity Purification Resins.” Journal of Proteome Research 23, no. 4: 1531–1543. 10.1021/acs.jproteome.3c00908. [DOI] [PMC free article] [PubMed] [Google Scholar]
- Sears, R. M. , May D. G., and Roux K. J.. 2019. “BioID as a Tool for Protein‐Proximity Labeling in Living Cells.” Methods in Molecular Biology (Clifton, N.J.) 2012: 299–313. 10.1007/978-1-4939-9546-2_15. [DOI] [PMC free article] [PubMed] [Google Scholar]
- Spence, H. , Waldron F. M., Saleeb R. S., et al. 2024. “RNA Aptamer Reveals Nuclear TDP‐43 Pathology Is an Early Aggregation Event That Coincides With STMN‐2 Cryptic Splicing and Precedes Clinical Manifestation in ALS.” Acta Neuropathologica 147, no. 1: 50. 10.1007/s00401-024-02705-1. [DOI] [PMC free article] [PubMed] [Google Scholar]
- Strong, M. J. , Abrahams S., Goldstein L. H., et al. 2017. “Amyotrophic Lateral Sclerosis ‐ Frontotemporal Spectrum Disorder (ALS‐FTSD): Revised Diagnostic Criteria.” Amyotrophic Lateral Sclerosis & Frontotemporal Degeneration 18, no. 3–4: 153–174. 10.1080/21678421.2016.1267768. [DOI] [PMC free article] [PubMed] [Google Scholar]
- Tan, R. H. , Ke Y. D., Ittner L. M., and Halliday G. M.. 2017. “ALS/FTLD: Experimental Models and Reality.” Acta Neuropathologica 133, no. 2: 177–196. 10.1007/s00401-016-1666-6. [DOI] [PubMed] [Google Scholar]
- Tanji, K. , Zhang H.‐X., Mori F., Kakita A., Takahashi H., and Wakabayashi K.. 2012. “P62/Sequestosome 1 Binds to TDP‐43 in Brains With Frontotemporal Lobar Degeneration With TDP‐43 Inclusions.” Journal of Neuroscience Research 90, no. 10: 2034–2042. 10.1002/jnr.23081. [DOI] [PubMed] [Google Scholar]
- Tuorto, F. , Liebers R., Musch T., et al. 2012. “RNA Cytosine Methylation by Dnmt2 and NSun2 Promotes tRNA Stability and Protein Synthesis.” Nature Structural & Molecular Biology 19, no. 9: 900–905. 10.1038/nsmb.2357. [DOI] [PubMed] [Google Scholar]
- Udan‐Johns, M. , Bengoechea R., Bell S., et al. 2014. “Prion‐Like Nuclear Aggregation of TDP‐43 During Heat Shock Is Regulated by HSP40/70 Chaperones.” Human Molecular Genetics 23, no. 1: 157–170. 10.1093/hmg/ddt408. [DOI] [PMC free article] [PubMed] [Google Scholar]
- Walker, A. K. , Soo K. Y., Sundaramoorthy V., et al. 2013. “ALS‐Associated TDP‐43 Induces Endoplasmic Reticulum Stress, Which Drives Cytoplasmic TDP‐43 Accumulation and Stress Granule Formation.” PLoS One 8, no. 11: e81170. 10.1371/journal.pone.0081170. [DOI] [PMC free article] [PubMed] [Google Scholar]
- Walker, A. K. , Spiller K. J., Ge G., et al. 2015. “Functional Recovery in New Mouse Models of ALS/FTLD After Clearance of Pathological Cytoplasmic TDP‐43.” Acta Neuropathologica 130, no. 5: 643–660. 10.1007/s00401-015-1460-x. [DOI] [PMC free article] [PubMed] [Google Scholar]
- Wang, L. , Kang J., Lim L., Wei Y., and Song J.. 2018. “TDP‐43 NTD Can Be Induced While CTD Is Significantly Enhanced by ssDNA to Undergo Liquid‐Liquid Phase Separation.” Biochemical and Biophysical Research Communications 499, no. 2: 189–195. 10.1016/j.bbrc.2018.03.121. [DOI] [PubMed] [Google Scholar]
- Wegorzewska, I. , Bell S., Cairns N. J., Miller T. M., and Baloh R. H.. 2009. “TDP‐43 Mutant Transgenic Mice Develop Features of ALS and Frontotemporal Lobar Degeneration.” Proceedings of the National Academy of Sciences 106, no. 44: 18809–18814. 10.1073/pnas.0908767106. [DOI] [PMC free article] [PubMed] [Google Scholar]
- Williams, K. L. , Durnall J. C., Thoeng A. D., Warraich S. T., Nicholson G. A., and Blair I. P.. 2009. “A Novel TARDBP Mutation in an Australian Amyotrophic Lateral Sclerosis Kindred.” Journal of Neurology, Neurosurgery, and Psychiatry 80, no. 11: 1286–1288. 10.1136/jnnp.2008.163261. [DOI] [PubMed] [Google Scholar]
- Winton, M. J. , Igaz L. M., Wong M. M., Kwong L. K., Trojanowski J. Q., and Lee V. M.‐Y.. 2008. “Disturbance of Nuclear and Cytoplasmic TAR DNA‐Binding Protein (TDP‐43) Induces Disease‐Like Redistribution, Sequestration, and Aggregate Formation*.” Journal of Biological Chemistry 283, no. 19. 10.1074/jbc.M800342200. [DOI] [PMC free article] [PubMed] [Google Scholar]
- Yu, H. , Lu S., Gasior K., et al. 2021. “HSP70 Chaperones RNA‐Free TDP‐43 Into Anisotropic Intranuclear Liquid Spherical Shells.” Science (New York, N.Y.) 371, no. 6529: eabb4309. 10.1126/science.abb4309. [DOI] [PMC free article] [PubMed] [Google Scholar]
Associated Data
This section collects any data citations, data availability statements, or supplementary materials included in this article.
Supplementary Materials
Figure S1.
Table S1.
Data Availability Statement
The data that support the findings of this study are openly available in ProteomeXchange at https://doi.org/10.6019/PXD054023, reference number PXD054023.