

Abstract
Objective:
This study examined how the COVID-19 pandemic contributed to food insecurity in households in Puerto Rico with children with disabilities, compared to households with children without disabilities.
Methods:
The present study used a 2-group, cross-sectional design. Participants were interviewed once to describe experiences of food insecurity during the 12 months before the COVID-19 pandemic and again during the pandemic lockdown. In addition, demographic characteristics and mental and physical health were assessed.
Results:
Before the COVID-19 pandemic, food insecurity in Puerto Rico was significantly higher in households with children with disabilities (n = 48) than in households with children without disabilities (n = 49) (P < .001). During the COVID-19 pandemic, this difference remained (P = .029). Food insecurity was higher before the pandemic among children in households with children with disabilities (odds ratio [OR]: 3.62; 95% CI:1.19–11.05), and in households overall (OR: 4.72; 95% CI: 1.83–12.14), when assessing adults and children in the same household. This was also true during the pandemic for households overall (OR: 2.54; 95% CI: 1.09–5.96), but to a lesser degree. Food insecurity was not statistically significant in children during the pandemic (OR: 2.56; 95% CI: 0.97–6.74). In both types of households, physical and mental health scores were more than 1 standard deviation below the United States mean.
Conclusion:
Both types of households experienced food insecurity during the pandemic. No relationship between food insecurity, disability, and health status was observed in the study sample. All the participants reported low physical and mental health.
Keywords: Food security, Puerto Rico, Children with special health care needs, Pandemic
Resumen
Objetivo:
Este estudio examinó cómo la pandemia de COVID-19 contribuyó a la inseguridad alimentaria en hogares con niños con discapacidades en comparación con hogares con niños sin discapacidades en Puerto Rico.
Métodos:
Se usó un diseño transversal de dos grupos. Los participantes fueron entrevistados una vez; se les pidió que reportaran su inseguridad alimentaria 12 meses antes de la pandemia de COVID-19 y durante la pandemia. Asimismo, se evaluaron sus características demográficas y su estado de salud física y mental.
Resultados:
Antes de la pandemia de COVID-19, la inseguridad alimentaria en Puerto Rico fue significativamente mayor en los hogares con niños con discapacidades (n=48) en comparación con hogares con niños sin discapacidades (n=49) (p<0.001). Durante la pandemia, esta diferencia significativa continuó (p=0.029). La inseguridad alimentaria fue mayor antes de la pandemia en los niños de hogares con niños con discapacidad (OR: 3.62; 95% CI:1.19–11.05), y en los hogares considerando niños y adultos (OR: 4.72; 95% CI: 1.83–12.14). Esta inseguridad también estuvo presente durante la pandemia, pero en menor magnitud (OR: 2.54; 95% CI: 1.09–5.96). La inseguridad alimentaria no fue estadísticamente significativa en los niños durante la pandemia (OR: 2.56; 95% CI: 0.97–6.74). En ambos tipos de hogares, las puntuaciones de salud física y mental se encontraron por debajo de una desviación estándar para la norma de los Estados Unidos.
Conclusiones:
Durante la pandemia, ambos tipos de hogares presentaron inseguridad alimentaria. No se encontró una relación entre inseguridad alimentaria, discapacidad y estado de salud. Los participantes de ambos tipos de hogares reportaron un bajo nivel de salud física y mental.
Food insecurity, defined as the lack of access to adequate amounts of nutritious food, has been a common outcome of the pandemic (1). There is a delicate connection between nutrition, health, and coping. In Puerto Rico (PR), the COVID-19 pandemic may have altered this balance in homes with children, with more significant disruptions likely to occur in homes with children with disabilities. In 2019, 900 of the 114,900 children aged 0 to 4 years in PR were reported to suffer from 1 or more disabilities; for ages 5 to 15 years, 44,400 of the 378,300 individuals in this age group were reported to suffer from 1 or more disabilities (2). In the US, 14.8% of households with children were food insecure in 2020, an increase from 13.6% in 2019 (3). In PR, the prevalence of food insecurity is almost 3 times that in the US: 33.2% vs. 10.5% (4,5). Data on food security in households with children with and without disabilities is unavailable for PR.
There is limited information in the US on food security in households with children with disabilities (6,7). The exposure of children to food insecurity can predispose them to poor health outcomes in the future (8,9), as well as to experiencing food insecurity as an adult (10). Within households with food insecurity, parents tend to maintain their children’s food security at their own expense (11). This study examined how COVID-19 contributed to food insecurity among households with children with disabilities in PR, and the information it has found will create the foundation for establishing preparedness guidelines that strategically target this vulnerable population.
Participants and Methods
Participants
Adults who were the primary caretakers of children in households with at least 1 child who was 6 years of age or younger with disabilities and households with at least 1 child who was 6 years of age or younger without disabilities were eligible. People who did not live in PR during the COVID-19 pandemic were excluded. We recruited in several settings, including pre-schools, public parks, pediatric physical, occupational, and speech therapy clinics, and through referrals from Head Start programs. Promotional materials explaining the study and containing instructions on how to contact the project coordinator for screening and recruitment were disseminated by email or given personally to families by project staff.
The protocol used for identifying children with disabilities was adapted from Balistreri (6). The Children with Special Health Care Needs Screener was used to identify children with disabilities (12). To meet the inclusion criteria as a child with a disability, the child had to meet at least 1 of the following conditions: require prescription medication for an ongoing long-term health condition, require physical, occupational, or speech therapy, undergo mental or behavioral counseling or treatment, or have a functional limitation. Participants who completed the surveys were 18 years old or older and the primary person in charge of grocery shopping and cooking. Using a non-probabilistic convenience sampling technique, participants were recruited until the expected sample size of 100 households was targeted. Each participant’s residential area was established based on the following PR Department of Health environmental health regions (13): Aguadilla, Arecibo, Bayamón, Caguas, Fajardo, Mayagüez, San Juan, and Ponce. Since 97% of the participants were from San Juan, Bayamón, and Caguas, the analysis focused on data from these 3 cities, collectively known as the Metropolitan area; thus, 2 participants from the Arecibo region and 1 from the Mayagüez region were excluded.
Surveys
The participants completed 2 food insecurity surveys to provide information on the adults and children in their households. One survey collected information from the 12 months before the pandemic and the other collected information from the COVID-19 pandemic. In addition, participants’ demographic characteristics and mental and physical status were assessed. The following instruments were administered:
The Food Security Module used in this study was adapted from the module developed by the Institute of Statistics of PR in 2015 (4), which is itself based on the short version of the US Department of Agriculture (USDA) Household Food Security Survey Module (HFSSM) (14,15). This module contains 10 items that measure household food insecurity by assessing the adequacy of food, including reduced food consumption, reduced food quality, and insufficient resources to obtain the necessary food to maintain adequate health. The severity of food insecurity among children in surveyed households was measured using 8 child-focused questions in the HFSSM (16). The possible raw scores range from 0 to 10 on the adult scale, from 0 to 8 on the children’s scale, and from 0 to 18 on the household scale; a score of 0 indicates the absence of food insecurity, while higher scores indicate higher levels of food insecurity. Food insecure households had raw scores ranging from 3 to 7 (low food security) and from 8 to 18 (very low food security) (17). In this study, households were dichotomized into food secure (scores ranging from 0 to 2) and food insecure (scores ranging from 3 to 18.
The PROMIS Global Health Item Bank v.1.2 (Spanish version) was used to collect information on each participant’s mental and physical status. It has 2 subdomains: Global Physical Health (internal consistency of 0.81) and Global Mental Health (internal consistency of 0.86) (18). It contains 10 items (each of which can be examined separately) on physical function, pain, fatigue, emotional distress, social health, and general perceptions of health. Its value can be transformed into a T-score, which is then compared with the normal distribution of the general population. A score of 50 represents the average for the general population of the US (SD = 10); higher scores reflect better physical and mental health (19).
The sociodemographic characteristics assessed included participant age, sex, income, employment, and housing status; the disability status of household members; the highest educational level of each adult in the household; the marital status of household members; the exact composition of the household (including the number of children); the number of household members with disabilities; the ages of the household members; and whether anyone in the household is participating in 1 or more of the following food and nutrition assistance programs: the Nutrition Assistance Program (NAP); the Special Supplemental Nutrition Program for Women, Infants, and Children (WIC); or the School Lunch Program.
Procedures
A 2-group, cross-sectional design was used. Recruitment began once the study had been approved by the Institutional Review Board (protocol number: 2290033528, Medical Sciences Campus, University of PR). Because of social distancing measures implemented as part of COVID-19 restrictions, almost all the surveys were conducted through Zoom Healthcare, except for a few parents who preferred to be interviewed by phone. After the screening process, eligible participants received an email containing an information sheet. Soon after, project staff contacted eligible participants to explain the study, assess their understanding of it, and schedule an interview session. The data for each participant were entered into REDCap using a code number to preserve anonymity. The web-based software REDCap provides a secure platform for collecting data for research studies (20,21). Two trained interviewers administered the surveys, following a standardized interview protocol. After the interview, a list of organizations providing psychological support and of food banks was sent by email to all the participants. A $20 (US) incentive was provided to the participants following the interview; the project coordinator scheduled the delivery of the incentive. The data were collected from February 2021 through May 2022.
Data analysis
Descriptive statistics were applied to characterize the study sample using measures of central tendency and dispersion for continuous data; frequencies and percentages were used for categorical data. Comparisons between the study groups were conducted using a t test (or Mann–Whitney test) and Pearson’s chi-square (or Fisher’s exact) test. A stratified analysis using chi-square statistics was conducted to compare food insecurity between 2-time points (before and during the COVID-19 pandemic lockdown) across the comparison groups. Food insecurity was defined using the adapted and revised Spanish translation of the HFSSM of the USDA Economic Research Service. Additionally, the distribution of food insecurity among adults and children within the households was assessed using Pearson’s chi-square test. Finally, a stratified analysis of food security categories was performed using the adjusted t scores for mental and physical global health, analyzed by household type. The revised and adapted Spanish translation of the PROMIS Global Health Scale v1.2 was used to define and calculate the t scores for mental and physical global health. For values that resulted in a significant association with the outcome (food insecurity in households with children with and without disabilities), an unadjusted logistic regression analysis, along with the corresponding odds ratios (ORs) and 95% CIs, was performed. The threshold probability for statistical significance was set at 0.05; the analyses were performed using Stata version 18.5 (StataCorp. 2023. Stata Statistical Software: Release 18. College Station, TX: StataCorp LLC.).
Results
A visual overview of the recruitment process is shown in the enrollment flow diagram (Figure 1). The demographic characteristics of the members of the study sample (n = 97) are shown in Table 1; no statistical differences were found between the groups. Of the children with disabilities, 24 had no functional limitations, requiring only such services as physical therapy; 4 children had no functional limitations that required the use of any services or prescription medication; 3 children had no functional limitations, but required prescription medication; and 17 children had a functional limitation alone or in combination with the use of services and/or prescription medication. Most of the households were from the San Juan region (62%), followed by 34% from the Bayamon region and 4% from Caguas.
Figure 1.
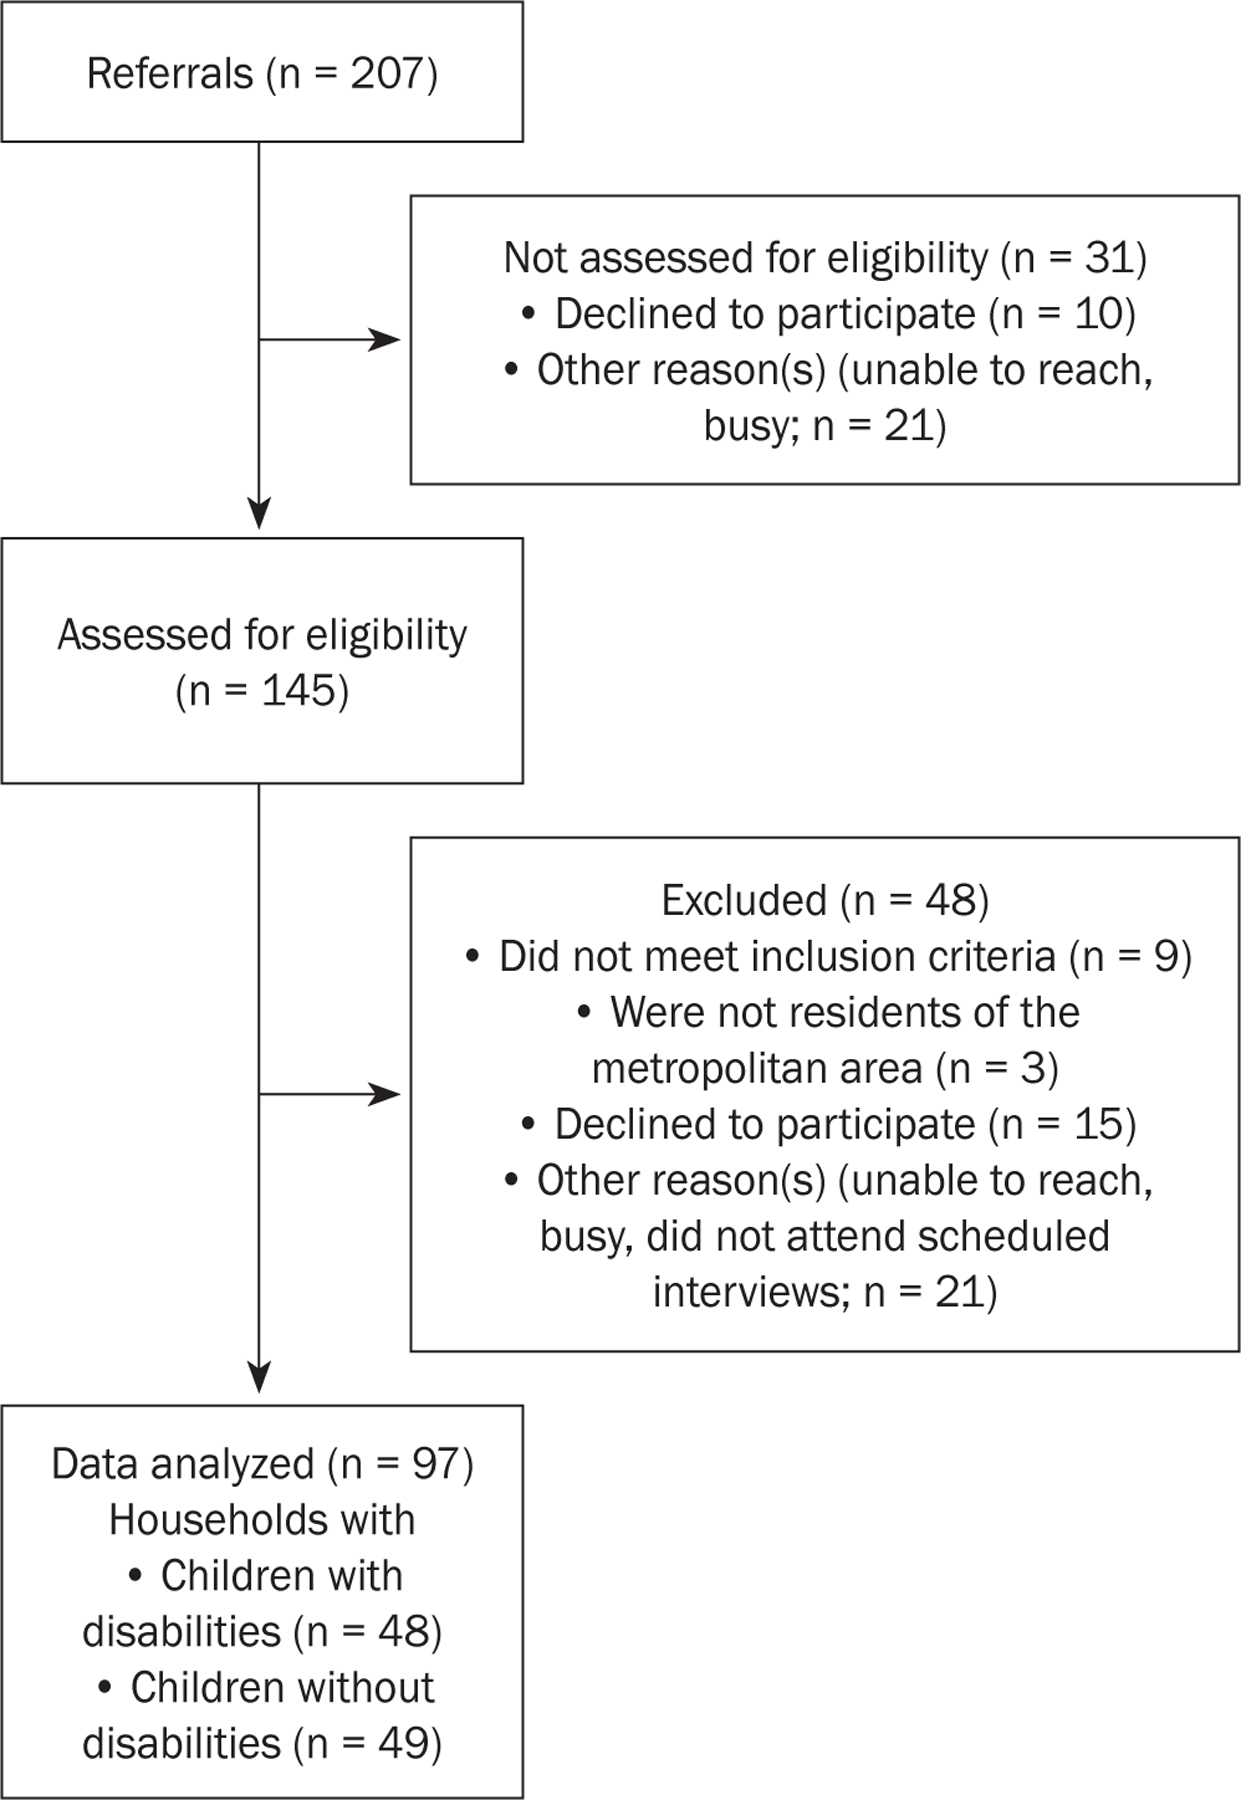
Enrollment Flow Diagram
Table 1.
Sociodemographic characteristics (n = 97)
| Variable | Both groups (n = 100) n (%) |
Households with children without disabilities (n = 49) n (%) |
Households with children with disabilities (n = 48) n (%) |
P valuea |
|---|---|---|---|---|
| n (%) | ||||
| Sex | .495b | |||
| Male | 2 (2.0) | 2 (4.08) | 0 | |
| Female | 95 (97.94) | 47 (95.92) | 48 (100) | |
| Age | .999b | |||
| 18–24 years | 5 (5.15.0) | 3 (6.12) | 2 (4.17) | |
| 25–34 years | 59 (60.82) | 29 (59.18) | 30 (62.50) | |
| 35–54 years | 33 (34.02) | 17 (34.69) | 16 (33.33) | |
| Highest educational level of adults | .364 | |||
| High school | 17 (17.53) | 6 (12.24) | 11 (21.57) | |
| Attended university or technical school; did not graduate | 16 (16.49) | 8 (16.33) | 9 (17.65) | |
| Graduated from university or technical school | 64 (65.98) | 35 (71.43) | 29 (60.42) | |
| Household size | .600b | |||
| 2 to 3 persons | 47 (48.45.0) | 26 (53.06) | 21 (43.75) | |
| 4 to 5 persons | 50 (48.45) | 22 (44.90) | 25 (52.08) | |
| ≥6 persons | 3 (3.09) | 1 (2.04) | 2 (4.17) | |
| Number of people 65 years old or above | 4 (4.12) | 2 (4.08) | 2 (4.17) | >.999b |
| Number of children 6 years old or under | .218b | |||
| 1 child | 68 (70.83) | 37 (75.51) | 32 (66.67) | |
| 2 children | 22 (22.92) | 11 (22.45) | 11 (22.92) | |
| ≥3 children | 6 (6.25) | 1 (2.04) | 5 (10.42) | |
| Number of people in the household who are not family | ||||
| 0 | 93 (95.88) | 48 (97.96) | 45 (93.75) | .362b |
| 1 to 6 persons | 4 (4.12) | 1 (2.04) | 3 (6.25) | |
| Annual income | 0.361 | |||
| <$15,000 | 50 (51.55) | 27 (55.1) | 23 (47.926) | |
| $15,000 to $34,999 | 30 (30.93) | 12 ( 24.49) | 18 (37.5) | |
| ≥$35,000 | 17 (17.53) | 10 (20.41) | 7 (14.58) | |
| Employment status | >.999b | |||
| Employed or self-employed | 42 (43.3) | 21 (42.86) | 21 (43.75) | |
| Unemployed | 19 (19.59) | 10 (20.41) | 9 (18.75) | |
| Housewife/househusband | 27 (27.84) | 13 (26.53) | 14 (29.17) | |
| Student | 9 (9.28) | 5 (10.20) | 4 (8.33) | |
| Marital status | .2225 | |||
| Married or living with a partner | 53 (54.64) | 28 (57.14) | 25 (52.08) | |
| Divorced, separated, widowed | 16 (16.49) | 5 (10.20) | 11 (22.92) | |
| Never married | 28 (28.87) | 16 (32.65) | 12 (25.00) | |
| Housing | .769 | |||
| Owner | 32 (32.99) | 15 (30.61) | 17 (35.42) | |
| Renter | 44 (45.36) | 24 (48.98) | 20 (41.67) | |
| Other arrangement | 21 (21.65) | 10 (20.41) | 11 (22.92) | |
| Change in income during COVID-19 pandemic | .997 | |||
| Decreased | 59 (60.82) | 30 (61.22) | 29 (60.42) | |
| Increased | 10 (10.31) | 5 (10.20) | 5 (10.42) | |
| Remained the same | 28 (28.87) | 14 (28.57) | 14 (29.17) | |
| Benefits | ||||
| NAP | 74 (76.29) | 36 (73.47) | 38 (79.17) | .509 |
| WIC | 65 (67.01) | 33 (67.35) | 32 (66.67) | .943 |
| School lunch program | 29 (290.90) | 13 (26.53) | 16 (33.33) | .464 |
| Foodbank | 3 (3.09) | 2 (4.08) | 1 (2.08) | >.999b |
| None | 11 (11.34) | 5 (10.20) | 6 (12.5) | .721 |
Abbreviations: NAP, Nutrition Assistance Program; WIC, Women, Infants, and Children
Subjects may be included in 1 or more categories (i.e., inclusive categories).
P values were calculated using Pearson’s chi-square test.
P values were calculated using Fisher’s exact test.
P values were calculated using the Mann–Whitney test.
Results showed that before the COVID-19 pandemic, there was a significantly higher prevalence of food insecurity in households with children with disabilities than in households with children without disabilities (47.92% vs. 16.33%, P < .001; Table 2). During the COVID-19 pandemic, the prevalence of food insecurity remained higher in households with children with disabilities. However, the prevalence of food insecurity increased in households with children without disabilities, and the difference between the types of households was significant (47.92% vs. 26.53%, P = .029).
Table 2.
Food insecurity (before and during COVID-19) in all the households with children with and without disabilities (n = 97)
| Food insecurity | Households with children without disabilities (n = 49) n (%) |
Households with children with disabilities (n = 48) n (%) |
P valuea |
|---|---|---|---|
| Before the COVID-19 pandemic | |||
| Food secure | 41 (83.67%) | 25 (52.08%) | <.001 |
| Food insecure | 8 (16.33%) | 23 (47.92%) | |
| During the COVID-19 pandemic | |||
| Food secure | 36 (73.47%) | 25 (52.08%) | .029 |
| Food insecure | 13 (26.53%) | 23 (47.92%) |
Definition: Food insecurity was defined using the revised and adapted Spanish translation of the USDA Economic Research Service’s US Household Food Security Survey Module (14).
P values were calculated using Pearson’s chi-square test.
The distribution of food insecurity within the households is presented in Table 3. Upon further analysis using logistic regression (Table 4), households with children with disabilities had 4.72 times greater odds (95% CI: 1.83–12.14) of having experienced food insecurity before the pandemic compared with households without children with disabilities. This increase was statistically significant (P < .05). Adults in households with children with disabilities had 2.56 times greater odds (95% CI: 0.97–6.74) of having experienced food insecurity before the pandemic compared with adults in households without children with disabilities. This increase was not statistically significant (P > .05). All the children in households with children with disabilities had 3.62 times greater odds (95% CI: 1.19–11.05) of having experienced food insecurity before the pandemic compared with the children in households without children with disabilities. This increase was statistically significant (P < .05).
Table 3.
Distribution of food insecurity among household members comparing adults and children (n = 97)
| Households with children without disabilities (n = 49) n (%) |
Households with children with disabilities (n = 48) n (%) |
P valuea | |
|---|---|---|---|
| Before the COVID-19 pandemic | |||
| Food insecurity in adults | .052 | ||
| Food secure | 41 (83.67) | 32 (66.67) | |
| Food insecure | 8 (16.33) | 16 (33.33) | |
| Food insecurity in children | .019 | ||
| Food secure | 44 (89.80) | 34 (70.83) | |
| Food insecure | 5 (10.20) | 14 (29.17) | |
| During the COVID-19 pandemic | |||
| Food insecurity in adults | .105 | ||
| Food secure | 38 (77.55) | 30 (62.50) | |
| Food insecure | 11 (22.45) | 18 (37.50) | |
| Food insecurity in children | .052 | ||
| Food secure | 41 (83.67) | 32 (66.67) | |
| Food insecure | 8 (16.33) | 16 (33.33) |
Definition: Food insecurity was defined using the revised and adapted Spanish translation of the USDA Economic Research Service’s US Household Food Security Survey Module (14).
P values were calculated using Pearson’s chi-square test.
Table 4.
Logistic regression of the likelihood of food insecurity among household members comparing adults and children (n = 97)
| Before the COVID-19 pandemic | Unadjusted OR | 95% CI | P valued |
|---|---|---|---|
| Food insecurity, overall (adults + children) | |||
| Food secure | REFERENCE | REFERENCE | |
| Food insecure | 4.715 | 1.83–12.14 | <.001 |
| Food insecurity in adults | |||
| Food secure | REFERENCE | REFERENCE | |
| Food insecure | 2.56 | 0.97–6.74 | .056 |
| Food insecurity in children | |||
| Food secure | REFERENCE | REFERENCE | |
| Food insecure | 3.62 | 1.19–11.05 | 0.024 |
| During the COVID-19 pandemic | Unadjusted OR | 95% CI | P valued |
| Food insecurity, overall (adults + children) | |||
| Food secure | REFERENCE | REFERENCE | |
| Food insecure | 2.54 | 1.09–5.96 | .031 |
| Food insecurity in adults | |||
| Food secure | REFERENCE | REFERENCE | |
| Food insecure | 2.07 | 0.85–5.05 | .108 |
| Food insecurity in children | |||
| Food secure | REFERENCE | REFERENCE | |
| Food insecure | 2.56 | 0.97–6.74 | .056 |
Abbreviation: OR, odds ratio
Definition: Food insecurity was defined using the revised and adapted Spanish translation of the USDA Economic Research Service’s US Household Food Security Survey Module (14).
P values were calculated using logistic regression analysis.
During the pandemic, households with children with disabilities had 2.54 times greater odds (95% CI: 1.09–5.96) of having experienced food insecurity compared with households without children with disabilities. This increase was statistically significant (P < .05). Adults in households with children with disabilities had 2.07 times greater odds (95% CI: 0.85–5.05) of having experienced food insecurity compared with adults in households without children with disabilities. This increase was not statistically significant (P = .056). All the children in households with children with disabilities had 2.56 times greater odds (95% CI: 0.97–6.74) of having experienced food insecurity compared with children in households without children with disabilities. This increase was not statistically significant (P > .05).
Table 5 shows the reported mental and physical health status during the COVID-19 pandemic for both household types, categorized by food insecurity status. Households with food security reported fair or poor mental health. Among households with food insecurity, those with children with disabilities had a lower prevalence of fair or poor mental health status than did households without children with disabilities (39.13% vs. 53.85%, P = .39). Regarding physical health status during COVID-19, households with food security reported fair or poor physical health status independent of the type of household (i.e., containing or not containing children with disabilities); this health status was more prevalent among households with children without disabilities compared to those with children with disabilities (94.44% vs. 88.00%, P = .392). Among households with food insecurity, the prevalence of fair or poor physical health was high in both types of households (i.e., those containing or not containing children with disabilities).
Table 5.
Mental and physical health status during the COVID-19 pandemic by levels of food insecurity (n = 97)
| Food insecurity level | Households with children without disabilities (n = 49) n (%) | Households with children with disabilities (n = 48) n (%) | P valuea |
|---|---|---|---|
| Global Mental | |||
| Food Secure (n = 61) | .993 | ||
| Good/very good | 13 (36.11) | 9 (36.00) | |
| Fair/poor | 23 (63.89) | 16 (64.00) | |
| Food Insecure (n = 36) | .393 | ||
| Good/very good | 6 (40.15) | 14 (60.87) | |
| Fair/poor | 7 (53.85) | 9 (39.13) | |
| Global Physical | |||
| Food Secure (n = 61) | .392b | ||
| Good/very good | 2 (5.56) | 3 (12.00) | |
| Fair/poor | 34 (94.44) | 22 (88.00) | |
| Food Insecure (n = 36) | .686b | ||
| Good/very good | 3 (23.08) | 4 (17.39) | |
| Fair/poor | 10 (76.92) | 19 (82.61) |
Definitions: Food insecurity was defined using the revised and adapted Spanish translation of the USDA Economic Research Service’s US Household Food Security Survey Module (14). Global mental health and global physical health were defined using the revised and adapted Spanish translation of the PROMIS Global Health Scale v1.2 (19).
P values were calculated using Pearson’s chi-square test.
P values were calculated using Fisher’s exact test.
Discussion
This study explored food insecurity during the COVID-19 pandemic and the health status of households with children with and without disabilities. In our sample, food insecurity, before and during the pandemic, was higher (47.92%) in households with children with disabilities than was the level of food insecurity reported for the population of PR (33.2%) (4). It has been reported that households with children with disabilities experience twice the rate of food insecurity compared with households with children without any special healthcare needs or with less complex ones (6). The results of our study confirm this disparity. Although this disparity persisted during the pandemic, the food insecurity of households with children without disabilities increased, thus reducing the disparity.
Prior to the pandemic, households with children without disabilities had a food insecurity level below the mean of the population of PR; this food insecurity increased from 16.33% to 26.53% during the pandemic. On the mainland US, food insecurity increased from 15.1% in 2018 to 34.4% in 2020 among households with children aged 12 and under (22). The increase in food insecurity among the households of children without disabilities in PR was also lower than that observed on the mainland US.
During the pandemic, the government of PR implemented strategies to prevent food insecurity, such as opening public-school food services so that families could pick up breakfasts and lunches for students and assigning emergency funds from the US government to increase NAP program resources. The results of our study indicate that more effective strategies were needed to prevent food insecurity in PR during the pandemic. For instance, while the government provided food through public school services, the necessity for adults to work from home may have limited their ability to pick up the food, reducing the effectiveness of this strategy. Steimle et al. (23) reported that in rural Pennsylvania school pick-up rates decreased from 65% before COVID-19 to 30% during COVID-19. Nelson et al. (24) proposed several measures to prevent food insecurity, such as using food trucks for food delivery and increasing support for food banks. As the NAP program has a cap on the amount of federal funding it receives and that funding is not adjusted for inflation, the eligibility of its participants and their benefits are limited (25). Increasing NAP benefits during emergencies, such as a pandemic, requires that PR request an increase from the USDA, and such increases—if approved—take a long time to be implemented. Puerto Rico would benefit from transitioning to the Supplemental Nutrition Assistance Program (SNAP) (26), under which households would receive nutrition assistance according to their needs. Thus, more households in PR would be eligible for assistance with increased benefits, and the funds needed for emergencies—such as a pandemic—would be available more quickly than they are through NAP. This transition is currently being recommended to the US Congress, and lobbying efforts should continue in order to bring it about.
In this study, children in the 2 types of households under discussion experienced food insecurity. On the US mainland, the incidence of food insecurity among children, regardless of disability status, was 9%. This incidence was higher in our study, with families having children with disabilities experiencing an even greater incidence (27). Food insecurity is related to developmental delays, increased risk of disease, slow recovery from disease, increased hospitalization rates, behavioral problems, poor growth, and obesity (28–31). Maintaining food security for children is a crucial safeguard of their welfare and should be of utmost priority for policymakers.
Both physical and mental health T scores in the 2 household types were more than 1 SD below the US average, with households with children without disabilities having slightly lower scores. These low T scores in physical and mental health suggest that high stress was experienced during COVID-19; however, causality cannot be inferred, as no mental or physical health data before COVID-19 are available for comparison. The COVID-19 pandemic caused disruptions in work (e.g., job loss, altered work schedules, and the need to work remotely), school attendance (e.g., school closures and the loss of access to school-based nutrition programs), access to healthcare (e.g., medical, physical, occupational, and speech therapies), and access to critical social and family support networks (e.g., social distancing requirements often limited or removed critical assistance, such as grandparents helping to care for their grandchildren). Demands previously not made on families, such as the need to provide homeschooling or make telemedicine visits with providers and therapists, may have increased anxiety and stress levels within families. It is interesting to note that the lowest physical and mental health scores were observed in households with children without disabilities. One possible explanation is that in these households, the pandemic presented new challenges for which they were unprepared, whereas households with children with disabilities might already have developed adaptive coping strategies (32) to deal with adversity. Additional research is needed to elucidate the factors contributing to this disparity.
In PR, being food secure during the pandemic was not a protective factor against decreased physical and mental health. Our findings are inconsistent with those of Dabone et al. (33), who found that adverse mental health outcomes were associated with food insecurity in African, Caribbean, and Black populations during the COVID-19 pandemic. Similarly, Ward and Lee (34) also reported a significant association between food insecurity and parental anxiety, depression, and stress among 359 parents of children 12 years or younger on the US mainland. A nationwide survey of 2,714 low-income households in the US found that food insecurity was associated with depression and anxiety; households with children reported the highest levels of food insecurity and the worst mental health (35). In our study, no relationship between food insecurity and physical and mental health was found, perhaps due to the limited sample size.
In PR, interventions aimed at promoting physical and mental well-being might be needed as part of future emergency planning for families with children. The government should consider establishing free and secure spaces that would remain open during a pandemic or other kind of emergency, places such as parks and beaches where families with children would be able to engage in leisure activities and get some exercise (36). Exercise programs providing guidelines for safe and effective exercising could be posted on a government website. Educational programs on physical health covering such topics as physical education and physical therapy could be developed on this website, as well as other, non-governmental ones. The government should provide mental health services free of charge, using virtual platforms or the telephone. Currently, PR has a free phone line for mental health emergencies (37). However, there is a need for preventive mental health services. Maintaining a physically and mentally healthy population is one of the best strategies for combating infections and preventing complications during a pandemic (38).
Strengths and limitations
To our knowledge, this study is the first to investigate the impact of the COVID-19 pandemic on food insecurity in PR. Our results add to an understudied area, both on the mainland US (39) and in PR, particularly the distribution of food insecurity among adults and children in a household. The findings of this study could serve as the foundation for developing guidelines for future emergency preparedness protocols, with the goal of fostering food security and promoting mental and physical health in households in PR with children. Supporting food security may prevent adverse health outcomes during a future pandemic, emergency, or disaster.
Our study had several limitations. First, the reliance on the participants’ ability to recall food insecurity before the pandemic using the HFSSM is a limitation to consider. Despite this limitation in recall bias, the HFSSM is currently the recommended measure of food security in the US (40). Second, the sample in this study cannot be considered representative of the population of PR, as it was a relatively small convenience sample, consisting mostly of households in the Metropolitan area (San Juan, Bayamon, and Caguas) (41). As a result, the findings of this study may not be generalizable. This study did not assess the causal relationship between the COVID-19 pandemic and food insecurity. However, we believe that our results reflect the status of food insecurity in households in PR, both with and without children with disabilities, during the COVID-19 pandemic. Due to the limited sample size, we could not explore the association of demographic variables, such as socioeconomic status, with food insecurity; this is an area needing further study.
Conclusions
Food insecurity was present in households with children with disabilities before the COVID-19 pandemic. During the pandemic, both types of households (those with and those without children with disabilities) experienced food insecurity, reducing the disparity between the two that was present before the pandemic. Children in both types of households experienced food insecurity. During the pandemic, the participants’ physical and mental health were below the US average in both types of households. There was no relationship between food insecurity, disability, and health status.
Table 6.
PROMIS Global Health scores (n = 100)
| Variable | Both groups (n = 100) | Households with children without disabilities (n = 49) | Households with children with disabilities (n = 48) | P valuea |
|---|---|---|---|---|
| PROMIS Global Mental T-score | .372b | |||
| Mean (SD) | 39.32 ± 7.00 | 38.68 ± 7.05 | 39.96 ± 6.96 | |
| PROMIS Global Mental Scale | .828c | |||
| Very good | 8 (8.25) | 4 (8.16) | 4 (8.33) | |
| Good | 34 (35.05) | 15 (30.61) | 19 (39.58) | |
| Fair | 46 (47.42) | 25 (51.02) | 21 (43.75) | |
| Poor | 9 (9.28) | 5 (10.20) | 4 (8.33) | |
| PROMIS Global Physical T-score | .185b | |||
| Mean (SD) | 37.50 ± 5.27 | 36.79 ± 5.62 | 38.23 ± 4.84 | |
| PROMIS Global Physical Scale | .682 | |||
| Good | 12 (12.37) | 5 (10.20) | 7 (14.58) | |
| Fair | 47 (48.45) | 23 (46.94) | 24 (50.00) | |
| Poor | 38 (39.18) | 21 (42.86) | 17 (35.42) | |
| PROMIS Global Health Item 1 | ||||
| In general, would you say your health is: | .749 | |||
| Excellent | 0.749 | 0.749 | 0.749 | |
| Very good | 24 (24.74) | 14 (28.57) | 10 (20.83) | .749 |
| Good | 43 (44.33) | 22 (44.90) | 21 (43.75) | |
| Fair/poor | 16 (16.49) | 7 (14.29) | 9 (18.75) | |
| PROMIS Global Health Item 9 | ||||
| In general, please rate how well you carry out your usual social activities and rolesc | .096 | |||
| Excellent | 32 (32.99.0) | 20 (40.82) | 12 (25.00) | |
| Very good | 26 (26.80) | 15 (30.61) | 11 (22.92) | |
| Good | 35 (36.08) | 12 (24.49) | 23 (47.92) | |
| Acceptable/bad | 4 (4.12) | 2 (4.08) | 2 (4.17) |
Abbreviation: PROMIS, patient-reported outcomes measurement information system
Definition: Global mental health and global physical health were defined using the revised and adapted Spanish translation of the PROMIS Global Health Scale v1.2 (19).
P values were calculated using Pearson’s chi-square test.
P values were calculated using a t test.
P values were calculated using Fisher’s exact test.
Acknowledgments
The content is solely the responsibility of the authors and does not necessarily represent the official views of the National Institutes of Health. We wish to acknowledge the participants who volunteered their time, the Head Start programs for referring participants, and the student volunteers who assisted in promoting the study as well as recruiting and screening participants. The authors thank our project coordinator, Mariam Missaghian, who facilitated the enrollment and administration of the project, and Mariely Nieves and Naydi Pérez Ríos, for their commitment to data analysis. Funding: The present study was supported by the University of Puerto Rico Medical Sciences Campus Hispanics-In-Research Capability (HiREC) Endowment, a partnership between the University of Puerto Rico School of Health Professions and School of Medicine (National Institute of Minority Health and Health Disparities award number S21MD001830) and by the Hispanic Alliance for Clinical and Translational Research (Alliance, National Institute of General Medical Sciences award number U54GM133807).
Footnotes
The authors have no conflict of interest to disclose.
References
- 1.Kakaei H, Nourmoradi H, Bakhtiyari S, Jalilian M, Mirzaei A. Effect of COVID-19 on food security, hunger, and food crisis. In: Dehghani MH, Karri RR, Roy S, eds. COVID-19 and the Sustainable Development Goals. Elsevier; 2022:3–29. doi: 10.1016/B978-0-323-91307-2.00005-5 [DOI] [Google Scholar]
- 2.Erickson W, Lee C, von Schrader S. 2019 Disability Status Report: United States. Cornell University Yang Tan Institute on Employment and Disability; 2023. Accessed August 29, 2023. https://disabilit-ystatistics.org/report/html/2019/2000000
- 3.Hales L, Coleman-Jensen A. Food insecurity for households with children rose in 2020, disrupting decade-long decline. Amber Waves. Economic Research Service, U.S. Department of Agriculture. February 7, 2022. Accessed August 29, 2023. https://www.ers.usda.gov/amber-waves/2022/february/food-insecurity-for-households-with-children-rose-in-2020-disrupting-decade-long-decline/ [Google Scholar]
- 4.Santiago-Torres M, Román-Meléndez EM, Rodríguez-Ayuso IR, Ríos-Vázquez Z. Seguridad alimentaria en Puerto Rico. Instituto de Estadísticas de Puerto Rico. 2019. Accessed August 29, 2023. https://estadisticas.pr/files/Publicaciones/Seguridad%20Alimentaria%20en%20Puerto%20Rico%20-%20Final%20%28300519%29.pdf [Google Scholar]
- 5.Coleman-Jensen A, Rabbitt MP, Gregory CA, Singh A. Household Food Security in the United States in 2020, ERR-298, U.S. Department of Agriculture, Economic Research Service. 2021. Available at: https://www.ers.usda.gov/webdocs/publications/102076/err-298.pdf?v=84.4. Accessed August 29, 2023. [Google Scholar]
- 6.Balistreri KS. Food insufficiency and children with special health-care needs. Public Health. 2019;167:55–61. doi: 10.1016/j.puhe.2018.11.011 [DOI] [PMC free article] [PubMed] [Google Scholar]
- 7.Sonik RA, Coleman-Jensen A, Parish SL. Household food insufficiency, health status and emergency healthcare utilisation among children with and without special healthcare needs. Public Health Nutr 2020;23(17):3204–3210. doi: 10.1017/S1368980020000361 [DOI] [PMC free article] [PubMed] [Google Scholar]
- 8.Gallegos D, Eivers A, Sondergeld P, Pattinson C. Food Insecurity and Child Development: A State-of-the-Art Review. Int J Environ Res Public Health. 2021;18(17):8990. Published 2021 Aug 26. doi: 10.3390/ijerph18178990 [DOI] [PMC free article] [PubMed] [Google Scholar]
- 9.Hartline-Grafton H, Hassink SG. Food Insecurity and Health: Practices and Policies to Address Food Insecurity among Children. Acad Pediatr 2021;21(2):205–210. doi: 10.1016/j.acap.2020.07.006 [DOI] [PMC free article] [PubMed] [Google Scholar]
- 10.Testa A, Jackson DB. Adverse Childhood Experiences and Food Insecurity in Adulthood: Evidence From the National Longitudinal Study of Adolescent to Adult Health. J Adolesc Health. 2020;67(2):218–224. doi: 10.1016/j.jadohealth.2020.02.002 [DOI] [PubMed] [Google Scholar]
- 11.Coleman-Jensen A, Rabbit MP, Gregory CA, Singh A. Household food security in the United States in 2021. ERR-309. U.S. Department of Agriculture, Economic Research Service; 2022. [Google Scholar]
- 12.The Foundation for Accountability. Children with special health care needs (CSHCN) screener. 2002. Accessed August 29, 2023. https://www.childhealthdata.org/docs/cshcn/technical-summary-of-cshcn-screener.pdf
- 13.Puerto Rico Department of Health. Relación de pueblos que componen las regiones de salud ambiental [The list of towns that make up the environmental health regions]. Accessed August 24, 2023. https://www.salud.pr.gov/menuInst/download/797
- 14.Bickel G, Nord M, Price C, Hamilton W, Cook J. Guide to Measuring Household Food Security, Revised 2000. U.S. Department of Agriculture, Food and Nutrition Service; March 2000. Accessed August 29, 2023. https://fns-prod.azureedge.us/sites/default/files/FS-Guide.pdf [Google Scholar]
- 15.Neff R Introduction to the US Food System: Public Health, Environment, and Equity. Wiley; 2014. [PubMed] [Google Scholar]
- 16.Harrison GG, Stormer A, Herman DR, Winham DM. Development of a Spanish-language version of the U.S. household food security survey module. J Nutr 2003;133(4):1192–1197. doi: 10.1093/jn/133.4.1192 [DOI] [PubMed] [Google Scholar]
- 17.U.S. Department of Agriculture, Economic Research Service. Household food security in the United States in 2012 [in Spanish]. Published November 2013. Accessed March 21, 2023. https://www.ers.usda.gov/media/8285/hh2012spanish.pdf
- 18.Hays RD, Bjorner JB, Revicki DA, Spritzer KL, Cella D. Development of physical and mental health summary scores from the patient-reported outcomes measurement information system (PROMIS) global items. Qual Life Res 2009;18(7):873–880. doi: 10.1007/s11136-009-9496-9 [DOI] [PMC free article] [PubMed] [Google Scholar]
- 19.Health Measures. PROMIS. Accessed August 22, 2023. https://www.healthmeasures.net/score-and-interpret/interpret-scores/promis [Google Scholar]
- 20.Harris PA, Taylor R, Minor BL, et al. The REDCap consortium: Building an international community of software platform partners. J Biomed Inform 2019;95:103208. doi: 10.1016/j.jbi.2019.103208 [DOI] [PMC free article] [PubMed] [Google Scholar]
- 21.Harris PA, Taylor R, Thielke R, Payne J, Gonzalez N, Conde JG. Research electronic data capture (REDCap)--a metadata-driven methodology and workflow process for providing translational research informatics support. J Biomed Inform 2009;42(2):377–381. doi: 10.1016/j.jbi.2008.08.010 [DOI] [PMC free article] [PubMed] [Google Scholar]
- 22.Bauer L The COVID-19 crisis has already left too many children hungry in America. Brookings. May 6, 2020. Accessed March 28, 2023. https://www.brookings.edu/blog/up-front/2020/05/06/the-covid-19-crisis-has-already-left-too-many-children-hungry-in-america/ [Google Scholar]
- 23.Steimle S, Gassman-Pines A, Johnson AD, Hines CT, Ryan RM. Understanding patterns of food insecurity and family well-being amid the COVID-19 pandemic using daily surveys. Child Dev 2021;92(5):e781–e797. doi: 10.1111/cdev.13659 [DOI] [PMC free article] [PubMed] [Google Scholar]
- 24.Nelson E, Bangham C, Modi S, et al. Understanding the impacts of COVID-19 on the determinants of food insecurity: A state-specific examination. Prev Med Rep 2022;28:101871. doi: 10.1016/j.pmedr.2022.101871 [DOI] [PMC free article] [PubMed] [Google Scholar]
- 25.Keith-Jennings B, Wolkomir E. How does household food assistance in Puerto Rico compare to the rest of the United States? Center on Budget and Policy Priorities. 2020. Accessed March 30, 2023. https://www.cbpp.org/research/food-assistance/how-does-household-food-assistance-in-puerto-rico-compare-to-the-rest-of [Google Scholar]
- 26.Gundersen C, Strayer M, Dewey A, Hake M, Engelhard E. Map the Meal Gap 2022: An analysis of county and congressional district food insecurity and county food cost in the United States in 2020. Feeding America. 2022. Accessed August 24, 2023. https://www.feedingamerica.org/sites/default/files/2022-09/Map%20the%20Meal%20Gap%202022%20Report_0.pdf [Google Scholar]
- 27.U.S. Department of Agriculture Economic Research Service. Food security in the U.S. Key statistics & graphics. June 20, 2023. Updated September 04, 2024. Accessed August 22, 2023. https://www.ers.usda.gov/topics/food-nutrition-assistance/food-security-in-the-u-s/key-statistics-graphics/
- 28.Paslakis G, Dimitropoulos G, Katzman DK. A call to action to address COVID-19-induced global food insecurity to prevent hunger, malnutrition, and eating pathology. Nutr Rev 2021;79(1):114–116. doi: 10.1093/nutrit/nuaa069 [DOI] [PMC free article] [PubMed] [Google Scholar]
- 29.Food Security Information Network. 2020 Global report on food crises: Joint analysis for better decisions. 2020. Food and Agriculture Organization (FAO); World Food Programme (WFP); and International Food Policy Research Institute (IFPRI). Accessed August 29, 2023. https://www.fsinplatform.org/global-report-food-crises-2020 [Google Scholar]
- 30.Moradi S, Mirzababaei A, Mohammadi H, et al. Food insecurity and the risk of undernutrition complications among children and adolescents: A systematic review and meta-analysis. Nutrition. 2019;62:52–60. doi: 10.1016/j.nut.2018.11.029 [DOI] [PubMed] [Google Scholar]
- 31.Hines CT, Markowitz AJ, Johnson AD. Food insecurity: what are its effects, why, and what can policy do about it? Am J Public Health. 2022;8(2):e23727322211032250. doi: 10.1177/23727322211032250 [DOI] [Google Scholar]
- 32.Fairfax A, Brehaut J, Colman I, et al. A systematic review of the association between coping strategies and quality of life among caregivers of children with chronic illness and/or disability. BMC Pediatr 2019;19(1):215. Published 2019 Jul 1. doi: 10.1186/s12887-019-1587-3 [DOI] [PMC free article] [PubMed] [Google Scholar]
- 33.Dabone C, Mbagwu I, Muray M, et al. Global Food Insecurity and African, Caribbean, and Black (ACB) Populations During the COVID-19 Pandemic: a Rapid Review. J Racial Ethn Health Disparities. 2022;9(2):420–435. doi: 10.1007/s40615-021-00973-1 [DOI] [PMC free article] [PubMed] [Google Scholar]
- 34.Ward KP, Lee SJ. Associations of food insecurity and material social support with parent and child mental health during COVID-19. Child Youth Serv Rev 2022;140:106562. doi: 10.1016/j.childyouth.2022.106562 [DOI] [PMC free article] [PubMed] [Google Scholar]
- 35.Fang D, Thomsen MR, Nayga RM Jr. The association between food insecurity and mental health during the COVID-19 pandemic. BMC Public Health. 2021;21(1):607. Published 2021 Mar 29. doi: 10.1186/s12889-021-10631-0 [DOI] [PMC free article] [PubMed] [Google Scholar]
- 36.Slater SJ, Christiana RW, Gustat J. Recommendations for Keeping Parks and Green Space Accessible for Mental and Physical Health During COVID-19 and Other Pandemics. Prev Chronic Dis 2020;17:E59. Published 2020 Jul 9. doi: 10.5888/pcd17.200204 [DOI] [PMC free article] [PubMed] [Google Scholar]
- 37.Mental Services Administration Health and Addiction of Puerto Rico. Línea PAS. Accessed October 24, 2023. https://lineapas.assmca.pr.gov/Pages/Home.aspx [Google Scholar]
- 38.Lange KW, Nakamura Y. Lifestyle factors in the prevention of COVID-19. Glob Health J 2020;4(4):146–152. doi: 10.1016/j.glohj.2020.11.002 [DOI] [PMC free article] [PubMed] [Google Scholar]
- 39.Schwartz N, Buliung R, Wilson K. Disability and food access and insecurity: A scoping review of the literature. Health Place. 2019;57:107–121. doi: 10.1016/j.healthplace.2019.03.011 [DOI] [PubMed] [Google Scholar]
- 40.Marques ES, Reichenheim ME, de Moraes CL, Antunes MM, Salles-Costa R. Household food insecurity: a systematic review of the measuring instruments used in epidemiological studies. Public Health Nutr 2015;18(5):877–892. doi: 10.1017/S1368980014001050 [DOI] [PMC free article] [PubMed] [Google Scholar]
- 41.United States Census. Metropolitan and micropolitan statistical areas of the United States and Puerto Rico. 2020. Accessed August 29, 2024. https://www2.census.gov/geo/maps/metroarea/us_wall/Mar2020/CBSA_WallMap_Mar2020.pdf