

Abstract
Recent developments in clearing and microscopy enable 3D imaging with cellular resolution up to the whole organ level. These methods have been used extensively in neurobiology, but their uptake in other fields has been much more limited. Application of this approach to the human heart and effective use of the data acquired present challenges of scale and complexity. Four interlinked issues need to be addressed: 1) efficient clearing and labelling of heart tissue, 2) fast microscopic imaging of human-scale samples, 3) handling and processing of multi-terabyte 3D images, and 4) extraction of structural information in computationally tractable structure-based models of cardiac function. Preliminary studies show that each of these requirements can be achieved with the appropriate application and development of existing technologies.
Keywords: Cardiac tissue, Extended-volume imaging, Image processing, Microscopy, Network modelling, Tissue clearing
1. Introduction
There is an unmet need for large-scale imaging with cellular resolution in normal and diseased hearts. Cardiac dysfunction at the organ level is commonly associated with structural derangement of the myocardium, or of the blood vessels and autonomic nerves that sustain and modulate the electrical and mechanical activity of cardiac muscle cells. To understand these processes, we need to quantify cardiac structure and model heart function across a range of scales from cell to tissue levels. Such analyses are required for animal models of heart disease, and post mortem or explanted human hearts.
To date, extended 3D cardiac microscopy has been constrained by the fact we cannot “see” inside the heart wall. However, new imaging methods developed primarily for neurobiology could substantially overcome this limitation. Enhanced tissue clearing techniques have been used to minimise light scattering in large brain specimens and render them transparent (Chung et al., 2013; Gómez-Gaviro et al., 2020), while novel high-throughput imaging systems (Tomer et al., 2014; Glaser et al., 2019) have enabled 3D neural pathways in the rat brain to be reconstructed in unprecedented detail.
These approaches offer the prospect of characterising mesoscale cardiac structure in much larger tissue volumes than has previously been possible. However, numerous challenges need to be addressed before this promise can be realised. Heart and brain are very different tissues. Because myocardium is pigmented and protein-dense with an extensive network of extracellular connective tissue matrix (ECM), customised methods are needed for effective tissue clearing and labelling. For the human heart, in particular, the regions of interest are large. This imposes restrictions on the imaging strategies used, while the large data volumes acquired necessitate the development of more efficient platforms for image post-processing, storage, visualisation, and analysis. Finally, to fully exploit the opportunities presented by such extensive structural data sets, they should be complemented by image-based modelling tools that capture critical relationships between structure and function in the heart at the tissue level.
In this paper, we seek to share what members of our group have learned during ongoing research that addresses these issues. We review relevant work by others and illustrate this with the results of preliminary studies in our laboratory. The following are considered: 1) efficient clearing and labelling of heart tissue, 2) fast microscopic imaging of human-scale samples, 3) handling and processing of terascale 3D images, and 4) extraction of structural information in computationally tractable structure-based models of cardiac function.
2. Tissue fixation, clearing and fluorescent labelling
Development of comprehensive anatomic and computational models of the heart depends on imaging diverse proteins throughout extended volumes of cardiac tissue. Fluorescent labelling is the most versatile method for detecting protein expression (Holmes and Lantz, 2001) and optical clearing is necessary for fluorescence imaging of thick tissue specimens. The techniques used should be safe, inexpensive, effective over depths on the order of millimetres and enable the timely delivery of appropriate fluorescent probes throughout the region to be imaged. Most tissue clearing and labelling techniques were developed for the brain and are not optimised for cardiac tissue. Here we review the approaches used and highlight those best suited to cardiac imaging.
2.1. Tissue fixation
Specimens must first be fixed to preserve protein and tissue structure during the subsequent clearing process. Paraformaldehyde (PFA) is one of the most commonly used fixatives and causes rapid cross-linking of proteins, glycoproteins, nucleic acids and polysaccharides within 24 h (Helander, 1994). Long-term storage in PFA will result in more highly fixed specimens that may be harder to fluorescently label and clear as cross-linking could mask protein labelling targets and conditions within the sample become more acidic over time and therefore less favourable for solubilising biomolecules such as proteins, lipids and nucleic acids (Tainaka et al., 2016). However, archival specimens which have been stored for over 30 years in formalin can still be cleared and immunofluorescently labelled for some protein targets (Lai et al., 2018), so storage conditions should be optimised to maintain antigenicity of proteins on an empirical basis. Where long term storage in PFA/formalin is not compatible with particular antibodies, specimens can be transferred to cryoprotectant solution (composition in mol/L: 0.63 sucrose, 0.04 Na2HPO4, 0.16 NaH2PO4, and 7.69 ethylene glycol) and stored at −20 °C. Fixation with PFA can be stopped by rinsing with neutral phosphate buffered saline, and samples can be stored at 4 °C by adding a preservative such as sodium azide (0.01–0.025%) to prevent specimen contamination.
PFA covalently links proteins into physically contiguous networks which do not include isolated proteins (Tainaka et al., 2016). Alternatives which address this issue include covalently linking proteins to a hydrogel matrix which enhances the physical and chemical strength of the specimen (Gradinaru et al., 2018). Glutaraldehyde is also a stronger fixative than PFA, preserving lipids and small molecules such as neurotransmitters through the clearing process, but it does not diffuse as easily into thick specimens compared to PFA (Hopwood, 1967) and also produces substantial autofluorescence (Murray et al., 2015).
2.2. Tissue clearing
Biological tissue is rendered opaque by light scattering and wavelength-dependent absorption of light. Light is scattered as a result of refractive index (RI) mismatch: at cell boundaries, between membrane phospholipids and aqueous intra- and extracellular domains; within cells at the membranous boundaries of organelles such as mitochondria and sarcoplasmic reticulum; and, finally, due to large ECM proteins such as collagen or groups of fat cells. Light transmission is also attenuated by pigments such as heme which absorb light within the visible wavelength range. Myocardium is inherently more opaque than brain tissue due to the dense packing of cardiomyocytes, the extensive distribution of intracellular organelles, widespread collagen expression within the ECM and the high concentration of the heme-containing myoglobin in cardiac muscle cells, which is the major contributor to the pigmentation of the heart and gives myocardium a greater absorption coefficient compared to brain (Mesradi et al., 2013). Comparisons of tissue scattering are variable and inconclusive (Jacques, 2013) and appear to be highly dependent on the particular tissue tested and the methods used, however values appear to be similar overall between brain and heart.
Tissue clearing methods aim to increase RI uniformity throughout specimens by extracting lipids (delipidation) and subsequently incubating in RI matching solutions. Light transmission is maximised by removal or bleaching of light-absorbing pigments (decolouration). Current clearing strategies have been reviewed in detail recently (Gómez-Gaviro et al., 2020; Ueda et al., 2020a, 2020b) and these methods divide into two broad categories: Hydrophobic methods in which organic solvents are used for delipidation and RI matching and hydrophilic methods in which aqueous solvents are utilised for these purposes.
With hydrophobic methods, specimens are first dehydrated using alcohols or ethers to remove water – a major source of light scattering in tissue. These reagents also remove lipids, but additional organic solvents are commonly used for increased delipidation (Ueda et al., 2020a). Specimens are decoloured with hydrogen peroxide (Renier et al., 2014) or amino alcohols (Masselink et al., 2019). Finally, combinations of organic solvents (often reflected in the acronyms that distinguish these methods) are used for RI matching. These include benzyl alcohol and benzyl benzoate (BABB (Sivaguru et al., 2015)), polyethylene glycol (PEGASOS (Jing et al., 2018)), ethyl cinnamate (2 ECi (Masselink et al., 2019)), as well as dibenzyl ether (3DISCO (Ertürk et al., 2012) and iDISCO (Renier et al., 2014)). Hydrophobic methods enable rapid clearing (1–2 days for a mouse heart (Sivaguru et al., 2015; Rajendran et al., 2019)) with RI > 1.5 (well suited to cardiac tissue where protein content is high). A significant disadvantage is that the organic solvents used for RI matching are generally toxic. They are also corrosive to microscope objectives (Ariel, 2017), although reagents such as ethyl cinnamate (Klingberg et al., 2017; Masselink et al., 2019) offer a safer alternative. In addition, some hydrophobic methods can quench endogenously-expressed fluorescent proteins (Becker et al., 2012) and alter the epitopes to which antibody-based probes bind. Furthermore, because most exogenous fluorophores are water-soluble, they must be delivered before dehydration or after rehydration, and substantial permeabilisation is needed for effective distribution of antibody-based labels throughout thick specimens. Finally, hydrophobic clearing can give rise to substantial and potentially non-uniform tissue shrinkage (Becker et al., 2012; Renier et al., 2016).
Hydrophilic tissue clearing methods use aqueous-based solutions for delipidation, decolouration and RI matching to overcome the problems listed above. The intense research activity in this area was initiated by the development of CLARITY (Chung et al., 2013). Whole mouse brains and human brain specimens were incorporated into tissue-hydrogel composites, and lipids were extracted by circulating the ionic detergent sodium dodecyl sulphate (SDS), which could be driven through the specimen by a uniform electric field (electrophoresis). This process enabled lipids to be removed from cell membranes and organelles but preserved proteins and tissue structure. Antibody-based fluorescent labels were also distributed by electrophoresis and specimens could be re-labelled on multiple occasions following detergent-mediated antibody removal, again using electro-transport. Finally, RI matching was performed in either glycerol (85%) (Chung et al., 2013) or FocusClear, a proprietary tissue-clearing agent with a high RI (Richardson and Lichtman, 2015). This elegant approach has proved robust with the added advantage that endogenous fluorescent proteins are well preserved (Rajendran et al., 2019). Despite this, criticisms have been raised about 1) the complexity of the approach and the difficulty of scaling it (Susaki et al., 2014; Epp et al., 2015; Du et al., 2019), 2) prolonged clearing times in large tissue specimens (Susaki et al., 2014; Du et al., 2019), 3) the potential for tissue damage during electrophoresis (Kim et al., 2015), and 4) tissue deformation during delipidation which is comparable to that seen with hydrophobic methods (Park et al., 2019).
Some of these issues have been addressed by more recent technical refinements. While clearing times are extended if diffusion is used for delipidation in tissue-hydrogel composites (Yang et al., 2014), rapid clearing can be achieved by combining electro-transport with simple SDS circulation systems (Du et al., 2019). Structural distortion during SDS-based tissue clearing can be substantially reduced by using cross-linkers that preserve protein structure such as the SHIELD protocol (Park et al., 2019). It has also been shown that tissue damage due to electrophoresis can be prevented by careful titration of the applied voltage to limit excessive heating (Epp et al., 2015). Furthermore, slow rotation of the electric field with respect to the specimen allows the application of higher field strengths without tissue damage and improves the efficiency of SDS-based tissue clearing (Kim et al., 2015).
Numerous hydrophilic tissue clearing methods have been developed for specimens that have not been incorporated into a hydrogel composite (Ueda et al., 2020a). Most appear to be relatively ad hoc and are identified by a bewildering array of acronyms (e.g. (Scale (Hama et al., 2011), SeeDB (Ke et al., 2013), ClearT (Kuwajima et al., 2013), ClearSee (Kurihara et al., 2015), UbasM (Chen et al., 2017), Ce3D (Li et al., 2017a), MACS (Zhu et al., 2020)). A mixture of detergents is used to dissolve phospholipids (Hama et al., 2011; Kurihara et al., 2015; Li et al., 2017a). Decolouration agents are also, in some cases, applied initially to remove heme (Ueda et al., 2020a). RI matching is then achieved by incubating the specimen in high concentration solutions of water-soluble substances that produce an appropriate RI. These include fructose (Ke et al., 2013), xylitol (Kurihara et al., 2015) and the contrast agent iohexol (Li et al., 2017a). Ueda and co-workers took a systematic approach to this problem, employing comprehensive chemical profiling to characterise the best combinations of hydrophilic tissue-clearing reagents for a range of applications (Susaki et al., 2014). Their initiative is referred to as “clear, unobstructed brain or body imaging cocktails and computational analysis” or CUBIC. They identified a series of amino alcohols with excellent delipidation and decolouration properties (Tainaka et al., 2014, 2018) and confirmed that addition of urea improves tissue clearing (Tainaka et al., 2016). Finally, they characterised a group of polyhydric alcohols derived from sugars (Tainaka et al., 2018) that are optimal RI matching agents. Advanced CUBIC protocols perform at least as well as hydrophobic methods with mouse hearts taking on the order of a week to clear and human heart specimens up to two weeks (Tainaka et al., 2018). Hydrophilic clearing has the added advantage of better protein preservation and biocompatibility (Tainaka et al., 2018). Unlike hydrophobic and some other hydrophilic clearing methods (Tainaka et al., 2016), advanced CUBIC protocols reportedly result in minimal tissue deformation (Tainaka et al., 2016, 2018).
2.3. Fluorescent labelling
Three strategies are currently available for the fluorescent labelling of proteins that characterise key tissue structures: 1) endogenous expression of genetically-encoded fluorescent proteins; 2) small-molecule fluorescent probes; and 3) antibody-based methods. Because the first of these is typically delivered by viral vectors, its use has been restricted to animals (Rajendran et al., 2019) and cultured human tissue (Ou et al., 2019; Vormstein-Schneider et al., 2020). For further details, the reader is referred to recent reviews (Bedbrook et al., 2018; Nectow and Nestler, 2020).
Small molecule fluorescent probes are particularly well suited to tissue clearing methods because they diffuse relatively quickly in thick specimens and specific molecules and structures can be identified by conjugating fluorophores to both synthetic and naturally occurring peptides. Examples include the collagen marker CNA35 (Chen et al., 2011), phalloidin, which binds to filamentous actin, and wheat-germ agglutinin (WGA) and other lectins which bind to glycosylated proteins in the ECM (Nehrhoff et al., 2016; Crossman et al., 2017). Alternately, labelling of widespread chemical functional groups (e.g. amines, oxidised carbohydrates) can provide the contrast necessary to identify key cellular features in cleared tissue specimens (Mao et al., 2020).
Antibodies provide gold-standard specific detection of protein targets, but these relatively large molecules diffuse slowly in tissue with limited penetration into thick specimens. Tissue clearing often facilitates antibody diffusion by enhancing permeability but can disrupt antibody binding by permanently altering epitopes (Ueda et al., 2020b). Extensive curated lists of antibodies compatible with various clearing techniques have been published or are available online (e.g. iDISCO, 2015).
Applying an electric field can help drive antibody diffusion through thick specimens (electrophoresis) (Kim et al., 2015), and is necessary where specimens are incorporated into cross-linked hydrogels (Chung et al., 2013; Park et al., 2019). Electrophoresis also enables repeated rounds of labelling to be performed for multiplexed imaging, which would otherwise be prohibitively slow if relying on diffusion for antibody transport (Chung et al., 2013). Intuitively, depth penetration of antibodies would be expected to improve with increased incubation temperature and incubation time. The extent of antibody diffusion has been measured in cleared brain (Li et al., 2015; Treweek et al., 2015) and cardiac tissue (Nehrhoff et al., 2016) specimens, but the impact of temperature and incubation time has not been studied systematically.
Fig. 1 shows examples which demonstrate the decolouration and improvement in transparency achieved using the CUBIC reagents on human heart tissue, and illustrate the diffusion profile in CUBIC-cleared cardiac tissue of immunoglobulin G (raised against connexin-43 (Cx43)) and fluorescent conjugated peptide (WGA). Being a smaller molecule, WGA diffused further into the tissue than the antibody (Fig. 1E), but the results show specimens up to 1 mm in thickness can be labelled throughout with diffusion of both types of probes. Decolouration and light scattering were quantified from tissue macrographs and these measures showed much of the clearing occurred rapidly over the first five days (Supplementary Fig. S1).
Fig. 1.

Cardiac tissue clearing with CUBIC reagents and subsequent labelling with diffusion of fluorescent probes. Transmural slices of human right ventricular myocardium (0.75 mm thick) were cleared in CUBIC reagents for 12 days. Macrographs acquired before clearing (A) and following final RI matching (B) demonstrate the extent of decolouration and improvement in transparency achieved. In a separate set of experiments, rat hearts were cleared with CUBIC reagents using Langendorff perfusion. Segments of left ventricle were incubated with antibodies (IgG) raised against connexin-43 (Cx43), and wheat germ agglutinin (WGA) conjugated to a fluorescent dye (CF-488). The segments were then cut parallel to the direction of diffusion and secondary antibodies applied to the cut surface to detect anti-Cx43 IgG. Maximum intensity projections produced from confocal Z-stacks show the extent of diffusion of anti-Cx43 IgG (C) and WGA (D) (white arrows indicate diffusion direction). Fick’s law was fitted to normalised intensity values (Li et al., 2015) generating diffusion profiles (E) with high values, indicating diffusion-dependent fluorescent labelling. These results suggest that 1 mm-thick specimens can be labelled throughout by diffusing IgG and WGA from opposing surfaces.
3. High throughput 3D imaging
Systematic information about the 3D architecture of myocardium in normal and diseased hearts at the cellular level is surprisingly limited. We require more comprehensive data about the organisation of cardiac muscle cells, coronary blood vessels, autonomic nerves and the ECM in extended regions from explanted human hearts to complete murine hearts. These data should also encompass detail on components associated with connectivity and communication within the structures (e.g. intercalated disks (ICDs), connexin plaques, fibroblasts).
These requirements impose the following ideal conditions on imaging systems intended for this purpose: isotropic voxel resolution from 0.5 to 5 μm across a wavelength range appropriate for imaging standard fluorescent labels (400–750 nm) at data rates that enable specimens with dimensions up to multiple centimetres to be imaged and reconstructed in hours to days. As yet, no imaging platform that meets these specifications fully has been reported. However, high-throughput systems which approach them are actively being developed for brain imaging in particular (Migliori et al., 2018; Chakraborty et al., 2019; Fei et al., 2019; Glaser et al., 2019). Here, we outline the physical constraints that will have to be addressed in order to achieve this goal and recent technical developments that should make it possible.
3.1. Imaging fundamentals
The resolving power of a microscope is limited by the diffraction pattern of the point spread function (PSF) of the light collected (Sanderson, 2019). The PSF of an objective lens is inherently anisotropic (see Fig. 2A). For example, the lateral resolution of an objective with a numerical aperture (NA) of 1 is ~336 nm for a wavelength of 600 nm, where is the full-wave half-maximum diameter of the PSF at the focus. In contrast, the axial distance over which the PSF is of its focal value is ~1.38 μm when the objective is immersed in a fluid with an RI of 1.5. With fluorescence microscopy, the effective PSF is the product of excitation and detection PSF, and in epifluorescence microscopes, both are determined by the objective which improves resolution.
Fig. 2.

Optics of high throughput microscopic imaging. (A) Point spread function (PSF) of an objective lens. Parallel light entering the back plane of the objectives is focused and light paths adjacent to the focal point are shown at the centre. The PSF (right) represents the full-wave half-maximum boundary for the power distribution in the focal region. Middle panel: Light sheet microscopy configurations. (B) Selective plane illumination microscopy (SPIM), (C) Inverted SPIM (iSPIM), (D) Light sheet theta microscopy, and (E) Open-top light sheet microscopy. Lower panel: Stage-scanning line confocal microscopy. (F) Optical configuration, (G) a stage-scanning line confocal microscope, and (H) stage scanning procedure. Mauve arrows indicate illumination light and green fluorescent emission. In (G), a light plane formed with a cylindrical lens assembly is directed into (1) a 25 × objective lens (Olympus XLSLPLN25XGMP, 1.0 NA, 8 mm WD, RI 1.41–1.52) via (2) a dichroic mirror (Semrock) and focused within cleared cardiac tissue specimens. Fluorescent emission excited at 405, 488, 561, and 640 nm (Toptica iChrome MLE) is detected using (3) a sCMOS camera (Hamamatsu Orca Flash 4.0v2). 3D image volumes are assembled by 3-axis stage scanning. Sequential image frames (2048 × 8 pixels) are acquired across 500 mm in Y during steady translation in the X direction with serial steps in Y (10% overlap) (H) and Z directions (Parker 150 mm constant velocity XY (4) and 25 mm Z high-precision translation stages). The system is controlled by purpose-developed code written in the LabVIEW programming language operating in real time via a field-programmable gate array (National Instruments Inc). Maximum acquisition rates were 52 × 106 voxels/s per channel (area scan rate ~3 mm2/s at 250 nm pixel resolution). Data were stored in a 72 TB RAID array (LaCie) prior to archiving and post-processing.
Over most of the past 40 years, point-scan confocal microscopy has provided the gold standard for 3D epifluorescence imaging at the cell level. Illumination light is focused at a point within the specimen, and a pinhole aligned with the corresponding focus for emitted fluorescence acts as a spatial filter that prevents out-of-focus light from reaching the detector. Both and are improved as a result, but the effective PSF remains anisotropic and image intensity is reduced (Wilhelm et al., 2010). Illumination of tissue above and below the focal plane during image formation can lead to progressive bleaching of fluorophores. This problem is minimised with two-photon microscopy (Rubart, 2004), where sufficient long wavelength illumination power is delivered to excite fluorescence at about half the wavelength only in the focal volume, with no adjacent photobleaching. Imaging depths are substantially greater than confocal microscopy. However, in both cases, resolution is anisotropic, and acquisition rates are slow.
3.2. Light sheet microscopy
Selective plane imaging microscopy (SPIM) offers an approach which achieves a more isotropic imaging resolution. There have been significant advances in this method recently with the renaissance of tissue clearing and the development of sensitive high-throughput imaging technologies. With SPIM, a light sheet is formed using an illumination objective (or objectives) and focused in the XY imaging plane orthogonal to the detection objective. Therefore, the image PSF is mainly determined by the lateral resolutions of the orthogonal objectives. A significant advantage is that fluorescence is excited only in the imaging plane, thereby minimising photo-bleaching and photo-toxicity. As a result, SPIM is particularly suited to live tissue imaging. The inherent problem is that high resolution is achieved only over the relatively limited area of the light sheet where illumination and detection foci intersect. This problem was initially addressed by using Bessel light sheets that diverge much less than Gaussian light sheets (Planchon et al., 2011; Gao et al., 2014), or by forming lattice light sheets in which a regular series of focal lines is generated along the illumination light sheet (Betzig, 2005; Chen et al., 2014). However, these solutions add considerable complexity to the imaging systems used.
The utility of SPIM has been extended substantially by the emergence of low-noise scientific complementary metal-oxide semiconductor (sCMOS) arrays with high quantum efficiency over the visible light range and extremely fast acquisition rates (Singh et al., 2013). The sCMOS video cameras most commonly used read 2048-pixel lines, and the highest data rates (400 megapixels/s) are achieved by serial “rolling” transfer of lines from the detector array. Furthermore, maximum resolution can be maintained across the imaging field by sweeping the focus of the illumination light sheet across the camera detector array in synchrony with the rolling shutter (Tomer et al., 2014; Dean et al., 2015).
A range of different SPIM configurations is presented in Fig. 2. Fig. 2B shows the illumination objective at a lateral edge of the specimen, while a more uniform light sheet is produced with three-lens SPIM with coaxial illumination objectives at both edges. The image volumes that can be addressed is constrained in both cases, but this limitation is reduced with inverted SPIM (iSPIM, see Fig. 2C). Because illumination and detection objectives are positioned above the specimen’s upper surface, large image planes can be constructed by 2D translation of the specimen. Furthermore, if both objectives are identical, isotropic resolution can be achieved. However, nose piece geometry and the oblique orientation of objectives with respect to the specimen surface combine to limit imaging depth; for example, the 10-mm working distance (WD) high-NA objectives developed by Applied Scientific Instrumentation (54–12-8 ASI, Eugene OR) enable a maximum imaging depth of 2 mm with this technique.
Light sheet theta microscopy (Migliori et al., 2018) uses two large-angle illumination objectives and a long-WD detection objective positioned above the specimen to increase imaging depth (Fig. 2D). Illumination light sheets are continuously aligned to intersect at the focus of the detection objective, and this line is scanned across the imaging plane of a sCMOS camera in synchrony with its rolling shutter. However, the performance of this system is only marginally better than an equivalent line-scan confocal microscope (Wolleschensky et al., 2006). Resolution is anisotropic because objectives are not orthogonal, and because the image is formed at the intersection of two light sheets, wastage of illumination and resultant photo-bleaching is likely to be significantly greater than SPIM.
More versatile high-throughput imaging of cleared tissue specimens has been demonstrated using open-top light sheet microscopy (Glaser et al., 2019, 2020). With this approach, long-WD illumination and detection objectives are located below a reservoir filled with immersion fluid (Fig. 2E) and specimens are placed on a transparent mount in contact with the upper surface of the immersion medium. An elliptical Gaussian illumination beam that minimises shadowing artifacts is formed with a galvanometer mirror (Glaser et al., 2018) and images are acquired across a central 256×2048 pixel field on the sCMOS detector matched to the focal region of the detection objective. This was either orthogonal to the illumination objective (Glaser et al., 2019 see Fig. 2E) or perpendicular to the top of the system (Glaser et al., 2020). Image volumes were assembled using 3-axis translation synchronised with the camera. Advantages of this approach are that relatively large tissue volumes can be imaged at different magnifications and extended depths in immersion media with a wide RI range. However, the RI of additional optical components in the light path – the solid lens positioned in front of the illumination objective and specimen mount – must be matched precisely to that of the immersion fluid and specimen. Furthermore, while blurring in Z is constrained, imaging remains anisotropic (see Glaser et al., 2019 supplement; Glaser et al., 2020). Finally, matching the focal range to the specified detector field will lead to oversampling and resultant acquisition slowing at high magnification, although this could be mitigated by reducing the imaging field to 64 × 2048 or 8 × 2048 pixels to better match the focal region of the objectives.
3.3. Stage-scanning line confocal microscopy
Stage-scanning line confocal microscopy provides a much simpler alternative to SPIM for imaging large cleared tissue specimens (Yang et al., 2015; Gareau et al., 2017). These systems extend line-scanning methods developed initially developed to improve spatiotemporal resolution for imaging intact live organisms such as zebrafish or mouse embryos (Wolleschensky et al., 2006). An illumination light sheet is focused within the specimen, and the conjugate fluorescence line is aligned with the detection array which forms an effective confocal “slit”, blocking most out-of-focus fluorescent light. With an appropriate sCMOS array, lines can be captured at the same rate as SPIM, but only one objective is needed (see Fig. 2F), and it can be deployed over its full WD. The process of scanning is also much more straightforward. There is no need for synchronous scanning of the focal line with respect to the detector, and large image volumes can be assembled by mechanical translation of the specimen to form overlapping strips parallel to the edge of the imaging field as shown in Fig. 2H (Yang et al., 2015; Gareau et al., 2017). Disadvantages are similar to point-scan confocal in that the PSF is anisotropic and photobleaching, being similar to standard confocal imaging, is higher than SPIM. Finally, out-of-focus light travelling along the line of the sensor will cause some image blurring, but this can be substantially removed with post-processing (Section 4.1).
We have set up a bespoke stage-scanning line confocal microscope system in our laboratory (Fig. 2G) to image extended tissue volumes at rates of around 10 million voxels per second (similar to SPIM, although Glaser et al. (2019) report an order of magnitude faster than this). It is being used successfully for ongoing studies of the 3D organisation of cardiac muscle cells, coronary blood vessels, autonomic nerves, and ECM in cleared tissue from extended regions of explanted human hearts and complete rat hearts. We are currently imaging depths up to 1 mm, although this is dependent on the quality of clearing and labelling.
Several caveats apply to each of the light sheet configurations above. Ideally, objectives should have a long WD, with NA sufficient to meet resolution requirements. While long-WD, high-NA objectives have been developed for two-photon microscopy (Helmchen and Denk, 2005), many of these are not corrected for chromatic aberration at shorter wavelengths, which degrades their performance in this setting. Axial PSF length tends to increase with depth in cleared tissue specimens, and this is attributed to RI mismatch (Planchon et al., 2011). The effect of this is more significant for stage-scanning line confocal light microscopy than SPIM, because the PSF for the latter is determined by the intersection of transverse illumination and detection PSFs. However blurring can be minimised using an RI-matching collar that adjusts intermediate optics in the objective.
4. Post-processing, storage, and visualisation
As a result of the technological developments outlined in the previous section, acquisition time is no longer the main bottleneck that constrains the assembly of high-resolution microscopic images of extended tissue volumes. Instead, the magnitude of these datasets has become the problem. For example, the extensive post-processing needed to transform raw data into optimal 3D images has become a rate-limiting step, and appropriate platforms are required for efficient storage, visualisation and sharing of these images. At present, most of the imaging systems used in this setting are purpose-developed, and there are differences in some of the post-acquisition processes employed. In general, however, the approaches used are very similar, and this overlap extends to a broader range of imaging applications and big data problems. This is acknowledged in recent reviews of 3D imaging in cleared tissue (Ueda et al., 2020b). Here, we summarise critical issues associated with post-processing, storage, and visualisation of images in extended tissue volumes, based in part on our group’s experience in dealing with cardiac tissue and large human heart specimens.
4.1. Post-processing
Reconstruction of 3D image volumes from raw data involves using algorithms to reduce artifacts that arise in the imaging process. These include sensor noise, optical diffraction limitations that introduce blur, spherical and chromatic aberrations, and spatial variation in illumination. Because 3D images are assembled from 2D image tiles that cover a region of interest, it is also necessary to preserve accurate registration and to integrate across areas of overlap.
sCMOS cameras are now routinely used for large-volume fluorescent imaging because their sensors are significantly faster and more sensitive than traditional charge-coupled devices (CCDs). However, photon shot noise, a significant noise source in sCMOS detectors, is not uncorrelated at low photon counts (Mandracchia et al., 2020). Furthermore, high acquisition rates are achieved by the sequential reading of lines of pixels within the sensor, and variations in gain, offset, and variance at each pixel generate additional readout noise that is also correlated (Huang et al., 2013). As a result, averaging is much less effective at reducing noise sCMOS devices than CCDs. However, noise can be reduced through the use of algorithms such as maximum likelihood estimators (Liu et al., 2017) or sparse filtering (Mandracchia et al., 2020) which take into account the unique characteristics of sCMOS sensors. Other algorithms correct for stationary noise and striping associated with light-sheet imaging (Fehrenbach et al., 2012; Fehrenbach and Weiss, 2014).
Optical diffraction introduced by lenses and other components in the light path limits an imaging system’s resolution. The blurring is characterised by the microscope PSF (Section 3.1), which is the imaged representation of a point source (Gibson and Lanni, 1991). Deconvolution is widely used to correct for this loss of resolution (Sarder and Nehorai, 2006) with the most common approaches based on variations of the Richardson-Lucy algorithm (Richardson, 1972; Lucy, 1974). These algorithms also act to reduce the Gaussian and Poisson noise inherent in fluorescence microscopy. Additional complexity is introduced when imaging cleared tissue specimens. It is difficult to eliminate all spherical and chromatic aberrations in the long-WD, high-NA objective lenses used for this purpose, and it is also challenging to match RI throughout the imaging region. Despite the resultant spatial variation of the PSF, substantial 3D image improvement can still be achieved using deconvolution. However, deconvolution is an iterative process and is computationally expensive (Sun et al., 2009; Sage et al., 2017). New approaches that aim to reduce the complexity of the calculations have been developed (Guo et al., 2020) and machine learning (deep learning) techniques are also being used for this purpose (Kobayashi et al., 2020; Xiao et al., 2020).
Cleared tissue specimens typically cover extents much greater than the field-of-view of a microscope, requiring translation of the sample during the acquisition process, and subsequent fusion of the multiple images. Arrays of adjacent 2D image tiles (or image strips) are acquired, and this is repeated sequentially at progressively increasing depths within the specimen. These image components exhibit characteristic intensity variation. Image intensity may decrease towards the lateral edges of image tiles or strips due to decreasing illumination at the borders, classically seen in microscopy as vignetting. Many approaches exist for image normalisation that minimise these variations (Cox et al., 1995; Smith et al., 2015) which typically involve imaging a uniformly fluorescent sample (flat-field image) to use as the intensity correction baseline. Light intensity also decreases with imaging depth due to absorption, and the contrast also decreases with depth due to light scattering. Additionally, regions may be shadowed by optically dense tissue regions in the incident light path. Equalisation of average intensities can reduce the apparent intensity loss (Yayon et al., 2018), however this can be at the expense of increased noise at depth due to the reduced contrast.
The fusion of multiple images into a final 3D image volume requires alignment and blending of overlapping regions, where the total image volume is usually much larger than computer memory. Several different open source tools provide the ability to stitch very large images together, including TeraStitcher (Bria and Iannello, 2012), ParaStitcher (Bria et al., 2019) and BigStitcher (Hörl et al., 2019) which each exploit CPU and GPU parallelisation to accelerate the process. Alignment of adjacent tiles is most commonly achieved using a normalised cross-correlation, although ensuring that images are acquired at fixed offsets eliminates this computationally expensive process. Seamless stitching is achieved by weighting the contributions of overlapping voxels appropriately according to their distance from the tile edge.
4.2. Data file storage
The scale of 3D image data (Li et al., 2017b), and the speed of acquisition, means that careful consideration of file storage is essential to prevent data handling from becoming a bottleneck. Modern solid state drives are easily capable of storing at typical acquisition rates, however their size limits total acquisition time. A large RAID array with striping (storage of consecutive data segments across multiple disks) provides a solution that can extend to hundreds of terabytes, and storage can be managed using separate computing hardware via a high-speed fibre network link (Tomer et al., 2012).
Unlike 2D imaging, which has many standard and well-supported image formats (e.g., TIFF, JPG), 3D imaging is yet to settle on a universal standard, partly due to the ongoing development of the imaging techniques themselves and partly due to the complex requirements of these datasets. The ideal file format would be fast to read and write with parallel access, hierarchical (or pyramidal) to support analysis and visualisation at multiple scales, chunk-based for efficient access to localised regions, and widely supported by image processing applications. This definition introduces two concepts which are particularly relevant for very large images. Chunking refers to breaking down the image into discrete sub-regions, such that visualising or processing the image can be efficiently achieved without requiring the entire image to be loaded, particularly when an image exceeds computer memory. Similarly, a pyramidal image contains multiple image resolutions within the one image structure, again reducing the data required to be read for viewing an entire image at a low resolution consistent with display capabilities.
The TIFF format can be extended to 3D with multiple image planes in one file but becomes cumbersome when applied to chunked data. While HDF5 (Hierarchical Data Format version 5) has been proposed as an ideal solution (Poinot, 2010), its extreme flexibility adds complexity, and it cannot be written in parallel. Several specialised data formats have been developed (Amat et al., 2015; Balázs et al., 2017) which use CUDA-based GPUs for fast compression. The Open Microscopy Environment has developed an open-source image data management platform (Moore et al., 2015) which supports a wide variety of 2D image formats and is currently investigating a multi-resolution chunked format called Zarr (Miles et al., 2020) for 3D image data. Zarr is a “thin” streamlined format that supports various compression codecs and filters and is designed for use in parallel computing.
Many of the challenges of image storage arise because images are typically sampled on a regular grid with much greater resolution than the information contained, which is often sparsely distributed. One proposed technique, Adaptive Particle Representation (Cheeseman et al., 2018), describes the image as a collection of particles by adaptively resampling the image, guided by local information content. This representation enables savings in data storage and reduces visualisation and image analysis requirements, although it is incompatible with existing image analysis software.
Easily overlooked is the need for the comprehensive recording of image metadata, including instrument configuration (Stocker et al., 2020), acquisition parameters (Moore et al., 2015) and image processing parameters and algorithms. While some image formats, such as TIFF or HDF5, provide for extensible metadata storage, there is little consistency as to the information recorded. In many cases, the appropriate metadata is specific to the imaging application and the microscope used. The FAIR guidelines (Wilkinson et al., 2016) are useful in ensuring that data is findable, accessible, interoperable, and reusable. The “next-generation” file format being developed by the Open Microscopy Environment (Moore et al., 2021) aims to be a FAIR file format that addresses all of the above issues, including hierarchy, chunking, parallel access, and metadata storage.
4.3. Visualisation and data sharing
Visualisation of 3D images is a critical step in analysing these data and the extraction of structure-based computer models. The central problem here is that software packages already developed for 3D image visualisation cannot be used interactively with the terabyte-scale datasets acquired with high-throughput tissue imaging. However, the largest 8K monitor can display only 32 million pixels, a tiny fraction of the image volumes we seek to visualise. The correct strategy is to recapitulate in 3D the approaches used in 2D microscopy – that is, to navigate within the image at a low spatial scale and then “zoom in” to visualise regions-of-interest at a higher resolution.
This approach is facilitated by storing image data in a chunked multi-resolution format and limiting the data volume on which visualisation processes are performed to that necessary to support the screen display only (Bria et al., 2016; Li et al., 2019a, 2019b). With such a visualisation platform, it is possible to move rapidly between scales while minimising the information transfer needed. Several open-source programs are being developed along these lines to handle large image volumes (Peng et al., 2010; Peng et al., 2014; Wu et al., 2014; Pietzsch et al., 2015; napari contributors, 2019). These employ different image formats but can be used to annotate features and extract regions-of-interest for further analysis.
As a final comment, we note that maximum acquisition rates with sCMOS cameras are slightly slower than the reliable data transfer that can be achieved currently with a dedicated high-speed internet link (10 Gbps), and lower bandwidth at any point will act as a choke on this transfer. It seems evident that this will constrain the sharing of raw image data in the immediate future. Instead, access to such data on a remote server that also supports the visualisation and feature extraction platforms outlined above seems likely to be the most efficient way of sharing extended volumes of image data in the medium term at least.
Fig. 3 presents 3D data from a post mortem human RV specimen cleared, labelled and imaged in our laboratory using the methods illustrated in Figs. 1 and 2F&H – for more detailed protocols, see Supplementary Methods. ECM components surrounding cells and coronary blood vessels (WGA, green) and connexin-43 plaques (anti-Cx43, magenta) are well-identified throughout the image volume. The difficulty in visualising large data volumes is demonstrated by the zoomed subfigures (B-E) which demonstrate the wealth of detail available throughout the image. The substantial improvements in image quality provided by deconvolution are shown in Supplementary Fig. 2, with in-plane voxel resolutions below one micron, and an axial resolution around two microns.
Fig. 3.
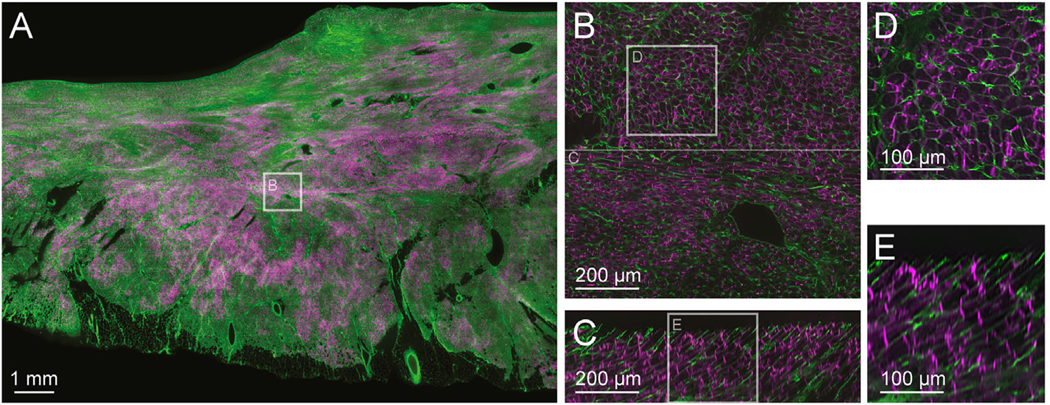
Extended-volume imaging and processing. Using the techniques described in Fig. 1, a human RV tissue sample was cleared and labelled with WGA (green) and anti-Cx43 (magenta) and imaged using the system detailed in Fig. 2F. The acquired images were corrected for pixel noise, illumination variability, and depth attenuation, and adjacent strips were blended together to into a final image volume of 14 × 10 × 0.3 mm with pixel sampling at 1.0 μm3. One image plane is shown in (A). The 3D image was deconvolved, and two XY subimages are shown with increasing detail (B) and (D), demonstrating that individual cells, vessels, and connexin-43 plaques are evident. Orthogonal XZ images are shown in (C) and (E) confirming successful labelling and imaging performance to a depth of at least 300 μm, with Z-resolution that is ~50% diminished over X and Y. An animation of the deconvolved image stack shown in (B) is provided as Supplementary Movie 1.
5. Quantification of structure and image-based modelling
High-resolution extended-volume imaging generates immense quantities of multi-channel data, spanning sub-cellular (~0.5 μm) to tissue (~10 mm) scales. The possibilities offered by this technology can be exploited by identifying tissue structures, quantifying features of their 3D organisation across spatial scales and then using these data to estimate functional implications. Given the magnitude of the data involved, however, these processes must be automated. Incorporating abstracted structural information into appropriate models provides a platform for investigating how structure affects function in normal and diseased hearts. In this section, we outline approaches used for segmentation and structural quantification in large image volumes. We also consider modelling that might be appropriate for investigating relationships between structure and function at the tissue scale, with particular emphasis on cardiac electrical activity.
5.1. Image enhancement and segmentation
Segmentation is a key step in the image analysis pipeline. Typical features to be segmented from cardiac images include individual myocyte cells (Seidel et al., 2015), vessels (Vigneshwaran et al., 2019), layers or bundles of cells (Rutherford et al., 2012), nerves (Achanta et al., 2020), Purkinje fibres (Romero et al., 2016) and fibrosis (Pope et al., 2008; LeGrice et al., 2012). While vessels, nerves, Purkinje fibres and fibrosis obviously form networks, the nature of myocyte coupling and organisation over multiple scales also shows emergent network topologies.
Various image filters are employed to enhance structures of interest and to minimise the effects of noise and background variation for subsequent segmentation. Many are based on image intensity gradients. For example, anisotropic diffusion schemes (Perona and Malik, 1990) driven by local image intensity gradients are widely used. Proteins linked to features of interest are targeted by fluorescent probes or antibody labels (Section 2.2). The choice of conjugated fluorophores for imaging is driven by a number of considerations, including the detection and scattering of the emitted wavelengths. This can influence the choice of subsequent approaches to feature segmentation. Segmentation using intensity-based threshold methods can be useful, but in general they are inconsistent and problematic even after image enhancement or with more advanced dynamic and adaptive techniques (Sezgin and Sankur, 2004). Active contour methods, in which the boundaries of the segmented region are estimated by minimising an image energy function, have proved effective (Pluempitiwiriyawej et al., 2005). Level set methods (Wang et al., 2010), a subset of active contours, are robust and computationally efficient, iteratively evolving a segmentation toward a stable minimum energy solution. Region growing methods, based on local pixel intensity patterns and including propagation approaches, have also been used successfully for automatic image segmentation (Mühlenbruch et al., 2006). These methods in multi-dimensions are widely implemented intrinsically, or as toolboxes or plugins, in common medical image processing tools such as ITK (itk.org), Fiji (imagej.net/Fiji), Icy (icy.bioimageanalysis.org) and 3D Slicer (slicer.org). One very recent plugin for Fiji is BigDataProcessor2 (Tischer et al., 2021) which enables common image processing algorithms to be efficiently performed on terabyte-sized images. Other widely used commercial platforms for image processing, such as MATLAB®, have many intrinsic or user community toolboxes that can be customised for image segmentation.
Recently, there has also been a growing interest in machine learning (deep learning) algorithms (Damseh et al., 2018, 2019; Haberl et al., 2018; Guo et al., 2020; Qiao et al., 2021). These data-driven approaches are effective but need to be used carefully (Hoffman et al., 2021), as they can be sensitive to the training parameters and rely on application images that are highly consistent with the images that are used for training. A number of recent studies have used machine learning in combination with other methods, such as active contours (Pratondo et al., 2017; Chen et al., 2019). The image tool Fiji accesses the Weka platform (cs.waikato.ac.nz/ml/weka) for machine learning segmentation in multi-dimensions.
5.2. Image reduction and analysis
Constructing networks as representative abstracted descriptions of cardiac tissue structures is useful for extracting quantitative information from extended-volume images of heart tissue, and implementing tractable computer models to infer how structure influences function. For example, skeletonisation of vessels (Soltanian-Zadeh et al., 2005; Saha et al., 2016), paves the way for efficient analysis because it captures their topology as a 1D network in 3D space. In the more complex case of myocardial electrical coupling, it is more challenging to characterise the network fully. For example, segmentation of images acquired with a fluorescent probe labelling only the cellular envelope may not identify the extent of electrical connection between adjacent cardiac myocytes, which occurs primarily at the intercalated disc. A more robust description of myocyte networks requires combining cellular segmentations with image data acquired using a label that identifies intercalated discs. Leading dimensions of vessels or myocytes can either be determined separately or coupled with the skeletonisation process (Lee et al., 2007). Finally, although the orientation of network elements can be captured by centerline tracking, it can also be characterised across the image using intensity gradient and second derivative filters to construct the multiscale Hessian and/or structure tensor (Pinter et al., 2018). The Hessian matrix is constructed from the second derivative of pixel or voxel intensities, and its eigenvalues describe the curvatures. The principal components of these quantities characterises structural anisotropy (Aslanidi et al., 2013).
5.3. Image-based modelling
Computer models incorporating biophysics and comprehensive structural information are used to investigate many aspects of atrial or ventricular function at the organ level. These include cardiac electrophysiology, cardiac mechanics, blood flow and interactions between them. Modelling based on clinical imaging modalities such as MRI or CT is highly developed with significant translational impact in cardiac electrophysiology (Vadakkumpadan et al., 2009; Yu et al., 2019). Three-dimensional arrangements of cardiomyocytes are captured by describing expected cell orientation fields throughout the space and using these to create anisotropic electrical properties. The organ volume is typically discretised using finite elements and mono- or bi-domain models used to capture the biophysics of electrical activation (Clayton and Panfilov, 2008).
The homogenised electrical properties used in these organ-level models do not readily capture finer-scale structural discontinuities. 3D imaging has revealed extensive cleavage planes between adjacent layers or bundles of myocytes (LeGrice et al., 1995; Pope et al., 2008) and functional studies confirm that there is little direct electrical coupling across them (Hooks et al., 2007; Caldwell et al., 2009). These discontinuities have been modelled by imposing planes or lines of insulation within the intracellular domain in tissue-scale bidomain finite element (Hooks et al., 2002; Mendonca Costa et al., 2014) and finite volume formulations (Trew et al., 2005). This work has demonstrated that the laminar arrangement of ventricular myocytes contributes to electrical anisotropy and effective cardioversion with external defibrillation-strength shocks (Hooks et al., 2002).
More detailed tissue-scale models that incorporate individual coupled cells have also been developed (Stinstra et al., 2010; Greiner et al., 2018; Jæger et al., 2019). The scale of biophysics is reduced to the cell level, and microdomain formulations that incorporate myocytes, fibroblasts and blood vessels (Greiner et al., 2018), intercalated discs (Mendonca Costa et al., 2016; Jæger et al., 2019), and other components of the extracellular domain (Greiner et al., 2018) have been introduced. This work has provided new insights into the discontinuous nature of electrical propagation at the tissue level, including the potential role of sodium channel distribution and ephaptic coupling in maintaining conduction safety in myocardium (Lin and Keener, 2014; Veeraraghavan et al., 2015; Jæger et al., 2019). However, these models are complex and computationally expensive. Some have been limited to 2D (Mendonca Costa et al., 2016; ) and the 3D image-based analysis presented by Sachse and co-workers (Greiner et al., 2018) has not been applied to extended-volume images. Alternative approaches segment bundles of myocytes from high-resolution image volumes and discretise these into networks of nodal volumes and edges along which current fluxes are defined (Rutherford et al., 2012). This network discretisation is powerful as syncytial volumes, sheets and strands of myocytes are naturally described without requiring special treatments for each dimension. In contrast, other approaches such as finite element discretisations (Clayton and Panfilov, 2008) typically require exceptions when dimensionality changes or internal discontinuities exist (Mendonca Costa et al., 2016). A network discretisation was used to model images from the border of a healed myocardial infarct (Rutherford et al., 2012). Solving reaction-diffusion electrical activation biophysics on the network showed that structural remodelling provided a substrate for arrhythmia due to rate-dependent conduction delays and block.
Network discretisations have been successfully used to investigate the distribution of blood flow in the heart (Lee and Smith, 2012) by reducing it to a 1D problem for each network component constrained by the continuity of fluxes imposed by branching. A powerful feature made possible by using network models of tissue substrates is that established network analysis algorithms can be effectively leveraged. For example, electrical activation pathways can be compared with shortest weighted network paths to contrast functional behaviour with the structural substrate (Rutherford et al., 2012). Models based on network discretisations compactly represent structures of interest in extended volume images of cardiac tissue, and are a foundation for computationally tractable approaches that can be generalised across biophysical domains.
An example of human heart image-based model analysis using network discretisations is shown in Fig. 4. The network model describes connectivity at the myocyte scale based on relatively simple segmentations of 3D confocal images. A full description of relevant methods is provided in the Supplementary Methods. We find that emergent anisotropic and heterogeneous conduction properties in the model of this tissue image naturally occur from image-derived structural morphology without the need to explicitly parameterise the model for this. Models derived from cellular scale data are limited by the physical volume tractable for computational analysis (currently < 10 mm3). However, even over limited volumes, activation data such as those of Fig. 4 can be used to derive biophysically driven upscaled tissue conductivity parameters (Stinstra et al., 2010) applicable to clinically relevant predictive models (Yu et al., 2019).
Fig. 4.

An example of model-based image analysis. Detailed methods are available in Supplementary Material. A confocal 3D image of human LV tissue (A) with WGA (green) and Cx43 (magenta) channels was acquired as described in Fig. 2 and 3. WGA ridges were segmented using a watershed filter and morphological operations to give a binary mask (B) of viable myocardium (white). Networks of nodes and edges were constructed within the viable myocardium (grey) (C), and edges weighted with a conductivity distribution field derived from the Cx43 3D image channel (D). Viable myocardium cross-sections are typically complex (red). A reaction-diffusion model of electrical activity was solved on the network for a stimulus on the upper surface (E). Although specified electrical conductivities were isotropic, the activation sequence was anisotropic due to the heterogeneous myocardial coupling abstracted from the WGA and Cx43 images to the network reaction-diffusion model. Potential traces (F) confirm the anisotropic spread of electrical activation and heterogeneous conduction velocity. These results show that relatively simple myocardial coupling derived from detailed imaging is sufficient for emergent functional electrical behaviour that communicates LV tissue structures’ intrinsic topology in the human heart.
6. Discussion
The goal of this article was to explore how tissue processing and high-throughput imaging technologies that have been exploited recently to reconstruct neural processes in the brain in unprecedented detail could be extended to comparable studies in the heart. To focus consideration, we have defined tentative specifications for an imaging and analysis pipeline that could be used to study structure and function down to the cell scale in large cardiac specimens including tissue from human hearts. This encompasses 1) tissue clearing and labelling techniques that facilitate imaging of protein expression with standard fluorescent labels (400–750 nm) throughout specimens several millimetres thick with dimensions on the order of centimetres transverse to this, 2) imaging systems that can acquire multi-channel data volumes of this scale at near isotropic voxel resolution in the 0.5–5 μm range over time-frames of hours to days, 3) an image processing platform that will enable robust automated segmentation and efficient visualisation of these image volumes, and 4) a computational framework that will support systematic analysis of key structural components in normal and diseased hearts and tractable model-based investigation of how tissue level structure affects function. To this end, we have reviewed the relevant literature. However, there are extensive gaps in the application of this approach to the heart and we have also provided illustrative examples from preliminary studies in this area being carried in our laboratory.
On this basis, we conclude that hydrophilic clearing methods are preferable to hydrophobic alternatives. While hydrophobic reagents typically homogenise RI most rapidly, they are toxic and corrode microscope objectives, which constrains their use. Among the hydrophilic approaches, diffusion-based clearing with the CUBIC protocol is simple, reliable, and effective for human heart specimens. CUBIC is also flexible since a wide range of potential reagents has been systematically identified for efficiency, fluorophore preservation, and cost (Tainaka et al., 2018). A caveat here is that hydrophilic methods are not effective at clearing fat. Ganglionic plexi in the cardiac neural network are located in fat pads on the epicardial surface of the heart. Additional epicardial fat deposits and fibro-fatty inclusions are also increasingly common in the human heart with age and cardiac pathology. This problem can be resolved by adding an initial step to remove lipids prior to rehydration and hydrophilic clearing.
Further issues are the time taken to clear cardiac tissue specimens with passive hydrophilic techniques such as CUBIC and subsequent diffusion-based penetration of fluorescent labels. In our hands, 1–2 weeks was required for effective cardiac tissue clearing, while antibody-based fluorescent labels were delivered through specimens ~1 mm thick in a similar time. An additional difficulty is that tissue clearing decreases specimen rigidity, and while this can be addressed by forming tissue-hydrogel composites (Chung et al., 2013), tissue clearing and labelling of protein targets with fluorescent probes are both further impeded. These issues were initially addressed with CLARITY using electrophoresis (Chung et al., 2013) and it has also been reported that slow rotation of electro-transport direction enhances clearing and labelling in specimens processed with CLARITY and CUBIC (Kim et al., 2015). However, a more systematic investigation of optimal embedding and electric field-enhanced clearing and labelling is urgently required for cardiac tissue specimens processed with CUBIC and similar hydrophilic methods.
Image acquisition time specifications are readily met with the current generation of sCMOS detectors. Furthermore, stage-scanning line confocal microscopy (Gareau et al., 2017; Ashton et al., 2019) or variants of SPIM such as open-top light sheet microscopy (Glaser et al., 2019, 2020) offer comparable performance for imaging large-format cardiac tissue specimens at present. With the former approach, it is relatively simple to image large tissue specimens with a single long WD objective. Drawbacks are that 1) the images acquired are inherently anisotropic and axial smearing increases with imaging depth if RI is not uniformly matched throughout the specimen, and 2) regions outside the focal plane are excited which accelerates photobleaching. In contrast, photon budgets are reduced with SPIM and near isotropic submicron resolution is possible within the intersecting focal regions addressed by orthogonal high NA illumination and detection objectives. However, the complexity of the bespoke optical systems required is substantially greater, and imaging volumes are limited. Modifications to SPIM that allow it to be used for large tissue specimens (Migliori et al., 2018; Glaser et al., 2019, 2020) degrade some of the advantages of this approach. For example, imaging depth is increased by nonorthogonal arrangement of illumination and detection objectives in light sheet theta microscopy (Migliori et al., 2018) and open top light sheet microscopy (Glaser et al., 2020), at the cost of image anisotropy. We have obtained micron-scale resolution using stage-scanning line confocal microscopy with acceptable photobleaching for imaging depths >1 mm, although time-consuming deconvolution is needed. Oversampling reduces throughput with this system and also with current forms of open-top light sheet microscopy (Glaser et al., 2019, 2020), but this issue is relatively easy to address. We anticipate the development of more flexible such systems in the future that will enable extended image volumes to be acquired across a range of resolutions. Sub-micron resolution is certainly needed in regions within large-format cardiac tissue specimens and we expect that this is best achieved using an orthogonal SPIM configuration with matched high NA objectives optimised for this purpose.
At present, data volume is the main bottleneck faced with high-throughput imaging of large tissue specimens. To put this in context, maximum image acquisition rates are substantially greater than current industry-standard gigabit Ethernet will allow. This has obvious impact on strategies for storage, processing, visualisation and sharing of these data, and wherever possible these processes should be carried out locally within a high-speed network. For efficient remote access, post-processed image data should be stored in chunked hierarchical formats, ideally also compressed, for minimising data transfer. Because imaging is non-destructive and specimens can be re-imaged, it can also be argued that preserving the tissue is the most secure and least expensive way of archiving and recovering high-resolution information on tissue structure. Open-source platforms for interactive visualisation of large 3D image datasets are continuing to be developed. In principle, these can be operated remotely provided that registered versions of the image data can be accessed across an appropriate range of spatial scales. Finally, sophisticated resources for enhancing, segmenting and analysing 3D image data are being developed at an increasing rate, driven in part by current emphases on machine learning. Communication and development of common standards for 3D data storage, processing and visualisation are key to exploiting the increasing investment and energy within this field.
The methods outlined in this review provide a means of quantifying 3D morphology at cell to tissue levels in normal and diseased hearts more systematically and in greater detail than has previously been possible. For example it is now feasible to reconstruct the myocyte network and all components of the coronary circulation throughout a complete rat heart, or to characterise the 3D arrangement of sympathetic and parasympathetic neurons with a human ganglionic plexus. Work on each of these areas is in advanced state in our laboratory. Access to such data also offers the possibility of a paradigm shift in image-based modelling. Most structures of interest in the heart exhibit topologies that are most effectively represented by identifying and quantifying network elements at different spatial scales. We argue that computational models which incorporate this network structure provide an appropriate way of relating structure to function at the tissue level. Such models explicitly represent the structural discontinuity inherent at this spatial scale and capture key aspects of function with reduced computational complexity. Until recently, researchers have lacked the data needed to investigate such an approach. The issues raised are wide-ranging and our discussion of them here inevitably very preliminary.
It is clear that imaging of extended tissue volumes and related image analysis has much to contribute to our understanding of function in many different organ systems, the brain in particular. Ongoing work in our laboratory and others convinces us that this is equally true for the heart.
Supplementary Material
Acknowledgements
We thank the following colleagues from the University of Auckland (Auckland Bioengineering Institute unless otherwise stated) for their assistance: Christine Sy and Linley Nisbet for tissue processing; Dr Paul Roberts and Jacqui Ross (Biomedical Imaging Research Unit) for image acquisition; and Vibu Vigneshwaran, Dr Girish Ramlugun, and Dr Yvette Wharton (Centre for eResearch) for image storage and analysis.
Funding sources
This work was supported by a grant from the Leducq Foundation and by a Marsden grant (UOA1620) from the Royal Society of New Zealand.
Abbreviations:
- CCD
Charge-Coupled Device
- Cx43
Connexin-43
- ECM
Extra-cellular Connective tissue Matrix
- NA
Numerical Aperture
- PFA
Paraformaldehyde
- PSF
Point Spread Function
- RI
Refractive Index
- sCMOS
scientific Complementary Metal-Oxide Semiconductor
- SDS
Sodium Dodecyl Sulphate
- SPIM
Selective Plane Imaging Microscopy
- WD
Working Distance
- WGA
Wheat-Germ Agglutinin
Footnotes
Appendix A. Supplementary data
Supplementary data to this article can be found online at https://doi.org/10.1016/j.pbiomolbio.2021.06.005.
Author statement
Gregory Sands: Conceptualisation, Methodology, Software, Investigation, Writing – Original draft, Writing – Review and editing, Visualisation. Jesse Ashton: Investigation, Methodology, Validation, Writing – Original draft, Visualisation. Mark Trew: Software, Writing – Original draft, Visualisation. David Baddeley: Methodology. Richard Walton: Resources. David Benoist: Resources. Igor Efimov: Conceptualisation, Funding acquisition. Nicolas Smith: Funding acquisition. Olivier Bernus: Conceptualisation, Funding acquisition. Bruce Smaill: Conceptualisation, Writing – Original draft, Writing – Review and editing, Visualisation, Supervision, Funding acquisition.
Declaration of competing interest
The authors declare that they have no conflict of interest.
References
- Achanta S, Gorky J, Leung C, Moss A, Robbins S, Eisenman L, Chen J, Tappan S, Heal M, Farahani N, Huffman T, England S, Cheng ZJ, Vadigepalli R, Schwaber JS, 2020. A comprehensive integrated anatomical and molecular atlas of rat intrinsic cardiac nervous system. iScience 23, 101140. 10.1016/j.isci.2020.101140. [DOI] [PMC free article] [PubMed] [Google Scholar]
- Amat F, Höckendorf B, Wan Y, Lemon WC, McDole K, Keller PJ, 2015. Efficient processing and analysis of large-scale light-sheet microscopy data. Nat. Protoc. 10, 1679–1696. 10.1038/nprot.2015.111. [DOI] [PubMed] [Google Scholar]
- Ariel P, 2017. A beginner’s guide to tissue clearing. Int. J. Biochem. Cell Biol. 84, 35–39. 10.1016/j.biocel.2016.12.009. [DOI] [PMC free article] [PubMed] [Google Scholar]
- Ashton JL, Sands GB, Khwaounjoo P, Ramlugun GS, Trew ML, Walton RD, Baddeley DM, Bernus O, Efimov IR, Smaill BH, 2019. In: Cellular Electrical Coupling in the Human Heart: an Image-Based Analysis Pipeline in: Heart Rhythm, pp. S524–S525. 10.1016/j.hrthm.2019.04.020. [DOI] [Google Scholar]
- Aslanidi OV, Nikolaidou T, Zhao J, Smaill BH, Gilbert SH, Holden AV, Lowe T, Withers PJ, Stephenson RS, Jarvis JC, Hancox JC, Boyett MR, Zhang H, 2013. Application of micro-computed tomography with iodine staining to cardiac imaging, segmentation, and computational model development. IEEE Trans. Med. Imag. 32, 8–17. 10.1109/TMI.2012.2209183. [DOI] [PMC free article] [PubMed] [Google Scholar]
- Balázs B, Deschamps J, Albert M, Ries J, Hufnagel L, 2017. A real-time compression library for microscopy images. bioRxiv, 164624. 10.1101/164624. [DOI] [Google Scholar]
- Becker K, Jährling N, Saghafi S, Weiler R, Dodt H-U, 2012. Chemical clearing and dehydration of GFP expressing mouse brains. PloS One 7, e33916. 10.1371/journal.pone.0033916. [DOI] [PMC free article] [PubMed] [Google Scholar]
- Bedbrook CN, Deverman BE, Gradinaru V, 2018. Viral strategies for targeting the central and peripheral nervous systems. Annu. Rev. Neurosci. 41, 323–348. 10.1146/annurev-neuro-080317-062048. [DOI] [PubMed] [Google Scholar]
- Betzig E, 2005. Excitation strategies for optical lattice microscopy. Opt Express 13, 3021–3036. 10.1364/OPEX.13.003021. [DOI] [PubMed] [Google Scholar]
- Bria A, Iannello G, 2012. TeraStitcher - a tool for fast automatic 3D-stitching of teravoxel-sized microscopy images. BMC Bioinf. 13, 1–15. 10.1186/1471-2105-13-316. [DOI] [PMC free article] [PubMed] [Google Scholar]
- Bria A, Iannello G, Onofri L, Peng H, 2016. TeraFly: real-time three-dimensional visualization and annotation of terabytes of multidimensional volumetric images. Nat. Methods 13, 192–194. 10.1038/nmeth.3767. [DOI] [PubMed] [Google Scholar]
- Bria A, Bernaschi M, Guarrasi M, Iannello G, 2019. Exploiting multi-level parallelism for stitching very large microscopy images. Front. Neuroinf. 13, 41. 10.3389/fninf.2019.00041. [DOI] [PMC free article] [PubMed] [Google Scholar]
- Caldwell BJ, Trew ML, Sands GB, Hooks DA, LeGrice IJ, Smaill BH, 2009. Three distinct directions of intramural activation reveal nonuniform side-to-side electrical coupling of ventricular myocytes. Circulation: Arrhythmia Electrophysiol. 2, 433–440. 10.1161/CIRCEP.108.830133. [DOI] [PubMed] [Google Scholar]
- Chakraborty T, Driscoll MK, Jeffery E, Murphy MM, Roudot P, Chang B-J, Vora S, Wong WM, Nielson CD, Zhang H, Zhemkov V, Hiremath C, De La Cruz ED, Yi Y, Bezprozvanny I, Zhao H, Tomer R, Heintzmann R, Meeks JP, Marciano DK, Morrison SJ, Danuser G, Dean KM, Fiolka R, 2019. Light-sheet microscopy of cleared tissues with isotropic, subcellular resolution. Nat. Methods 16, 1109–1113. 10.1038/s41592-019-0615-4. [DOI] [PMC free article] [PubMed] [Google Scholar]
- Cheeseman BL, Günther U, Gonciarz K, Susik M, Sbalzarini IF, 2018. Adaptive particle representation of fluorescence microscopy images. Nat. Commun. 9, 5160. 10.1038/s41467-018-07390-9. [DOI] [PMC free article] [PubMed] [Google Scholar]
- Chen J, Lee SK, Abd-Elgaliel WR, Liang L, Galende E-Y, Hajjar RJ, Tung C-H, 2011. Assessment of cardiovascular fibrosis using novel fluorescent probes. PloS One 6, e19097. 10.1371/journal.pone.0019097. [DOI] [PMC free article] [PubMed] [Google Scholar]
- Chen B-C, Legant WR, Wang K, Shao L, Milkie DE, Davidson MW, Janetopoulos C, Wu XS, Hammer JA, Liu Z, English BP, Mimori-Kiyosue Y, Romero DP, Ritter AT, Lippincott-Schwartz J, Fritz-Laylin L, Mullins RD, Mitchell DM, Bembenek JN, Reymann A-C, Böhme R, Grill SW, Wang JT, Seydoux G, Tulu US, Kiehart DP, Betzig E, 2014. Lattice light-sheet microscopy: imaging molecules to embryos at high spatiotemporal resolution. Science 346. 10.1126/science.1257998. [DOI] [PMC free article] [PubMed] [Google Scholar]
- Chen L, Li G, Li Y, Li Y, Zhu H, Tang L, French P, McGinty J, Ruan S, 2017. UbasM: an effective balanced optical clearing method for intact biomedical imaging. Sci. Rep. 7, 12218. 10.1038/s41598-017-12484-3. [DOI] [PMC free article] [PubMed] [Google Scholar]
- Chen X, Williams BM, Vallabhaneni SR, Czanner G, Williams R, Zheng Y, 2019. In: Learning Active Contour Models for Medical Image Segmentation in: IEEE/CVF Conference on Computer Vision and Pattern Recognition (CVPR), pp. 11624–11632. 10.1109/CVPR.2019.01190. Long Beach, CA, USA. [DOI] [Google Scholar]
- Chung K, Wallace J, Kim S-Y, Kalyanasundaram S, Andalman AS, Davidson TJ, Mirzabekov JJ, Zalocusky KA, Mattis J, Denisin AK, Pak S, Bernstein H, Ramakrishnan C, Grosenick L, Gradinaru V, Deisseroth K, 2013. Structural and molecular interrogation of intact biological systems. Nature 497, 332–337. 10.1038/nature12107. [DOI] [PMC free article] [PubMed] [Google Scholar]
- Clayton RH, Panfilov AV, 2008. A guide to modelling cardiac electrical activity in anatomically detailed ventricles. Prog. Biophys. Mol. Biol. 96, 19–43. 10.1016/j.pbiomolbio.2007.07.004. [DOI] [PubMed] [Google Scholar]
- Cox IJ, Roy S, Hingorani SL, 1995. Dynamic histogram warping of image pairs for constant image brightness in. Proc., Int. Conf. Image Process. 366–369. 10.1109/ICIP.1995.537491. [DOI] [Google Scholar]
- Crossman DJ, Shen X, Jüllig M, Munro M, Hou Y, Middleditch M, Shrestha D, Li A, Lal S, dos Remedios CG, Baddeley D, Ruygrok PN, Soeller C, 2017. Increased collagen within the transverse tubules in human heart failure. Cardiovasc. Res. 113, 879–891. 10.1093/cvr/cvx055. [DOI] [PubMed] [Google Scholar]
- Damseh R, Cheriet F, Lesage F, 2018. In: Fully Convolutional Densenets for Segmentation of Microvessels in Two-Photon Microscopy in: 40th Annual International Conference of the IEEE Engineering in Medicine and Biology Society. EMBC), pp. 661–665. 10.1109/EMBC.2018.8512285. [DOI] [PubMed] [Google Scholar]
- Damseh R, Pouliot P, Gagnon L, Sakadzic S, Boas D, Cheriet F, Lesage F, 2019. Automatic graph-based modeling of brain microvessels captured with two-photon microscopy. IEEE J. Biomed. Health Informat. 23, 2551–2562. 10.1109/JBHI.2018.2884678. [DOI] [PMC free article] [PubMed] [Google Scholar]
- Dean, Kevin M, Roudot P, Welf, Erik S, Danuser G, Fiolka R, 2015. Deconvolution-free subcellular imaging with axially swept light sheet microscopy. Biophys. J. 108, 2807–2815. 10.1016/j.bpj.2015.05.013. [DOI] [PMC free article] [PubMed] [Google Scholar]
- Du H, Hou P, Wang L, Wang Z, Li Q, 2019. Modified CLARITY achieving faster and better intact mouse brain clearing and immunostaining. Sci. Rep. 9, 10571. 10.1038/s41598-019-46814-4. [DOI] [PMC free article] [PubMed] [Google Scholar]
- Epp JR, Niibori Y, Liz Hsiang H-L, Mercaldo V, Deisseroth K, Josselyn SA, Frankland PW, 2015. Optimization of CLARITY for clearing whole-brain and other intact organs. eNeuro 2. 10.1523/ENEURO.0022-15.2015. ENEURO.0022–15. [DOI] [PMC free article] [PubMed] [Google Scholar]
- Ertürk A, Becker K, Jährling N, Mauch CP, Hojer CD, Egen JG, Hellal F, Bradke F, Sheng M, Dodt H-U, 2012. Three-dimensional imaging of solvent-cleared organs using 3DISCO. Nat. Protoc. 7, 1983–1995. 10.1038/nprot.2012.119. [DOI] [PubMed] [Google Scholar]
- Fehrenbach J, Weiss P, 2014. Processing stationary noise: model and parameter selection in variational methods. SIAM J. Imag. Sci. 7, 613–640. 10.1137/130929424. [DOI] [Google Scholar]
- Fehrenbach J, Weiss P, Lorenzo C, 2012. Variational algorithms to remove stationary noise: applications to microscopy imaging. IEEE Trans. Image Process. 21, 4420–4430. 10.1109/TIP.2012.2206037. [DOI] [PubMed] [Google Scholar]
- Fei P, Nie J, Lee J, Ding Y, Li S, Zhang H, Hagiwara M, Yu T, Segura T, Ho C-M, Zhu D, Hsiai TK, 2019. Subvoxel light-sheet microscopy for high-resolution high-throughput volumetric imaging of large biomedical specimens. Adv. Photon. 1, 1. 10.1117/1.AP.1.1.016002. [DOI] [Google Scholar]
- Gao L, Shao L, Chen B-C, Betzig E, 2014. 3D live fluorescence imaging of cellular dynamics using Bessel beam plane illumination microscopy. Nat. Protoc. 9, 1083–1101. 10.1038/nprot.2014.087. [DOI] [PubMed] [Google Scholar]
- Gareau DS, Krueger JG, Hawkes JE, Lish SR, Dietz MP, Mülberger AG, Mu EW, Stevenson ML, Lewin JM, Meehan SA, Carucci JA, 2017. Line scanning, stage scanning confocal microscope (LSSSCM). Biomed. Opt Express 8, 3807–3815. 10.1364/BOE.8.003807. [DOI] [PMC free article] [PubMed] [Google Scholar]
- Gibson SF, Lanni F, 1991. Experimental test of an analytical model of aberration in an oil-immersion objective lens used in three-dimensional light microscopy. J. Opt. Soc. Am. 8, 1601–1613. 10.1364/JOSAA.8.001601. [DOI] [PubMed] [Google Scholar]
- Glaser AK, Chen Y, Yin C, Wei L, Barner LA, Reder NP, Liu JTC, 2018. Multidirectional digital scanned light-sheet microscopy enables uniform fluorescence excitation and contrast-enhanced imaging. Sci. Rep. 8, 13878. 10.1038/s41598-018-32367-5. [DOI] [PMC free article] [PubMed] [Google Scholar]
- Glaser AK, Reder NP, Chen Y, Yin C, Wei L, Kang S, Barner LA, Xie W, McCarty EF, Mao C, Halpern AR, Stoltzfus CR, Daniels JS, Gerner MY, Nicovich PR, Vaughan JC, True LD, Liu JTC, 2019. Multi-immersion open-top light-sheet microscope for high-throughput imaging of cleared tissues. Nat. Commun. 10, 2781. 10.1038/s41467-019-10534-0. [DOI] [PMC free article] [PubMed] [Google Scholar]
- Glaser AK, Bishop KW, Barner LA, Serafin RB, Liu JTC, 2020. A hybrid open-top light-sheet microscope for multi-scale imaging of cleared tissues. bioRxiv. 10.1101/2020.05.06.081745, 05.06.081745. [DOI] [PMC free article] [PubMed] [Google Scholar]
- Gómez-Gaviro MV, Sanderson D, Ripoll J, Desco M, 2020. Biomedical applications of tissue clearing and three-dimensional imaging in health and disease. iScience 23. 10.1016/j.isci.2020.101432. [DOI] [PMC free article] [PubMed] [Google Scholar]
- Gradinaru V, Treweek J, Overton K, Deisseroth K, 2018. Hydrogel-tissue chemistry: principles and applications. Annu. Rev. Biophys. 47, 355–376. 10.1146/annurev-biophys-070317-032905. [DOI] [PMC free article] [PubMed] [Google Scholar]
- Greiner J, Sankarankutty AC, Seemann G, Seidel T, Sachse FB, 2018. Confocal microscopy-based estimation of parameters for computational modeling of electrical conduction in the normal and infarcted heart. Front. Physiol. 9, 239. 10.3389/fphys.2018.00239. [DOI] [PMC free article] [PubMed] [Google Scholar]
- Guo M, Li Y, Su Y, Lambert T, Nogare DD, Moyle MW, Duncan LH, Ikegami R, Santella A, Rey-Suarez I, Green D, Beiriger A, Chen J, Vishwasrao H, Ganesan S, Prince V, Waters JC, Annunziata CM, Hafner M, Mohler WA, Chitnis AB, Upadhyaya A, Usdin TB, Bao Z, Colón-Ramos D, La Riviere P, Liu H, Wu Y, Shroff H, 2020. Rapid image deconvolution and multiview fusion for optical microscopy. Nat. Biotechnol. 1–10. 10.1038/s41587-020-0560-x. [DOI] [PMC free article] [PubMed] [Google Scholar]
- Haberl MG, Churas C, Tindall L, Boassa D, Phan S, Bushong EA, Madany M, Akay R, Deerinck TJ, Peltier ST, Ellisman MH, 2018. CDeep3M—plug-and- Play cloud-based deep learning for image segmentation. Nat. Methods 15, 677–680. 10.1038/s41592-018-0106-z. [DOI] [PMC free article] [PubMed] [Google Scholar]
- Hama H, Kurokawa H, Kawano H, Ando R, Shimogori T, Noda H, Fukami K, Sakaue-Sawano A, Miyawaki A, 2011. Scale: a chemical approach for fluorescence imaging and reconstruction of transparent mouse brain. Nat. Neurosci. 14, 1481–1488. 10.1038/nn.2928. [DOI] [PubMed] [Google Scholar]
- Helander KG, 1994. Kinetic studies of formaldehyde binding in tissue. Biotech. Histochem. 69, 177–179. 10.3109/10520299409106282. [DOI] [PubMed] [Google Scholar]
- Helmchen F, Denk W, 2005. Deep tissue two-photon microscopy. Nat. Methods 2, 932–940. 10.1038/nmeth818. [DOI] [PubMed] [Google Scholar]
- Hoffman DP, Slavitt I, Fitzpatrick CA, 2021. The promise and peril of deep learning in microscopy. Nat. Methods 1–2. 10.1038/s41592-020-01035-w. [DOI] [PubMed] [Google Scholar]
- Holmes KL, Lantz LM, 2001. Protein labeling with fluorescent probes. In: Methods in Cell Biology. Academic Press, pp. 185–204. [DOI] [PubMed] [Google Scholar]
- Hooks DA, Tomlinson KA, Marsden SG, LeGrice IJ, Smaill BH, Pullan AJ, Hunter PJ, 2002. Cardiac microstructure: implications for electrical propagation and defibrillation in the heart. Circ. Res. 91, 331–338. 10.1161/01.RES.0000031957.70034.89. [DOI] [PubMed] [Google Scholar]
- Hooks DA, Trew ML, Caldwell BJ, Sands GB, LeGrice IJ, Smaill BH, 2007. Laminar arrangement of ventricular myocytes influences electrical behavior of the heart. Circ. Res. 101, e103–e112. 10.1161/CIRCRESAHA.107.161075. [DOI] [PubMed] [Google Scholar]
- Hopwood D, 1967. Some aspects of fixation with glutaraldehyde. A biochemical and histochemical comparison of the effects of formaldehyde and glutaraldehyde fixation on various enzymes and glycogen, with a note on penetration of glutaraldehyde into liver. J. Anat. 101, 83–92. https://pubmed.ncbi.nlm.nih.gov/6047703. [PMC free article] [PubMed] [Google Scholar]
- Hörl D, Rojas Rusak F, Preusser F, Tillberg P, Randel N, Chhetri RK, Cardona A, Keller PJ, Harz H, Leonhardt H, Treier M, Preibisch S, 2019. BigStitcher: reconstructing high-resolution image datasets of cleared and expanded samples. Nat. Methods 16, 870–874. 10.1038/s41592-019-0501-0. [DOI] [PubMed] [Google Scholar]
- Huang F, Hartwich TMP, Rivera-Molina FE, Lin Y, Duim WC, Long JJ, Uchil PD, Myers JR, Baird MA, Mothes W, Davidson MW, Toomre D, Bewersdorf J, 2013. Video-rate nanoscopy using sCMOS camera–specific single-molecule localization algorithms. Nat. Methods 10, 653–658. 10.1038/nmeth.2488. [DOI] [PMC free article] [PubMed] [Google Scholar]
- iDISCO, 2015. Validated antibodies. Available at. https://idisco.info/validated-antibodies/. (Accessed 9 December 2020).
- Jacques SL, 2013. Optical properties of biological tissues: a review. Phys. Med. Biol. 58, R37–R61. 10.1088/0031-9155/58/11/r37. [DOI] [PubMed] [Google Scholar]
- Jæger KH, Edwards AG, McCulloch A, Tveito A, 2019. Properties of cardiac conduction in a cell-based computational model. PLoS Comput. Biol. 15, e1007042 10.1371/journal.pcbi.1007042. [DOI] [PMC free article] [PubMed] [Google Scholar]
- Jing D, Zhang S, Luo W, Gao X, Men Y, Ma C, Liu X, Yi Y, Bugde A, Zhou BO, Zhao Z, Yuan Q, Feng JQ, Gao L, Ge W-P, Zhao H, 2018. Tissue clearing of both hard and soft tissue organs with the PEGASOS method. Cell Res. 28, 803–818. 10.1038/s41422-018-0049-z. [DOI] [PMC free article] [PubMed] [Google Scholar]
- Ke M-T, Fujimoto S, Imai T, 2013. SeeDB: a simple and morphology-preserving optical clearing agent for neuronal circuit reconstruction. Nat. Neurosci. 16, 1154–1161. 10.1038/nn.3447. [DOI] [PubMed] [Google Scholar]
- Kim S-YY, Cho JH, Murray E, Bakh N, Choi H, Ohn K, Ruelas L, Hubbert A, McCue M, Vassallo SL, Keller PJ, Chung K, 2015. Stochastic electrotransport selectively enhances the transport of highly electromobile molecules. Proc. Natl. Acad. Sci. Unit. States Am. 112, E6274–E6283. 10.1073/pnas.1510133112. [DOI] [PMC free article] [PubMed] [Google Scholar]
- Klingberg A, Hasenberg A, Ludwig-Portugall I, Medyukhina A, Männ L, Brenzel A, Engel DR, Figge MT, Kurts C, Gunzer M, 2017. Fully automated evaluation of total glomerular number and capillary tuft size in nephritic kidneys using lightsheet microscopy. J. Am. Soc. Nephrol. 28, 452–459. 10.1681/ASN.2016020232. [DOI] [PMC free article] [PubMed] [Google Scholar]
- Kobayashi H, Solak AC, Batson J, Royer LA, 2020. Image Deconvolution via Noise-Tolerant Self-Supervised Inversion arXiv:2006.06156 https://arxiv.org/abs/2006.06156. [Google Scholar]
- Kurihara D, Mizuta Y, Sato Y, Higashiyama T, 2015. ClearSee: a rapid optical clearing reagent for whole-plant fluorescence imaging. Development 142, 4168–4179. 10.1242/dev.127613. [DOI] [PMC free article] [PubMed] [Google Scholar]
- Kuwajima T, Sitko AA, Bhansali P, Jurgens C, Guido W, Mason C, 2013. ClearT: a detergent- and solvent-free clearing method for neuronal and non-neuronal tissue. Development 140, 1364–1368. 10.1242/dev.091844. [DOI] [PMC free article] [PubMed] [Google Scholar]
- Lai HM, Liu AKL, Ng HHM, Goldfinger MH, Chau TW, DeFelice J, Tilley BS, Wong WM, Wu W, Gentleman SM, 2018. Next generation histology methods for three-dimensional imaging of fresh and archival human brain tissues. Nat. Commun. 9, 1066. 10.1038/s41467-018-03359-w. [DOI] [PMC free article] [PubMed] [Google Scholar]
- Lee J, Smith NP, 2012. The multi-scale modelling of coronary blood flow. Ann. Biomed. Eng. 40, 2399–2413. 10.1007/s10439-012-0583-7. [DOI] [PMC free article] [PubMed] [Google Scholar]
- Lee J, Beighley P, Ritman E, Smith NP, 2007. Automatic segmentation of 3D micro-CT coronary vascular images. Med. Image Anal. 11, 630–647. 10.1016/j.media.2007.06.012. [DOI] [PubMed] [Google Scholar]
- LeGrice IJ, Smaill BH, Chai LZ, Edgar SG, Gavin JB, Hunter PJ, 1995. Laminar structure of the heart: ventricular myocyte arrangement and connective tissue architecture in the dog. Am. J. Physiol. Heart Circ. Physiol. 269, H571–H582. 10.1152/ajpheart.1995.269.2.H571. [DOI] [PubMed] [Google Scholar]
- LeGrice IJ, Pope AJ, Sands GB, Whalley G, Doughty RN, Smaill BH, 2012. Progression of myocardial remodeling and mechanical dysfunction in the spontaneously hypertensive rat. Am. J. Physiol. Heart Circ. Physiol. 303, H1353–H1365. 10.1152/ajpheart.00748.2011. [DOI] [PubMed] [Google Scholar]
- Li J, Czajkowsky DM, Li X, Shao Z, 2015. Fast immuno-labeling by electrophoretically driven infiltration for intact tissue imaging. Sci. Rep. 5, 10640. 10.1038/srep10640. [DOI] [PMC free article] [PubMed] [Google Scholar]
- Li W, Germain RN, Gerner MY, 2017a. Multiplex, quantitative cellular analysis in large tissue volumes with clearing-enhanced 3D microscopy (Ce3D). Proc. Natl. Acad. Sci. Unit. States Am. 114, E7321–E7330. 10.1073/pnas.1708981114. [DOI] [PMC free article] [PubMed] [Google Scholar]
- Li Y, Gong H, Yang X, Yuan J, Jiang T, Li X, Sun Q, Zhu D, Wang Z, Luo Q, Li A, 2017b. TDat: an efficient platform for processing petabyte-scale whole-brain volumetric images. Front. Neural Circ. 11 10.3389/fncir.2017.00051. [DOI] [PMC free article] [PubMed] [Google Scholar]
- Li A, Guan Y, Gong H, Luo Q, 2019a. Challenges of processing and analyzing big data in mesoscopic whole-brain imaging. Dev. Reprod. Biol. 17, 337–343. 10.1016/j.gpb.2019.10.001. [DOI] [PMC free article] [PubMed] [Google Scholar]
- Li PH, Lindsey LF, Januszewski M, Zheng Z, Bates AS, Taisz I, Tyka M, Nichols M, Li F, Perlman E, Maitin-Shepard J, Blakely T, Leavitt L, Jefferis GSXE, Bock D, Jain V, 2019b. Automated Reconstruction of a Serial-Section EM Drosophila Brain with Flood-Filling Networks and Local Realignment. 10.1101/605634 bioRxiv. 605634. [DOI] [Google Scholar]
- Lin J, Keener, James P, 2014. Microdomain effects on transverse cardiac propagation. Biophys. J. 106, 925–931. 10.1016/j.bpj.2013.11.1117. [DOI] [PMC free article] [PubMed] [Google Scholar]
- Liu S, Mlodzianoski MJ, Hu Z, Ren Y, McElmurry K, Suter DM, Huang F, 2017. sCMOS noise-correction algorithm for microscopy images. Nat. Methods 14, 760–761. 10.1038/nmeth.4379. [DOI] [PMC free article] [PubMed] [Google Scholar]
- Lucy LB, 1974. An iterative technique for the rectification of observed distributions. Astron. J. 79, 745. 10.1086/111605. [DOI] [Google Scholar]
- Mandracchia B, Hua X, Guo C, Son J, Urner T, Jia S, 2020. Fast and accurate sCMOS noise correction for fluorescence microscopy. Nat. Commun. 11, 94. 10.1038/s41467-019-13841-8. [DOI] [PMC free article] [PubMed] [Google Scholar]
- Mao C, Lee MY, Jhan J-R, Halpern AR, Woodworth MA, Glaser AK, Chozinski TJ, Shin L, Pippin JW, Shankland SJ, Liu JTC, Vaughan JC, 2020. Feature-rich covalent stains for super-resolution and cleared tissue fluorescence microscopy. Sci. Adv. 6 10.1126/sciadv.aba4542 eaba4542. [DOI] [PMC free article] [PubMed] [Google Scholar]
- Masselink W, Reumann D, Murawala P, Pasierbek P, Taniguchi Y, Bonnay F, Meixner K, Knoblich JA, Tanaka EM, 2019. Broad Applicability of a Streamlined Ethyl Cinnamate-Based Clearing Procedure, vol. 146. Development. 10.1242/dev.166884. [DOI] [PMC free article] [PubMed] [Google Scholar]
- Mendonca Costa C, Campos FO, Prassl AJ, Weber dos Santos R, Sánchez-Quintana D, Ahammer H, Hofer E, Plank G, 2014. An efficient finite element approach for modeling fibrotic clefts in the heart. IEEE (Inst. Electr. Electron. Eng.) Trans. Biomed. Eng. 61, 900–910. 10.1109/TBME.2013.2292320. [DOI] [PMC free article] [PubMed] [Google Scholar]
- Mendonca Costa C, Arroyo Silva PA, Weber dos Santos R, 2016. Mind the gap: a semicontinuum model for discrete electrical propagation in cardiac tissue. IEEE (Inst. Electr. Electron. Eng.) Trans. Biomed. Eng. 63, 765–774. 10.1109/TBME.2015.2470256. [DOI] [PubMed] [Google Scholar]
- Mesradi M, Genoux A, Cuplov V, Abi-Haidar D, Jan S, Buvat I, Pain F, 2013. Experimental and analytical comparative study of optical coefficient of fresh and frozen rat tissues. J. Biomed. Opt. 18, 117010 10.1117/1.JBO.18.11.117010. [DOI] [PubMed] [Google Scholar]
- Migliori B, Datta MS, Dupre C, Apak MC, Asano S, Gao R, Boyden ES, Hermanson O, Yuste R, Tomer R, 2018. Light sheet theta microscopy for rapid high-resolution imaging of large biological samples. BMC Biol. 16, 57. 10.1186/s12915-018-0521-8. [DOI] [PMC free article] [PubMed] [Google Scholar]
- Miles A, jakirkham Durant M, Bussonnier M, Bourbeau J, Onalan T, Hamman J, Patel Z, Rocklin M, shikharsg Abernathey R, Moore J, Schut V, dussin r., de Andrade ES, Noyes C, Jelenak A, Banihirwe A, Barnes C, Sakkis G, Funke J, Kelleher J, Jevnik J, Swaney J, Rahul PS, Saalfeld S, john Tran T, bot p.i., sbalmer, 2020. zarr-developers/zarr-python. 10.5281/zenodo.3773449. [DOI] [Google Scholar]
- Moore J, Linkert M, Blackburn C, Carroll M, Ferguson RK, Flynn H, Gillen K, Leigh R, Li S, Lindner D, Moore WJ, Patterson AJ, Pindelski B, Ramalingam B, Rozbicki E, Tarkowska A, Walczysko P, Allan C, Burel J-M, Swedlow JR, 2015. OMERO and Bio-Formats 5: flexible access to large bioimaging datasets at scale. In: Proc. SPIE, p. 941307. 10.1117/12.2086370. [DOI] [Google Scholar]
- Moore J, Allan C, Besson S, Burel J-M, Diel E, Gault D, Kozlowski K, Lindner D, Linkert M, Manz T, Moore W, Pape C, Tischer C, Swedlow JR, 2021. OME-NGFF: scalable format strategies for interoperable bioimaging data. BioRxiv. 10.1101/2021.03.31.437929, 03.31.437929. [DOI] [PMC free article] [PubMed] [Google Scholar]
- Mühlenbruch G, Das M, Hohl C, Wildberger JE, Rinck D, Flohr TG, Koos R, Knackstedt C, Günther RW, Mahnken AH, 2006. Global left ventricular function in cardiac CT. Evaluation of an automated 3D region-growing segmentation algorithm. Eur. Radiol. 16, 1117–1123. 10.1007/s00330-005-0079-z. [DOI] [PubMed] [Google Scholar]
- Murray E, Cho JH, Goodwin D, Ku T, Swaney J, Kim S-Y, Choi H, Park Y-G, Park J-Y, Hubbert A, McCue M, Vassallo S, Bakh N, Frosch MP, Wedeen VJ, Seung HS, Chung K, 2015. Simple, scalable proteomic imaging for high-dimensional profiling of intact systems. Cell 163, 1500–1514. 10.1016/j.cell.2015.11.025. [DOI] [PMC free article] [PubMed] [Google Scholar]
- napari contributors, 2019. napari: a multi-dimensional image viewer for python. 10.5281/zenodo.3555620. [DOI] [Google Scholar]
- Nectow AR, Nestler EJ, 2020. Viral tools for neuroscience. Nat. Rev. Neurosci. 21, 669–681. 10.1038/s41583-020-00382-z. [DOI] [PMC free article] [PubMed] [Google Scholar]
- Nehrhoff I, Bocancea D, Vaquero J, Vaquero JJ, Ripoll J, Desco M, Gómez-Gaviro MV, 2016. 3D imaging in CUBIC-cleared mouse heart tissue: going deeper. Biomed. Opt Express 7, 3716–3720. 10.1364/BOE.7.003716. [DOI] [PMC free article] [PubMed] [Google Scholar]
- Ou Q, Jacobson Z, Abouleisa RRE, Tang X-L, Hindi SM, Kumar A, Ivey K, Giridharan G, El-Baz A, Brittian K, Rood B, Lin Y-H, Watson SA, Perbellini F, McKinsey TA, Hill BG, Jones SP, Terracciano CM, Bolli R, Mohamed TMA, 2019. Physiological biomimetic culture system for pig and human heart slices. Circ. Res. 125, 628–642. 10.1161/CIRCRESAHA.119.314996. [DOI] [PMC free article] [PubMed] [Google Scholar]
- Park Y-G, Sohn CH, Chen R, McCue M, Yun DH, Drummond GT, Ku T, Evans NB, Oak HC, Trieu W, Choi H, Jin X, Lilascharoen V, Wang J, Truttmann MC, Qi HW, Ploegh HL, Golub TR, Chen S-C, Frosch MP, Kulik HJ, Lim BK, Chung K, 2019. Protection of tissue physicochemical properties using polyfunctional crosslinkers. Nat. Biotechnol. 37, 73e83. 10.1038/nbt.4281. [DOI] [PMC free article] [PubMed] [Google Scholar]
- Peng H, Ruan Z, Long F, Simpson JH, Myers EW, 2010. V3D enables real-time 3D visualization and quantitative analysis of large-scale biological image data sets. Nat. Biotechnol. 28, 348–353. 10.1038/nbt.1612. [DOI] [PMC free article] [PubMed] [Google Scholar]
- Peng H, Bria A, Zhou Z, Iannello G, Long F, 2014. Extensible visualization and analysis for multidimensional images using Vaa3D. Nat. Protoc. 9, 193–208. 10.1038/nprot.2014.011. [DOI] [PubMed] [Google Scholar]
- Perona P, Malik J, 1990. Scale-space and edge detection using anisotropic diffusion. IEEE Trans. Pattern Anal. Mach. Intell. 12, 629–639. 10.1109/34.56205. [DOI] [Google Scholar]
- Pietzsch T, Saalfeld S, Preibisch S, Tomancak P, 2015. BigDataViewer: visualization and processing for large image data sets. Nat. Methods 12, 481–483. 10.1038/nmeth.3392. [DOI] [PubMed] [Google Scholar]
- Pinter P, Dietrich S, Bertram B, Kehrer L, Elsner P, Weidenmann KA, 2018. Comparison and error estimation of 3D fibre orientation analysis of computed tomography image data for fibre reinforced composites. NDT – Int. 95, 26–35. 10.1016/j.ndteint.2018.01.001. [DOI] [Google Scholar]
- Planchon TA, Gao L, Milkie DE, Davidson MW, Galbraith JA, Galbraith CG, Betzig E, 2011. Rapid three-dimensional isotropic imaging of living cells using Bessel beam plane illumination. Nat. Methods 8, 417–423. 10.1038/nmeth.1586. [DOI] [PMC free article] [PubMed] [Google Scholar]
- Pluempitiwiriyawej C, Moura JM, Fellow Wu YJ, Ho C, 2005. STACS: new active contour scheme for cardiac MR image segmentation. IEEE Trans. Med. Imag. 24, 593–603. 10.1109/TMI.2005.843740. [DOI] [PubMed] [Google Scholar]
- Poinot M, 2010. Five good reasons to use the hierarchical data format. Comput. Sci. Eng. 12, 84–90. 10.1109/MCSE.2010.107. [DOI] [Google Scholar]
- Pope AJ, Sands GB, Smaill BH, LeGrice IJ, 2008. Three-dimensional transmural organization of perimysial collagen in the heart. Aust. J. Pharm.: Heart Circulat. Physiol. 295, H1243–H1252. 10.1152/ajpheart.00484.2008. [DOI] [PMC free article] [PubMed] [Google Scholar]
- Pratondo A, Chui C-K, Ong S-H, 2017. Integrating machine learning with region-based active contour models in medical image segmentation. J. Vis. Commun. Image Represent. 43, 1–9. 10.1016/j.jvcir.2016.11.019. [DOI] [Google Scholar]
- Qiao C, Li D, Guo Y, Liu C, Jiang T, Dai Q, Li D, 2021. Evaluation and development of deep neural networks for image super-resolution in optical microscopy. Nat. Methods 1–9. 10.1038/s41592-020-01048-5. [DOI] [PubMed] [Google Scholar]
- Rajendran PS, Challis RC, Fowlkes CC, Hanna P, Tompkins JD, Jordan MC, Hiyari S, Gabris-Weber BA, Greenbaum A, Chan KY, Deverman BE, Münzberg H, Ardell JL, Salama G, Gradinaru V, Shivkumar K, 2019. Identification of peripheral neural circuits that regulate heart rate using optogenetic and viral vector strategies. Nat. Commun. 10, 1944. 10.1038/s41467-019-09770-1. [DOI] [PMC free article] [PubMed] [Google Scholar]
- Renier N, Wu Z, Simon, David J, Yang J, Ariel P, Tessier-Lavigne M, 2014. iDISCO: a simple, rapid method to immunolabel large tissue samples for volume imaging. Cell 159, 896–910. 10.1016/j.cell.2014.10.010. [DOI] [PubMed] [Google Scholar]
- Renier N, Adams EL, Kirst C, Wu Z, Azevedo R, Kohl J, Autry AE, Kadiri L, Umadevi Venkataraju K, Zhou Y, Wang VX, Tang CY, Olsen O, Dulac C, Osten P, Tessier-Lavigne M, 2016. Mapping of brain activity by automated volume analysis of immediate early genes. Cell 165, 1789–1802. 10.1016/j.cell.2016.05.007. [DOI] [PMC free article] [PubMed] [Google Scholar]
- Richardson WH, 1972. Bayesian-based iterative method of image restoration. JOSA 62, 55–59. 10.1364/JOSA.62.000055. [DOI] [Google Scholar]
- Richardson DS, Lichtman JW, 2015. Clarifying tissue clearing. Cell 162, 246–257. 10.1016/j.cell.2015.06.067. [DOI] [PMC free article] [PubMed] [Google Scholar]
- Romero DP, Camara O, Sachse FB, Sebastian R, 2016. Analysis of microstructure of the cardiac conduction system based on three-dimensional confocal microscopy. PloS One 11, e0164093. 10.1371/journal.pone.0164093. [DOI] [PMC free article] [PubMed] [Google Scholar]
- Rubart M, 2004. Two-photon microscopy of cells and tissue. Circ. Res. 95, 1154–1166. 10.1161/01.RES.0000150593.30324.42. [DOI] [PubMed] [Google Scholar]
- Rutherford SL, Trew ML, Sands GB, LeGrice IJ, Smaill BH, 2012. High-resolution 3-dimensional reconstruction of the infarct border zone: impact of structural remodeling on electrical activation. Circ. Res. 111, 301–311. 10.1161/CIRCRESAHA.111.260943. [DOI] [PubMed] [Google Scholar]
- Sage D, Donati L, Soulez F, Fortun D, Schmit G, Seitz A, Guiet R, Vonesch C, Unser M, 2017. DeconvolutionLab2: an open-source software for deconvolution microscopy. Methods 115, 28–41. 10.1016/j.ymeth.2016.12.015. [DOI] [PubMed] [Google Scholar]
- Saha PK, Borgefors G, Sanniti di Baja G, 2016. A survey on skeletonization algorithms and their applications. Pattern Recogn. Lett. 76, 3–12. 10.1016/j.patrec.2015.04.006. [DOI] [Google Scholar]
- Sanderson J, 2019. In: Optical Sectioning and Confocal Microscopy, Understanding Light Microscopy. John Wiley & Sons, Ltd, pp. 425–446. [Google Scholar]
- Sarder P, Nehorai A, 2006. Deconvolution methods for 3-D fluorescence microscopy images. IEEE Signal Process. Mag. 23, 32–45. 10.1109/msp.2006.1628876. [DOI] [Google Scholar]
- Seidel T, Edelmann JC, Sachse FB, 2015. Analyzing remodeling of cardiac tissue: a comprehensive approach based on confocal microscopy and 3D reconstructions. Ann. Biomed. Eng. 1–13. 10.1007/s10439-015-1465-6. [DOI] [PMC free article] [PubMed] [Google Scholar]
- Sezgin M, Sankur B, 2004. Survey over image thresholding techniques and quantitative performance evaluation. J. Electron. Imag. 13 10.1117/1.1631315. [DOI] [Google Scholar]
- Singh AP, Krieger JW, Buchholz J, Charbon E, Langowski J, Wohland T, 2013. The performance of 2D array detectors for light sheet based fluorescence correlation spectroscopy. Opt Express 21, 8652–8668. 10.1364/OE.21.008652. [DOI] [PubMed] [Google Scholar]
- Sivaguru M, Fried G, Sivaguru BS, Sivaguru VA, Lu X, Choi KH, Saif MTA, Lin B, Sadayappan S, 2015. Cardiac muscle organization revealed in 3-D by imaging whole-mount mouse hearts using twophoton fluorescence and confocal microscopy. Biotechniques 59, 295–308. 10.2144/000114356. [DOI] [PubMed] [Google Scholar]
- Smith K, Li Y, Piccinini F, Csucs G, Balazs C, Bevilacqua A, Horvath P, 2015. CIDRE: an illumination-correction method for optical microscopy. Nat. Methods 12, 404–406. 10.1038/nmeth.3323. [DOI] [PubMed] [Google Scholar]
- Soltanian-Zadeh H, Shahrokni A, Khalighi M-M, Zhang ZG, Zoroofi RA, Maddah M, Chopp M, 2005. 3-D quantification and visualization of vascular structures from confocal microscopic images using skeletonization and voxel-coding. Comput. Biol. Med. 35, 791–813. 10.1016/j.compbiomed.2004.06.009. [DOI] [PubMed] [Google Scholar]
- Stinstra J, MacLeod R, Henriquez C, 2010. Incorporating histology into a 3D microscopic computer model of myocardium to study propagation at a cellular level. Ann. Biomed. Eng. 38, 1399–1414. 10.1007/s10439-009-9883-y. [DOI] [PMC free article] [PubMed] [Google Scholar]
- Stocker M, Darroch L, Krahl R, Habermann T, Devaraju A, Schwardmann U, D’Onofrio C, Häggström I, 2020. Persistent identification of instruments. Data Sci. J. 19, 18. 10.5334/dsj-2020-018. [DOI] [Google Scholar]
- Sun Y, Davis P, Kosmacek EA, Ianzini F, MacKey MA, 2009. An open-source deconvolution software package for 3-D quantitative fluorescence microscopy imaging. J. Microsc. 236, 180–193. 10.1111/j.1365-2818.2009.03205.x. [DOI] [PMC free article] [PubMed] [Google Scholar]
- Susaki EA, Tainaka K, Perrin D, Kishino F, Tawara T, Watanabe TM, Yokoyama C, Onoe H, Eguchi M, Yamaguchi S, Abe T, Kiyonari H, Shimizu Y, Miyawaki A, Yokota H, Ueda HR, 2014. Whole-brain imaging with single-cell resolution using chemical cocktails and computational analysis. Cell 157, 726–739. 10.1016/j.cell.2014.03.042. [DOI] [PubMed] [Google Scholar]
- Tainaka K, Kubota SI, Suyama TQ, Susaki EA, Perrin D, Ukai-Tadenuma M, Ukai H, Ueda HR, 2014. Whole-body imaging with single-cell resolution by tissue decolorization. Cell 159, 911–924. 10.1016/j.cell.2014.10.034. [DOI] [PubMed] [Google Scholar]
- Tainaka K, Kuno A, Kubota SI, Murakami T, Ueda HR, 2016. Chemical principles in tissue clearing and staining protocols for whole-body cell profiling. Annu. Rev. Cell Dev. Biol. 32, 713–741. 10.1146/annurev-cellbio-111315-125001. [DOI] [PubMed] [Google Scholar]
- Tainaka K, Murakami TC, Susaki EA, Shimizu C, Saito R, Takahashi K, Hayashi-Takagi A, Sekiya H, Arima Y, Nojima S, Ikemura M, Ushiku T, Shimizu Y, Murakami M, Tanaka KF, Iino M, Kasai H, Sasaoka T, Kobayashi K, Miyazono K, Morii E, Isa T, Fukayama M, Kakita A, Ueda HR, 2018. Chemical landscape for tissue clearing based on hydrophilic reagents. Cell Rep. 24, 2196–2210. 10.1016/j.celrep.2018.07.056e9. [DOI] [PubMed] [Google Scholar]
- Tischer C, Ravindran A, Reither S, Chiaruttini N, Pepperkok R, Norlin N, 2021. BigDataProcessor2: a free and open-source Fiji plugin for inspection and processing of TB sized image data. Bioinformatics. 10.1093/bioinformatics/btab106. [DOI] [PMC free article] [PubMed] [Google Scholar]
- Tomer R, Khairy K, Amat F, Keller PJ, 2012. Quantitative high-speed imaging of entire developing embryos with simultaneous multiview light-sheet microscopy. Nat. Methods 9, 755–763. 10.1038/nmeth.2062. [DOI] [PubMed] [Google Scholar]
- Tomer R, Ye L, Hsueh B, Deisseroth K, 2014. Advanced CLARITY for rapid and high-resolution imaging of intact tissues. Nat. Protoc. 9, 1682–1697. 10.1038/nprot.2014.123. [DOI] [PMC free article] [PubMed] [Google Scholar]
- Trew ML, LeGrice IJ, Smaill BH, Pullan AJ, 2005. A finite volume method for modeling discontinuous electrical activation in cardiac tissue. Ann. Biomed. Eng. 33, 590–602. 10.1007/s10439-005-1434-6. [DOI] [PubMed] [Google Scholar]
- Treweek JB, Chan KY, Flytzanis NC, Yang B, Deverman BE, Greenbaum A, Lignell A, Xiao C, Cai L, Ladinsky MS, Bjorkman PJ, Fowlkes CC, Gradinaru V, 2015. Whole-body tissue stabilization and selective extractions via tissue-hydrogel hybrids for high-resolution intact circuit mapping and phenotyping. Nat. Protoc. 10, 1860–1896. 10.1038/nprot.2015.122. [DOI] [PMC free article] [PubMed] [Google Scholar]
- Ueda HR, Dodt H-U, Osten P, Economo MN, Chandrashekar J, Keller PJ, 2020a. Whole-brain profiling of cells and circuits in mammals by tissue clearing and light-sheet microscopy. Neuron 106, 369–387. 10.1016/j.neuron.2020.03.004. [DOI] [PMC free article] [PubMed] [Google Scholar]
- Ueda HR, Ertürk A, Chung K, Gradinaru V, Chédotal A, Tomancak P, Keller PJ, 2020b. Tissue clearing and its applications in neuroscience. Nat. Rev. Neurosci. 21, 61–79. 10.1038/s41583-019-0250-1. [DOI] [PMC free article] [PubMed] [Google Scholar]
- Vadakkumpadan F, Rantner LJ, Tice B, Boyle P, Prassl AJ, Vigmond E, Plank G, Trayanova N, 2009. Image-based models of cardiac structure with applications in arrhythmia and defibrillation studies. J. Electrocardiol. 42, 157.e1–157.e10. 10.1016/j.jelectrocard.2008.12.003. [DOI] [PMC free article] [PubMed] [Google Scholar]
- Veeraraghavan R, Lin J, Hoeker GS, Keener JP, Gourdie RG, Poelzing S, 2015. Sodium channels in the Cx43 gap junction perinexus may constitute a cardiac ephapse: an experimental and modeling study. Pflueg. Arch. Eur. J. Physiol. 467, 2093–2105. 10.1007/s00424-014-1675-z. [DOI] [PMC free article] [PubMed] [Google Scholar]
- Vigneshwaran V, Sands GB, LeGrice IJ, Smaill BH, Smith NP, 2019. Reconstruction of coronary circulation networks: a review of methods. Microcirculation, e12542. 10.1111/micc.12542. [DOI] [PubMed] [Google Scholar]
- Vormstein-Schneider D, Lin JD, Pelkey KA, Chittajallu R, Guo B, Arias-Garcia MA, Allaway K, Sakopoulos S, Schneider G, Stevenson O, Vergara J, Sharma J, Zhang Q, Franken TP, Smith J, Ibrahim LA, Astro KJM, Sabri E, Huang S, Favuzzi E, Burbridge T, Xu Q, Guo L, Vogel I, Sanchez V, Saldi GA, Gorissen BL, Yuan X, Zaghloul KA, Devinsky O, Sabatini BL, Batista-Brito R, Reynolds J, Feng G, Fu Z, McBain CJ, Fishell G, Dimidschstein J, 2020. Viral manipulation of functionally distinct interneurons in mice, non-human primates and humans. Nat. Neurosci. 1–8 10.1038/s41593-020-0692-9. [DOI] [PMC free article] [PubMed] [Google Scholar]
- Wang X-F, Huang D-S, Xu H, 2010. An efficient local Chan–Vese model for image segmentation. Pattern Recogn. 43, 603–618. 10.1016/j.patcog.2009.08.002. [DOI] [Google Scholar]
- Wilhelm S, Gröbler B, Gluch M, Heinz H, 2010. Confocal laser scanning microscopy principles. Carl. Zeiss Jena. http://zeiss-campus.magnet.fsu.edu/referencelibrary/pdfs/ZeissConfocalPrinciples.pdf. [Google Scholar]
- Wilkinson MD, Dumontier M, Aalbersberg IJ, Appleton G, Axton M, Baak A, Blomberg N, Boiten J-W, da Silva Santos LB, Bourne PE, Bouwman J, Brookes AJ, Clark T, Crosas M, Dillo I, Dumon O, Edmunds S, Evelo CT, Finkers R, Gonzalez-Beltran A, Gray AJG, Groth P, Goble C, Grethe JS, Heringa J, t Hoen PAC, Hooft R, Kuhn T, Kok R, Kok J, Lusher SJ, Martone ME, Mons A, Packer AL, Persson B, Rocca-Serra P, Roos M, van Schaik R, Sansone S-A, Schultes E, Sengstag T, Slater T, Strawn G, Swertz MA, Thompson M, van der Lei J, van Mulligen E, Velterop J, Waagmeester A, Wittenburg P, Wolstencroft K, Zhao J, Mons B, 2016. The FAIR Guiding Principles for scientific data management and stewardship. Sci. Data 3, 160018. 10.1038/sdata.2016.18. [DOI] [PMC free article] [PubMed] [Google Scholar]
- Wolleschensky R, Zimmermann B, Kempe M, 2006. High-speed confocal fluorescence imaging with a novel line scanning microscope. J. Biomed. Opt. 11, 064011 10.1117/1.2402110. [DOI] [PubMed] [Google Scholar]
- Wu J, He Y, Yang Z, Guo C, Luo Q, Zhou W, Chen S, Li A, Xiong B, Jiang T, Gong H, 2014. 3D BrainCV: simultaneous visualization and analysis of cells and capillaries in a whole mouse brain with one-micron voxel resolution. Neuroimage 87, 199–208. 10.1016/j.neuroimage.2013.10.036. [DOI] [PubMed] [Google Scholar]
- Xiao L, Fang C, Zhu L, Wang Y, Yu T, Yu T, Zhao Y, Zhu D, Zhu D, Fei P, 2020. Deep learning-enabled efficient image restoration for 3D microscopy of turbid biological specimens. Opt Express 28, 30234–30247. 10.1364/OE.399542. [DOI] [PubMed] [Google Scholar]
- Yang B, Treweek JB, Kulkarni RP, Deverman BE, Chen C-K, Lubeck E, Shah S, Cai L, Gradinaru V, 2014. Single-cell phenotyping within transparent intact tissue through whole-body clearing. Cell 158, 945–958. 10.1016/j.cell.2014.07.017. [DOI] [PMC free article] [PubMed] [Google Scholar]
- Yang T, Zheng T, Shang Z, Wang X, Lv X, Yuan J, Zeng S, 2015. Rapid imaging of large tissues using high-resolution stage-scanning microscopy. Biomed. Opt Express 6, 1867–1875. 10.1364/boe.6.001867. [DOI] [PMC free article] [PubMed] [Google Scholar]
- Yayon N, Dudai A, Vrieler N, Amsalem O, London M, Soreq H, 2018. Intensify3D: normalizing signal intensity in large heterogenic image stacks. Sci. Rep. 8, 4311. 10.1038/s41598-018-22489-1. [DOI] [PMC free article] [PubMed] [Google Scholar]
- Yu JK, Franceschi W, Huang Q, Pashakhanloo F, Boyle PM, Trayanova NA, 2019. A comprehensive, multiscale framework for evaluation of arrhythmias arising from cell therapy in the whole post-myocardial infarcted heart. Sci. Rep. 9, 9238. 10.1038/s41598-019-45684-0. [DOI] [PMC free article] [PubMed] [Google Scholar]
- Zhu J, Yu T, Li Y, Xu J, Qi Y, Yao Y, Ma Y, Wan P, Chen Z, Li X, Gong H, Luo Q, Zhu D, 2020. MACS: rapid aqueous clearing system for 3D mapping of intact organs. Adv. Sci. 7, 1903185 10.1002/advs.201903185. [DOI] [PMC free article] [PubMed] [Google Scholar]
Associated Data
This section collects any data citations, data availability statements, or supplementary materials included in this article.