

Abstract
The activation of heterotrimeric G proteins (Gαβγ) by G-protein–coupled receptors (GPCRs) is a mechanism broadly used by eukaryotes to transduce signals across the plasma membrane and a target for many clinical drugs. Many optical biosensors commonly used for measuring GPCR-stimulated G protein activity rely on exogenously expressed GPCRs and/or G proteins, which compromises readout fidelity. Biosensors that measure endogenous signaling may interfere with the signaling process under investigation or have a limited dynamic range of detection, hindering applicability. Here, we developed an optical BRET-based biosensor, Gαi bONE-GO, that detects endogenous GTP-bound (active) Gαi upon stimulation of endogenous GPCRs more robustly than existing sensors of endogenous activity. Its design leverages the Gαi-binding protein GINIP as a high-affinity and specific detector of Gαi-GTP. We optimized this design to prevent interference with downstream Gi-dependent signaling and to enable implementation in different experimental systems having endogenous GPCRs, including adenosine receptors in primary astroglial cells and opioid receptors in cell lines. In a neuronal cell line, Gαi bONE-GO revealed activation profiles indicating that several natural opioid neuropeptides acted as partial agonists, in contrast to their characterization as full agonists using biosensors that depend on exogenously expressed receptors and G proteins. The Gαi bONE-GO biosensor is a direct and sensitive detector of endogenous activation of Gαi proteins by GPCRs in different experimental settings but does not interfere with the subsequent propagation of signaling.
INTRODUCTION
Heterotrimeric G proteins (Gαβγ) are quintessential mediators of intercellular communication (1-4). Defining the molecular mechanisms by which they are regulated is of paramount importance because they impact a vast range of physiological processes and diseases. This is well exemplified by the ongoing interest in G protein–coupled receptors (GPCRs), which are the canonical activators of G proteins. GPCRs are receptors displayed at the cell surface that, upon stimulation, activate an intracellular G protein, a transducer that leads to a cellular response (1, 3, 5, 6). This evolutionarily conserved mechanism of signal transduction is very versatile, because it instructs intracellular responses to numerous extracellular stimuli of diverse nature, including neurotransmitters, hormones, light, odorants, or mechanical cues, among others (3, 5, 7-9). The medical relevance of GPCRs is evident not only because they serve as pharmacological targets for >30% of clinically approved drugs, but also because they remain actively pursued for the development of new and improved therapeutic approaches (10-12). For example, opioid drugs exert their potent analgesic effects by targeting the same GPCRs that are activated by endogenous neuropeptides like endorphins, enkephalins, or dynorphins (13). These GPCRs, including the μ-opioid receptor (MOR) and the δ-opioid receptor (DOR) among others, have been the subject of intense pharmacological research to develop safer analgesic drug alternatives with reduced deleterious side-effects like dependency or respiratory depression, although some other GPCRs have also started to emerge as potential targets for this purpose (14-19).
Mechanistically, heterotrimeric G protein signaling starts with GPCRs acting as guanine nucleotide exchange factors (GEFs), promoting the exchange of GDP for GTP in Gα subunits, leading to formation of Gα-GTP and free Gβγ species that modulate downstream effectors, such as adenylyl cyclases, to propagate signaling. Based on the structural and functional similarities of Gα subunits, G proteins are classified into four families: Gi/o, Gs, Gq/11, and G12/13 (1). The specificity of GPCRs for coupling to different G proteins displays varying degrees of selectivity; some GPCRs recognize a particular family of G proteins with high specificity, whereas other GPCRs couple promiscuously to G proteins across different families (20). The identity of the G protein dictates the nature of the cellular response elicited by acting on specific downstream effectors. For example, Gαs-GTP formed upon activation of the β2 adrenergic receptor (β2AR) stimulates the effector adenylyl cyclase, whereas Gαi-GTP formed upon activation of the metabotropic γ-aminobutyric acid GABAB receptor (GABABR) (21) or opioid receptors (22-24) inhibits it. These opposing actions translate into the corresponding effects on the amount of the second messenger cyclic adenosine monophosphate (cAMP) synthesized by adenylyl cyclases, which dictates various cell responses.
A general strategy to measure G protein signaling responses is to use indirect approaches, including the measurement of downstream second messengers like cAMP. Another general strategy is to directly measure the formation of active G protein species, which is frequently done using optical biosensors based on resonance energy transfer (RET) methods with fluorescent or bioluminescent donors (FRET or BRET, respectively) (25-29). Indirect approaches are subject to crosstalk or signal amplification events that compromise the fidelity of the readout as a representation of the GPCR-G protein signal transduction event. Although biosensors that directly measure G protein activation in real time greatly alleviate these issues, they are not devoid of limitations. For example, a broad class of biosensor designs that monitor the dissociation of Gα and Gβγ subunits (26-28, 30) requires the expression of multiple genetic components including exogenous, tagged G proteins. This has two potentially undesired consequences. One is that overexpression of exogenous G proteins might distort the readout and interfere with endogenous GPCR signaling (31). The other consequence is that the need for simultaneous expression of multiple genetic components restricts their implementation to cells lines that are easily transfected. The latter scenario in cell lines also tends to be accompanied by the need to express exogenous GPCRs to detect responses, which skews the system further away from a native cellular condition. Thus, these widely adopted biosensors are not well suited to investigate endogenous GPCR activity, especially in physiologically-relevant systems like primary cells.
Another broad class of biosensors has been developed to detect Gα-GTP instead of Gα-Gβγ dissociation, which have overcome some of the limitations in terms of preservation of signaling fidelity and of applicability across physiologically relevant systems. The first example of this class of biosensors is a platform based on the BRET biosensor with ER/K linker and YFP (BERKY) design (32). These biosensors consist of a single polypeptide chain that permits the detection of endogenous Gα-GTP generated by endogenous GPCRs in different experimental settings, including primary cells like neurons, and without interfering with GPCR-G protein signaling to downstream targets (32). Although BERKY biosensors overcome many of the limitations of preceding biosensor designs, the modest dynamic range of detection for endogenous responses has probably hindered their wider applicability. Other biosensor platforms to detect Gα-GTP developed subsequently, like ONE vector G protein optical (ONE-GO) biosensors (33), or the effector membrane translocation assay (EMTA, (34)), have improved the dynamic range of detection of G protein activation by endogenous GPCRs, albeit at the expense of other limitations. For example, the ONE-GO sensors design is based on assembling and delivering a multicomponent biosensor system with a single vector, allowing for the measurement of responses triggered by endogenous GPCRs in a remarkably wide range of primary cell types and without interfering with downstream signaling (33), yet it requires expression of trace amounts of exogenous, tagged Gα subunits. As for the EMTA system, even though it was shown to work with endogenous, untagged Gα subunits for some types of G proteins (34), its applicability for endogenous GPCRs across physiologically-relevant systems like primary cells has not been established. The latter may be related to the difficulty of delivering the multiple genetic components composing this type of sensor to cells. Furthermore, it is possible that EMTA components interfere with GPCR signaling, a potential limitation that has not been assessed (34). Thus, there is still a critical unmet need to develop biosensors for the detection of endogenous G protein activity that combine a large dynamic range of detection with the lack of interference with GPCR signaling and potential for broad applicability across experimental settings.
Here, we introduce a BRET biosensor design that detects endogenous Gαi-GTP, even when produced upon stimulation of endogenous GPCRs in cell lines or primary cells, without interfering with signaling to downstream effectors. We focused on Gαi to develop the new design based on the Gαi-binding protein named Gαi-interacting protein (GINIP, also known as PHF24 or KIAA1045) (35-37), which was leveraged as a critical component of the biosensor to sensitively and specifically detect the active conformation of the G protein. We also optimized an initial prototype to abolish interference with signaling and to facilitate implementation in different experimental systems by assembling all sensor components in a single vector. We showcase the versatility of this biosensor design by implementing it in a broad range of formats, from transient transfection to generation of stable cell lines to short-term lentiviral transduction of primary cells, and by demonstrating its utility in characterizing responses from many different GPCRs and many different ligands, including the profiling of the activity of opioid neuropeptides on endogenously expressed opioid receptors.
RESULTS
Detection of endogenous Gαi-GTP in cells with bystander BRET
We envisioned a bioluminescence resonance energy transfer (BRET)-based biosensor design for the detection of endogenous Gαi activation based on two components: a detector module for Gαi-GTP fused to the BRET donor nanoluciferase (Nluc), and a membrane-anchored BRET acceptor fluorescent protein (YFP) (Fig. 1A). The principle of this design is that the BRET donor would be recruited from the cytosol to the plasma membrane upon activation of membrane-resident Gαi subunits, which would in turn lead to BRET with the acceptor due to the increased proximity and crowding effects on the two-dimensional plane of the membrane, a phenomenon known as bystander BRET (38, 39). We reasoned that the GPCR signaling modulator GINIP would serve as a module to detect active Gαi with high sensitivity and specificity based on its high affinity (KD~65 nM) for the G protein in its GTP-bound conformation but not in its GDP-bound one (35, 36). GINIP binds similarly to the three Gαi isoforms, Gαi1, Gαi2, and Gαi3, but not to other G proteins of the Gαi/o family like Gαo and Gαz, or to members of other G protein families (35). GINIP does not directly affect nucleotide binding or hydrolysis by Gα (35), which we reasoned would minimize the potential interference of our biosensor design with the signaling process to be measured. To test this design, we coexpressed GINIP-Nluc and YFP-CAAX (39) (a fusion of YFP and the C-terminal sequence of KRas containing a polybasic sequence and prenylation box for plasma membrane targeting) with the metabotropic γ-aminobutyric acid GABAB receptor (GABABR) in HEK293T cells (Fig. 1, B and C). No exogenous G protein was expressed. Stimulation of the GABABR with GABA led to a marked increase in BRET that was rapidly reverted upon addition of the GABABR antagonist CGP54626. This response was efficiently suppressed by pertussis toxin (PTX) (Fig. 1B), which modifies Gαi subunits to prevent their activation by GPCRs, or by a mutation in GINIP (W139A) that disrupts its binding to G proteins (36) (Fig. 1C), indicating that the BRET change represents Gαi activity. Using this biosensor, we obtained concentration-response curves not only for GABABR, but also for three other Gi-coupled GPCRs: α2A-adrenergic receptor (α2AAR), dopamine 2 receptor (D2R), and MOR (Fig. 1D). These results demonstrate that, when coexpressed in cells, GINIP-Nluc and YFP-CAAX constitute a bystander BRET sensor for endogenous Gαi activation downstream of multiple GPCRs.
Fig. 1. Detection of endogenous Gαi-GTP with a bystander BRET biosensor based on GINIP.
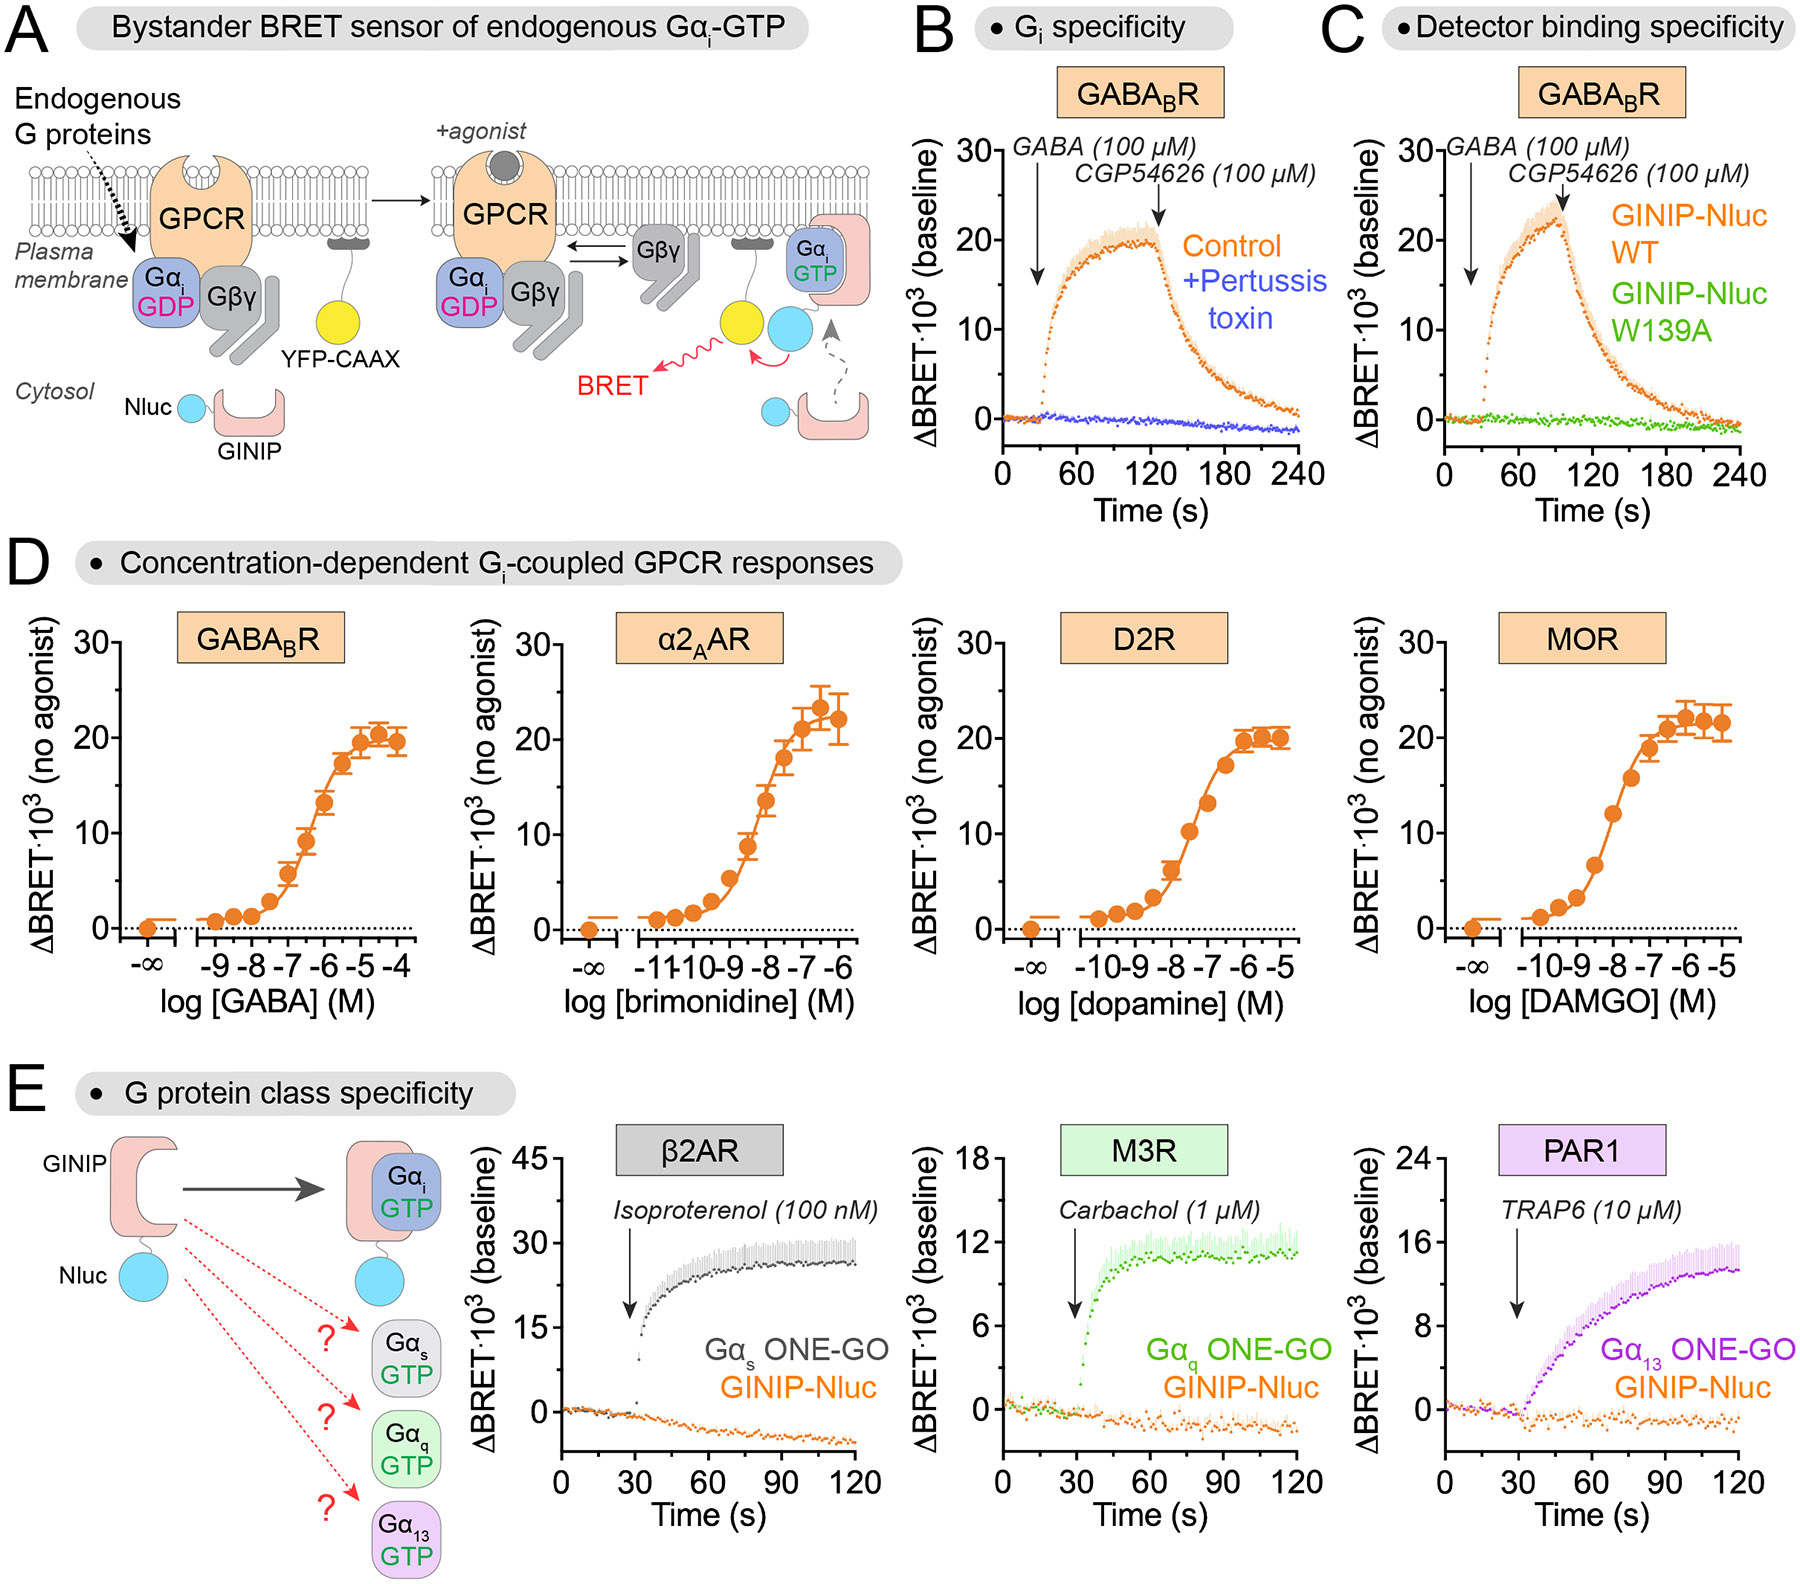
(A) Diagram showing the detection of endogenous Gαi-GTP using bystander BRET when nanoluciferase (Nluc)-fused GINIP (BRET donor) in the cytosol is recruited to the proximity of membrane-anchored YFP (YFP-CAAX, BRET acceptor) due to binding to membrane-bound Gαi-GTP. (B) Kinetic BRET measurements were carried out in HEK293T cells expressing GABABR, GINIP-Nluc, and YFP-CAAX, but no exogenous G protein, in the absence (orange) or presence (blue) of Pertussis toxin (PTX-S1 expression). Cells were treated with GABA and CGP54626 as indicated. Mean ± S.E.M. N=4 independent experiments. (C) Kinetic BRET measurements were carried out as in (B), except that GINIP-Nluc WT (orange) was compared to cells expressing a GINIP-Nluc construct bearing the G protein binding–deficient mutant W139A (green). Mean ± S.E.M., N=3 independent experiments for GINIP-Nluc WT, and N=2 independent experiments for GINIP-Nluc W139A. (D) Changes in BRET were measured in HEK293T cells expressing GINIP-Nluc WT and YFP-CAAX along with the indicated GPCR upon stimulation with their cognate agonists. Mean ± S.E.M., N=3 Independent experiments. (E) BRET was measured in HEK293T cells expressing GINIP-Nluc WT and YFP-CAAX (orange) along with the indicated GPCRs upon stimulation with their cognate agonists. In parallel experiments, BRET was measured in HEK293T cells expressing Gαs ONE-GO (grey), Gαq ONE-GO (green), or Gα13 ONE-GO (magenta) along with the indicated GPCRs upon stimulation with their cognate agonists. Mean ± S.E.M., N=3 independent experiments.
Detection of Gαi-GTP with the GINIP-based bystander sensor displays a large dynamic range
To benchmark the performance of the newly developed bystander BRET sensor, we compared it to BERKY biosensors, a “gold standard” for the direct detection of endogenous G protein activity (32). When compared side-by-side with the BERKY biosensor for Gαi-GTP (Gαi*-BERKY3), the newly developed GINIP-based bystander BRET sensor led to much larger responses (~10-fold) and an improved signal-to-noise ratio (~10-fold) upon stimulation of GABABR in HEK293T cells expressing exclusively endogenous G proteins (fig. S1). This indicates that the bystander BRET sensor outperforms previously described BERKY biosensors for the detection of endogenous Gαi-GTP, leading to an improvement in the dynamic range and signal-to-noise ratio of the responses detected.
GINIP-based bystander Gαi sensor does not detect the activation of G proteins of other families
We assessed the selectivity of the bystander BRET sensor for detecting Gαi over other types of Gα proteins. For this, we tested whether the sensor would detect responses upon stimulation of GPCRs that activate representative members of the other families of heterotrimeric G proteins (Gs, Gq/11, and G12/13, instead of Gi/o) (Fig. 1E), with the expectation that they would not because GINIP binds only to Gαi1, Gαi2, and Gαi3 (35, 40). Stimulation of the β2AR, the M3 muscarinic acetylcholine receptor (M3R), or the protease-activated receptor 1 (PAR1), all of which are known to activate Gs, Gq/11, or G12/13 (20, 34), respectively, did not lead to a BRET response in HEK293T cells expressing GINIP-Nluc and YFP-CAAX (Fig. 1E). This was not because of lack of activation of the cognate G proteins, because we detected their activation using another type of biosensor (ONE-GO, (33)) in parallel experiments with the same GPCRs (Fig. 1E). These observations validate that the bystander BRET sensor specifically detects Gαi activity without contribution of Gα proteins of other families to the observed responses.
GINIP-based bystander BRET sensor primarily detects Gαi among G proteins of the Gαi/o family
To explore the selectivity of the bystander BRET sensor for different Gα subunits within the Gαi/o family, we compared the BRET responses detected upon activation of Gαi1, as a representative of Gαi isoforms, with the other most ubiquitously-expressed members of the Gαi/o family, Gαz and Gαo, of which the latter is the most abundant G protein in the brain (20). To make this comparison possible, activation of endogenous Gαi proteins was blocked with PTX after expression of PTX-insensitive (PTXi) versions of Gαi1 or Gαo carrying C351G mutations or of Gαz wild-type (WT), which is naturally insensitive to PTX. Before assessing G protein activation using the GINIP-based bystander BRET sensor, we determined whether Gαo PTXi and Gαz could be activated at least as effectively as Gαi1 PTXi upon GPCR stimulation in the presence of PTX using a different biosensor platform (ONE-GO biosensors (33)). We found that stimulation of the serotonin 1a receptor (5-HT1aR) or the cholinergic muscarinic receptor 2 (M2R) with their cognate agonists led to BRET responses with Gαo PTXi and Gαz that were as large or larger than those observed with Gαi1 PTXi (fig. S2A). Activation of Gαi1 WT was completely ablated, confirming the efficacy of PTX (fig. S2A). In contrast, under equivalent experimental conditions with the GINIP-based bystander BRET sensor, no responses were detected with Gαz, and the responses with Gααo PTXi were much smaller than those observed with Gαi1 PTXi (fig. S2B). Given that direct protein-protein binding experiments have previously shown an absence of GINIP binding to Gαo under conditions of robust binding to Gαi (35), a likely explanation for the observations in BRET experiments is that the response with Gαo is facilitated by its overexpression in this experimental paradigm. We conclude that the GINIP-based bystander BRET sensor primarily detects Gαi-GTP over other Gα subunits of the Gαi/o family, especially under endogenous expression conditions.
Gαi bystander BRET sensor moderately affects cAMP regulation in cells
After establishing the specificity of the Gαi bystander BRET sensor, we set out to determine if its expression interfered with G protein signaling to downstream targets in cells, such as inhibition of adenylyl cyclase. Although GINIP does not affect the ability of Gαi to bind or hydrolyze nucleotides, it can block Gαi binding to adenylyl cyclase when expressed in sufficiently high amounts (35). To test the potential effect of GINIP-Nluc expression on adenylyl cyclase regulation, we measured cAMP in cells upon GPCR stimulation using Glo-Sensor, a luminescence-based probe (41). More specifically, we measured the inhibition of isoproterenol-elicited cAMP by GABABR-activated Gαi in the presence or absence of the Gαi bystander BRET sensor (Fig. 2A). Whereas expression of the sensor under the same conditions as in experiments to detect endogenous Gαi responses did not affect the maximal inhibition achieved upon GABABR stimulation (Fig. 2A) or the expression of G proteins (Fig. 2B), it modestly decreased the potency of the inhibition by GABA (~4-fold increase in the IC50) (Fig. 2B). These results suggest that the Gαi bystander BRET sensor has modest, yet detectable, effects on cellular responses mediated by Gαi proteins upon GPCR stimulation.
Fig. 2. Effect of Gαi-GTP bystander BRET sensor on Gi-mediated inhibition of Gs-stimulated adenylyl cyclase activity.

(A) Diagram showing GPCR-G protein– mediated regulation of adenylyl cyclase (AC) activity and subsequent detection quantification of cAMP levels in cells via using a luminescence-based biosensor (GloSensor). (B) Kinetic luminescence measurements of cAMP abundance in HEK293T cells were carried out in the absence (Control, grey) or presence (blue) of Gαi-GTP bystander BRET sensor expression. Cells were treated with isoproterenol with (green) or without (orange) pretreatment with GABA. The percentage of GABA-mediated inhibition of the isoproterenol response is quantified on the graph on the right. Mean ± S.E.M., N=5 independent experiments. (C) Concentration-dependent measurements of cAMP inhibition by GABA were carried out in the absence (Control, grey) or presence (blue) of Gαi-GTP bystander BRET sensor expression. Cells were stimulated with isoproterenol in the presence of the indicated concentrations of GABA. Mean ± S.E.M., N=3 independent experiments. IC50 values were determined using a three-parameter sigmoidal curve fit and were compared using an extra sum-of-squares F test. A representative immunoblot shows the indicated endogenous G proteins in the absence or presence of the sensor.
Detection of endogenous Gαi-GTP with a single-vector system for biosensor expression
We set out to minimize or completely eliminate the interference of the bystander BRET sensor with Gαi signaling. For this, we took inspiration from the ONE-GO biosensor design (33). This design allows for sensitive detection of G protein activity without interfering with it by virtue of expression of the sensor components in reduced amounts, yet at relative ratios adequate for the detection of large BRET differences (33). We mimicked the ONE-GO design by expressing the GINIP-Nluc cassette after a low-efficiency internal ribosome entry site (IRES), designated IRES*, downstream of the YFP-CAAX component, which was placed right after the promoter, with the overall intent of favoring higher acceptor-to-donor expression ratios to maximize the magnitude of BRET differences (Fig. 3A). The construct was assembled in a plasmid backbone suitable for lentiviral packaging to facilitate its potential application in cell types not easily transfected. This design was named “bONE-GO biosensor”, for bystander ONE vector G protein optical biosensor (Fig. 3A). We reasoned that reduced expression of GINIP-Nluc would (1) reduce the potential interference with Gαi signaling, and (2) help in achieving a high acceptor-to-donor ratio conducive to adequate detection of BRET differences. HEK293T cells expressing the bONE-GO sensor and GABABR, but no exogenous G protein, elicited a robust BRET response upon GABA stimulation, which was rapidly reverted upon application of a GABABR antagonist (Fig. 3B). This BRET response was suppressed by PTX, indicating that it depended on activation of Gαi (Fig. 3B). We obtained concentration-response curves for GABABR and three other Gi-coupled GPCRs, α2AAR, D2R, and MOR (Fig. 3C). These results indicate that, much like its multi-plasmid predecessor, the bONE-GO design detects endogenous Gαi-GTP and is broadly applicable across receptors that activate Gi.
Fig. 3. Generation of a Gαi bystander ONE vector G protein Optical (Gαi bONE-GO) for detecting endogenous Gαi-GTP.

(A) Diagram showing the conversion of the multi-plasmid Gαi-GTP bystander BRET sensor to the single-plasmid Gαi bystander ONE vector G protein Optical Biosensor (bONE-GO). (B) Kinetic BRET measurements were carried out in HEK293T cells expressing GABABR and Gαi bONE-GO (but no exogenous G protein) in the absence (orange) or presence (blue) of Pertussis toxin by PTX-S1 expression. Cells were treated with GABA and CGP54626 as indicated. Mean ± S.E.M., N=4 independent experiments. (C) BRET was measured in HEK293T cells expressing Gαi bONE-GO along with the indicated GPCRs upon stimulation with their cognate agonists. Mean ± S.E.M., N=4 independent experiments (for GABABR, α2AAR, MOR), N=3 independent experiments (for D2R).
Gαi bONE-GO sensor does not affect cAMP regulation
Having established that Gαi bONE-GO detects endogenous responses, we set out to test whether it interfered with Gi-mediated signaling. Mirroring the experiments performed with its multi-plasmid predecessor (Fig 2, A and B), we assessed the changes in GPCR-modulated cAMP amounts in cells expressing Gαi bONE-GO compared to control cells not expressing the sensor (Fig. 4, A and B). We found that expression of Gαi bONE-GO under the same conditions as in experiments detecting endogenous Gαi-GTP (for example, Fig. 3, B and C), did not affect either the efficacy (maximal effect) or potency (IC50) of GABABR-mediated inhibition of isoproterenol-elicited cAMP responses (Fig. 4, A and B). The amounts of Gαi3 or Gβ were also not affected by Gαi bONE-GO expression (Fig. 4B). The YFP-CAAX module of the biosensor was barely detectable (Fig. 4B). Because GINIP-Nluc is expressed downstream of a low-efficiency IRES in Gαi bONE-GO, its translation must be exceedingly low, thereby explaining why it does not affect Gi signaling in cells. In summary, the bONE-GO design allows for sensitive detection of endogenous Gαi activation without interfering with the propagation of signaling from the G protein to downstream effectors.
Fig. 4. Effect of Gαi bONE-GO on Gi-mediated inhibition of Gs-stimulated adenylyl cyclase activity.

(A) Diagram showing GPCR-G protein mediated regulation of adenylyl cyclase (AC) activity and subsequent detection of cAMP levels in cells via a luminescence-based biosensor (GloSensor). (B) Kinetic luminescence measurements of cAMP abundance in HEK293T cells were carried out in the absence (Control, grey) or presence (blue) of Gαi bONE-GO sensor expression. Cells were treated with isoproterenol with (green) or without (orange) pretreatment with GABA. The percentage of GABA-mediated inhibition of the isoproterenol response is quantified on the graph. Mean ± S.E.M., N=5 independent experiments. Data for the Control condition are the same as for the Control presented in Fig. 2B. (C) Concentration-dependent measurements of cAMP inhibition by GABA were carried out in the absence (Control, grey) or presence (blue) of Gαi-GTP bONE-GO sensor expression. Cells were stimulated with isoproterenol in the presence of the indicated concentrations of GABA. Mean ± S.E.M., N=3 independent experiments. IC50 values were determined using a three-parameter sigmoidal curve fit and were compared using an extra sum-of-squares F test. Data for the Control condition are the same as for the Control presented in Fig. 2C. A representative immunoblot shows the indicated endogenous G proteins in the absence or presence of the Gαi-GTP bONE-GO sensor. The multi-plasmid condition is Gαi-GTP bystander BRET sensor expressed under the same conditions as in Fig. 2C.
Gαi bystander BRET sensor detects responses triggered by endogenous opioid receptors
Although the evidence presented above demonstrates the suitability of the bystander BRET biosensor for detecting endogenous Gαi-GTP in cells, those experiments were carried out with exogenously expressed GPCRs. To test if this biosensor system was adequate for detecting Gi activation by endogenous GPCRs, we turned to SH-SY5Y cells, a neuroblastoma cell line that endogenously expresses the opioid receptors MOR and DOR (32, 42). At the same time, we set out to test the versatility of the biosensor by deploying it in three different formats: (1) transient transfection of the multi-plasmid design (Fig. 5A), (2) short-term lentiviral transduction of the bONE-GO design (Fig. 5B), and (3) stable expression of the bONE-GO construct (Fig. 5C). The purpose of this three-pronged approach was to provide other investigators with a framework of options to implement the biosensor depending on their technical resources, expertise, and preferences. Approach (1) was carried out with inexpensive transfection reagents such as polyethylenimine (PEI), although it required a larger amount of cells to obtain reliable luminescence signals compared to the other approaches (see Materials and Methods). For approach (2), Gαi bONE-GO–bearing lentiviral particles produced in the supernatant of HEK293T cells were applied to SH-SY5Y cells the day before BRET measurements. For approach (3), SH-SY5Y cells were transduced with lentiviral supernatants and expanded, after which cell expressing the sensor were isolated by fluorescence activated cell sorting (FACS). In all three cases, BRET responses were detected upon stimulation of opioid receptors with the MOR-specific agonist DAMGO or the DOR-specific agonist SNC80 (Fig. 5, A to C), which were rapidly reverted upon addition of the opioid antagonist naloxone. Controls with PTX confirmed that the responses depended on GPCR-mediated Gαi activation (Fig. 5, A to C). Taken together, these experiments indicate that the bystander BRET sensor is suitable for detecting the activation of endogenous Gαi proteins by endogenous GPCRs when implemented in a variety of experimental formats.
Fig. 5. Detection of endogenous Gi activation by endogenous GPCRs in SH-SY5Y cells using a Gαi-GTP bystander BRET sensor.

(A) Detection of endogenous Gαi activation by endogenous μ-opioid receptors (MOR) and δ-opioid receptors (DOR) in SH-SY5Y cells upon transfection with BRET sensor components. Kinetic BRET measurements were carried out in SH-SY5Y cells expressing GINIP-Nluc, and YFP-CAAX (but no exogenous G protein or GPCR) in the absence (orange for MOR, green for DOR) or presence (blue) of Pertussis toxin by PTX-S1 expression. Cells were treated with the indicated opioid receptor (OR) ligands. Mean ± S.E.M., N=6 (for MOR) or N=5 (for DOR) independent experiments. (B) Detection of endogenous Gαi activation by endogenous MOR and DOR in SH-SY5Y cells upon transient transduction with lentiviruses carrying the single-vector Gαi bONE-GO sensor construct that were produced in HEK293T cells. Kinetic BRET measurements were carried out as in (A). Mean ± S.E.M., N=5 (for MOR “OR ligands”), N=4 (for DOR “OR ligands”), N=2 (for MOR or DOR, “+ Pertussis toxin”) independent experiments. (C) Detection of endogenous Gαi activation by endogenous MOR and DOR in SH-SY5Y cells stably expressing the Gαi bONE-GO BRET sensor. SH-SY5Y cells stably expressing the Gαi bONE-GO sensor were isolated by FACS after lentiviral transduction. Kinetic BRET measurements were carried out as in (A), except that control traces (gray) were treated with buffer instead of OR ligands. Mean ± S.E.M., N=4 (for MOR), N=4 (for DOR) independent experiments. A representative immunoblot shows the sensor components and the indicated endogenous G proteins in parental and stably transfected SH-SY5Y cells.
Agonist efficacy of opioid neuropeptides on endogenous opioid receptors in SH-SY5Y cells
We set out to determine the agonist efficacy of opioid neuropeptides that serve as physiological receptor ligands when detecting endogenous G protein activation in SH-SY5Y cells expressing endogenous opioid receptors. Although the agonist efficacies of opioid neuropeptides like Dynorphin A, Leu-Enkephalin, Met-Enkephalin, Endomorphin-1, Endomorphin-2, and β-endorphin has been determined and annotated in the International Union of Basic and Clinical Pharmacology (IUPHAR) database (43), the approaches used to determine efficacies entailed the overexpression of exogenous receptors and/or indirect readouts of activity subject to amplification, such as second messenger quantification. We reasoned that direct detection of G protein activity with an endogenous complement of receptors and G proteins might provide a better representation of the properties of these natural ligands under physiological conditions. For this, we stimulated SH-SY5Y cells stably expressing the Gαi bONE-GO sensor with the synthetic MOR-specific agonist DAMGO (Fig. 6A and fig. S3A), the synthetic DOR-specific agonist SNC80 (Fig. 6B and fig. S3B), or concentrations of Dynorphin A, Leu-Enkephalin, Met-Enkephalin, Endomorphin-1, Endomorphin-2, or β-endorphin expected to saturate their cognate receptors based on their respective affinities (43) (Fig. 6C and fig. S3C). All six opioid neuropeptides triggered BRET responses that were comparable in magnitude to those observed upon stimulation with DAMGO or SNC80 (Fig. 6, A to C, and fig. S3, A to C). Because many of the opioid neuropeptides used are known to stimulate more than one opioid receptor (44), we envisioned an approach to isolate the response components associated to individual opioid receptors, as well as to determine their efficacy relative to an internal reference benchmark. The approach relied on using CTOP and ICI174,864, which are antagonists specific for the MOR and the DOR, respectively, to determine what fraction of the responses observed was mediated by each one of the receptors (Fig. 6, A to C and fig. S3, A to C). Simultaneous treatment with both antagonists ablated the responses to any of the six neuropeptides, DAMGO, or SNC80, indicating that MOR and DOR, collectively, account for the responses detected in these cells (see graphs on the left in Fig. 6 A to C and fig. S3, A to C). To isolate the MOR-specific component of the response triggered by each neuropeptide, we subtracted the response observed in the presence of the MOR-specific antagonist CTOP from the response observed under control conditions; to isolate the DOR-specific component, we subtracted the response observed in the presence of the DOR-specific antagonist ICI174,864 (Fig. 6, A and B, and fig. S3, A and B). A requirement for the validity of this type of analysis is that the responses observed in the control conditions correspond to the sum of the responses observed in the presence of CTOP and in the presence of ICI174,864. This would rule out the possibility of confounding events due to lack of selectivity of the antagonists used and/or crosstalk between the receptors that could arise from, for example, sharing a common transducer (Gαi). We found that addition of the isolated MOR and DOR responses corresponded to the responses observed under control conditions (fig. S4), supporting the subsequent analysis. In addition to pharmacologically isolating MOR and DOR response components, we determined the relative efficacy of each one of the opioid neuropeptides on each receptor by comparing these responses to those obtained upon stimulation with the full agonists DAMGO and SNC80 as internal benchmarks (Fig. 6D and fig. S3D). All agonists were used at concentrations at least two orders of magnitude higher than reported pKi values obtained from IUPHAR (43), such that receptor occupancy was assumed to reach saturation. Under these conditions, intrinsic efficacy is directly proportional to responses observed according to Stephenson’s model (45).
Fig. 6. bONE-GO reveals partial agonism of opioid neuropeptides on endogenous receptors.

(A) Benchmarking of full agonist MOR-specific responses in SH-SY5Y cells with the Gαi bONE-GO sensor. Kinetic BRET measurements were carried out in SH-SY5Y cells stably expressing the Gαi bONE-GO sensor in the absence (Control, grey) or presence of 10 μM CTOP (+CTOP, orange), or 10 μM CTOP and 100 μM ICI174,864 (+CTOP +ICI, blue), followed by stimulation with DAMGO. To isolate the MOR-specific response components, the baseline trace obtained in the presence of CTOP and ICI (+CTOP +ICI) was first subtracted from other measurements, followed by the subtraction of the +CTOP trace from the control. Mean ± S.E.M., N=4 independent experiments. (B) Benchmarking of full agonist DOR-specific response in SH-SY5Y cells with the Gαi bONE-GO sensor. Kinetic BRET measurements were carried out as in (A) in the absence (Control, grey) or presence of 100 μM ICI174,864 (+ICI, green) or 10 μM CTOP and 100 μM ICI174,864 (+CTOP +ICI, blue) following stimulation with SNC80. To isolate the DOR-specific response component, the baseline trace obtained in the presence of CTOP and ICI (+CTOP +ICI) was first subtracted from other measurements, followed by the subtraction of the +ICI trace from the control. Mean ± S.E.M., N=4 independent experiments. (C) Isolation of MOR- and DOR-specific responses elicited by Dynorphin A in SH-SY5Y cells. Kinetic BRET measurements were carried out as in (A) in the absence (Control, grey) or presence of 10 μM CTOP (+CTOP, orange), 100 μM ICI174,864 (+ICI, green), or 10 μM CTOP and 100 μM ICI174,864 (+CTOP +ICI, blue) followed by stimulation with Dynorphin A. To isolate the MOR- and DOR-specific response components, data were processed as in (A) for the MOR-specific component or as in (B) for the DOR-specific component. Mean ± S.E.M., N=4 independent experiments. (D) Assessment of agonist efficacy of opioid neuropeptides on endogenous opioid receptors in SH-SY5Y cells using Gαi bONE-GO. The cartoon illustrates opioid neuropeptide profiling for MOR- or DOR-specific response components. Graphs show the isolated MOR- and DOR-specific response components of each opioid neuropeptide tested in panels A, B, and C and in fig. S3, A to C at the indicated concentrations in the referenced panels expressed relative to the maximal responses (%Emax) elicited by DAMGO or SNC80 for MOR and DOR, respectively. Mean ± S.E.M., N=3–14 independent experiments. *p<0.05, ***p<0.005, compared with DAMGO or SNC80 in respective graphs using one-way ANOVA corrected for multiple comparisons (Holm-Šídák). (E) Assessment of agonist efficacy of opioid neuropeptides on exogenous opioid receptors in HEK293T cells using Gαi1 ONE-GO. Endpoint BRET experiments were carried out in HEK293T cells expressing Gαi1 ONE-GO and either MOR or DOR, as indicated, following stimulation with 1 μM DAMGO, 10 μM SNC80, 10 μM Dynorphin A, 10 μM Leu-Enkephalin, 10 μM Met-Enkephalin, 10 μM Endormorphin-1, 10 μM Endormorphin-2, or 10 μM β-endorphin. Responses were expressed relative to the maximal responses (%Emax) elicited by DAMGO or SNC80 for MOR and DOR, respectively. Mean ± S.E.M., N=3–4 independent experiments. (F) Table summarizing agonist efficacy of opioid neuropeptides for MOR and DOR based on IUPHAR annotation or detection with Gαi bONE-GO (D) or Gαi1 ONE-GO (E). N/A; no annotation, presumably inactive. *Although Endomorphin-1 is annotated as a full agonist for DOR in the IUPHAR database, the evidence in the reference provided in the database indicates that it is inactive. ***p<0.005, compared with DAMGO or SNC80 in respective graphs using one-way ANOVA corrected for multiple comparisons (Holm-Šídák). Panels A, B, and C contain data also presented in fig. S3, A to C.
We found that most of the active opioid neuropeptides were partial agonists for the MOR and DOR (Fig. 6D), whereas all of them are annotated as full agonists in the IUPHAR database (43) (Fig. 6E), with the exceptions of the partial agonist annotation of Leu-Enkephalin on MOR and the lack of annotation for Endomorphin-2 on DOR (suggestive of lack of reported activity) (Fig. 6E). It is worth noting that Endomorphin-1 is annotated as a full agonist for DOR in the IUPHAR database (43), but the source reference for this annotation (46) does not support this claim. This suggests that Endomorphin-1 is not a DOR agonist, which is in agreement with our results showing that Endomorphin-1 lacks agonist activity on the endogenous DOR in SH-SY5Y cells (Fig. 6D, fig. S3C). These results obtained using the Gαi bONE-GO sensor in SH-SY5Y cells also contrast with some evidence using other BRET-based biosensors that detect G protein activity directly, like TRUPATH or ONE-GO, which also indicated full agonist activity of these opioid neuropeptides on the MOR exogenously expressed in HEK293 cells (30, 33). To more rigorously characterize this difference with the endogenous responses observed in SH-SY5Y cells, we measured G protein activation with the previously described Gαi1 ONE-GO sensor (33) in HEK293T cells exogenously expressing either MOR or DOR upon stimulation with saturating concentrations of the opioid neuropeptides. We found that all the opioid neuropeptides that elicited a response did so as full agonists, as assessed by direct comparison with the MOR- or DOR-specific full agonists DAMGO or SNC80, respectively (Fig. 6F). Overall, these results indicate that the pharmacological properties of natural opioid neuropeptides can be distorted when the signaling components of the system are not expressed in endogenous amounts, and that the Gαi bONE-GO sensor might provide a better representation of physiological signaling responses than other sensors that require exogenous expression of components of the signaling system.
Gαi bONE-GO sensor reports activation of adenosine receptors in mouse glial cells
Detection of responses triggered by endogenous receptors, as shown above with the Gαi bONE-GO sensor for opioid receptors in SH-SY5Y cells, is a desirable feature towards dissecting physiologically-relevant signaling mechanisms, but cell lines do not always recapitulate the behavior and characteristics of non-immortalized cells. Thus, we set out to assess if the Gαi bONE-GO sensor could be implemented in primary cells. For this, we transduced mouse cortical astroglial cells with a lentivirus for the expression of the Gαi bONE-GO sensor and stimulated them with adenosine, which is known to stimulate A1 purinergic receptors primarily coupled to Gi/o proteins in these cells (33, 43, 47) (Fig. 7A). We found that adenosine stimulation led to robust and concentration-dependent responses (Fig. 7, B and C). Adenosine responses were completely suppressed after treatment of the cells with PTX and not recapitulated in cells expressing a Gαi bONE-GO construct bearing a mutation in GINIP (W139A) that disrupts G protein binding (Fig. 7B), confirming the expected specificity of the BRET response observed with the Gαi bONE-GO sensor. These results indicate that the Gαi bONE-GO sensor is suitable for the characterization of responses elicited by endogenous GPCRs and endogenous Gαi proteins in primary cells.
Fig. 7. Detection of endogenous responses to adenosine in astroglial cells using Gαi bONE-GO sensor.

(A) Diagram depicting lentiviral transduction of cultured primary mouse astroglial cells. (B) Detection of endogenous Gαi activation by endogenous adenosine receptors using Gαi bONE-GO. Kinetic BRET measurements were carried out in primary mouse astroglial cells after lentiviral transduction with Gαi bONE-GO WT (blue, cyan) or Gαi bONE-GO W139A (grey) in the absence (blue, grey) or presence (cyan) of overnight treatment with Pertussis toxin (PTX). Cells were treated with adenosine as indicated. Mean ± S.E.M., N=3 independent experiments. (C) Kinetic BRET measurements were carried out with Gαi bONE-GO WT as in (B). Cells were treated with the indicated concentrations of adenosine or buffer. The area under curve (AUC) of the responses detected in the kinetic traces was calculated for each concentration of adenosine, and plotted as a semi-log graph on the right. Mean ± S.E.M., N=3 independent experiments.
DISCUSSION
The main advance provided by this work is the development of a biosensor design, Gαi bONE-GO, that allows for direct measurement of endogenous Gαi-GTP generated upon stimulation of endogenous GPCRs and the demonstration of its versatile implementation across experimental systems to reveal more physiologically-relevant information on G protein signaling. This sensor design improves the dynamic range over what was observed with previously developed Gαi*-BERKY biosensors also capable of measuring activity with endogenous GPCRs and G proteins, while lacking interference with signaling to downstream effectors and allowing for deployment in different assay formats and across different cell types, including primary cell cultures. Thus, this design also overcomes some limitations of other biosensor platforms like ONE-GO or EMTA, which may compromise G protein function and/or are not suitable for implementation in primary cells. The importance of having an approach to faithfully investigate endogenous Gαi activation in response to endogenous GPCR stimulation was showcased by revealing that several natural opioid neuropeptides work as partial agonists under endogenous expression conditions, contrary to observations obtained by direct comparison with another biosensor, Gαi1 ONE-GO, using overexpressed receptors and exogenous G proteins, which indicated full agonist activity. Overall, the Gαi bONE-GO biosensor represents a design that combines the desirable features of previously developed G protein sensor platforms while overcoming their limitations.
There are three key features of the Gαi bONE-GO design that are critical for its improved performance: (1) using GINIP as the detector module; (2) leveraging the principle of bystander BRET; and (3) assembling all biosensor components into a single vector. Using GINIP as the detector module not only increases sensitivity and dynamic range because of its high affinity for Gαi-GTP, but also contributes to the lack of interference with downstream signaling because it does not directly alter nucleotide binding or hydrolysis by the G protein (35). As for leveraging the principle of bystander BRET, one advantage is that it allows for detection of Gαi-GTP without the need to fuse the G protein to bulky tags or to express it as an exogenous protein. It is also possible that the use of bystander BRET as readout is conducive to a better dynamic range of detection, because the acceptor-to-donor ratio at the plasma membrane might be large. Finally, the assembly of all biosensor components into a single vector akin to the ONE-GO sensor design (33) allows for a reduction in the overall amount of expression of GINIP, thereby further mitigating interference with downstream signaling, and facilitates implementation in different experimental systems, even in cell types that are difficult to transfect, by virtue of requiring the delivery of a single genetic payload. Overall, in developing the Gαi bONE-GO design we overcame limitations of existing G protein activity biosensors by leveraging a combination of their desirable features with a better detector module, an approach that may serve as a template for the future development of analogous biosensors for other G protein subtypes.
Implementing Gαi bONE-GO to detect endogenous G protein activation by endogenously expressed GPCRs holds the promise of revealing new insights into how this signaling mechanism occurs under native conditions, as illustrated by our results profiling the action of opioid neuropeptides. The validity of our conclusions rests on the confirmation of the specificity of antagonists used for the pharmacological isolation of responses by different opioid receptors and the assumption of full receptor occupancy by agonists under our experimental conditions, but implementation of the Gαi bONE-GO in other contexts should also be accompanied by similar validations to draw meaningful conclusions. Our results with endogenous receptors and G proteins expressed in SH-SY5Y cells using the Gαi bONE-GO sensor revealed that most of them act as partial agonists instead of displaying the full agonism annotated in the IUPHAR database (43). One potential explanation for this discrepancy is that IUPHAR database annotations rely largely on assays that measure amplified second messenger responses. However, it is also likely that receptor overexpression is a major contributor to the observed differences, because full agonism is also detected when using biosensors that directly measure G protein activity, like TRUPATH (30) or ONE-GO (33), in HEK293 cells overexpressing opioid receptors. It is therefore conceivable that either the amplification associated with the measurement of second messengers and/or the excess of receptor skews the responses observed compared to the direct measurement of G protein activity in a system with native receptor-G protein stoichiometry. These observations also resonate with findings supporting that context-dependence is a prevalent feature of G protein activation by endogenous GPCRs (33). Our findings also reinforce the cautionary message of a report showing that biosensor responses for GPCRs coupled to Gαi/o proteins are not only different between cell lines and primary neurons, but are also influenced by the type of exogenous G protein subunits required to assemble the biosensor system (31). Overall, the context-dependence of GPCR responses, like that shown here for opioid receptors, impacts the translatability of pharmacological profiling results in vitro into the expected effects of a given drug in vivo (48, 49). More specifically, our findings have important implications in the context of the development of new opioid analgesics with diminished side effects, an area that remains controversial (50). Although some evidence suggests that the preferential activation of G proteins over arrestins (G protein–biased signaling) by MOR has improved safety profiles comparted to mainstay opioids used clinically (18, 51), others have put this into question (52-54). One report has provided evidence that the reduced side effects of several G protein–biased opioid agonists can be explained by their low intrinsic efficacy (53). Given that our results reveal that efficacy is a function of the system and/or experimental conditions, it will be important in the future to critically assess the action of existing or new opioid analogs under physiologically relevant conditions. Approaches like the one developed here hold the promise of enabling this type of assessment.
An attractive feature of the Gαi bONE-GO sensor design is its versatility in terms of implementation, as demonstrated by the variety of systems and formats described in this work. In addition to making it easy to increase throughput in experiments in HEK293T cells by easily transfecting a single plasmid, viral transduction of a single payload makes it feasible to use the Gαi bONE-GO sensor in cell types that are not efficiently transfected, as exemplified here with SH-SY5Y cells and astroglial cells. In the context of drug discovery, this could increase the success of translating pharmacological properties in vitro to desired outcomes in vivo by establishing an intermediary step of testing the compounds under development in primary cells relevant to the particular indication. For example, one could use the same readout (the Gαi bONE-GO sensor) to directly assess whether the responses observed in a relevant cell type endogenously expressing the receptor of interest resemble those obtained in a cell line exogenously expressing the receptor. The option of making stable cell lines expressing the biosensor to monitor endogenous GPCR responses, as we illustrated here with SH-SY5Y cells, could also be attractive for high-throughput drug screening campaigns. This approach would avoid the variability associated with transient transfections, which leads to non-homogeneous expression across cells in the same batch and differences from experiment to experiment. Another aspect related to the versatility of the Gαi bONE-GO sensor is that its design allows for relatively easy customization. For example, the bystander BRET acceptor module could be targeted to different subcellular locations, like endosomes or the Golgi apparatus, by replacing the polybasic-CAAX sequence with targeting sequences suitable for the alternative locations of interest (55, 56). This could be useful to directly dissect the spatiotemporal pattern of Gαi activation, an area of current interest for GPCRs in general and for Gi-coupled opioid receptors in particular. Opioid receptors can be activated in different subcellular locations and timescales depending on the nature of the ligand, and signaling from each location might lead to different functional outcomes (57-60). Future iterations of the bONE-GO design may be of use for capturing the formation of active G proteins in different subcellular compartments by taking advantage of the bystander design of the sensor.
A potential limitation of the GINIP-based bystander BRET sensor for certain applications, which is shared with other biosensors that rely on bystander BRET, like EMTA (34), is the lack of fidelity in reporting the kinetics of G protein activation or deactivation. This is because the readout relies not only on the kinetics of G protein activation or deactivation, but also on the rate of accumulation of the donor on membranes in the vicinity of the acceptor. Another potential limitation is that the applicability of the bONE-GO biosensor design to G proteins other than Gαi still remains to be established. Even within the scope of Gi/o-coupled GPCRs, Gαi bONE-GO might not be the most suitable option in some systems. For example, it would be desirable to develop an equivalent biosensor that efficiently detects endogenous Gαo-GTP in neurons, given that this is the most abundant G protein in the brain. As discussed above, one of the most critical factors in developing the biosensor design introduced here is the discovery of a suitable detector module, which should be a priority for the future development of biosensors of the same class for other G protein subtypes.
In summary, Gαi bONE-GO combines the desirable design features of other existing biosensor platforms, while overcoming some of their limitations, to provide high fidelity detection of endogenous GPCR-G protein signaling with the flexibility for use in a wide variety on contexts. By providing proof-of-principle evidence for its implementation in diverse experimental formats and for the conceptual advances that can be obtained through it, we hope to entice other investigators to leverage this system in order to advance the field of GPCR signaling.
MATERIALS AND METHODS
Plasmids
The plasmids for the expression of GINIP-Nluc in mammalian cells via transfection (p3xFLAG-CMV-14-GINIP-Nluc) have been described previously (35). The plasmid encoding YFP-CAAX, consisting of Venus followed by the last 25 amino acids of human KRas4b including the polybasic regions and CAAX prenylation box, was a gift from Nevin Lambert (55). The plasmid for mammalian expression of the long isoform of the human Dopamine 2 receptor (pcDNA3.1(+)-FLAG-D2DR) was provided by A. Kovoor (University of Rhode Island) (61). The plasmid encoding rat α2A-AR (pcDNA3-α2A-AR) was provided by Joe Blumer (Medical University of South Carolina) has been described previously (62). The plasmids encoding rat GABABR subunits (pcDNA3.1(+)-GABABR1a and pcDNA3.1(+)-GABABR2) were a gift from Paul Slessinger (Ichan School of Medicine, Mount Sinai, NY). The plasmid encoding mouse MOR (pcDNA3.1-MOR-FLAG) has been described previously (28). The plasmid encoding rat 5-HT1a receptor (pcDNA3.1-5-HT1a) was provided by Joshua Levitz (Weill Cornell Medicine, New York, NY) (63). The plasmid encoding the human muscarinic cholinergic receptor 2 (pcDNA3.1-CHRM2) was described previously (33). The plasmids encoding β2AR (cat#14697; (64)), PAR1 (cat#53226; (65)), XE100 Pertussis Toxin A promoter (called PTX-S1 where applicable; cat#16678), were obtained from Addgene, as well as the plasmids psPAX2 (cat#12259), pMD2.G (cat#12259) used for lentiviral packaging. The plasmids encoding human DOR (cat#OPRD100000), M3R (cat#MAR030TN00), EE-tagged Gαz (cat#GNA0Z0EI00) were obtained from the cDNA Resource Center at Bloomsburg University. The plasmid for the expression of Gαi1 PTXi (containing a C351G mutation) (pcDNA3.1-Gαi1-EE PTXi) was a gift from Ken Blumer (Washington University in St. Louis) (66). The plasmid for the expression of GαoA PTXi (pcDNA3.1-GαoA PTXi) was generated introducing a C351G mutation in a previously described plasmid for the expression of GαoA (67). The plasmid for expression of the Gαi*-BERKY3 biosensor (pcDNA3.1-Gαi*-BERKY3) was generated in a previous study (68). Plasmids encoding Gαs ONE-GO (pLVX-CMV-Gαs-99V-IRES*-KB1691-Nluc-T2A-Ric-8B), Gαq ONE-GO (pLVX-CMV-Gαq-V-IRES*-GRK2RH-Nluc), Gα13 ONE-GO (pLVX-CMV-Gα13-V-IRES*-PRGRH-Nluc), Gαi1 ONE-GO (pLVX-CMV-Gαi1-V-IRES*-KB1753-Nluc), GαoA ONE-GO (pLVX-CMV-GαoA-V-IRES*-KB1753-Nluc), and Gαz ONE-GO (pLVX-CMV-Gαz-V-IRES*-KB1753-Nluc) were described previously (33). The plasmid encoding Glosensor 22F was acquired from Promega (cat#E2301). The plasmid for the expression of the Gαi bONE-GO biosensor (pLVX-CMV-YFP-CAAX-IRES*-GINIP-Nluc) was generated by replacing the IRES-Hyg cassette between the BamHI and MluI sites of pLVX-IRES-Hyg with YFP-CAAX, IRES*, and GINIP-Nluc using Gibson assembly. The sequences encoding the YFP-CAAX and GINIP-Nluc cassettes were amplified from plasmids described above, and IRES* is a previously described sequence that leads to lower expression of the gene of interest downstream of it relative to the gene of interest right downstream of the CMV promoter (33, 69). All point mutations were generated using QuikChange II following the manufacturer’s instructions (Agilent, Cat#200523).
Bioluminescence Resonance Energy Transfer (BRET) measurements in HEK293T cells
HEK293T cells (ATCC, cat#CRL-3216) were grown at 37°C, 5% CO2 in DMEM (Gibco, cat#11965-092) supplemented with 10% FCS (Hyclone, cat#SH30072.03), 100 units/ml penicillin, 100 μg/ml streptomycin, and 2 mM L-glutamine (Corning, cat#30-009-CI).
Approximately 400,000 HEK293T cells were seeded on each well of 6-well plates coated with 0.1% (w/v) gelatin, and transfected ~24 hr later using the calcium phosphate method. Cells were transfected, in the combinations indicated in the figures, with plasmids encoding the following constructs (DNA amounts in parentheses): GABABR1a (0.2 μg), GABABR2 (0.2 μg), α2A-AR (0.2 μg), D2R (0.2 μg), MOR (0.2 μg), β2AR (0.2 μg), M3R (0.02 μg), PAR1 (0.2 μg), DOR (0.2 μg), 5-HT1aR (0.2 μg), M2R (0.2 μg), YFP-CAAX (1 μg), GINIP-Nluc (0.05 μg), PTX-S1 (0.2 μg), Gαs ONE-GO (0.08 μg), Gαq ONE-GO (0.05 μg), Gα13 ONE-GO (0.05 μg), Gαi*-BERKY3 (0.01 μg), Gαi bONE-GO (0.025 μg), Gαi1 ONE-GO (0.05 μg), Gαi1 PTXi ONE-GO (0.05 μg), GαoA PTXi ONE-GO (0.05 μg), Gαz ONE-GO (0.05 μg), Gαi1 WT (0.5 μg), Gαi1 PTXi (0.5 μg), GαoA PTXi (0.5 μg), Gαz WT (0.5 μg). Total DNA amount per well was equalized by supplementing with empty pcDNA3.1 as needed. Cell medium was changed 6 hr after transfection.
For kinetic BRET measurements, approximately 18-22 hr after transfection, cells were washed and gently scraped in room temperature Phosphate Buffered Saline (PBS; 137 mM NaCl, 2.7 mM KCl, 8 mM Na2HPO4, and 2 mM KH2PO4), centrifuged (5 minutes at 550 × g), and resuspended in 750 μl of BRET buffer (140 mM NaCl, 5 mM KCl, 1 mM MgCl2, 1 mM CaCl2, 0.37 mM NaH2PO4, 24 mM NaHCO3, 10 mM HEPES, and 0.1% glucose, pH 7.4). Approximately 25-50 μl of cells were added to a white opaque 96-well plate (Opti-Plate, PerkinElmer Life Sciences, cat#6005290). BRET buffer was added to a final volume of 100 μl and then mixed with the nanoluciferase substrate Nano-Glo (Promega, cat#N1120, final dilution 1:200) before measuring luminescence. Luminescence signals at 450 ± 40 and 535 ± 15 nm were measured at 28°C every 0.96 s in a BMG Labtech POLARStar Omega plate reader. Agonists were added as indicated in the figures during the recordings using built-in injectors. BRET was calculated as the ratio between the emission intensity at 535 nm divided by the emission intensity at 450 nm, followed by multiplication by 103. Kinetic traces are represented as change in BRET after subtraction of the baseline signal measured for 30 s before GPCR stimulation [ΔBRET·103 (baseline)]. The signal-to-noise ratios (SNR) calculated to compare the performance of the GINIP-based bystander BRET sensor with the Gαi*-BERKY3 sensor in Fig. S1, was determined by dividing the average ΔBRET values after agonist stimulation at 110-120 s (signal) by the standard deviation of values during the first 30 s of measurement prior to agonist stimulation (noise).
For endpoint BRET measurements to determine concentration dependence curves, cells were scraped and resuspended in BRET buffer as described above except that they were resuspended in 300 μl BRET buffer. Twenty μl of GABA, brimonidine, dopamine, DAMGO, SNC80, Dynorphin A, Leu-Enkephalin, Met-Enkephalin, Endomorphin-1, Endomorphin-2, or β-endorphin diluted in BRET buffer at 5X the final concentration desired in the assay were added to wells of a white opaque 96-well plate and further diluted with 35 μl of BRET buffer. Next, 22.4 μl of BRET buffer containing the luciferase substrate CTZ400a (GoldBio, cat#C-320-1; 10 μM final concentration) was added to wells. Cell stimulation was initiated by adding 22.4 μl of cell suspension to wells containing the agonists and the luciferase substrate. Luminescence signals at 450 ± 40 and 535 ± 15 nm were measured at 28°C every minute for 5 minutes in a BMG Labtech POLARStar Omega plate reader with a signal integration time of 0.32 s for each measurement. BRET was calculated as the ratio between the emission intensity at 535 nm divided by the emission intensity at 450 nm for each time point, and the two values obtained at 4 and 5 minutes were averaged and multiplied by 103. BRET data are presented as the change in BRET relative to a condition without agonist [ΔBRET·103 (no agonist)]. In some cases, the final values were fit to a curve using a 3-parameter sigmoidal curve-fit in Prism (GraphPad).
Luminescence-based cAMP measurements in HEK293T cells
Culture conditions for HEK293T cells are described above in ‘Bioluminescence Resonance Energy Transfer (BRET) measurements in HEK293T cells.’
Approximately 300,000 HEK293T cells were seeded on each well of 6-well plates coated with 0.1% (w/v) gelatin, and transfected ~24 hr later with plasmids using the calcium phosphate method. Cells were transfected, in the combinations indicated in the figures, with plasmids encoding the following constructs (DNA amounts in parentheses): GABABR1a (0.2 μg), GABABR2 (0.2 μg), Glosensor 22F (0.8 μg), YFP-CAAX (1 μg), GINIP-Nluc WT (0.05 μg), and Gαi bONE-GO (0.025 μg), supplemented with pcDNA3.1 to equalize total amount of DNA per well and reach a minimum of 2 μg of total transfected DNA for all experiments. Cell medium was changed 6 hr after transfection.
For kinetic measurements, approximately 18-22 hr after transfection, cells were washed and gently scraped in room temperature PBS, centrifuged (5 minutes at 550 × g), and resuspended in 750 μl Tyrode’s solution (140 mM NaCl, 5 mM KCl, 1 mM MgCl2, 1 mM CaCl2, 0.37 mM NaH2PO4, 24 mM NaHCO3, 10 mM HEPES and 0.1% glucose, pH 7.4). Two-hundred μl of cells were mixed with 200 μl of 5 mM D-luciferin K+ salt (GoldBio, cat#LUCK-100) diluted in Tyrode’s solution and incubated at 28°C for 15 minutes. Ninety μl of cells pre-incubated with D-luciferin were added to a white opaque 96-well plate before measuring luminescence without filters at 28°C every 10 s in a BMG Labtech POLARStar Omega plate reader. Agonists were added as indicated in the figures during the recordings using built-in injectors. Kinetic traces are represented as the percentage of the maximum response after stimulation with isoproterenol only [cAMP (% isoproterenol max)].
For concentration-response curves, cells were washed and scraped as above, except that they were resuspended in 300 μl Tyrode’s solution. Two-hundred and forty μl of cells were mixed with 240 μl of 5 mM D-luciferin K+ salt diluted in Tyrode’s solution and incubated at 28°C for 15 minutes. Twenty μl of different amounts of GABA diluted in Tyrode’s solution at 4X the final concentration desired in the assay were added to wells of a white opaque 96-well plate, and further diluted by addition of 37.6 μl of Tyrode’s solution. GABA stimulations were initiated at room temperature by addition of 22.4 μl of the cell suspension pre-incubated with D-luciferin to the wells, and 2 minutes later 20 μl of 500 nM isoproterenol (100 nM final concentration) diluted in Tyrode’s solution were added. Immediately following addition of isoproterenol, luminescence measurements without filters were taken at 28°C for 19 minutes in 30 s intervals using a BMG Labtech POLARStar Omega plate reader with a signal integration time of 0.20 s for each measurement. For each concentration of GABA, response values were calculated by averaging the 3 time points around the peak of the kinetic trace (270, 300, and 330 s after start of measurement) and normalizing them as a percentage of the maximum response in the absence of GABA [cAMP (% isoproterenol max)]. Where indicated, the IC50 values and concentration dependence curves were determined by using a 3-parameter sigmoidal curve-fit in Prism (GraphPad).
At the end of experiments, a separate aliquot of the same pool of cells used for the measurements was centrifuged for 1 minute at 14,000 × g, and pellets stored at −20°C for subsequent immunoblot analysis (see “Protein electrophoresis and Immunoblotting” section below).
Bioluminescence Resonance Energy Transfer (BRET) measurements in SH-SY5Y cells
SH-SY5Y cells (ATCC cat#CRL-2266) were grown at 37°C, 5% CO2 in DMEM supplemented with 100 U/ml penicillin, 100 μg/ml streptomycin, 2 mM L-glutamine, and 15% heat-inactivated FCS (Hyclone, cat#SH30072.03).
For experiments using transient transfection of naïve SH-SY5Y cells with the multi-plasmid Gαi-GTP bystander BRET sensor (Fig. 5A), approximately 800,000 SH-SY5Y cells were seeded on each well of 6-well plates coated with 0.1% (w/v) gelatin and transfected ~24 hr later with plasmids using the polyethylenimine (PEI) method (70). The following plasmids were transfected using a 1:2 ratio of DNA to PEI (DNA amounts in parentheses): YFP-CAAX (1 μg), GINIP-Nluc WT (0.05 μg), and PTX-S1 (0.2 μg). Total DNA amount per well was equalized by supplementing with empty pcDNA3.1 to also reach a minimum of 2.5 μg of total transfected DNA. Cell medium was changed 6 hr after transfection, and approximately 16-24 h after transfection, cells were washed and gently scraped in room temperature PBS, centrifuged (5 minutes at 550 × g), and resuspended in 375 μl of BRET buffer. Fifty μl of cells were added to a white opaque 96-well plate, followed by addition of 50 μl of BRET buffer and the nanoluciferase substrate Nano-Glo (final dilution 1:200) before measuring luminescence. Luminescence signals at 450 ± 40 and 535 ± 15 nm were measured at 28 °C every 0.96 s in a BMG Labtech POLARStar Omega plate reader, and BRET was calculated as the ratio between the emission intensity at 535 nm divided by the emission intensity at 450 nm, followed by multiplication by 103. Agonists were added as indicated in the figures during the recordings using built-in injectors. Kinetic traces are represented as the change in BRET after subtraction of the baseline signal measured for 30 s before GPCR stimulation [ΔBRET·103 (baseline)].
For experiments using transient lentiviral transduction of SH-SY5Y cells with Gαi bONE-GO BRET sensor (Fig. 5B), supernatants containing viral particles were first generated in HEK293T cells as described next. Approximately 400,000 HEK293T cells were seeded on each well of 6-well plates coated with 0.1% (w/v) gelatin, and transfected ~24 hr later with plasmids encoding the following components using the PEI method at a 1:2 ratio of DNA to PEI (DNA amounts in parentheses): Gαi bONE-GO (1.8 μg), psPAX2 (1.2 μg), and pMD2.g (0.75 μg). Cell medium was changed 6 hr after transfection. Lentivirus-containing media was collected 24 hr and 48 hr after transfection, pooled, centrifuged for 5 minutes at 1500 × g, and filtered through a 0.45-μm surfactant-free cellulose acetate (SFCA) membrane filter (Corning, cat#431220). These supernatants (~4 ml collected per well of cultured cells), were stored at 4°C for up to 7 days before using them to transduce SH-SY5Y cells. In parallel, approximately 800,000 SH-SY5Y cells were seeded on each well of 6-well plates coated with 0.1% (w/v) gelatin and transduced ~24 hr later by replacing cell media with 2 ml of a 1:1 mix of lentivirus-containing supernatants and fresh complete medium supplemented with 6 μg/ml of polybrene (Tocris Bioscience, cat#7711/10) to enhance transduction efficiency. Virus-containing medium was replaced by fresh medium 6 hr later. In some conditions, the change of media was accompanied by the addition of 0.1 μg/ml pertussis toxin (List Biological Labs, cat#179A) to wells. Approximately 18-22 hr after the change to fresh medium, cells were washed and gently scraped in room temperature PBS, centrifuged (5 minutes at 550 × g), and resuspended in 750 μl of BRET buffer. Fifty μl of cells were added to a white opaque 96-well plate, followed by addition of 50 μl of BRET buffer and the nanoluciferase substrate Nano-Glo (final dilution 1:200) before measuring luminescence. Luminescence signals at 450 ± 40 and 535 ± 15 nm were measured at 28°C every 0.96 s in a BMG Labtech POLARStar Omega plate reader, and BRET was calculated as the ratio between the emission intensity at 535 nm divided by the emission intensity at 450 nm, followed by multiplication by 103. Agonists were added as indicated in the figures during the recordings using built-in injectors. Kinetic traces are represented as change in BRET after subtraction of the baseline signal measured for 30 s before GPCR stimulation [ΔBRET·103 (baseline)].
BRET measurements in SH-SY5Y cells stably expression Gαi bONE-GO
SH-SY5Y cells stably expressing Gαi bONE-GO were generated by lentiviral transduction followed by Fluorescence-Activated Cell Sorting (FACS) as described next. Approximately 800,000 SH-SY5Y cells, cultured as described above in ‘Bioluminescence Resonance Energy Transfer (BRET) measurements in SH-SY5Y cells’, were seeded on 35 mm tissue culture plates and transduced ~24 hr later by replacing cell medium with 2 ml of a 1:1 mix of lentivirus-containing supernatants (collected as described above) and fresh complete medium supplemented with 6 μg/ml of polybrene. Virus-containing medium was replaced by fresh medium 48 hr later. Cells were expanded to multiple 10 cm plates as the starting material for FACS. For cell sorting, SH-SY5Y stable cells were detached by trypsin, resuspended in complete medium, and counted such that 7.5 x10⁶ cells were transferred to a 15 ml conical tube. Cells were washed 3 times with 10 ml cold PBS by cycles of centrifugation (3 minutes at 300 × g), aspiration, and resuspension. Cells were resuspended in 1.5 ml cold PBS and stored on ice for 3 hr while carrying out sorting protocol. A subset of the trypsinized SH-SY5Y stable cells were resuspended in complete DMEM containing DAPI (1 μg/ml), washed as described above, and used for selecting fluorescence gates. Cell sorting was performed on FACSAria II SORP (BD Bioscience), and the 488ex/530em nm fluorescence channel (Voltage: 225 nV) was used for positive selection. Approximately 3.5 x10⁵ cells with fluorescence intensity from 200 to 1000 were collected as “isolated YFP+ population” (Fig. 5C), and seeded in a 6-well plate with complete DMEM for expansion. Culture conditions for the SH-SY5Y stable cell line were the same as described for naïve SH-SY5Y cells.
For kinetic BRET measurements using SH-SY5Y cells stably expressing Gαi bONE-GO BRET sensor (Fig. 5C), approximately 800,000 cells were seeded on 6 cm plates coated with 0.1% (w/v) gelatin. Approximately 18-22 hr later, cells were washed and gently scraped in room temperature PBS, centrifuged (5 minutes at 550 × g), and resuspended in 750 μl of BRET buffer. Fifty μl of cells were added to a white opaque 96-well plate, followed by addition of 50 μl of BRET buffer and the nanoluciferase substrate Nano-Glo (final dilution 1:200) before measuring luminescence. Luminescence signals at 450 ± 40 and 535 ± 15 nm were measured at 28 °C every 0.96 s in a BMG Labtech POLARStar Omega plate reader and BRET was calculated as the ratio between the emission intensity at 535 nm divided by the emission intensity at 450 nm, followed by multiplication by 103. Agonists were added as indicated in the figures during the recordings using built-in injectors. Kinetic traces are represented as change in BRET after subtraction of the baseline signal measured for 30 s before GPCR stimulation [ΔBRET·103 (baseline)], except for some experiments described next.
Calculation of the pharmacologically isolated MOR- and DOR-specific components for opioid neuropeptide responses (Fig. 6, Fig. S3) was performed as follows. First, the trace obtained in the presence of both CTOP and ICI174,864 (ICI) was subtracted from the other conditions tested (Control, CTOP only, or ICI only) to obtain a baseline correction. Next, to isolate the MOR-specific response component, the trace obtained for each agonist condition in the presence of CTOP was subtracted from the Control trace (no inhibitors). Similarly, for the DOR-specific response component, the trace obtained for each agonist condition in the presence of ICI was subtracted from the Control trace. To obtain the data presented in Fig. 6D, each of the corrected and isolated OR-specific responses was quantified as the area under curve (AUC), and normalized to a maximal response (%Emax) obtained with a full agonist for either MOR (DAMGO) or DOR (SNC80). To calculate the AUC, the total area was calculated in Prism (GraphPad) between the isolated MOR- or DOR-specific response components and y=0.
At the end of some experiments, a separate aliquot of the same pool of cells used for the measurements was centrifuged for 1 minute at 14,000 × g and pellets stored at −20°C for subsequent immunoblot analysis (see “Protein electrophoresis and Immunoblotting” section below).
Protein electrophoresis and immunoblotting
Pellets of HEK293T or SH-SY5Y stable cells were resuspended with cold lysis buffer (20 mM HEPES, 5 mM Mg(CH3COO)2, 125 mM K(CH3COO), 0.4% (v:v) Triton X-100, 1 mM DTT, 10 mM β-glycerophosphate, 0.5 mM Na3VO4, supplemented with a protease inhibitor cocktail [Sigma, cat#S8830], pH 7.4) and incubated on ice for 10 minutes with intermittent vortexing. Lysates were cleared by centrifugation (10 minutes at 14,000 × g, 4°C) and quantified by Bradford (Bio-Rad, cat#5000205). Samples were then boiled for 5 minutes in Laemmli sample buffer. Proteins were separated by SDS-PAGE and transferred to PVDF membranes, which were blocked with 5% (w/v) nonfat dry milk in Tris Buffered Saline (TBS; 20 mM Tris-HCl and 150 mM NaCl), followed by incubation with primary antibodies diluted in 2.5% (w/v) nonfat dry milk in TBS supplemented with 0.1% (w/v) Tween-20 (TBS-T) and 0.05% (w/v) sodium azide. Secondary antibodies were diluted in 2.5% (w/v) nonfat dry milk in TBS-T. The primary antibodies used were the following (species, source, and dilution factor indicated in parenthesis): GFP (mouse, Clontech cat# 632380, 1:2,000); Gαi3 (rabbit, Aviva Cat#OAAB19207, 1:1,000); Gβ (mouse, Santa Cruz Biotechnology cat# sc-166123; 1:250); β-actin (rabbit, LI-COR Cat#926-42212; 1:1,000); Nluc (mouse, Promega cat# N700A; 1:500). The following secondary antibodies were used at a 1:10,000 dilution (species and vendor indicated in parenthesis): anti-mouse Alexa Fluor 680 (goat, Invitrogen cat# A21058); anti-mouse IRDye 800 (goat, LI-COR cat# 926-32210); anti-rabbit DyLight 800 (goat, Thermo cat# 35571). Infrared imaging of immunoblots was performed according to manufacturer’s recommendations using an Odyssey CLx infrared imaging system (LI-COR Biosciences). Images were processed using Image Studio software (LI-COR), and assembled for presentation using Photoshop and Illustrator software (Adobe).
Production of concentrated lentiviral particles
Lentiviruses used for transduction of mouse glia were concentrated after large scale packaging as described previously (33, 70, 71). Lenti-X 293T cells (Takara Bio Cat#632180) were plated on 150 mm diameter dishes (~2.5 million cells / dish) and cultured at 37°C, 5% CO2 in DMEM supplemented with 10% FCS, 100 U/ml penicillin, 100 μg/ml streptomycin, and 2 mM L-glutamine. After 16-24 hr, cells were transfected using the polyethylenimine (PEI) method (70) at a 2:1 PEI:DNA ratio with the following plasmids (amount of DNA per dish in parenthesis): psPAX2 (18 μg), pMD2.G (11.25 μg), and a plasmid encoding either Gαi bONE-GO WT or Gαi bONE-GO WA (i.e., bearing the W139A mutation in GINIP) biosensor (27 μg). Approximately 16 hr after transfection, media was replaced. Lentivirus containing media was collected 24 and 48 hr after the initial media change (~70 mL per dish and 4 dishes for each construct). Media was centrifuged for 5 minutes at 900 x g and filtered through a 0.45 μm sterile PES filter (Fisherbrand cat# FB12566505). Filtered media was centrifuged for ~18 hr at 17,200 x g at 4°C (Sorvall RC6+, ThermoScientific F12-6x500 LEX rotor) to sediment lentiviral particles. Pellets were washed and gently resuspended in 1 mL of PBS and centrifuged at 50,000 x g for 1 hr at 4°C (Beckman Optima MAX-E, TLA-55 rotor). Pellets were resuspended in 300 μl of PBS to obtain concentrated lentiviral stocks that were stored at −80°C in aliquots. Each aliquot was thawed only once and used for less than a week stored at 4°C for subsequent experiments.
Mouse primary cortical astroglial cell culture
All animal procedures were approved by the Institutional Animal Care and Use Committee (IACUC) at Boston University Chobanian & Avedisian School of Medicine (PROTO202000018). C57BL/6N wild-type mice were from an in-house colony originally established with animals obtained from the Mutant Mouse Resource & Research Centers (MMRRC) at UC Davis. Astrocyte-rich glial cultures were prepared from the cortex of neonatal mice as previously described (72) with modifications. Newborn mouse pups (P1-3) were euthanized by decapitation. Brains were removed from the skull and placed in cold HBSS. The cerebrum was detached from other brain regions under a stereomicroscope by removal of the olfactory bulb and cerebellum, and meninges were peeled off with a tweezer. The cortex was dissected out with forceps by removing the hippocampus and the entire midbrain region. The cortex was minced into approximately 1-2 mm pieces using a sterile razor blade, and digested with 0.05% (w:v) trypsin in HBSS for 10 minutes at 37°C. Trypsinized tissue was washed three times with HBSS to remove trypsin, and resuspended in DMEM supplemented with 10% FBS (Gibco cat# 2614-079), 100 U/ml penicillin, 100 μg/ml streptomycin (complete neuro DMEM) before passing through a sterile 40 μm cell strainer (Fisherbrand, cat# 22363547) to obtain a cell suspension. Six-well plates were coated overnight with 0.1 mg/ml poly-L-lysine hydrobromide (Millipore Sigma Cat#P9155), washed three times with HBSS, and approximately 1.5 millions cells were plated in each well. Media was changed the following day, and cells were subsequently split at a 1:2 ratio every 2-3 days by trypsinization followed by centrifugation at 180 x g for 5 minutes before resuspending and reseeding in complete neuro DMEM. Cells were cultured for not more than 5 passages.
Transduction of mouse astroglial cells with bONE-GO sensor and BRET measurements
bONE-GO biosensors were expressed in astroglial cells by lentiviral transduction as previously described (33) using concentrated stocks described in “Production of concentrated lentiviral particles”. Mouse astroglial cells were seeded on 5 mm glass coverslips (Word Precision Instruments cat# 502040) precoated with 0.1 mg/mL poly-L-lysine hydrobromide (overnight incubation followed by 3 washes with HBSS) and placed in a 96-well plate (40,000 cells per well). Approximately 18 hr after seeding, cells were transduced by replacing the media with 100 μl of fresh media supplemented with 6 μg/ml polybrene and lentiviruses for the expression of Gαi bONE-GO (1:1000-1:3000 dilution). Plates were spun at 600 x g for 30 minutes and returned to the incubator. Media was replaced ~24 hr later.
Kinetic BRET recordings were performed ~48 hr post-transduction as described below. Coverslips were washed with 200 μl BRET buffer and transferred to a well of a white opaque 96-well plate containing BRET buffer and Nano-Glo (final dilution 1:200) with tweezers, followed by incubation in the dark at room temperature for 2 minutes before measuring luminescence in a PHERAstar OMEGA plate reader (BMG Labtech). Luminescence signals at 450 ± 40 and 535 ± 15 nm were measured at 28°C with a signal integration time of 0.96 s. Adenosine was added as indicated in the figures during the recordings using built-in injectors. BRET was calculated as the ratio between the emission intensity at 535 nm divided by the emission intensity at 450 nm, followed by multiplication by 103. Kinetic traces are represented as change in BRET after subtraction of the baseline signal measured for 30 s before GPCR stimulation [ΔBRET·103 (baseline)]. Where indicated in the figures or figure legends, cells expressing Gαi bONE-GO WT were treated overnight with 0.1 μg/ml pertussis toxin (List Biological Labs, cat#179A). For the concentration-response curve presented in Fig. 7C, the average [ΔBRET·103 (baseline)] of the “Buffer” condition was first subtracted from all traces, and then the area-under-curve (AUC) was calculated in Prism (GraphPad) for each trace, followed by curve fit to a 3-parameter sigmoidal equation.
Statistical analysis
Experiments were independently repeated a minimum of three times, unless otherwise indicated. For experiments displaying pooled data, individual data points and mean ± S.E.M. is depicted. For other experiments, like immunoblot images, one representative result is presented. All statistical comparisons were calculated in GraphPad Prism 9, p-value thresholds are as follows: * for p<0.05, ** for p<0.01, *** for p<0.005. An unpaired, two-tailed Student’s t-test was used in cases where two conditions were compared, as in Fig. 2B, Fig. 4B, fig. S1, fig. S4. One-way ANOVA with correction for multiple comparisons using Holm-Šídák post-hoc analysis was used in cases where 2 or more conditions were compared to a control condition, as in Fig. 6D,E. To determine IC50 values for concentration-dependent measurements a three-parameter sigmoidal curve fit was used and comparisons between conditions were made using an extra sum-of-squares F test, as in Fig. 2C, Fig. 4C.
Supplementary Material
ACKNOWLEDGMENTS
We thank the Boston University Flow Cytometry Core Facility for access to instrumentation and technical support. We thank the following investigators for providing DNA plasmids: N. Lambert (Augusta University, Augusta, GA), P. Slessinger (Mount Sinai NY), A. Kovoor (University of Rhode Island), J. Blumer (Medical University of South Carolina), K. Blumer (Washington University), J. Levitz (Weill Cornell Medicine).
FUNDING
This work was primarily supported by NIH grants R35GM156286, R01GM147931 and R01NS117101 (to M.G-M.). A.L. was supported by a F31 Ruth L. Kirschstein NRSA Predocotral Fellowship (F31NS115318) and R.J. was supported by a Predoctoral Fellowship from the American Heart Association (898932).
Footnotes
COMPETING INTERESTS
The authors declare that they have no competing interests.
DATA AND MATERIALS AVAILABILITY
All data needed to evaluate the conclusions in the paper are present in the paper or the Supplementary Materials.
REFERENCES AND NOTES
- 1.Gilman AG, G proteins: transducers of receptor-generated signals. Annual review of biochemistry 56, 615–649 (1987) 10.1146/annurev.bi.56.070187.003151). [DOI] [PubMed] [Google Scholar]
- 2.Marx J, Nobel Prizes. Medicine: a signal award for discovering G proteins. Science 266, 368–369 (1994); published online EpubOct 21 ( [DOI] [PubMed] [Google Scholar]
- 3.Oldham WM, Hamm HE, Heterotrimeric G protein activation by G-protein-coupled receptors. Nature reviews. Molecular cell biology 9, 60–71 (2008); published online EpubJan ( 10.1038/nrm2299). [DOI] [PubMed] [Google Scholar]
- 4.Morris AJ, Malbon CC, Physiological regulation of G protein-linked signaling. Physiological reviews 79, 1373–1430 (1999); published online EpubOct ( [DOI] [PubMed] [Google Scholar]
- 5.Weis WI, Kobilka BK, The Molecular Basis of G Protein-Coupled Receptor Activation. Annual review of biochemistry 87, 897–919 (2018); published online EpubJun 20 ( 10.1146/annurev-biochem-060614-033910). [DOI] [PMC free article] [PubMed] [Google Scholar]
- 6.Smith JS, Lefkowitz RJ, Rajagopal S, Biased signalling: from simple switches to allosteric microprocessors. Nature reviews. Drug discovery 17, 243–260 (2018); published online EpubApr ( 10.1038/nrd.2017.229). [DOI] [PMC free article] [PubMed] [Google Scholar]
- 7.de Mendoza A, Sebe-Pedros A, Ruiz-Trillo I, The evolution of the GPCR signaling system in eukaryotes: modularity, conservation, and the transition to metazoan multicellularity. Genome biology and evolution 6, 606–619 (2014); published online EpubMar ( 10.1093/gbe/evu038). [DOI] [PMC free article] [PubMed] [Google Scholar]
- 8.Anantharaman V, Abhiman S, de Souza RF, Aravind L, Comparative genomics uncovers novel structural and functional features of the heterotrimeric GTPase signaling system. Gene 475, 63–78 (2011); published online EpubApr 15 ( 10.1016/j.gene.2010.12.001). [DOI] [PMC free article] [PubMed] [Google Scholar]
- 9.Urano D, Jones AM, Heterotrimeric G protein-coupled signaling in plants. Annual review of plant biology 65, 365–384 (2014) 10.1146/annurev-arplant-050213-040133). [DOI] [PMC free article] [PubMed] [Google Scholar]
- 10.Sriram K, Insel PA, G Protein-Coupled Receptors as Targets for Approved Drugs: How Many Targets and How Many Drugs? Mol Pharmacol 93, 251–258 (2018); published online EpubApr ( 10.1124/mol.117.111062). [DOI] [PMC free article] [PubMed] [Google Scholar]
- 11.Hopkins AL, Groom CR, The druggable genome. Nat Rev Drug Discov 1, 727–730 (2002); published online EpubSep ( 10.1038/nrd892). [DOI] [PubMed] [Google Scholar]
- 12.Hauser AS, Attwood MM, Rask-Andersen M, Schioth HB, Gloriam DE, Trends in GPCR drug discovery: new agents, targets and indications. Nature reviews. Drug discovery 16, 829–842 (2017); published online EpubDec ( 10.1038/nrd.2017.178). [DOI] [PMC free article] [PubMed] [Google Scholar]
- 13.Sauriyal DS, Jaggi AS, Singh N, Extending pharmacological spectrum of opioids beyond analgesia: multifunctional aspects in different pathophysiological states. Neuropeptides 45, 175–188 (2011); published online EpubJun ( 10.1016/j.npep.2010.12.004). [DOI] [PubMed] [Google Scholar]
- 14.Manglik A, Lin H, Aryal DK, McCorvy JD, Dengler D, Corder G, Levit A, Kling RC, Bernat V, Hubner H, Huang XP, Sassano MF, Giguere PM, Lober S, Da D, Scherrer G, Kobilka BK, Gmeiner P, Roth BL, Shoichet BK, Structure-based discovery of opioid analgesics with reduced side effects. Nature 537, 185–190 (2016); published online EpubSep 8 ( 10.1038/nature19112). [DOI] [PMC free article] [PubMed] [Google Scholar]
- 15.Faouzi A, Wang H, Zaidi SA, DiBerto JF, Che T, Qu Q, Robertson MJ, Madasu MK, El Daibani A, Varga BR, Zhang T, Ruiz C, Liu S, Xu J, Appourchaux K, Slocum ST, Eans SO, Cameron MD, Al-Hasani R, Pan YX, Roth BL, McLaughlin JP, Skiniotis G, Katritch V, Kobilka BK, Majumdar S, Structure-based design of bitopic ligands for the μ-opioid receptor. Nature 613, 767–774 (2023); published online EpubJan ( 10.1038/s41586-022-05588-y). [DOI] [PMC free article] [PubMed] [Google Scholar]
- 16.Hill R, Disney A, Conibear A, Sutcliffe K, Dewey W, Husbands S, Bailey C, Kelly E, Henderson G, The novel μ-opioid receptor agonist PZM21 depresses respiration and induces tolerance to antinociception. Br J Pharmacol 175, 2653–2661 (2018); published online EpubJul ( 10.1111/bph.14224). [DOI] [PMC free article] [PubMed] [Google Scholar]
- 17.DeWire SM, Yamashita DS, Rominger DH, Liu G, Cowan CL, Graczyk TM, Chen XT, Pitis PM, Gotchev D, Yuan C, Koblish M, Lark MW, Violin JD, A G protein-biased ligand at the μ-opioid receptor is potently analgesic with reduced gastrointestinal and respiratory dysfunction compared with morphine. J Pharmacol Exp Ther 344, 708–717 (2013); published online EpubMar ( 10.1124/jpet.112.201616). [DOI] [PubMed] [Google Scholar]
- 18.Schmid CL, Kennedy NM, Ross NC, Lovell KM, Yue Z, Morgenweck J, Cameron MD, Bannister TD, Bohn LM, Bias Factor and Therapeutic Window Correlate to Predict Safer Opioid Analgesics. Cell 171, 1165–1175 e1113 (2017); published online EpubNov 16 ( 10.1016/j.cell.2017.10.035). [DOI] [PMC free article] [PubMed] [Google Scholar]
- 19.Fink EA, Xu J, Hübner H, Braz JM, Seemann P, Avet C, Craik V, Weikert D, Schmidt MF, Webb CM, Tolmachova NA, Moroz YS, Huang XP, Kalyanaraman C, Gahbauer S, Chen G, Liu Z, Jacobson MP, Irwin JJ, Bouvier M, Du Y, Shoichet BK, Basbaum AI, Gmeiner P, Structure-based discovery of nonopioid analgesics acting through the α(2A)-adrenergic receptor. Science 377, eabn7065 (2022); published online EpubSep 30 ( 10.1126/science.abn7065). [DOI] [PMC free article] [PubMed] [Google Scholar]
- 20.Hauser AS, Avet C, Normand C, Mancini A, Inoue A, Bouvier M, Gloriam DE, Common coupling map advances GPCR-G protein selectivity. eLife 11, (2022); published online EpubMar 18 ( 10.7554/eLife.74107). [DOI] [PMC free article] [PubMed] [Google Scholar]
- 21.Bettler B, Kaupmann K, Mosbacher J, Gassmann M, Molecular structure and physiological functions of GABA(B) receptors. Physiological reviews 84, 835–867 (2004); published online EpubJul ( 10.1152/physrev.00036.2003). [DOI] [PubMed] [Google Scholar]
- 22.Paul B, Sribhashyam S, Majumdar S, Opioid signaling and design of analgesics. Prog Mol Biol Transl Sci 195, 153–176 (2023) 10.1016/bs.pmbts.2022.06.017). [DOI] [PMC free article] [PubMed] [Google Scholar]
- 23.Bernhard SM, Han J, Che T, GPCR-G protein selectivity revealed by structural pharmacology. Febs j, (2023); published online EpubDec 27 ( 10.1111/febs.17049). [DOI] [PMC free article] [PubMed] [Google Scholar]
- 24.Koehl A, Hu H, Maeda S, Zhang Y, Qu Q, Paggi JM, Latorraca NR, Hilger D, Dawson R, Matile H, Schertler GFX, Granier S, Weis WI, Dror RO, Manglik A, Skiniotis G, Kobilka BK, Structure of the μ-opioid receptor-G(i) protein complex. Nature 558, 547–552 (2018); published online EpubJun ( 10.1038/s41586-018-0219-7). [DOI] [PMC free article] [PubMed] [Google Scholar]
- 25.Bunemann M, Frank M, Lohse MJ, Gi protein activation in intact cells involves subunit rearrangement rather than dissociation. Proceedings of the National Academy of Sciences of the United States of America 100, 16077–16082 (2003); published online EpubDec 23 ( 10.1073/pnas.2536719100). [DOI] [PMC free article] [PubMed] [Google Scholar]
- 26.Gales C, Van Durm JJ, Schaak S, Pontier S, Percherancier Y, Audet M, Paris H, Bouvier M, Probing the activation-promoted structural rearrangements in preassembled receptor-G protein complexes. Nature structural & molecular biology 13, 778–786 (2006); published online EpubSep ( 10.1038/nsmb1134). [DOI] [PubMed] [Google Scholar]
- 27.Hollins B, Kuravi S, Digby GJ, Lambert NA, The c-terminus of GRK3 indicates rapid dissociation of G protein heterotrimers. Cellular signalling 21, 1015–1021 (2009); published online EpubJun ( 10.1016/j.cellsig.2009.02.017). [DOI] [PMC free article] [PubMed] [Google Scholar]
- 28.Masuho I, Ostrovskaya O, Kramer GM, Jones CD, Xie K, Martemyanov KA, Distinct profiles of functional discrimination among G proteins determine the actions of G protein-coupled receptors. Science signaling 8, ra123 (2015); published online EpubDec 1 ( 10.1126/scisignal.aab4068). [DOI] [PMC free article] [PubMed] [Google Scholar]
- 29.Janetopoulos C, Jin T, Devreotes P, Receptor-mediated activation of heterotrimeric G-proteins in living cells. Science 291, 2408–2411 (2001); published online EpubMar 23 ( 10.1126/science.1055835). [DOI] [PubMed] [Google Scholar]
- 30.Olsen RHJ, DiBerto JF, English JG, Glaudin AM, Krumm BE, Slocum ST, Che T, Gavin AC, McCorvy JD, Roth BL, Strachan RT, TRUPATH, an open-source biosensor platform for interrogating the GPCR transducerome. Nat Chem Biol 16, 841–849 (2020); published online EpubAug ( 10.1038/s41589-020-0535-8). [DOI] [PMC free article] [PubMed] [Google Scholar]
- 31.Xu C, Zhou Y, Liu Y, Lin L, Liu P, Wang X, Xu Z, Pin JP, Rondard P, Liu J, Specific pharmacological and G(i/o) protein responses of some native GPCRs in neurons. Nature communications 15, 1990 (2024); published online EpubMar 5 ( 10.1038/s41467-024-46177-z). [DOI] [PMC free article] [PubMed] [Google Scholar]
- 32.Maziarz M, Park JC, Leyme A, Marivin A, Garcia-Lopez A, Patel PP, Garcia-Marcos M, Revealing the Activity of Trimeric G-proteins in Live Cells with a Versatile Biosensor Design. Cell 182, 770–785.e716 (2020); published online EpubAug 6 ( 10.1016/j.cell.2020.06.020). [DOI] [PMC free article] [PubMed] [Google Scholar]
- 33.Janicot R, Maziarz M, Park JC, Zhao J, Luebbers A, Green E, Philibert CE, Zhang H, Layne MD, Wu JC, Garcia-Marcos M, Direct interrogation of context-dependent GPCR activity with a universal biosensor platform. Cell, (2024); published online EpubFeb 16 ( 10.1016/j.cell.2024.01.028). [DOI] [PMC free article] [PubMed] [Google Scholar]
- 34.Avet C, Mancini A, Breton B, Le Gouill C, Hauser AS, Normand C, Kobayashi H, Gross F, Hogue M, Lukasheva V, St-Onge S, Carrier M, Héroux M, Morissette S, Fauman EB, Fortin J-P, Schann S, Leroy X, Gloriam DE, Bouvier M, Effector membrane translocation biosensors reveal G protein and βarrestin coupling profiles of 100 therapeutically relevant GPCRs. eLife 11, e74101 (2022); published online Epub2022/03/18 ( 10.7554/eLife.74101). [DOI] [PMC free article] [PubMed] [Google Scholar]
- 35.Park JC, Luebbers A, Dao M, Semeano A, Nguyen AM, Papakonstantinou MP, Broselid S, Yano H, Martemyanov KA, Garcia-Marcos M, Fine-tuning GPCR-mediated neuromodulation by biasing signaling through different G protein subunits. Mol Cell 83, 2540–2558.e2512 (2023); published online EpubJul 20 ( 10.1016/j.molcel.2023.06.006). [DOI] [PMC free article] [PubMed] [Google Scholar]
- 36.Luebbers A, Gonzalez-Hernandez AJ, Zhou M, Eyles SJ, Levitz J, Garcia-Marcos M, Dissecting the molecular basis for the modulation of neurotransmitter GPCR signaling by GINIP. Structure 32, 47–59.e47 (2024); published online EpubJan 4 ( 10.1016/j.str.2023.10.010). [DOI] [PMC free article] [PubMed] [Google Scholar]
- 37.Philibert CE, Garcia-Marcos M, Smooth operator(s): dialing up and down neurotransmitter responses by G-protein regulators. Trends Cell Biol, (2024); published online EpubJul 24 ( 10.1016/j.tcb.2024.07.002). [DOI] [PMC free article] [PubMed] [Google Scholar]
- 38.Kuravi S, Lan TH, Barik A, Lambert NA, Third-party bioluminescence resonance energy transfer indicates constitutive association of membrane proteins: application to class a g-protein-coupled receptors and g-proteins. Biophys J 98, 2391–2399 (2010); published online EpubMay 19 ( 10.1016/j.bpj.2010.02.004). [DOI] [PMC free article] [PubMed] [Google Scholar]
- 39.Martin BR, Lambert NA, Activated G Protein Gαs Samples Multiple Endomembrane Compartments. The Journal of biological chemistry 291, 20295–20302 (2016); published online EpubSep 23 ( 10.1074/jbc.M116.729731). [DOI] [PMC free article] [PubMed] [Google Scholar]
- 40.Gaillard S, Lo Re L, Mantilleri A, Hepp R, Urien L, Malapert P, Alonso S, Deage M, Kambrun C, Landry M, Low SA, Alloui A, Lambolez B, Scherrer G, Le Feuvre Y, Bourinet E, Moqrich A, GINIP, a Gαi-interacting protein, functions as a key modulator of peripheral GABAB receptor-mediated analgesia. Neuron 84, 123–136 (2014); published online EpubOct 1 ( 10.1016/j.neuron.2014.08.056). [DOI] [PMC free article] [PubMed] [Google Scholar]
- 41.Binkowski BF, Butler BL, Stecha PF, Eggers CT, Otto P, Zimmerman K, Vidugiris G, Wood MG, Encell LP, Fan F, Wood KV, A Luminescent Biosensor with Increased Dynamic Range for Intracellular cAMP. ACS Chemical Biology 6, 1193–1197 (2011); published online Epub2011/11/18 ( 10.1021/cb200248h). [DOI] [PubMed] [Google Scholar]
- 42.Levitt ES, Purington LC, Traynor JR, Gi/o-coupled receptors compete for signaling to adenylyl cyclase in SH-SY5Y cells and reduce opioid-mediated cAMP overshoot. Molecular pharmacology 79, 461–471 (2011); published online EpubMar ( 10.1124/mol.110.064816). [DOI] [PMC free article] [PubMed] [Google Scholar]
- 43.Alexander SPH, Christopoulos A, Davenport AP, Kelly E, Mathie AA, Peters JA, Veale EL, Armstrong JF, Faccenda E, Harding SD, Davies JA, Abbracchio MP, Abraham G, Agoulnik A, Alexander W, Al-Hosaini K, Bäck M, Baker JG, Barnes NM, Bathgate R, Beaulieu JM, Beck-Sickinger AG, Behrens M, Bernstein KE, Bettler B, Birdsall NJM, Blaho V, Boulay F, Bousquet C, Bräuner-Osborne H, Burnstock G, Caló G, Castaño JP, Catt KJ, Ceruti S, Chazot P, Chiang N, Chini B, Chun J, Cianciulli A, Civelli O, Clapp LH, Couture R, Cox HM, Csaba Z, Dahlgren C, Dent G, Douglas SD, Dournaud P, Eguchi S, Escher E, Filardo EJ, Fong T, Fumagalli M, Gainetdinov RR, Garelja ML, de Gasparo M, Gerard C, Gershengorn M, Gobeil F, Goodfriend TL, Goudet C, Grätz L, Gregory KJ, Gundlach AL, Hamann J, Hanson J, Hauger RL, Hay DL, Heinemann A, Herr D, Hollenberg MD, Holliday ND, Horiuchi M, Hoyer D, Hunyady L, Husain A, AP IJ, Inagami T, Jacobson KA, Jensen RT, Jockers R, Jonnalagadda D, Karnik S, Kaupmann K, Kemp J, Kennedy C, Kihara Y, Kitazawa T, Kozielewicz P, Kreienkamp HJ, Kukkonen JP, Langenhan T, Larhammar D, Leach K, Lecca D, Lee JD, Leeman SE, Leprince J, Li XX, Lolait SJ, Lupp A, Macrae R, Maguire J, Malfacini D, Mazella J, McArdle CA, Melmed S, Michel MC, Miller LJ, Mitolo V, Mouillac B, Müller CE, Murphy PM, Nahon JL, Ngo T, Norel X, Nyimanu D, O'Carroll AM, Offermanns S, Panaro MA, Parmentier M, Pertwee RG, Pin JP, Prossnitz ER, Quinn M, Ramachandran R, Ray M, Reinscheid RK, Rondard P, Rovati GE, Ruzza C, Sanger GJ, Schöneberg T, Schulte G, Schulz S, Segaloff DL, Serhan CN, Singh KD, Smith CM, Stoddart LA, Sugimoto Y, Summers R, Tan VP, Thal D, Thomas WW, Timmermans P, Tirupula K, Toll L, Tulipano G, Unal H, Unger T, Valant C, Vanderheyden P, Vaudry D, Vaudry H, Vilardaga JP, Walker CS, Wang JM, Ward DT, Wester HJ, Willars GB, Williams TL, Woodruff TM, Yao C, Ye RD, The Concise Guide to PHARMACOLOGY 2023/24: G protein-coupled receptors. Br J Pharmacol 180 Suppl 2, S23–s144 (2023); published online EpubOct ( 10.1111/bph.16177). [DOI] [PubMed] [Google Scholar]
- 44.Raynor K, Kong H, Chen Y, Yasuda K, Yu L, Bell GI, Reisine T, Pharmacological characterization of the cloned kappa-, delta-, and mu-opioid receptors. Molecular pharmacology 45, 330–334 (1994); published online EpubFeb ( [PubMed] [Google Scholar]
- 45.Van Rossum JM, Limitations of molecular pharmacology. Adv. Drug Res (1966), vol. 3. [Google Scholar]
- 46.Gong J, Strong JA, Zhang S, Yue X, DeHaven RN, Daubert JD, Cassel JA, Yu G, Mansson E, Yu L, Endomorphins fully activate a cloned human mu opioid receptor. FEBS letters 439, 152–156 (1998); published online EpubNov 13 ( 10.1016/s0014-5793(98)01362-3). [DOI] [PubMed] [Google Scholar]
- 47.Dias RB, Rombo DM, Ribeiro JA, Henley JM, Sebastião AM, Adenosine: setting the stage for plasticity. Trends Neurosci 36, 248–257 (2013); published online EpubApr ( 10.1016/j.tins.2012.12.003). [DOI] [PubMed] [Google Scholar]
- 48.Kenakin T, Is the Quest for Signaling Bias Worth the Effort? Molecular pharmacology 93, 266–269 (2018); published online EpubApr ( 10.1124/mol.117.111187). [DOI] [PubMed] [Google Scholar]
- 49.Kenakin T, Biased Receptor Signaling in Drug Discovery. Pharmacological reviews 71, 267–315 (2019); published online EpubApr ( 10.1124/pr.118.016790). [DOI] [PubMed] [Google Scholar]
- 50.Che T, Dwivedi-Agnihotri H, Shukla AK, Roth BL, Biased ligands at opioid receptors: Current status and future directions. Science signaling 14, (2021); published online EpubApr 6 ( 10.1126/scisignal.aav0320). [DOI] [PMC free article] [PubMed] [Google Scholar]
- 51.Bohn LM, Lefkowitz RJ, Gainetdinov RR, Peppel K, Caron MG, Lin FT, Enhanced morphine analgesia in mice lacking beta-arrestin 2. Science 286, 2495–2498 (1999); published online EpubDec 24 ( 10.1126/science.286.5449.2495). [DOI] [PubMed] [Google Scholar]
- 52.Kliewer A, Gillis A, Hill R, Schmiedel F, Bailey C, Kelly E, Henderson G, Christie MJ, Schulz S, Morphine-induced respiratory depression is independent of β-arrestin2 signalling. Br J Pharmacol 177, 2923–2931 (2020); published online EpubJul ( 10.1111/bph.15004). [DOI] [PMC free article] [PubMed] [Google Scholar]
- 53.Gillis A, Gondin AB, Kliewer A, Sanchez J, Lim HD, Alamein C, Manandhar P, Santiago M, Fritzwanker S, Schmiedel F, Katte TA, Reekie T, Grimsey NL, Kassiou M, Kellam B, Krasel C, Halls ML, Connor M, Lane JR, Schulz S, Christie MJ, Canals M, Low intrinsic efficacy for G protein activation can explain the improved side effect profiles of new opioid agonists. Science signaling 13, (2020); published online EpubMar 31 ( 10.1126/scisignal.aaz3140). [DOI] [PubMed] [Google Scholar]
- 54.Gillis A, Kliewer A, Kelly E, Henderson G, Christie MJ, Schulz S, Canals M, Critical Assessment of G Protein-Biased Agonism at the μ-Opioid Receptor. Trends Pharmacol Sci 41, 947–959 (2020); published online EpubDec ( 10.1016/j.tips.2020.09.009). [DOI] [PubMed] [Google Scholar]
- 55.Lan TH, Liu Q, Li C, Wu G, Lambert NA, Sensitive and high resolution localization and tracking of membrane proteins in live cells with BRET. Traffic 13, 1450–1456 (2012); published online EpubNov ( 10.1111/j.1600-0854.2012.01401.x). [DOI] [PMC free article] [PubMed] [Google Scholar]
- 56.Wan Q, Okashah N, Inoue A, Nehmé R, Carpenter B, Tate CG, Lambert NA, Mini G protein probes for active G protein-coupled receptors (GPCRs) in live cells. The Journal of biological chemistry 293, 7466–7473 (2018); published online EpubMay 11 ( 10.1074/jbc.RA118.001975). [DOI] [PMC free article] [PubMed] [Google Scholar]
- 57.Tsvetanova NG, Trester-Zedlitz M, Newton BW, Peng GE, Johnson JR, Jimenez-Morales D, Kurland AP, Krogan NJ, von Zastrow M, Endosomal cAMP production broadly impacts the cellular phosphoproteome. The Journal of biological chemistry 297, 100907 (2021); published online EpubJul ( 10.1016/j.jbc.2021.100907). [DOI] [PMC free article] [PubMed] [Google Scholar]
- 58.Radoux-Mergault A, Oberhauser L, Aureli S, Gervasio FL, Stoeber M, Subcellular location defines GPCR signal transduction. Science advances 9, eadf6059 (2023); published online EpubApr 21 ( 10.1126/sciadv.adf6059). [DOI] [PMC free article] [PubMed] [Google Scholar]
- 59.Stoeber M, Jullié D, Lobingier BT, Laeremans T, Steyaert J, Schiller PW, Manglik A, von Zastrow M, A Genetically Encoded Biosensor Reveals Location Bias of Opioid Drug Action. Neuron 98, 963–976.e965 (2018); published online EpubJun 6 ( 10.1016/j.neuron.2018.04.021). [DOI] [PMC free article] [PubMed] [Google Scholar]
- 60.Kumar GA, Puthenveedu MA, Diversity and specificity in location-based signaling outputs of neuronal GPCRs. Curr Opin Neurobiol 76, 102601 (2022); published online EpubOct ( 10.1016/j.conb.2022.102601). [DOI] [PMC free article] [PubMed] [Google Scholar]
- 61.Kearn CS, Blake-Palmer K, Daniel E, Mackie K, Glass M, Concurrent stimulation of cannabinoid CB1 and dopamine D2 receptors enhances heterodimer formation: a mechanism for receptor cross-talk? Molecular pharmacology 67, 1697–1704 (2005); published online EpubMay ( 10.1124/mol.104.006882). [DOI] [PubMed] [Google Scholar]
- 62.Oner SS, An N, Vural A, Breton B, Bouvier M, Blumer JB, Lanier SM, Regulation of the AGS3·G{alpha}i signaling complex by a seven-transmembrane span receptor. The Journal of biological chemistry 285, 33949–33958 (2010); published online EpubOct 29 ( 10.1074/jbc.M110.138073). [DOI] [PMC free article] [PubMed] [Google Scholar]
- 63.Zhang H, Tian L, Shen M, Tu C, Wu H, Gu M, Paik DT, Wu JC, Generation of Quiescent Cardiac Fibroblasts From Human Induced Pluripotent Stem Cells for In Vitro Modeling of Cardiac Fibrosis. Circulation Research 125, 552–566 (2019)doi: 10.1161/CIRCRESAHA.119.315491). [DOI] [PMC free article] [PubMed] [Google Scholar]
- 64.Tang Y, Hu LA, Miller WE, Ringstad N, Hall RA, Pitcher JA, DeCamilli P, Lefkowitz RJ, Identification of the endophilins (SH3p4/p8/p13) as novel binding partners for the beta1-adrenergic receptor. Proceedings of the National Academy of Sciences of the United States of America 96, 12559–12564 (1999); published online EpubOct 26 ( 10.1073/pnas.96.22.12559). [DOI] [PMC free article] [PubMed] [Google Scholar]
- 65.Ishii K, Hein L, Kobilka B, Coughlin SR, Kinetics of thrombin receptor cleavage on intact cells. Relation to signaling. The Journal of biological chemistry 268, 9780–9786 (1993); published online EpubMay 5 ( [PubMed] [Google Scholar]
- 66.Onken MD, Makepeace CM, Kaltenbronn KM, Kanai SM, Todd TD, Wang S, Broekelmann TJ, Rao PK, Cooper JA, Blumer KJ, Targeting nucleotide exchange to inhibit constitutively active G protein α subunits in cancer cells. Science signaling 11, (2018); published online EpubSep 4 ( 10.1126/scisignal.aao6852). [DOI] [PMC free article] [PubMed] [Google Scholar]
- 67.Garcia-Marcos M, Ghosh P, Ear J, Farquhar MG, A structural determinant that renders G alpha(i) sensitive to activation by GIV/girdin is required to promote cell migration. The Journal of biological chemistry 285, 12765–12777 (2010); published online EpubApr 23 ( 10.1074/jbc.M109.045161). [DOI] [PMC free article] [PubMed] [Google Scholar]
- 68.Maziarz M, Park JC, Leyme A, Marivin A, Garcia-Lopez A, Patel PP, Garcia-Marcos M, Revealing the Activity of Trimeric G-proteins in Live Cells with a Versatile Biosensor Design. Cell 182, 770–785 e716 (2020); published online EpubAug 6 ( 10.1016/j.cell.2020.06.020). [DOI] [PMC free article] [PubMed] [Google Scholar]
- 69.Bochkov YA, Palmenberg AC, Translational efficiency of EMCV IRES in bicistronic vectors is dependent upon IRES sequence and gene location. BioTechniques 41, 283–284, 286, 288 passim (2006); published online EpubSep ( 10.2144/000112243). [DOI] [PubMed] [Google Scholar]
- 70.Longo PA, Kavran JM, Kim MS, Leahy DJ, Transient mammalian cell transfection with polyethylenimine (PEI). Methods Enzymol 529, 227–240 (2013) 10.1016/b978-0-12-418687-3.00018-5). [DOI] [PMC free article] [PubMed] [Google Scholar]
- 71.Janicot R, Park JC, Garcia-Marcos M, Detecting GPCR Signals With Optical Biosensors of Galpha-GTP in Cell Lines and Primary Cell Cultures. Current protocols 3, e796 (2023); published online EpubJun ( 10.1002/cpz1.796). [DOI] [PMC free article] [PubMed] [Google Scholar]
- 72.Kaech S, Banker G, Culturing hippocampal neurons. Nat Protoc 1, 2406–2415 (2006) 10.1038/nprot.2006.356). [DOI] [PubMed] [Google Scholar]
Associated Data
This section collects any data citations, data availability statements, or supplementary materials included in this article.