

ABSTRACT
Background
Chronic low back pain (cLBP) presents as a heterogeneous condition, making diagnosis and treatment challenging. Lumbar spine intervertebral kinematics may provide an objective assessment of patients with cLBP that may be used to inform treatment decisions and evaluate the efficacy of interventions. The purpose of this study was to provide a quantitative description of intervertebral motion in the lumbar spine during flexion/extension (F/E) and lateral bending (LB) in individuals with cLBP.
Methods
Data from 125 individuals is included in this analysis (M: 53; F: 72; n = 66 < 60 years of age; average BMI: 25.7 ± 3.6 kg/m2). Dynamic biplane radiography (DBR) and a validated volumetric model‐based tracking system were used to assess intervertebral motion at every lumbar level (L1‐L2 through L5‐S1) during active F/E and LB movements in individuals with cLBP. The outcome measures were the intervertebral translation and rotation range of motion (ROM), the contribution of each motion segment to lumbar motion, the anterior–posterior slip per degree of flexion (SPDF), and trial‐to‐trial repeatability as assessed by the standard deviation in continuous kinematics waveforms over 3 trials of each movement. Outcomes were calculated for the entire group as well as for the subgroups of men, women, individuals less than 60 years of age, and individuals 60 or more years of age.
Results
The mean intervertebral F/E ROM progressively increased from 6.8° ± 3.1° at the L1‐L2 through the L4‐L5 motion segments, then decreased from 9.7° ± 5.2° at L4‐L5 to 8.4° ± 4.9° at L5‐S1. However, substantial variability among individuals was observed, and only 7 participants (5.6%) followed this ROM pattern. The mean intervertebral LB ROM increased from 8.8° ± 3.2° at L1‐L2 to 9.1° ± 4.2° at L2‐L3 and then progressively decreased from the L2‐L3 through the L5‐S1 motion segments to 2.7° ± 1.8°. However, only 13 participants (10.4%) followed this ROM pattern. On average, the L1‐L2, L2‐L3, and L5‐S1 motion segments were the main contributors to F/E when the torso was near the upright neutral position. L2‐L3, L3‐L4, and L4‐L5 were the main contributors to midrange flexion and extension, and L3‐L4, L4‐L5, and L5‐S1 were the main contributors to lumbar motion when the trunk was near full flexion. L1‐L2 and L2‐L3 were the main contributors to lumbar LB near the neutral position and through the midrange. The contributions from L4‐L5 and L5‐S1 peaked at the neutral position and at maximum bending. SPDF was similar in the L1‐L2, L2‐L3, and L3‐L4 motion segments, but less in the L4‐L5 motion segment. L5‐S1 SPDF was characterized by high variability among individuals as compared to other motion segments. The average trial‐to‐trial repeatability in intervertebral rotation in the primary plane of motion over all points on the kinematics waveform ranged from 0.3° to 0.7° across all motion segments during F/E and LB.
Conclusion
This study demonstrates the heterogeneity in lumbar spine intervertebral kinematics in individuals with cLBP. Further research is needed to identify mechanistic links between kinematics and other biological, behavioral, and clinical features in individuals with cLBP and to identify which kinematic characteristics are useful metrics for informing treatment approaches for patients with cLBP.
Keywords: age, contributions to motion, dynamic biplane radiography, phenotype, range of motion, repeatability, sex, slip per degree of flexion
This study comprehensively characterized dynamic lumbar spine kinematics during active flexion/extension and lateral bending under physiologic loading in individuals with cLBP. The results demonstrate the heterogeneity in lumbar spine intervertebral kinematics in individuals with cLBP.
1. Introduction
Chronic low back pain (cLBP) is widespread and multidimensional in nature [1]. The University of Pittsburgh's Low Back Pain: Biological, Biomechanical, Behavioral Phenotypes (LB3P) Mechanistic Research Center (MRC) is a member of the National Institutes of Health's (NIH) Back Pain Consortium (BACPAC) Research Program—which is part of the Helping End Addiction Long‐term (HEAL) Initiative. The overall objective of LB3P is to perform in‐depth phenotyping of patients with cLBP using a multi‐modal assessment approach that can inform improved treatments. The LB3P performed an observational cohort study of over 1000 people with cLBP [2].
Lumbar spine kinematics provide an objective assessment of movement patterns in patients with chronic low back pain (cLBP) that has the potential to inform treatment decisions and evaluate the efficacy of interventions [3, 4, 5, 6]. However, range of motion (ROM) tests that are often used during clinical exams assess global motion and lack the precision needed to objectively identify aberrant kinematics in a specific motion segment of the lumbar spine. Conventional medical imaging, such as computed tomography (CT), magnetic resonance imaging (MRI), static (including flexion/extension [F/E]) radiographs, and myelograms may provide evidence for structural origins of symptoms; however, they are unable to identify dynamic impairments over the midrange of motion [7]. Part of the reason why there is currently not a clear association between intervertebral range of motion and pain or disability [8, 9] may be due to the lack of understanding dynamic motion patterns at each intervertebral level.
In light of these limitations of physical exams and static imaging, several studies have used dynamic radiography to investigate intervertebral motion of the lumbar spine to assess for kinematic abnormalities during movement [10, 11, 12, 13]. Dynamic radiography has advantages over conventional motion analysis systems that track sensors placed on the skin (e.g., retroreflective markers or inertial measurement units [IMUs]). Dynamic radiography eliminates errors associated with misplaced markers and IMUs, which can range from 15 to 29 mm [14, 15], and it eliminates soft tissue artifact (STA) (i.e., relative motion between the skin and underlying bone) [15, 16, 17], which can average up to 8.6°. Disadvantages of dynamic radiography are patient exposure to radiation, the need for sophisticated imaging equipment and analysis software, and labor‐intensive data processing.
Previous dynamic radiography studies have found that patients with cLBP were distinguished from healthy controls not by the total ROM, but by how the motion occurred during the midrange of motion, such as “disordered” motion and greater variability in motion [10, 12, 13]. Despite the relatively small sample sizes and exclusive focus on planar motions, findings from these studies provide a rationale to comprehensively characterize intervertebral kinematics in a large group to better appreciate the similarities and differences in intervertebral kinematics in individuals with cLBP.
Furthermore, a more precise analysis of segmental motion may provide clearer insights into the relationship between spinal movement and pain or disability. The lack of strong evidence linking spine movement to pain or disability may be due to an inadequate understanding of motion patterns at each spinal segment. Prior studies have primarily analyzed overall spinal movement, overlooking potential segmental variations that could influence pain perception and functional limitations [8, 9, 18]. Analyses of critical segment‐specific adaptations may be key to linking spine movement to pain or disability.
Prior cadaveric studies have highlighted that lumbar range of motion varies by level, with flexion‐extension increasing caudally and lateral bending peaking at mid‐lumbar levels [19, 20]. Additionally, soft tissue structures (i.e., ligaments and disc) in cadavers bear loads predictably in neutral postures [21]. The isolated role of passive responses to motion due to soft tissue structures in cadaver studies provides valuable insight when conducting in vivo studies, where spinal muscles additionally contribute to dynamic stabilization of the spine and there is neuromuscular adaptation to redistribute forces to reduce pain [22]. Importantly, in vivo studies can address how pain and physiological loading specifically alter spinal motion patterns.
The purpose of this study was to characterize intervertebral lumbar spine kinematics during multiplanar motion under physiologic loading in individuals with self‐reported cLBP. The motions tested were flexion/extension (F/E) and LB (LB). The F/E motion was selected because the largest lumbar spine motions during activities of daily living occur in F/E [23], moving the center of mass of the body anteriorly is associated with the highest spinal loads [24], and static radiographic measurements of intervertebral motion during end range F/E are the standard of care for pre‐surgical evaluation of lumbar instability [25, 26]. LB was evaluated because it involves significant multiplanar motion [27], LB radiographs can be complementary to F/E when evaluating lumbar instability [28], and the second largest lumbar spine motions during activities of daily living occur in LB [23]. The four kinematic outcomes evaluated for each motion were: (1) intervertebral ROM, (2) contribution of each motion segment to overall lumbar spine motion, (3) the amount of anterior–posterior slip per degree of flexion (SPDF) at each motion segment during F/E, and (4) trial‐to‐trial repeatability. ROM is the most frequently reported kinematic metric in the lumbar spine, and it can be used to identify individual motion segments with excessive or restricted motion. Contributions to lumbar motion were investigated because previous studies suggest that cLBP patients demonstrate variability in motion segment contributions during the mid‐range of motion [3, 4], which may be useful for grouping patients according to their movement characteristics. The SPDF at each motion segment has been proposed as an objective metric to diagnose lumbar instability [29] and identify anatomical and pathological abnormalities [30, 31]. Finally, trial‐to‐trial repeatability was assessed because it is important for healthy and functional movement; overly rigid movements (too little variability) or noisy and unstable movements (too much variability) may overload joint tissues and lead to joint degeneration [32].
2. Materials and Methods
2.1. Participants
Participants were enrolled from a larger study of over 1000 individuals that aimed to characterize biological, biomechanical, and behavioral characteristics of individuals with cLBP [2]. All participants provided informed written consent prior to participating in this IRB‐approved study. Participants were English‐speaking adults who met the definition of cLBP described by the National Institutes of Health (NIH), which is LBP located between the lowest ribs and horizontal gluteal folds and experienced for over 3 months at a minimum frequency of 50% of the time [3]. Participants were excluded from the larger study if they were not identified in the University of Pittsburgh Medical Center Records, were participating in a masked intervention study for LBP, or had a medical condition that would place them at increased risk or preclude them from complying with study procedures. Exclusion criteria specific to this dynamic radiography sub‐cohort were a body mass index (BMI) greater than 35 kg/m2 (due to radiographic imaging challenges), pregnancy, or inability to perform the required motions.
Participants were enrolled by referral from clinicians, research registries, and community announcements between June 2020 and March 2024. The in‐person enrollment visit took place at the Department of Physical Therapy—Clinical and Translational Research Center. Participants were followed remotely for 12 months and were compensated for their participation incrementally at all time points. Data presented herein were collected at enrollment.
A total of 300 participants were enrolled in this sub‐cohort. Two hundred and ninety‐eight participants completed biplane radiography testing, usable CT scans were acquired from 295 participants, and tracking of static standing biplane radiographs was possible for 291 participants. This report includes F/E and LB kinematics from a convenience sample of the first 125 individuals for whom data have been processed.
2.2. Data Collection
Participants stood within a custom‐designed dynamic biplane radiography (DBR) system [33]. Participants performed one static standing trial, one static flexed trial, three dynamic F/E motion trials, and three dynamic LB trials. For static flexion and all F/E trials, participants lightly rested their lower sacral/buttocks on a semi‐rigid support positioned perpendicular to the floor to minimize posterior pelvic motion (Figure 1). A bar was positioned at the level of the tibial tuberosities and directly above the tips of their toes. Each subject held a dowel in both hands, with their arms extended away from their hips throughout the entire motion. With arms and knees relaxed and straight, participants bent from their waist to touch the bar and returned to standing to complete one dynamic trial. LB was performed with arms at the sides, maximally bending to the left, returning upright without pause, maximally bending to the right, and returning to upright neutral (Figure 1). Participants were encouraged to slide their hands as far down their thighs as possible to each side. Each movement was performed at a pace sufficient to complete a full movement cycle in approximately 3 s. Data were collected over three repetitions of each movement to provide an accurate estimate of the participant's typical movement pattern while minimizing radiation exposure [34].
FIGURE 1.
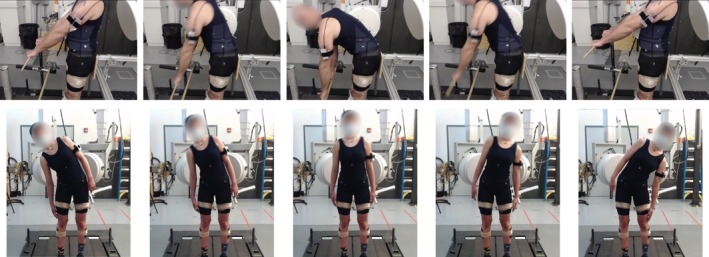
Still pictures of the F/E motion (above) and the LB motion (below). F/E pictures show the biplane radiography system configured to acquire direct sagittal and inclined anterior views. Note the participant holding the wooden dowel as a reminder to keep hands and arms out of the sagittal radiographs, the target bar placed at the height of the tibial tuberosities, and the support positioned behind the sacrum to minimize posterior pelvic motion. The device on the patient's arm controlled a dynamic filter placed on the x‐ray source of the system acquiring sagittal images to minimize overexposure and image washout during flexion. LB pictures show five instances of the motion, from maximum left to maximum right bending, with the biplane radiography system configured to acquire anterior‐oblique views. The participants were instructed to hold their hands at their sides and slide their hands down their legs as far as possible toward the knee while holding the pelvis still.
F/E radiographs were collected from a 20° inclined anterior–posterior (AP) view and a direct lateral view (Figure 1 top). LB was imaged with the two systems set at 0° of inclination and 60° apart for lateral oblique views (Figure 1 bottom). Lumbar spine (L1‐S1) CT scans (GE Discovery CT750 HD, Chicago, IL) were acquired within 2 days of DBR testing (Figure 2C). The CT scanner resolution was approximately 0.3 mm × 0.3 mm with a slice thickness of 0.625 mm. The maximum radiation exposure during static and dynamic biplane radiographic imaging was estimated to be 8.8 mSv using PCXMC software (PCXMC 2.0, STUK, Helsinki, Finland) and the average effective dose from the CT scan was estimated at 9.3 mSv based upon a previous study [34]. These exposures correspond to approximately 17.5% and 18.6%, respectively, of the annual radiation dose of 50 mSv permitted by federal regulations for radiation workers [35].
FIGURE 2.
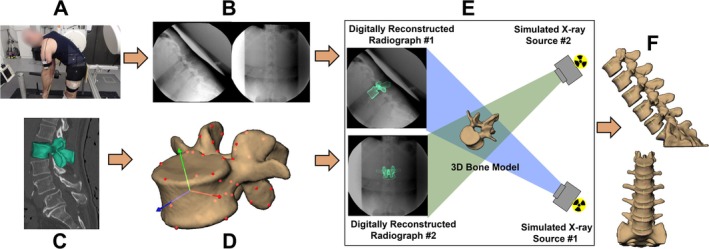
Dynamic biplane radiography data collection and processing. (A) Participants performed F/E and LB motions while (B) synchronized biplane radiographs were collected. (C) CT scans were collected and bone tissue segmented to (D) create 3D bone models. (E) Intervertebral motion was measured using a validated volumetric model‐based tracking process with submillimeter accuracy that matched digitally reconstructed radiographs created from subject‐specific CT‐based bones to biplane radiographs, and (F) six degrees of freedom vertebral kinematics were calculated.
2.3. Data Processing
CT scans were resliced using Mimics software (Materialise, Leuven, Belgium) to generate cubic voxels (average: 0.3 × 0.3 × 0.3 mm). Bone tissue was segmented from the resliced CT volume using automated thresholding and region‐growing algorithms in addition to manual segmentation (Figure 2C). An anatomic coordinate system was generated for each vertebral body based upon landmarks manually placed on the most anterior, left, right, and center posterior edge of each superior and inferior endplate [36]. The coordinate system origin was at the center of each vertebral body from L1 to L5 (Figure 2D). The S1 coordinate system was defined by four points manually placed on the upper endplate of the 3D sacrum bone model, with the origin located at the center of the endplate. Bone motion was tracked using a validated, volumetric model‐based tracking process that matched digitally reconstructed radiographs created from the subject‐specific CT‐based bones to the biplane radiographs (Figure 2E) with an accuracy of 0.5° in rotation and 0.3 mm in translation [7]. Bone kinematics were calculated using bone‐fixed ordered rotations of the cranial bone relative to the caudal bone about the left–right, then anterior–posterior, and then superior–inferior axes for the F/E motion and about the anterior–posterior, then superior–inferior, then left–right axes for the LB motion [37], and filtered using a fourth‐order, zero‐lag Butterworth filter with a 1 Hz cutoff frequency as determined by residual analysis [38]. Three‐dimensional models of the entire lumbar spine were visually inspected to ensure no bone models penetrated adjacent bones after the tracking process (Figure 2F).
2.4. Data Analysis
ROM was calculated based upon the relative motion between anatomic coordinate systems located at the center of each vertebral body (or the top endplate, in the case of S1). ROM was the maximum minus the minimum value for each of the 6 degree‐of‐freedom (DOF) kinematics components for each motion segment over all corresponding trials for a participant (in degrees or millimeters). Means and standard deviations were calculated for the entire group, as well as for men and for women, for participants less than 60 years of age, and for participants 60 or more years of age. We used a cut‐off of 60 years old as a previous systematic review and meta‐analysis has shown that individuals over the age of 60 experience a significantly greater prevalence of chronic low back pain, psychosocial challenges associated with it, and varied pain experiences that warrant a more targeted approach to the management of chronic low back pain [39]. Intervertebral ROM at each motion segment was ranked from highest to lowest for F/E and for LB for every participant to determine how many participants followed the intervertebral ROM rankings of the group mean data.
The contribution of each motion segment to the primary lumbar spine motion (F/E during F/E motion, LB during the LB motion) was calculated as previously described [40, 41]. Briefly, bone kinematics were interpolated at each motion segment at every 1% increment of L1‐S1 F/E (or LB), with peak L1‐S1 extension (or right bending) corresponding to 0% and 100% of the motion, and peak L1‐S1 flexion (or left bending) corresponding to 50% of the motion. The amount of motion at each motion segment (L1‐L2, L2‐L3, etc.) divided by the total L1‐S1 motion over each 1% interval of motion was calculated to represent the contribution of each motion segment to overall lumbar motion (Figure 3). Segmental contributions were averaged across corresponding 1% intervals of motion for all corresponding trials of each participant. Group means and 95% confidence intervals were calculated at each 1% increment of L1‐S1 motion.
FIGURE 3.
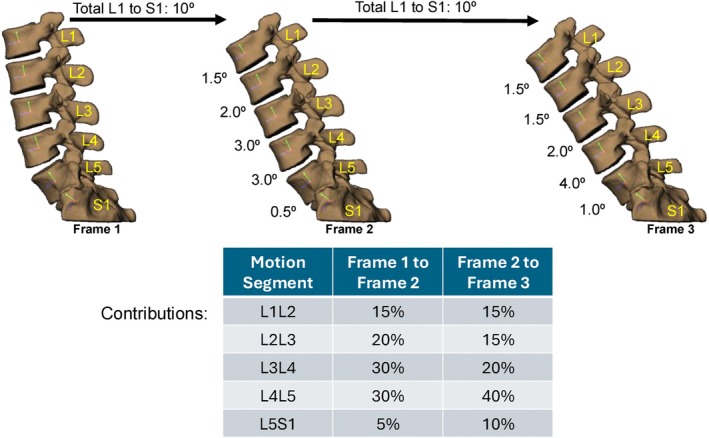
Example calculation of contributions to F/E motion. The intervertebral motion at each motion segment is divided by the total L1‐S1 motion for the interval (10° in this example) to calculate the percent contribution at each motion segment.
The anterior–posterior slip per degree of flexion (SPDF) was evaluated only for the F/E motion. For this calculation, slip at each motion segment was measured as the distance between the anatomic landmark placed on the posterior center of the inferior endplate of the superior vertebra and the landmark placed on the posterior center of the superior endplate of the inferior vertebra for each motion segment in the anterior–posterior direction of the inferior vertebra [7]. This replicates the “anterior–posterior slip” measurement typically obtained clinically on static sagittal F/E radiographs [38]. Anterior–posterior slip was plotted against flexion angle for each motion segment for each F/E movement trial. Data for each F/E motion trial were interpolated at 1° increments of flexion, then averaged across motion trials. The group average SPDF was then calculated for each motion segment at 1° increments of intervertebral flexion. Means and standard deviations were calculated for the entire group, as well as for men, women, individuals less than 60 years of age, and individuals 60 or more years of age.
Trial‐to‐trial repeatability was calculated by interpolating intervertebral kinematics at each 1° increment of L1‐S1 motion, then finding the standard deviation across trials at each 1° increment. The standard deviations were then averaged across the entire L1‐S1 ROM to calculate the repeatability for each participant. These repeatability values for each participant were averaged for the entire group, as well as for men, women, individuals less than 60 years of age, and individuals 60 or more years of age.
Normality was assessed by examining histograms and computing the Shapiro–Wilk test [42] on all group‐level data. If the data were normally distributed (or approximately normal), means and standard deviations were used to characterize the sample. If the data were non‐normal, medians and inter‐quartile ranges were used to characterize the data. For tables where the majority of the data were normal, means and standard deviations were reported.
3. Results
Demographics of the 300 individuals with cLBP who enrolled in motion testing within the biplane radiography system, and for the subset of individuals that have been processed to date, are summarized in Table 1. A total of 308 F/E and 303 LB trials were included in this analysis.
TABLE 1.
Biplane radiography study participant demographics.
| Total enrolled (N = 300) | Participants included in this study (N = 125) | |
|---|---|---|
| Female | 168 (56%) | 72 (58%) |
| Male | 132 (44%) | 53 (42%) |
| < 60 years | 134 (45%) | 66 (53%) |
| ≥ 60 years | 166 (55%) | 59 (47%) |
| BMI (kg/m2) | 27.8 ± 4.0 | 25.7 ± 3.6 |
3.1. Range of Motion
The total intervertebral F/E and anterior–posterior translation ROM during F/E for the overall group, men, women, younger adults, and older adults is summarized in Table 2. For the overall group, the intervertebral F/E ROM progressively increased from the L1‐L2 through the L4‐L5 motion segments, then decreased from L4‐L5 to L5‐S1 (Figure 4A). However, considerable variability was observed among participants (Figure 4B). In fact, only 7 participants (5.6%) followed the pattern of the group mean, with ROM increasing from L1‐L2 through L4‐L5, and L5‐S1 ROM being greater than L1‐L2 and less than L2‐L3 (Figure 4C). Anterior–posterior translation increased from the L1‐L2 through L3‐L4 motion segments, then decreased from L3‐L4 through L5‐S1 (Table 2).
TABLE 2.
Intervertebral flexion/extension and anterior–posterior translation range of motion during flexion/extension.
| L1‐L2 | L2‐L3 | L3‐L4 | L4‐L5 | L5‐S1 | ||||||
|---|---|---|---|---|---|---|---|---|---|---|
| FE (°) | AP (mm) | FE (°) | AP (mm) | FE (°) | AP (mm) | FE (°) | AP (mm) | FE (°) | AP (mm) | |
| Total | 6.8 ± 3.1 | 4.1 ± 1.4 | 8.7 ± 3.8 | 4.4 ± 1.7 | 9.2 ± 4.5 | 4.6 ± 1.7 | 9.7 ± 5.2 | 4.3 ± 1.9 | 8.4 ± 4.9 | 3.3 ± 1.8 |
| Female | 6.9 ± 3.3 | 3.9 ± 1.3 | 8.8 ± 3.9 | 4.4 ± 1.6 | 9.5 ± 4.8 | 4.6 ± 1.7 | 9.7 ± 5.8 | 4.3 ± 2.0 | 8.9 ± 4.7 | 3.5 ± 1.9 |
| Male | 6.7 ± 2.9 | 4.3 ± 1.6 | 8.6 ± 3.7 | 4.4 ± 1.9 | 8.8 ± 4.0 | 4.7 ± 1.8 | 9.8 ± 4.1 | 4.4 ± 1.7 | 7.7 ± 5.2 | 3.0 ± 1.6 |
| < 60 years | 7.1 ± 3.1 | 4.0 ± 1.1 | 10.1 ± 3.6 | 4.8 ± 1.5 | 11.0 ± 4.3 | 5.1 ± 1.5 | 12.4 ± 4.8 | 5.2 ± 1.6 | 9.2 ± 5.4 | 3.4 ± 1.6 |
| > = 60 years | 6.6 ± 3.2 | 4.1 ± 1.7 | 7.3 ± 3.4 | 4.0 ± 1.8 | 7.2 ± 3.8 | 4.1 ± 1.8 | 6.8 ± 3.9 | 3.4 ± 1.6 | 7.5 ± 4.3 | 3.1 ± 2.0 |
Note: Units are degrees (°) and millimeters (mm). Mean values ± one standard deviation are presented.
Abbreviations: AP = anterior–posterior translation; FE = flexion/extension.
FIGURE 4.
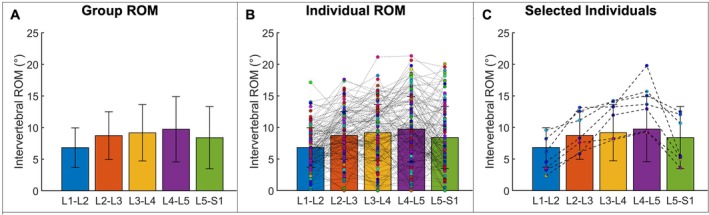
Lumbar spine intervertebral F/E ROM during the F/E motion. (A) Overall group mean ROM at each motion segment. Error bars represent ±1 standard deviation. (B) Group means with the ROM at each motion segment for each study participant superimposed. Each dot represents one study participant, with dashed lines connecting datapoints at successive motion segments. (C) Data from the six study participants who followed the group average ROM pattern.
The total intervertebral LB and left–right translation ROM during LB is summarized in Table 3A, while the coupled axial rotation during LB is shown in Table 3B. For the overall group, the intervertebral LB ROM increased from L1‐L2 to L2‐L3 and then progressively decreased from the L2‐L3 through the L5‐S1 motion segments (Figure 5A). However, considerable variability was observed among participants (Figure 5B). Only 13 participants (10.4%) followed the pattern of the group mean, with ROM increasing from L1‐L2 to L2‐L3 followed by a decrease at each subsequent level (Figure 5C). Lateral translation was largest at the L2‐L3 motion segment and decreased in each successive cranial or caudal motion segment. The average axial rotation (AR) was the highest at L1‐L2 and lowest at the L3‐L4 level. The average AR decreased from L1‐L2 to L3‐L4 and increased from L3‐L4 to L4‐L5 and L5‐S1 (Table 3B).
TABLE 3A.
Intervertebral lateral bending and left–right translation range of motion during lateral bending.
| L1‐L2 | L2‐L3 | L3‐L4 | L4‐L5 | L5‐S1 | ||||||
|---|---|---|---|---|---|---|---|---|---|---|
| LB (°) | LR (mm) | LB (°) | LR (mm) | LB (°) | LR (mm) | LB (°) | LR (mm) | LB (°) | LR (mm) | |
| Total | 8.8 ± 3.2 | 3.4 ± 1.2 | 9.1 ± 4.2 | 3.6 ± 1.5 | 8.4 ± 4.3 | 3.0 ± 1.5 | 5.9 ± 3.9 | 2.3 ± 1.3 | 2.7 ± 1.8 | 1.5 ± 0.9 |
| Female | 9.3 ± 3.5 | 3.6 ± 1.2 | 9.7 ± 4.4 | 3.8 ± 1.6 | 8.9 ± 4.4 | 3.2 ± 1.5 | 6.0 ± 4.1 | 2.2 ± 1.3 | 2.7 ± 1.8 | 1.5 ± 0.8 |
| Male | 8.0 ± 2.8 | 3.2 ± 1.0 | 8.3 ± 3.8 | 3.4 ± 1.3 | 7.7 ± 4.1 | 2.9 ± 1.5 | 5.8 ± 3.7 | 2.4 ± 1.4 | 2.6 ± 1.8 | 1.6 ± 1.0 |
| < 60 years | 10.0 ± 2.9 | 3.5 ± 0.9 | 10.7 ± 4.0 | 3.9 ± 1.3 | 10.0 ± 4.0 | 3.5 ± 1.3 | 7.5 ± 4.0 | 2.8 ± 1.3 | 3.1 ± 1.8 | 1.7 ± 0.9 |
| ≥ 60 years | 7.4 ± 3.0 | 3.4 ± 1.4 | 7.3 ± 3.6 | 3.3 ± 1.6 | 6.6 ± 4.1 | 2.5 ± 1.5 | 4.2 ± 3.0 | 1.7 ± 1.1 | 2.1 ± 1.7 | 1.3 ± 0.8 |
Note: Units are degrees (°) and millimeters (mm). Mean values ± one standard deviation are presented.
Abbreviations: LB = lateral bending; LR = left–right translation.
TABLE 3B.
Coupled intervertebral axial rotation range of motion during lateral bending.
| L1‐L2 | L2‐L3 | L3‐L4 | L4‐L5 | L5‐S1 | |
|---|---|---|---|---|---|
| AR (°) | AR (°) | AR (°) | AR (°) | AR (°) | |
| Total | 2.5 ± 1.7 | 2.3 ± 1.6 | 1.9 ± 1.1 | 2.2 ± 1.0 | 2.1 ± 1.2 |
| Female | 2.5 ± 2.1 | 2.4 ± 1.9 | 1.9 ± 1.0 | 2.2 ± 1.0 | 2.0 ± 1.1 |
| Male | 2.4 ± 1.2 | 2.0 ± 1.0 | 1.9 ± 1.1 | 2.2 ± 1.1 | 2.2 ± 1.4 |
| < 60 years | 2.1 ± 0.9 | 2.0 ± 1.1 | 1.7 ± 0.9 | 2.1 ± 0.8 | 2.2 ± 1.2 |
| ≥ 60 years | 3.2 ± 2.4 | 2.8 ± 2.1 | 2.2 ± 1.2 | 2.4 ± 1.4 | 1.9 ± 1.0 |
Note: Units are degrees (°). Mean values ± one standard deviation are presented.
Abbreviation: AR = axial rotation.
FIGURE 5.
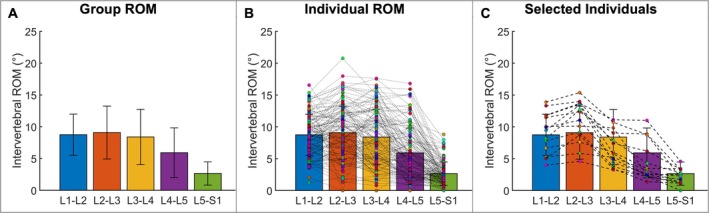
Lumbar spine intervertebral LB ROM during the LB motion. (A) Overall group mean ROM at each motion segment. Error bars represent ±1 standard deviation. (B) Group means with the ROM at each motion segment for each study participant. Each dot represents one study participant, with dashed lines connecting datapoints at successive motion segments. (C) Data from the nine study participants who followed the group average ROM pattern.
3.2. Contributions to Motion
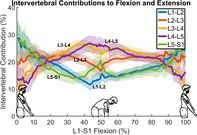
The group average data indicated that the L3‐L4 and L4‐L5 motion segments made their smallest contribution to lumbar spine F/E when the torso was near the neutral position, and they made their largest contribution to lumbar spine F/E when the torso was near peak flexion (Figure 6). In contrast, the L1‐L2 and L5‐S1 motion segments made their largest contribution to lumbar spine F/E when the torso was near the neutral position (Figure 6). The L1‐L2 contribution to lumbar spine motion was smallest near peak flexion; however, the L5‐S1 motion segment contribution to lumbar spine motion was moderate when the torso was near peak flexion (Figure 6). On average, the L2‐L3 motion segment contribution to lumbar spine F/E was steady from the neutral position through the midrange of motion, and less when the torso was near peak flexion (Figure 6).
FIGURE 6.

Intervertebral contributions to lumbar spine F/E. The vertical axis indicates the percent contribution to overall lumbar spine (L1‐S1) motion of each intervertebral motion segment, while the horizontal axis indicates the percent of the movement cycle, with lumbar flexion occurring from 0% to 50% and lumbar extension occurring from 50% to 100%. Group mean values are shown by bold lines, with 95% confidence intervals shown by shaded areas with corresponding colors.
The group average data indicated that the L1‐L2 and L2‐L3 motion segment contributions to lumbar LB oscillated together during the bending motion, reaching their maximum contribution near the upright neutral position and their minimum contribution at peak left and right bending (Figure 7). The average pattern of contribution from L4‐L5 and L5‐S1 mirrored the oscillations of L1‐L2 and L2‐L3, with both motion segments reaching their maximum contribution near the end range of bending and their minimum contributions near the upright neutral position (Figure 7). The average contribution of the L3‐L4 motion segment remained nearly constant throughout bending (Figure 7).
FIGURE 7.
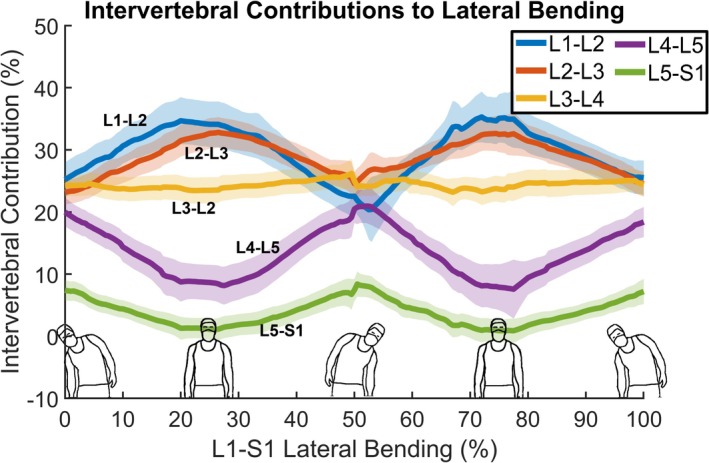
Intervertebral contributions to lumbar spine LB. The vertical axis indicates the percent contribution to overall lumbar spine (L1‐S1) motion of each intervertebral motion segment, while the horizontal axis indicates the percent of the movement cycle, with bending from right to left occurring from 0% to 50% and bending from left to right occurring from 50% to 100%. Group mean values are shown by bold lines, with 95% confidence intervals shown by shaded areas with corresponding colors.
3.3. Vertebral Slip per Degree of Flexion (SPDF) During F/E
The average amount of SPDF was similar in the L1‐L2, L2‐L3, and L3‐L4 motion segments (Table 4). The SPDF at L4‐L5 was less than the more cranial motion segments, while on average, there was little change in L5‐S1 SPDF over the range of flexion. Additionally, the among‐subject variability in L5‐S1 SPDF was two to three times higher than in other motion segments. SPDF was similar in men and women in the L1‐L2, L2‐L3 and L3‐L4 motion segments, however, men generally demonstrated more SPDF than women at L4‐L5 when flexion was 10° or more. At L5‐S1, women tended to demonstrate more posterior translation than men when in extension, while men demonstrated more posterior translation than women at higher amounts of flexion. The effects of age on SPDF became more apparent at higher amounts of intervertebral flexion and extension at L3‐L4, L4‐L5, and L5‐S1, with more SPDF in individuals over 60 years of age compared to individuals under 60 years of age (Table 4).
TABLE 4.
Intervertebral anterior–posterior slip at each degree of intervertebral flexion during flexion/extension.
| Motion segment | Group | Intervertebral flexion/extension (°) | |||||||||
|---|---|---|---|---|---|---|---|---|---|---|---|
| −3 | −2 | −1 | 0 | 1 | 2 | 3 | 4 | 5 | 6 | ||
| L1‐L2 | Total | −0.1 ± 0.8 | 0.0 ± 0.6 | 0.0 ± 0.6 | 0.1 ± 0.6 | 0.2 ± 0.6 | 0.3 ± 0.6 | 0.5 ± 0.6 | 0.7 ± 0.6 | 0.9 ± 0.5 | 1.0 ± 0.7 |
| Female | 0.1 ± 0.2 | 0.1 ± 0.3 | 0.0 ± 0.3 | 0.1 ± 0.4 | 0.2 ± 0.5 | 0.4 ± 0.6 | 0.5 ± 0.6 | 0.6 ± 0.6 | 0.9 ± 0.6 | 1.1 ± 0.8 | |
| Male | −0.4 ± 0.4 | −0.2 ± 0.2 | 0.0 ± 0.4 | 0.1 ± 0.5 | 0.1 ± 0.6 | 0.3 ± 0.5 | 0.6 ± 0.6 | 0.7 ± 0.5 | 0.8 ± 0.5 | 1.0 ± 0.6 | |
| < 60 years | −0.1 ± 0.1 | −0.1 ± 0.1 | 0.0 ± 0.3 | 0.1 ± 0.5 | 0.2 ± 0.5 | 0.3 ± 0.5 | 0.5 ± 0.5 | 0.6 ± 0.5 | 0.8 ± 0.5 | 0.9 ± 0.6 | |
| ≥ 60 years | −0.1 ± 0.4 | 0.0 ± 0.3 | 0.0 ± 0.4 | 0.1 ± 0.5 | 0.1 ± 0.6 | 0.3 ± 0.6 | 0.6 ± 0.7 | 0.7 ± 0.7 | 1.0 ± 0.7 | 1.2 ± 0.9 | |
| L2‐L3 | Total | 0.1 ± 1.0 | 0.0 ± 0.8 | 0.1 ± 0.6 | 0.3 ± 0.6 | 0.4 ± 0.7 | 0.6 ± 0.7 | 0.8 ± 0.7 | 1.0 ± 0.7 | ||
| Female | 0.1 ± 0.5 | 0.1 ± 0.6 | 0.1 ± 0.6 | 0.3 ± 0.7 | 0.5 ± 0.7 | 0.6 ± 0.7 | 0.8 ± 0.8 | 1.0 ± 0.8 | |||
| Male | 0.0 ± 0.3 | −0.1 ± 0.5 | 0.0 ± 0.5 | 0.2 ± 0.5 | 0.4 ± 0.5 | 0.6 ± 0.6 | 0.8 ± 0.5 | 0.9 ± 0.5 | |||
| < 60 years | 0.3 ± 0.5 | 0.1 ± 0.6 | 0.1 ± 0.6 | 0.3 ± 0.7 | 0.5 ± 0.7 | 0.6 ± 0.7 | 0.8 ± 0.7 | 1.0 ± 0.7 | |||
| ≥ 60 years | −0.3 ± 0.4 | −0.2 ± 0.5 | 0.0 ± 0.5 | 0.2 ± 0.5 | 0.4 ± 0.6 | 0.6 ± 0.6 | 0.8 ± 0.7 | 0.9 ± 0.7 | |||
| L3‐L4 | Total | −0.2 ± 0.6 | −0.1 ± 0.6 | 0.1 ± 0.5 | 0.4 ± 0.6 | 0.5 ± 0.5 | 0.7 ± 0.4 | 0.9 ± 0.5 | 1.0 ± 0.5 | ||
| Female | −0.2 ± 0.4 | 0.0 ± 0.4 | 0.2 ± 0.4 | 0.4 ± 0.5 | 0.6 ± 0.5 | 0.8 ± 0.5 | 1.0 ± 0.6 | 1.1 ± 0.7 | |||
| Male | −0.1 ± 0.1 | −0.2 ± 0.4 | −0.1 ± 0.4 | 0.3 ± 0.8 | 0.4 ± 0.5 | 0.6 ± 0.5 | 0.7 ± 0.5 | 1.0 ± 0.5 | |||
| < 60 years | −0.1 ± 0.3 | 0.0 ± 0.4 | 0.1 ± 0.4 | 0.3 ± 0.5 | 0.4 ± 0.5 | 0.6 ± 0.4 | 0.7 ± 0.4 | 0.9 ± 0.5 | |||
| ≥ 60 years | −0.2 ± 0.2 | −0.1 ± 0.5 | 0.2 ± 0.4 | 0.5 ± 0.7 | 0.7 ± 0.5 | 0.9 ± 0.6 | 1.1 ± 0.7 | 1.3 ± 0.8 | |||
| L4‐L5 | Total | −0.3 ± 0.5 | 0.0 ± 0.4 | 0.2 ± 0.5 | 0.3 ± 0.4 | 0.4 ± 0.4 | 0.6 ± 0.5 | 0.7 ± 0.6 | 0.7 ± 0.7 | ||
| Female | −0.3 ± 0.3 | 0.0 ± 0.4 | 0.2 ± 0.4 | 0.3 ± 0.4 | 0.5 ± 0.4 | 0.7 ± 0.5 | 0.8 ± 0.6 | 0.8 ± 0.7 | |||
| Male | −0.4 ± 0.3 | 0.0 ± 0.3 | 0.1 ± 0.3 | 0.2 ± 0.3 | 0.4 ± 0.4 | 0.4 ± 0.5 | 0.5 ± 0.5 | 0.6 ± 0.7 | |||
| < 60 years | −0.4 ± 0.2 | −0.1 ± 0.2 | 0.1 ± 0.2 | 0.2 ± 0.3 | 0.4 ± 0.3 | 0.5 ± 0.5 | 0.6 ± 0.6 | 0.7 ± 0.7 | |||
| ≥ 60 years | −0.3 ± 0.3 | 0.1 ± 0.5 | 0.3 ± 0.5 | 0.4 ± 0.5 | 0.5 ± 0.5 | 0.7 ± 0.5 | 0.7 ± 0.6 | 0.7 ± 0.7 | |||
| L5‐S1 | Total | −2.0 ± 2.1 | −1.7 ± 1.7 | −1.1 ± 2.0 | −1.3 ± 1.6 | −1.3 ± 1.7 | −1.4 ± 1.7 | −1.5 ± 1.7 | −1.6 ± 1.6 | −1.7 ± 1.7 | |
| Female | −2.6 ± 1.4 | −2.2 ± 1.4 | −1.4 ± 1.4 | −1.4 ± 1.6 | −1.3 ± 1.6 | −1.4 ± 1.7 | −1.5 ± 1.7 | −1.6 ± 1.5 | −1.6 ± 1.6 | ||
| Male | −1.0 ± 0.6 | −1.0 ± 0.7 | −0.7 ± 1.6 | −1.2 ± 1.2 | −1.2 ± 1.3 | −1.4 ± 1.4 | −1.6 ± 1.5 | −1.6 ± 1.4 | −1.7 ± 1.4 | ||
| < 60 years | −1.6 ± 0.9 | −1.4 ± 1.0 | −0.9 ± 1.0 | −1.1 ± 1.1 | −1.2 ± 1.1 | −1.4 ± 1.3 | −1.4 ± 1.4 | −1.7 ± 1.4 | −1.7 ± 1.6 | ||
| ≥ 60 years | −2.7 ± 1.5 | −2.3 ± 1.4 | −1.2 ± 2.0 | −1.5 ± 1.7 | −1.3 ± 1.8 | −1.4 ± 1.9 | −1.6 ± 1.9 | −1.5 ± 1.5 | −1.5 ± 1.4 | ||
| Motion segment | Group | Intervertebral flexion/extension (°) | |||||||||
|---|---|---|---|---|---|---|---|---|---|---|---|
| 7 | 8 | 9 | 10 | 11 | 12 | 13 | 14 | 15 | 16 | ||
| L1‐L2 | Total | 1.1 ± 0.6 | 1.3 ± 0.7 | 1.4 ± 0.7 | 1.6 ± 0.8 | 1.7 ± 0.8 | |||||
| Female | 1.1 ± 0.7 | 1.3 ± 0.8 | 1.2 ± 0.6 | 1.6 ± 0.7 | 1.6 ± 0.6 | ||||||
| Male | 1.1 ± 0.7 | 1.4 ± 0.7 | 1.6 ± 0.8 | 1.6 ± 0.6 | 1.9 ± 0.7 | ||||||
| < 60 years | 1.1 ± 0.7 | 1.3 ± 0.8 | 1.5 ± 0.7 | 1.5 ± 0.6 | 1.8 ± 0.7 | ||||||
| ≥ 60 years | 1.0 ± 0.7 | 1.3 ± 0.7 | 1.2 ± 0.6 | 1.6 ± 0.7 | 1.5 ± 0.6 | ||||||
| L2‐L3 | Total | 1.2 ± 0.7 | 1.3 ± 0.6 | 1.4 ± 0.5 | 1.6 ± 0.6 | 1.8 ± 0.6 | 2.1 ± 0.7 | 2.4 ± 0.8 | |||
| Female | 1.2 ± 0.9 | 1.3 ± 0.8 | 1.5 ± 0.9 | 1.6 ± 0.9 | 1.8 ± 0.9 | 2.1 ± 0.9 | 2.4 ± 0.9 | ||||
| Male | 1.1 ± 0.6 | 1.3 ± 0.7 | 1.4 ± 0.8 | 1.7 ± 0.9 | 1.8 ± 0.9 | 2.1 ± 1.0 | 2.3 ± 0.8 | ||||
| < 60 years | 1.1 ± 0.8 | 1.3 ± 0.7 | 1.4 ± 0.8 | 1.6 ± 0.9 | 1.8 ± 1.0 | 2.2 ± 1.1 | 2.3 ± 0.9 | ||||
| ≥ 60 years | 1.2 ± 0.8 | 1.4 ± 0.8 | 1.6 ± 0.8 | 1.7 ± 0.7 | 1.8 ± 0.7 | 2.0 ± 0.7 | 2.6 ± 0.7 | ||||
| L3‐L4 | Total | 1.2 ± 0.5 | 1.4 ± 0.5 | 1.5 ± 0.5 | 1.7 ± 0.5 | 1.9 ± 0.5 | 2.0 ± 0.5 | 2.2 ± 0.5 | 2.4 ± 0.5 | ||
| Female | 1.3 ± 0.7 | 1.4 ± 0.8 | 1.5 ± 0.9 | 1.7 ± 0.9 | 1.9 ± 1.0 | 2.0 ± 1.0 | 2.2 ± 1.0 | 2.4 ± 1.0 | |||
| Male | 1.1 ± 0.6 | 1.3 ± 0.8 | 1.4 ± 0.8 | 1.6 ± 0.9 | 1.9 ± 1.0 | 2.0 ± 1.0 | 2.1 ± 0.7 | 2.5 ± 0.7 | |||
| < 60 years | 1.1 ± 0.6 | 1.3 ± 0.7 | 1.4 ± 0.7 | 1.6 ± 0.8 | 1.8 ± 1.0 | 2.0 ± 1.0 | 2.1 ± 1.0 | 2.4 ± 1.1 | |||
| ≥ 60 years | 1.4 ± 0.8 | 1.6 ± 0.9 | 1.6 ± 0.8 | 1.9 ± 0.9 | 2.1 ± 0.8 | 2.2 ± 0.6 | 2.6 ± 0.5 | 3.6 ± 0.5 | |||
| L4‐L5 | Total | 0.9 ± 0.6 | 1.0 ± 0.7 | 1.1 ± 0.6 | 1.2 ± 0.6 | 1.4 ± 0.7 | 1.5 ± 0.7 | 1.6 ± 0.7 | 1.8 ± 0.8 | 1.8 ± 0.7 | 2.0 ± 0.7 |
| Female | 0.9 ± 0.7 | 1.1 ± 0.7 | 1.1 ± 0.7 | 1.2 ± 0.7 | 1.2 ± 0.7 | 1.4 ± 0.8 | 1.6 ± 0.8 | 1.6 ± 0.9 | 1.6 ± 0.8 | 1.7 ± 0.7 | |
| Male | 0.8 ± 0.6 | 0.9 ± 0.7 | 1.0 ± 0.7 | 1.3 ± 0.8 | 1.6 ± 0.9 | 1.7 ± 0.9 | 1.7 ± 0.8 | 2.1 ± 0.8 | 2.6 ± 0.7 | 2.8 ± 0.8 | |
| < 60 years | 0.9 ± 0.6 | 1.0 ± 0.7 | 1.0 ± 0.6 | 1.2 ± 0.7 | 1.3 ± 0.8 | 1.5 ± 0.9 | 1.6 ± 0.9 | 1.7 ± 1.0 | 1.8 ± 0.9 | 2.0 ± 0.9 | |
| ≥ 60 years | 0.9 ± 0.6 | 1.0 ± 0.7 | 1.1 ± 0.7 | 1.5 ± 0.7 | 2.0 ± 0.6 | 2.0 ± 0.6 | 2.1 ± 0.4 | 2.2 ± 0.4 | 2.3 ± 0.4 | 2.4 ± 0.5 | |
| L5‐S1 | Total | −1.8 ± 1.5 | −1.8 ± 1.6 | −1.8 ± 1.6 | −1.6 ± 1.6 | −1.5 ± 1.7 | −1.5 ± 1.8 | −1.6 ± 2.1 | −1.5 ± 2.3 | −1.8 ± 2.4 | |
| Female | −1.7 ± 1.4 | −1.7 ± 1.3 | −1.6 ± 1.2 | −1.5 ± 1.2 | −1.3 ± 1.0 | −1.4 ± 1.0 | −1.4 ± 1.0 | −1.3 ± 0.9 | −1.7 ± 0.8 | ||
| Male | −2.0 ± 1.5 | −2.0 ± 1.5 | −2.1 ± 1.6 | −1.8 ± 1.3 | −1.8 ± 1.3 | −1.7 ± 1.3 | −1.8 ± 1.3 | −1.8 ± 1.3 | −1.9 ± 1.2 | ||
| < 60 years | −1.9 ± 1.4 | −1.9 ± 1.5 | −1.9 ± 1.5 | −1.8 ± 1.4 | −1.6 ± 1.4 | −1.7 ± 1.3 | −1.8 ± 1.3 | −1.9 ± 1.3 | −2.0 ± 1.3 | ||
| ≥ 60 years | −1.7 ± 1.4 | −1.6 ± 1.2 | −1.6 ± 1.2 | −1.1 ± 0.9 | −1.1 ± 0.8 | −1.1 ± 0.8 | −1.2 ± 0.8 | −0.4 ± 0.5 | −1.0 ± 0.3 | ||
Note: Mean values ± one standard deviation are presented at 1° increments of intervertebral flexion (positive) and extension (negative) for FE angles that were achieved by at least 10% of the study participants. All data have been normalized to the intervertebral orientations during static upright standing.
3.4. Trial‐to‐Trial Repeatability
The average within‐subject standard deviation in intervertebral F/E at corresponding angles of L1‐S1 F/E ranged from 0.4° to 0.7°. The average within‐subject standard deviation in intervertebral LB at corresponding angles of L1‐S1 LB ranged from 0.3° to 0.6° (Table 5). Repeatability was consistent between men and women and between younger and older individuals.
TABLE 5.
Trial‐to‐trial repeatability in intervertebral sagittal plane rotation during flexion/extension (F/E) and coronal plane rotation during lateral bending (LB).
| L1/L2 | L2/L3 | L3/L4 | L4/L5 | L5/S1 | ||||||
|---|---|---|---|---|---|---|---|---|---|---|
| F/E (°) | LB (°) | F/E (°) | LB (°) | F/E (°) | LB (°) | F/E (°) | LB (°) | F/E (°) | LB (°) | |
| Total | 0.5 ± 0.5 | 0.5 ± 0.5 | 0.4 ± 0.3 | 0.4 ± 0.3 | 0.4 ± 0.3 | 0.3 ± 0.2 | 0.6 ± 0.5 | 0.4 ± 0.3 | 0.6 ± 0.5 | 0.3 ± 0.3 |
| Female | 0.6 ± 0.5 | 0.6 ± 0.6 | 0.4 ± 0.3 | 0.4 ± 0.3 | 0.4 ± 0.3 | 0.3 ± 0.1 | 0.6 ± 0.6 | 0.4 ± 0.3 | 0.7 ± 0.6 | 0.3 ± 0.3 |
| Male | 0.5 ± 0.6 | 0.5 ± 0.3 | 0.4 ± 0.3 | 0.3 ± 0.3 | 0.3 ± 0.3 | 0.3 ± 0.3 | 0.5 ± 0.5 | 0.5 ± 0.3 | 0.5 ± 0.4 | 0.3 ± 0.2 |
| < 60 years | 0.6 ± 0.5 | 0.5 ± 0.3 | 0.5 ± 0.3 | 0.3 ± 0.2 | 0.4 ± 0.3 | 0.3 ± 0.1 | 0.6 ± 0.5 | 0.5 ± 0.3 | 0.7 ± 0.5 | 0.4 ± 0.2 |
| ≥ 60 years | 0.5 ± 0.6 | 0.5 ± 0.7 | 0.3 ± 0.3 | 0.4 ± 0.5 | 0.4 ± 0.3 | 0.3 ± 0.3 | 0.5 ± 0.5 | 0.3 ± 0.2 | 0.6 ± 0.6 | 0.3 ± 0.3 |
Note: Mean values ± one standard deviation are presented.
4. Discussion
The purpose of this study was to provide a quantitative description of intervertebral motion in the lumbar spine during F/E and LB in individuals with cLBP. The intervertebral F/E ROM in our cohort of individuals with cLBP was within 0.5° of the ROM values previously reported in 127 asymptomatic controls [41] at L2‐L3 (9.5°), L3‐4 (10.6°) and L4‐L5 (10.4°); however, the previously reported ROM at L5‐S1 was only 5.7° in comparison to 8.9° in the current study. Dvorak reported intervertebral F/E ROM values in 41 healthy adults that are greater than our reported values at every motion segment [43]: L1‐L2: 11.9°, L2‐L3: 14.5°, L3‐L4: 15.3°, L4‐L5: 18.2°, L5‐S1: 17.0°. These differences are likely due to their F/E protocol in which additional range of motion was achieved by an examiner applying flexing or extending force on the subjects' shoulders at full flexion and extension. In a group of 94 individuals with back pain and normal intervertebral discs, Lee et al. reported F/E ROM results similar to ours at L1‐L2: 7°, L2‐L3: 9.2°, and L3‐L4: 9.5°, but somewhat less than ours at L4‐L5: 9.3° and L5‐S1: 6.3°. They also reported no differences in intervertebral ROM between their back pain group and 168 individuals with disc degeneration at L4‐L5 and/or L5‐S1 [44]. Finally, Staub et al. reported intervertebral rotation ROM values during seated flexion and extension in 94 non‐degenerated spines that were 3° to 4° greater at every motion segment than those found in our study [45]. Representative values of F/E ROM, based on a comprehensive summary of in vivo and in vitro testing, have been reported as follows: L1‐L2: 12°, L2‐L3: 14°, L3‐L4: 15°, L4‐L5: 16°, L5‐S1: 17° [5, 46]. Differences between these values, which were based largely on in vitro data, and our values may be due to differences in loading conditions, pain, and limits placed on end‐range flexion in our study.
Any discrepancies among these studies reporting intervertebral rotation ROM should carefully consider the impact of differences in data collection, measurement techniques, cohort demographics, and participant symptoms. In particular, the overall trunk motion is likely to affect not only the total F/E ROM at each motion segment, but also the proportion of total lumbar motion that occurs at each motion segment. As shown in this study, the caudal motion segments contribute more to lumbar motion as the trunk flexes (Figure 6), so it is not surprising that studies that allowed (or induced) greater overall trunk flexion (e.g., Dvorak et al.) [43] report disproportionately greater motion in the L4‐L5 and L5‐S1 motion segments compared to studies that limited trunk flexion. Finally, these studies and others [47] that included relatively large cohorts of healthy controls or symptomatic patients noted the high among‐subject variability in intervertebral F/E ROM. This makes it unlikely that the single measure of intervertebral F/E ROM can serve as a reliable metric to identify abnormal lumbar spine kinematics.
As for anterior–posterior translation ROM during F/E, Staub et al. reported the intervertebral translation ROM increased in each successive motion segment from L1‐L2 (1.87 mm) to L4‐L5 (2.75 mm) and was smallest at L5‐S1 (0.52 mm) [45]. It is important to note that they measured translation from the inferior‐posterior corner of the superior vertebra to the superior‐posterior corner of the inferior vertebra on sagittal radiographs (similar to our slip measurements), unlike the current study that reported translation of the center of the superior vertebral body relative to the center of the inferior vertebral body.
We are aware of only three previous studies that reported the intervertebral ROM of the lumbar spine during LB [27, 43, 48]. Pearcy et al. reported mean segmental ROM of 10°, 11°, 10°, 6°, and 3° at L1‐L2, L2‐L3, L3‐L4, L4‐L5, and L5‐S1, respectively, in 10 healthy young adult men [48]. Dvorak et al. reported mean segmental range of motion of 10.2°, 12.4°, 12.4°, 9.5°, and 5.1° at L1‐L2, L2‐L3, L3‐L4, L4‐L5, and L5‐S1, respectively, in 41 healthy adults [43]. Both of those studies manually marked vertebral landmarks on static end range of motion biplanar radiographs. Li et al. used a 3D to 2D registration technique to measure LB ROM of 2.9° at L2‐L3, 3.4° at L3‐L4, and 4.7° at L4‐L5 in 11 asymptomatic older adults [27]. Pearcy et al. and Dvorak et al. reported ROM similar to those recorded in our study, in terms of the amount of motion at each motion segment and which motion segments experienced more or less motion during LB. The results of Li et al. are contrary to other reports, with ROM values much less overall and greatest in the more caudal motion segment. These discrepancies may be due to differences in the way the movement was performed (hands on head) and the limited trunk flexion allowed during imaging. A common finding of all previous studies and the present study is wide variation among participants in intervertebral ROM during trunk LB. Representative values of intervertebral ROM during LB, based primarily on in vitro testing, are as follows: L1‐L2: 12°, L2‐L3: 12°, L3‐L4: 16°, L4‐L5: 12°, L5‐S1: 6° [3, 46]. Again, differences between these values, which were based largely on in vitro data, and in vivo data may be partly attributed to different loading conditions and the effects of pain on movement.
The variability in group mean ROM and the number of participants that follow the group mean pattern of ROM is highlighted in this work to provide much‐needed data on the inter‐subject variability in intervertebral ROM of the lumbar spine. The relatively small sample sizes of many previous studies, especially those focused on LB, made it difficult to appreciate the inter‐subject variability. However, previous large studies of asymptomatic volunteers [41, 45] reported generally less variability in intervertebral ROM during FE at L1‐L2 through L4‐L5 (between 2.6° and 3.9°), but higher variability at L5‐S1 (approximately 5.5°) compared to the present study of individuals with cLBP. Unfortunately, those studies did not report how many controls followed the group mean pattern of highest to lowest intervertebral ROM in the lumbar spine. Variations in ROM could be key to differentiating among individuals to improve identification of aberrant motion patterns and guide treatment pathways to address excessive stiffness or instability in specific motion segments. Additionally, some researchers impose group mean intervertebral kinematics on their computer models to estimate muscle forces or intervertebral disc stress for a specific individual [43, 49]. This study demonstrates that few individuals follow the group mean pattern in terms of quantity of intervertebral motion. It is likely that estimates of muscle forces and tissue stresses can be improved by accounting for subject‐specific intervertebral kinematics.
Given the high among‐subject variability in ROM, other metrics, such as the contribution of each motion segment to overall lumbar motion, have been proposed to classify patients into groups or to identify aberrant lumbar motion. Two previous studies examined the intervertebral contributions to F/E in asymptomatic (non‐LBP) individuals using continuous motion analyses [41, 50]. First, it is somewhat difficult to directly compare our results to Breen et al. because that study did not compute any contribution from the L1‐L2 motion segment to lumbar motion. In general, Breen et al. found the L2‐L3 motion segment contributed most when the body was near the upright neutral position and the L2‐L3 contribution was less near peak flexion (similar to the present study); the L3‐L4 motion segment contribution was relatively consistent throughout flexion and extension (contrary to the present study finding of less L3‐L4 contribution near the neutral position and more L3‐L4 contribution near peak trunk flexion); the L4‐L5 contributions were greatest near full flexion (similar to the present study); and L5‐S1 contributions also were greatest near full flexion (contrary to the present study where L5‐S1 contributions were greatest near the upright neutral position). The most striking difference between the intervertebral contributions to motion reported in this study and those reported in the Breen study is that, in the current study, the contribution patterns during flexion are reversed during extension, suggesting motion segment contributions to lumbar spine F/E are dependent upon the angle of trunk flexion, not the direction of movement. In the Breen study, the contributions during extension were not a mirror of the pattern during flexion, and the motion segments that made the largest contributions during flexion (L2‐L3 and L3‐L4) made smaller contributions than L4‐L5 during extension. A second study, by Wong et al., reported intervertebral flexion angles at 5° increments of L1‐S1 lumbar flexion, up to 40° of total lumbar spine flexion [50]. Their results are contrary to the present study and to Breen et al. [41], and appear to show that each motion segment's contribution to motion was constant throughout flexion, with the contribution due to L1/L2 always the largest and the contribution to L5/S1 always the smallest. Differences between our study and these results may be attributable to differences in patient demographics and symptoms, the ways in which participant motion was restricted, and the accuracy of the measurement systems.
The most interesting findings related to intervertebral contributions to LB were that the contributions from L1‐L2 and L2‐L3 oscillate in unison, reaching maximums near the neutral position and minimums near the end range positions, while the caudal L4‐L5 and L5‐S1 motion segments also oscillate in unison, achieving maximum contributions near the end range of LB and minimum contributions near the neutral position. This contrasts with the F/E motion, where the L3‐L4 and L4‐L5 motion segment contributions oscillate in unison and the upper L1‐L2 and lower L5‐S1 motion segment contributions oscillate in unison. These results suggest the coupling of motion between motion segments during F/E differs from the coupling that occurs during LB. To the best of our knowledge, no previous studies measured the intervertebral contributions to LB using continuous motion analysis. There remains a need to characterize intervertebral contributions to lumbar LB motion in asymptomatic adults so that aberrant motion may be more easily identified in individuals with cLBP.
Intervertebral SPDF has been proposed as a metric for diagnosing lumbar instability and for guiding surgical decisions (decompression alone or decompression plus fusion) for patients with degenerative spondylolisthesis [29]. Based on group average translations and F/E from static end ROM F/E radiographs, Staub et al. reported the SPDF was 0.17 mm/° at L1‐L2, 0.19 mm/° at L2‐L3, 0.21 mm/° at L3‐L4, 0.19 mm/° at L4‐L5, and 0.04 mm/° at L5‐S1 in 94 non‐degenerated motion segments [45]. Additionally, Weiler et al. reported that the translation‐to‐flexion ratio was significantly higher in patients with degenerative disc disease, but not in those with idiopathic LBP, compared to asymptomatic individuals [31]. Together, these findings suggest that the SPDF is relatively consistent among motion segments from L1‐L2 through L4‐L5, but the magnitude is much less at L5‐S1, and SPDF may be a useful metric for discriminating between patients with degenerative disc disease and healthy controls. Contrary to those previous studies, we chose to calculate SPDF at 1° increments of intervertebral F/E because we had access to continuous kinematics (not just end‐range) data and because the maximum ROM at each motion segment differs among individuals, which will affect the SPDF if the relationship between slip and flexion is non‐linear. Our results agree with the previous studies showing the SPDF is similar in the L1‐L2, L2‐L3, and L3‐L4 motion segments and much lower in L5‐S1; however, in contrast to previous studies, we found the SPDF at L4‐L5 is generally less than in the more cranial motion segments. Although previous studies suggest this measurement may have the potential to change the surgical approach for patients with degenerative spondylolisthesis [29], more data are needed to determine if this measurement has predictive value for treatment outcomes. Our data suggest that sex may not affect SPDF; however, SPDF at the L3‐L4 and L4‐L5 motion segments may increase with age.
There is inherent variation in human movement, even within the same individual performing the same task multiple times [51, 52]. Variability in movement may be clinically important because overly rigid movements or unstable movements may overload joint tissues and lead to joint degeneration [32]. Several studies have reported spinal movement variability using conventional motion capture [51], and one study showed neuromuscular training may modify spinal movement variability [53]. However, we are only aware of one study where intervertebral kinematics repeatability was calculated from radiographic imaging [34]. In that study, lumbar spine kinematics repeatability over 10 repetitions of F/E or LB ranged from 0.3° to 0.8°, which is similar to the average repeatability of 0.7° or less at all motion segments measured in this study. However, in this study, the standard deviation of the mean values was often as large as the group average value, indicating variation among participants. It is important to remember that this study was performed in a controlled laboratory and therefore the results likely represent optimal conditions for minimizing movement variability.
Prior studies have found varying degrees of association between spine movement and pain or disability. A systematic review by Nzamba et al. [9] has shown that there is a significant but small association between the amplitude of movement and disability or pain intensity. They showed a direct association between an increase in amplitude of movement and a decrease in pain intensity or disability, supporting interventions aiming to reduce protective spinal movements in patients with low back pain. Wernli et al. [8] conducted a systematic review of the volitional spine movement and changes in pain or activity limitation at the individual level in patients with cLBP and found that there was low‐quality evidence of a relationship between change in movement and change in pain or activity limitation at the individual level 31% of the time. However, increases in spinal range of motion, velocity, and flexion relaxation of the back extensors were consistently related to improved pain or activity limitation. Such inconsistencies in clinical observation may stem from heterogeneous movement strategies among cLBP patients who adopt individualized motion patterns, making group‐level analyses unreliable without segmental analyses [18].
This study comprehensively characterized dynamic lumbar spine kinematics during active F/E and LB under physiologic loading in individuals with cLBP. The primary findings were that only a small percentage of individuals follow the group mean pattern for largest to smallest intervertebral ROM during F/E and LB. Lumbar F/E is dominated by the L1‐L2 and L5‐S1 motion segments near the upright neutral position, while motion at the L3‐L4 and L4‐L5 motion segments dominates near peak flexion. In contrast, the L1‐L2 and L2‐L3 motion segments are the primary contributors to lateral bending for most of the movement; however, the L4‐L5 and L5‐S1 motion segments make their maximum contributions near the end range of bending. SPDF was similar in the L1‐L2, L2‐L3, and L3‐L4 motion segments, but less in the L4‐L5 motion segment. L5‐S1 SPDF was characterized by high variability among individuals in comparison to other motion segments. The effects of age on SPDF at L3‐L4, L4‐L5, and L5‐S1 became more apparent at higher amounts of intervertebral flexion and extension. Intervertebral kinematics during F/E and LB were very repeatable in this cohort and under the specified testing conditions. Additional research is needed to identify the kinematics characteristics that differentiate between healthy asymptomatic individuals and patients with cLBP so that mechanistic links between kinematics and cLBP can be identified. Additionally, research is needed to identify which kinematics characteristics can be used to assign cLBP patients into subgroups of patients who are most likely to respond to specific treatment approaches (e.g., a stabilization program). Finally, due to the time, cost, limited availability, and radiation exposure associated with the current state of the art in DBR, there is a need to identify low‐cost and widely available tests, such as functional exams or conventional static imaging, that correlate with the dynamic intervertebral kinematics that are associated with cLBP.
This study was a part of a larger study focusing on characterizing chronic low back patients. As part of the biomechanical domain of the study, this analysis focused exclusively on characterizing intervertebral kinematics. As such, one limitation of this study is that we did not yet explore the effects of disc degeneration, bony osteophytes, and pain severity on intervertebral kinematics. Similarly, this study is limited to the kinematics of individuals who reported cLBP, and similar kinematics for asymptomatic individuals are not available for all of the kinematic outcomes reported, especially during the lateral bending movement. Future studies will aim to explore differences between asymptomatic controls and individuals with cLBP, as well as associations between biomechanical, biological, and behavioral data collected in other domains in an effort to provide a comprehensive phenotyping of individuals with chronic low back pain.
Conflicts of Interest
The authors declare no conflicts of interest.
Acknowledgments
The Back Pain Consortium Research Program is administered by the National Institute of Arthritis and Musculoskeletal and Skin Diseases. This research was supported by the National Institutes of Health through the NIH HEAL Initiative under award number U19AR076725‐01. The content is solely the responsibility of the authors and does not necessarily represent the official views of the National Institutes of Health or its NIH HEAL Initiative.
Funding: This work was supported by National Institutes of Health, U19AR076725‐01.
References
- 1. Vo N. and Sowa G., “Supplement Introduction,” JOR Spine (2025). [Google Scholar]
- 2. Vo N. V., Piva S. R., Patterson C. G., et al., “Toward the Identification of Distinct Phenotypes: Research Protocol for the Low Back Pain Biological, Biomechanical, and Behavioral (LB3P) Cohort Study and the BACPAC Mechanistic Research Center at the University of Pittsburgh,” Pain Medicine 24, no. Suppl 1 (2023): S36–S47, 10.1093/pm/pnad009. [DOI] [PMC free article] [PubMed] [Google Scholar]
- 3. Deyo R. A., Dworkin S. F., Amtmann D., et al., “Report of the NIH Task Force on Research Standards for Chronic Low Back Pain,” Journal of Pain 15, no. 6 (2014): 569–585. [DOI] [PMC free article] [PubMed] [Google Scholar]
- 4. Baker S. A., Billmire D. A., Bilodeau R. A., et al., “Wearable Nanocomposite Sensor System for Motion Phenotyping Chronic Low Back Pain: A BACPAC Technology Research Site,” Pain Medicine 24, no. Suppl 1 (2023): S160–S174, 10.1093/pm/pnad017. [DOI] [PMC free article] [PubMed] [Google Scholar]
- 5. Mousavi S. J., Tromp R., Swann M. C., White A. P., and Anderson D. E., “Between‐Session Reliability of Opto‐Electronic Motion Capture in Measuring Sagittal Posture and 3‐D Ranges of Motion of the Thoracolumbar Spine,” Journal of Biomechanics 79 (2018): 248–252. [DOI] [PMC free article] [PubMed] [Google Scholar]
- 6. Quirk D. A., Johnson M. E., Anderson D. E., et al., “Biomechanical Phenotyping of Chronic Low Back Pain: Protocol for BACPAC,” Pain Medicine 24, no. Suppl 1 (2023): S48–S60, 10.1093/pm/pnac163. [DOI] [PMC free article] [PubMed] [Google Scholar]
- 7. Dombrowski M. E., Rynearson B., LeVasseur C., et al., “ISSLS PRIZE IN BIOENGINEERING SCIENCE 2018: Dynamic Imaging of Degenerative Spondylolisthesis Reveals Mid‐Range Dynamic Lumbar Instability Not Evident on Static Clinical Radiographs,” European Spine Journal 27, no. 4 (2018): 752–762. [DOI] [PMC free article] [PubMed] [Google Scholar]
- 8. Wernli K., Tan J. S., O'Sullivan P., Smith A., Campbell A., and Kent P., “Does Movement Change When Low Back Pain Changes? A Systematic Review,” Journal of Orthopaedic and Sports Physical Therapy 50, no. 12 (2020): 664–670, 10.2519/jospt.2020.9635. [DOI] [PubMed] [Google Scholar]
- 9. Nzamba J., Van Damme S., Favre J., and Christe G., “The Relationships Between Spinal Amplitude of Movement, Pain and Disability in Low Back Pain: A Systematic Review and Meta‐Analysis,” European Journal of Pain 28, no. 1 (2024): 37–53, 10.1002/ejp.2162. [DOI] [PubMed] [Google Scholar]
- 10. Breen A. and Breen A., “Uneven Intervertebral Motion Sharing Is Related to Disc Degeneration and Is Greater in Patients With Chronic, Non‐Specific Low Back Pain: An In Vivo, Cross‐Sectional Cohort Comparison of Intervertebral Dynamics Using Quantitative Fluoroscopy,” European Spine Journal 27, no. 1 (2018): 145–153. [DOI] [PubMed] [Google Scholar]
- 11. Okawa A., Shinomiya K., Komori H., Muneta T., Arai Y., and Nakai O., “Dynamic Motion Study of the Whole Lumbar Spine by Videofluoroscopy,” Spine 23, no. 16 (1998): 1743–1749. [DOI] [PubMed] [Google Scholar]
- 12. Takayanagi K., Takahashi K., Yamagata M., Moriya H., Kitahara H., and Tamaki T., “Using Cineradiography for Continuous Dynamic‐Motion Analysis of the Lumbar Spine,” Spine 26, no. 17 (2001): 1858–1865. [DOI] [PubMed] [Google Scholar]
- 13. Teyhen D. S., Flynn T. W., Childs J. D., et al., “Fluoroscopic Video to Identify Aberrant Lumbar Motion,” Spine (Phila Pa 1976) 32, no. 7 (2007): E220–E229. [DOI] [PubMed] [Google Scholar]
- 14. Harlick J. C., Milosavljevic S., and Milburn P. D., “Palpation Identification of Spinous Processes in the Lumbar Spine,” Manual Therapy 12, no. 1 (2007): 56–62. [DOI] [PubMed] [Google Scholar]
- 15. Johnson M. E., LeVasseur C., Gale T., et al., “Lumbar Spine Marker Placement Errors and Soft Tissue Artifact During Dynamic Flexion/Extension and Lateral Bending in Individuals With Chronic Low Back Pain,” Journal of Biomechanics 176 (2024): 112356. [DOI] [PubMed] [Google Scholar]
- 16. Xi X., Ling Z., Wang C., et al., “Lumbar Segment‐Dependent Soft Tissue Artifacts of Skin Markers During In Vivo Weight‐Bearing Forward‐Backward Bending,” Frontiers in Bioengineering and Biotechnology 10 (2022): 960063. [DOI] [PMC free article] [PubMed] [Google Scholar]
- 17. Zemp R., List R., Gulay T., et al., “Soft Tissue Artefacts of the Human Back: Comparison of the Sagittal Curvature of the Spine Measured Using Skin Markers and an Open Upright MRI,” PLoS One 9, no. 4 (2014): e95426. [DOI] [PMC free article] [PubMed] [Google Scholar]
- 18. Christe G., Aussems C., Jolles B. M., and Favre J., “Patients With Chronic Low Back Pain Have an Individual Movement Signature: A Comparison of Angular Amplitude, Angular Velocity and Muscle Activity Across v Multiple Functional Tasks,” Frontiers in Bioengineering and Biotechnology 9 (2021): 767974, 10.3389/fbioe.2021.767974. [DOI] [PMC free article] [PubMed] [Google Scholar]
- 19. Fukushima J., Kaneoka K., Ito Y., et al., “Reference Values of Lumbar Spine Range of Motion by Sex and Age Based on the Assessment of Supine Trunk Lateral Bending‐A Preliminary Study,” Journal of Physical Therapy Science 35, no. 12 (2023): 1006–1013, 10.1589/jpts.35.1006. [DOI] [PMC free article] [PubMed] [Google Scholar]
- 20. Cook D. J., Yeager M. S., and Cheng B. C., “Range of Motion of the Intact Lumbar Segment: A Multivariate Study of 42 Lumbar Spines,” International Journal of Spine Surgery 9 (2015): 5, 10.14444/2005. [DOI] [PMC free article] [PubMed] [Google Scholar]
- 21. Hu B. and Ning X., “Changes of Lumbar Posture and Tissue Loading During Static Trunk Bending,” Journal of Biomechanics 58 (2017): 89–96, 10.1016/j.jbiomech.2017.04.006. [DOI] [PMC free article] [PubMed] [Google Scholar]
- 22. Funabashi M., Kawchuk G. N., Vette A. H., Goldsmith P., and Prasad N., “Tissue Loading Created During Spinal Manipulation in Comparison to Loading Created by Passive Spinal Movements,” Scientific Reports 6 (2016): 38107, 10.1038/srep38107. [DOI] [PMC free article] [PubMed] [Google Scholar]
- 23. Bible J. E., Biswas D., Miller C. P., Whang P. G., and Grauer J. N., “Normal Functional Range of Motion of the Lumbar Spine During 15 Activities of Daily Living,” Journal of Spinal Disorders & Techniques 23, no. 2 (2010): 106–112. [DOI] [PubMed] [Google Scholar]
- 24. Rohlmann A., Pohl D., Bender A., et al., “Activities of Everyday Life With High Spinal Loads,” PLoS One 9, no. 5 (2014): e98510. [DOI] [PMC free article] [PubMed] [Google Scholar]
- 25. Knuttson F., “The Instability Associated With Disk Degeneration in the Lumbar Spine,” Acta Radiologica 25, no. 5–6 (1944): 593–609, 10.3109/00016924409136488. [DOI] [Google Scholar]
- 26. Leone A., Guglielmi G., Cassar‐Pullicino V. N., and Bonomo L., “Lumbar Intervertebral Instability: A Review,” Radiology 245, no. 1 (2007): 62–77. [DOI] [PubMed] [Google Scholar]
- 27. Li G., Wang S., Passias P., Xia Q., Li G., and Wood K., “Segmental In Vivo Vertebral Motion During Functional Human Lumbar Spine Activities,” European Spine Journal 18, no. 7 (2009): 1013–1021. [DOI] [PMC free article] [PubMed] [Google Scholar]
- 28. Pitkanen M. and Manninen H., “Sidebending Versus Flexion‐Extension Radiographs in Lumbar Spinal Instability,” Clinical Radiology 49, no. 2 (1994): 109–114. [DOI] [PubMed] [Google Scholar]
- 29. Reijmer J. F. H., de Jong L. D., Kempen D. H. R., Arts M. P., and van Susante J. L. C., “Clinical Utility of an Intervertebral Motion Metric for Deciding on the Addition of Instrumented Fusion in Degenerative Spondylolisthesis,” Spine (Phila Pa 1976) 49, no. 21 (2024): E355–E360. [DOI] [PMC free article] [PubMed] [Google Scholar]
- 30. Bogduk N., Amevo B., and Pearcy M., “A Biological Basis for Instantaneous Centres of Rotation of the Vertebral Column,” Proceedings of the Institution of Mechanical Engineers. Part H 209, no. 3 (1995): 177–183. [DOI] [PubMed] [Google Scholar]
- 31. Weiler P. J., King G. J., and Gertzbein S. D., “Analysis of Sagittal Plane Instability of the Lumbar Spine In Vivo,” Spine (Phila Pa 1976) 15, no. 12 (1990): 1300–1306. [DOI] [PubMed] [Google Scholar]
- 32. Stergiou N. and Decker L. M., “Human Movement Variability, Nonlinear Dynamics, and Pathology: Is There a Connection?,” Human Movement Science 30, no. 5 (2011): 869–888. [DOI] [PMC free article] [PubMed] [Google Scholar]
- 33. Tashman S., Princehorn J., Pennatto S., et al., “Bi‐Plane X‐Ray Imaging System,” 2010, US Patent 7,806,589.
- 34. Aiyangar A., Gale T., Magherhi S., and Anderst W., “How Many Trials Are Needed to Estimate Typical Lumbar Movement Patterns During Dynamic X‐Ray Imaging?,” Journal of Biomechanical Engineering 145, no. 7 (2023): 074503, 10.1115/1.4062117. [DOI] [PubMed] [Google Scholar]
- 35.“Code of Federal Regulations, Standards for Protection Against Radiation, in 56 FR 23396,” 1991.
- 36. Aiyangar A. K., Zheng L., Tashman S., Anderst W. J., and Zhang X., “Capturing Three‐Dimensional In Vivo Lumbar Intervertebral Joint Kinematics Using Dynamic Stereo‐X‐Ray Imaging,” Journal of Biomechanical Engineering 136, no. 1 (2014): 011004. [DOI] [PubMed] [Google Scholar]
- 37. Anderst W. J. and Aucie Y., “Three‐Dimensional Intervertebral Range of Motion in the Cervical Spine: Does the Method of Calculation Matter?,” Medical Engineering & Physics 41 (2017): 109–115. [DOI] [PubMed] [Google Scholar]
- 38. Winter D. A., Biomechanics and Motor Control of Human Movement, 4th ed. (Wiley, 2009). [Google Scholar]
- 39. Wong C. K. W., Mak R. Y. W., Kwok T. S. Y., et al., “Prevalence, Incidence, and Factors Associated With Non‐Specific Chronic Low Back Pain in Community‐Dwelling Older Adults Aged 60 Years and Older: A Systematic Review and Meta‐Analysis,” Journal of Pain 23, no. 4 (2022): 509–534, 10.1016/j.jpain.2021.07.012. [DOI] [PubMed] [Google Scholar]
- 40. Anderst W. J., W. F. Donaldson, 3rd , Lee J. Y., and Kang J. D., “Cervical Motion Segment Contributions to Head Motion During Flexion\Extension, Lateral Bending, and Axial Rotation,” Spine Journal 15, no. 12 (2015): 2538–2543, 10.1016/j.spinee.2015.08.042. [DOI] [PubMed] [Google Scholar]
- 41. Breen A., De Carvalho D., Funabashi M., et al., “A Reference Database of Standardised Continuous Lumbar Intervertebral Motion Analysis for Conducting Patient‐Specific Comparisons,” Frontiers in Bioengineering and Biotechnology 9 (2021): 745837. [DOI] [PMC free article] [PubMed] [Google Scholar]
- 42. Shapiro S. S. and Wilk M. B., “An Analysis of Variance Test for Normality (Complete Samples),” Biometrika 52 (1965): 591–611. [Google Scholar]
- 43. Dvorak J., Panjabi M. M., Chang D. G., et al., “Functional Radiographic Diagnosis of the Lumbar Spine. Flexion‐Extension and Lateral Bending,” Spine (Phila Pa 1976) 16, no. 5 (1991): 562–571. [DOI] [PMC free article] [PubMed] [Google Scholar]
- 44. Lee S. H., Daffner S. D., and Wang J. C., “Does Lumbar Disk Degeneration Increase Segmental Mobility In Vivo? Segmental Motion Analysis of the Whole Lumbar Spine Using Kinetic MRI,” Journal of Spinal Disorders & Techniques 27, no. 2 (2014): 111–116. [DOI] [PubMed] [Google Scholar]
- 45. Staub B. N., Holman P. J., Reitman C. A., and Hipp J., “Sagittal Plane Lumbar Intervertebral Motion During Seated Flexion‐Extension Radiographs of 658 Asymptomatic Nondegenerated Levels,” Journal of Neurosurgery. Spine 23, no. 6 (2015): 731–738. [DOI] [PubMed] [Google Scholar]
- 46. White A. A. and Panjabi M. M., Clinical Biomechanics of the Spine, 2nd ed. (Lippincott, 1990). [Google Scholar]
- 47. Hayes M. A., Howard T. C., Gruel C. R., et al., “Roentgenographic Evaluation of Lumbar Spine Flexion‐Extension in Asymptomatic Individuals,” Spine (Phila Pa 1976) 14, no. 3 (1989): 327–331. [DOI] [PubMed] [Google Scholar]
- 48. Pearcy M. J. and Whittle M. W., “Movements of the Lumbar Spine Measured by Three‐Dimensional X‐Ray Analysis,” Journal of Biomedical Engineering 4, no. 2 (1982): 107–112. [DOI] [PubMed] [Google Scholar]
- 49. Knapik G. G., Mendel E., Bourekas E., and Marras W. S., “Computational Lumbar Spine Models: A Literature Review,” Clinical Biomechanics (Bristol, Avon) 100 (2022): 105816. [DOI] [PubMed] [Google Scholar]
- 50. Wong K. W., Luk K. D., Leong J. C., Wong S. F., and Wong K. K., “Continuous Dynamic Spinal Motion Analysis,” Spine (Phila Pa 1976) 31, no. 4 (2006): 414–419, 10.1097/01.brs.0000199955.87517.82. [DOI] [PubMed] [Google Scholar]
- 51. Saito H., Watanabe Y., Kutsuna T., et al., “Spinal Movement Variability Associated With Low Back Pain: A Scoping Review,” PLoS One 16, no. 5 (2021): e0252141. [DOI] [PMC free article] [PubMed] [Google Scholar]
- 52. Stergiou N., Harbourne R., and Cavanaugh J., “Optimal Movement Variability: A New Theoretical Perspective for Neurologic Physical Therapy,” Journal of Neurology, Physical Therapy & Rehabilitation 30, no. 3 (2006): 120–129. [DOI] [PubMed] [Google Scholar]
- 53. Bauer C. M., Kankaanpaa M. J., Meichtry A., Rissanen S. M., and Suni J. H., “Efficacy of Six Months Neuromuscular Exercise on Lumbar Movement Variability—A Randomized Controlled Trial,” Journal of Electromyography and Kinesiology: Official Journal of the International Society of Electrophysiological Kinesiology 48 (2019): 84–93. [DOI] [PubMed] [Google Scholar]