

Abstract
Molecular changes underlying the persistent health effects after SARS-CoV-2 infection remain poorly understood. To discern the gene regulatory landscape in the upper respiratory tract of COVID-19 patients, we performed enzymatic DNA methylome and single-cell RNA sequencing in nasal cells of COVID-19 patients (n = 19, scRNA-seq n = 14) and controls (n = 14, scRNA-seq n = 10). In addition, we resampled a subset of these patients for transcriptome analyses at 3 (n = 7) and 12 months (n = 5) post infection and followed the expression of differentially regulated genes over time. Genome-wide DNA methylation analysis revealed 3112 differentially methylated regions between COVID-19 patients and controls. Hypomethylated regions affected immune regulatory genes, while hypermethylated regions were associated with genes governing ciliary function. These genes were not only downregulated in the acute phase of the disease but sustained repressed up to 12 months post infection in ciliated cells. Validation in an independent cohort collected 6 months post infection (n = 15) indicated symptom-dependent transcriptional repression of ciliary genes. We therefore propose that hypermethylation observed in the acute phase may exert a long-term effect on gene expression, possibly contributing to post-acute COVID-19 sequelae.
Keywords: Whole-genome DNA Methylation Sequencing, scRNA-seq, COVID-19, Post-COVID-19 Condition, Nasal Mucosa
Subject terms: Chromatin, Transcription & Genomics; Respiratory System
Synopsis
Concurrent analysis of whole-genome DNA methylation and single-cell RNA sequencing data from COVID-19 patients and controls reveals gene regulatory alterations in airway epithelial and immune cells.
Hypomethylated regions were linked to the upregulation of chemokine receptors, particularly in monocyte-derived macrophages.
Hypermethylated regions affected genes involved in ciliary function.
The expression of ciliary genes was repressed not only in the acute phase of infection but also in samples collected 3, 6 and 12 months post infection.
The transcriptional repression was more strongly pronounced in patients with persisting respiratory post-COVID-19 symptoms.
Concurrent analysis of whole-genome DNA methylation and single-cell RNA sequencing data from COVID-19 patients and controls reveals gene regulatory alterations in airway epithelial and immune cells.
The paper explained.
Problem
The pathomechanisms of post-COVID-19 condition remain poorly understood. As DNA methylation is considered a relatively stable epigenetic modification, its alterations may affect gene expression beyond the acute phase, possibly contributing to the persistence of post-acute sequelae of COVID-19.
Results
We detected a large number of hypermethylated regions in COVID-19 patients that were linked to genes involved in ciliary function. The corresponding genes were not only downregulated in the acute phase of SARS-CoV-2 infection but also 3 and 12 months post infection, suggesting that the hypermethylation observed in the acute phase of infection may exert a long-term impact on gene expression. These findings were replicated in an independent cohort collected 6 months post infection.
Impact
The data suggest that respiratory post-acute sequelae of COVID-19 may be related to long-term transcriptional dysregulation in airway epithelial cells, likely associated with epigenetic perturbations initiated in the acute phase of the disease. This could help to identify potential therapeutic targets for managing post-COVID-19 conditions.
Introduction
To date, the coronavirus disease 2019 (COVID-19) pandemic has caused more than 7 million deaths worldwide (Our World in Data, 2024). Despite a high proportion of immunized individuals due to infection, vaccination, or both, thousands continue to be (re-) infected every day, albeit with declining mortality and morbidity (World Health Organization, 2023). While the threats of acute infection diminished over the last years, persistent post-COVID symptoms emerged as a new, but relevant problem for the healthcare system (Katz et al, 2023). In view of the persistently high numbers of ongoing infections and the associated risk of enduring post-COVID symptoms that exist with every new infection (Bowe et al, 2022), it remains a major goal to comprehensively understand the mechanisms of infections with severe acute respiratory syndrome coronavirus type 2 (SARS-CoV-2) and resulting long-term consequences.
Although SARS-CoV-2 infections affect multiple organs and elicit a systemic response (Petersen et al, 2022), the nasopharynx constitutes the initial site of SARS-CoV-2 infection and replication (Wolfel et al, 2020). Upon infection, the airway epithelium releases interferons and pro-inflammatory cytokines (Park and Iwasaki, 2020), triggering the infiltration of immune cells, with severe COVID-19 often being characterized by excessive recruitment and activation of myeloid cells, in particular neutrophils and macrophages (Chua et al, 2020; Voiriot et al, 2022; Ziegler et al, 2021). While the transcriptome and proteome of the nasal mucosa during SARS-CoV-2 infection have been studied comprehensively (Chua et al, 2020; Trump et al, 2021; Vanderboom et al, 2021; Ziegler et al, 2021), the underlying regulatory changes are still largely unexplored. DNA methylation represents one of the main epigenetic mechanisms by which cells can regulate and stabilize gene expression. As DNA methylation patterns are transmitted across cell divisions, changes in the DNA methylome can lead to the heritable reprogramming of cellular transcriptional programs (Mattei et al, 2022). As such, DNA methylation becomes particularly interesting with regard to health impairments that persist subsequent to infection, also known as post-COVID-19 condition (PCC) or post-acute sequelae of COVID-19. PCC occurs in ~10% of infected individuals, with higher rates in hospitalized or unvaccinated individuals, and encompasses a variety of symptoms including respiratory, cardiovascular, or cognitive impairments (Davis et al, 2023). While many of these symptoms can resolve within a few months to one year, some, such as dyspnea or the loss of smell, have the tendency to persist longer (Bowe et al, 2023). Current studies on DNA methylation changes in COVID-19 almost exclusively have been limited to blood-derived samples (Balnis et al, 2021; Bernardes et al, 2020; Konigsberg et al, 2021), thereby excluding the epithelial cells of the nasal mucosa which may be of relevance with regard to respiratory post-acute sequelae.
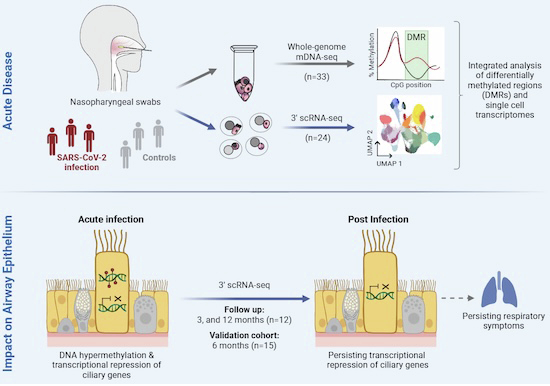
To gain insight into the upper airway gene regulatory landscape during SARS-CoV-2 infection, we performed whole-genome enzymatic DNA methylation sequencing (mDNA-seq) along with single-cell RNA sequencing (scRNA-seq) in a cohort of 33 individuals. By combining methylome with scRNA data, we were able to assess the impact of the methylation changes on gene expression within the same sample on single-cell resolution. In addition, we resampled a subset of patients for transcriptome analyses at 3 and 12 months post infection (total n = 12), thereby allowing us to track the expression of differentially regulated genes over time. Lastly, the observed changes in gene expression were verified and further refined using scRNA-seq data from an independent cohort collected 6 months post infection (n = 6 persisting respiratory symptoms, n = 9 no respiratory symptoms).
Results
DNA methylation & scRNA sequencing cohort
The analysis encompassed mDNA-seq data obtained from nasopharyngeal cells of 19 COVID-19 patients (21–76 years; 16 males, 3 females) and 14 controls (24–73 years; 7 males, 7 females) (Table 1; EV1). In addition, for the majority of these samples (24 out of 33), matched single-cell transcriptome data were concurrently analyzed (Fig. 1A). From 10 COVID-19 patients, follow-up samples for scRNA-seq were obtained 3 months (n = 7) and 12 months after infection (n = 5). COVID-19 patients in both the main cohort (mDNA-seq) as well as the subcohort with mDNA-seq and scRNA-seq data tended to contain a larger proportion of males with a higher median age compared to the control group (Table 1). mDNA-seq data had a median genome-wide coverage of 62.3× across all samples (minimum 46.5×, Table EV2). The integrated scRNA-seq data comprised 82,365 cells assigned to 30 different cell types and states (Appendix Figs. S1 and S2).
Table 1.
Distribution of cohort characteristics between SARS-CoV-2-positive patients and controls in the full (mDNA-seq) cohort and the scRNA-seq subcohort.
| mDNA-seq cohort (n = 33) | ||
|---|---|---|
| SARS-CoV-2 (n = 19) |
Controls (n = 14) |
|
| Female/male, n (%) | 3 (15.8)/16 (84.2) | 7 (50.0)/7 (50.0) |
| Age (years), median (range) | 57 (21–76) | 38.5 (24–73) |
| BMI, median (range) | 25.1 (20.0–36.2)a | 28.1 (19.4–41.9) |
| Cardiovascular disease, n (%) | 9 (47.3) | 4 (28.6) |
| Pre-existing respiratory disease, n (%)b | 3 (15.8) | 1 (7.1) |
| Diabetes, n (%) | 4 (21.1) | – |
| COVID-19 disease severityc | ||
| mild or moderate, n (%) | 8 (42.1) | N/A |
| severe or critical, n (%) | 11 (57.9) | N/A |
| Number of days hospitalized, median (range) | 18 (7–88)d | N/A |
| Subcohort with mDNA-seq and scRNA-seq data (n = 24) | ||
|
SARS-CoV-2 (n= 14) |
Controls (n = 10) |
|
| Female/male, n (%) | 2 (14.3)/12 (85.7) | 4 (40.0)/6 (40.0) |
| Age (years), median (range) | 60 (21–76) | 35 (24–73) |
| BMI, median (range) | 27.1 (20.0–36.2)a | 26.2 (19.4–41.9) |
| Cardiovascular disease, n (%) | 6 (42.9) | 3 (30.0) |
| Pre-existing respiratory disease, n (%)b | 3 (21.4) | – |
| Diabetes, n (%) | 4 (28.6) | – |
| COVID-19 disease severityc | ||
| Mild or moderate, n (%) | 5 (35.7) | N/A |
| Severe or critical, n (%) | 9 (64.3) | N/A |
| Number of days hospitalized, median (range) | 18 (7–88)e | N/A |
aBMI info is missing for one SARS-CoV-2-positive patient.
bAsthma or COPD.
cCOVID-19 disease severity based on WHO classification (https://www.who.int/docs/default-source/coronaviruse/who-china-joint-mission-on-covid-19-final-report.pdf).
dTwo patients deceased.
eOne patient deceased.
Figure 1. Sequencing workflow and characteristics of DNA methylome data.

(A) Sequencing workflow and analysis scheme. 1For those samples, where scRNA-seq data were not available (n = 9), cell lineage proportions were inferred using EPISCORE (B) Heatmap representation of all differentially methylated regions (DMRs, n = 3112) comparing SARS-CoV-2-positive individuals (n = 19) to controls (n = 14), adjusted for age, sex, and cellular composition. Hyper- and hypomethylated DMRs were clustered separately. Heatmap colors encode mean methylation per DMR (columns) and sample (rows). d.p.s. days post start of symptoms. (C) Genomic features of DMRs. (D) Distribution of DMRs across hypo- and hypermethylated as well as genotype-associated (g) or non-genotype-associated (ng) DMRs. (E) Number of differentially expressed DMR target genes (DEGs) between SARS-CoV-2-positive patients (n = 14) vs. controls (n = 10) in all epithelial or immune cells combined (from Dataset EV2). Differential gene expression was calculated using the MAST test, adjusted for age, sex, and fraction of genes per cell. SNP single-nucleotide polymorphism, LMR lowly methylated region, DMR differentially methylated region.
Characteristics of differentially methylated regions and target genes
To identify differences in the upper airway methylome between SARS-CoV-2 patients and controls, we determined age-, sex-, and cell proportion-adjusted differentially methylated regions (DMRs). The differential methylation analysis revealed a total of 3112 DMRs distributed across all autosomes, with a high proportion of DMRs (81.2%) that showed significantly higher mean methylation in SARS-CoV-2-positive individuals (i.e., hypermethylated, Fig. 1B, Dataset EV1). As expected within lowly methylated regions (LMRs) (Burger et al, 2013), a large proportion of DMRs overlapped with regulatory elements, such as enhancers or promoters (64.2%, Fig. 1C). The methylation quantitative trait loci (meQTL) analysis indicated that the majority of hypermethylated DMRs (hyperDMRs) were non-genotype-associated (ngDMRs, 65.7%), while hypomethylated DMRs (hypoDMRs) contained a higher proportion of gDMRs (60.8%, Fig. 1D). We identified a total of 5513 DMR target genes (Dataset EV1) and further examined these in order to understand the biological implications resulting from the methylation differences. Comparing the expression of DMR target genes between SARS-CoV-2 infected individuals and controls, we found that DMR target genes were rather upregulated in immune cells (59.8% of all 1859 differentially expressed genes [DEGs]), whereas the vast majority of epithelial DEGs were downregulated in COVID-19 patients compared to controls (91.9% of 2829 DEGs, Fig. 1E; Appendix Fig. S3; Dataset EV2).
Hypomethylated regions affect genes involved in immune cell recruitment
Gene Ontology (GO) pathway enrichment showed that several genes derived from the cluster of hypoDMRs were involved in macrophage migration and cell chemotaxis, driven by a set of genes encoding chemokine receptors (Fig. 2A; Table EV3). These genes were derived from one ngDMR that overlapped with an enhancer from the GeneHancer database (GH03J046088) which had prior experimental evidence of interactions with the cluster of chemokine receptors on chr3p21.31 (Fig. 2B; Dataset EV1). As chemokine receptors are expressed on a variety of immune cells (Sobolik-Delmaire et al, 2013) and interactions between enhancers and their target genes are known to vary between different cell types, we used existing promoter capture Hi-C data from primary blood-derived leukocytes (Javierre et al, 2016) to identify cell type-specific interactions between the enhancer and its target genes (Fig. 2C). In line with the GeneHancer database, the Hi-C data showed several links between the enhancer and surrounding genes for the different immune cell populations, particularly for the promoter regions of CCR1, CCR2, and CCR5, with the highest number of interactions in monocytes, macrophages, and CD8-positive T cells. To further narrow down the cell types and genes affected by the hypomethylation, we used our sample-matched scRNA-seq data and correlated average methylation levels within the DMR with pseudo-bulked average expression of all enhancer target genes in the different immune cell types (Fig. 2C; Dataset EV3). The analysis showed that methylation levels of the hypoDMR were most frequently inversely correlated with the expression of CCR1; besides CD8-positive T cells and myeloid dendritic cells, significant correlation for CCR1 was detected in all three macrophage populations (monocyte-derived, non-resident (Fig. 2D) and resident macrophages), suggesting that the hypomethylation on chr3p21.31 particularly drives the upregulation of CCR1 in macrophages.
Figure 2. Hypomethylated regions affect genes involved in immune cell recruitment.

(A) Network analysis of hypoDMR target genes based on Enrichr-KG. (B) Genomic view of one hypoDMR located in the cluster of chemokine receptors on chr3p21.31. The line plot on the top displays mean methylation values with standard errors per group (SARS-CoV-2-positive n = 14, controls n = 10), with the DMR indicated by blue shading. The DMR overlapped with an enhancer (GH03J046088) whose interactions with target gene promoters in primary immune cell types are shown in the bottom panel (Promoter capture Hi-C data from Javierre et al, 2016). (C) Correlation between mean methylation levels at the hypoDMR and average expression of enhancer target genes in immune cells of SARS-CoV-2-positive patients (n = 14). Heatmap colors indicate Spearman correlation coefficients. Missing correlation coefficient = gene not expressed by respective cell type. *P < 0.05, **P < 0.01. (D) Example scatterplot depicting the relationship between DNA methylation and CCR1 expression in non-resident macrophages in SARS-CoV-2-positive samples. DMR differentially methylated region, moMa monocyte-derived macrophages, nrMa non-resident macrophages, rMa resident macrophages, mDC myeloid dendritic cells, DC dendritic cells, MC/Basophil mast cells or basophils, NKT natural killer T cells, p_Tcells proliferating T cells, DNT double negative T cells.
Hypermethylation is associated with repression of genes involved in ciliary function
To understand the impact of hypermethylation on epithelial cells, we performed a gene set enrichment analysis based on the differential expression of the hyperDMR target genes in all epithelial cells (Dataset EV4). In line with the hypermethylation, GO pathway enrichment showed that the vast majority of the enriched pathway genes were suppressed in epithelial cells of COVID-19 patients, while only a small proportion were upregulated (Fig. 3A; Table EV4). The suppressed pathway genes were implicated in cytoskeletal processes and in particular ciliary function; including genes involved in the generation of motile cilia (RSPH9, DNAH3, and DNAH5) (Tilley et al, 2015), genes that are part of the ciliary protein trafficking machinery (IFT122, IFT46) (Tilley et al, 2015), as well as the ciliogenesis regulating transcription factor RFX3 (El Zein et al, 2009) and its downstream effectors ALMS1 (Purvis et al, 2010), TEKT1 and TEKT2 (Didon et al, 2013). In order to determine how the observed transcriptional repression affects the different epithelial cell subtypes (basal, secretory, and ciliated cells, see Appendix Fig. S2), we calculated a score based on the average expression of all suppressed pathway genes per cell, named pathways score (n = 323 genes, Dataset EV5, Fig. 3A, lower panel). In negative controls, ciliated cells had the highest pathways score, followed by secretory and basal cells, the progenitors of ciliated cells (Davis and Wypych, 2021) (Fig. 3B, left panel). In contrast, in the acute phase of COVID-19, the pathways score was reduced across all epithelial cells (Fig. 3B, right panel, Table EV5), in conjunction with a general loss of epithelial cells and increased proportions of immune cells, mostly of neutrophils and non-resident macrophages (Appendix Fig. S4; Table EV6).
Figure 3. Transcriptional repression of ciliary genes during SARS-CoV-2 infection.

(A) Gene set enrichment analysis was performed based on the expression of hyperDMR target genes in epithelial cells (Dataset EV4). Activated and repressed pathways are shown. (B) The expression of all genes contained within the repressed pathways (n = 323, from (A), lower panel) is represented by the pathways score. Pathways score levels are shown for nasal cells from controls (left, n = 10) and SARS-CoV-2-positive patients (n = 14). For comparability, cells were downsampled to 9000 cells per group. DMR differentially methylated region.
Cell composition changes in postinfection follow-up samples
The majority of patients subjected to follow-up sampling at 3 and 12 months post infection (n = 10, Fig. 4A) exhibited persisting respiratory symptoms, such as exercise-induced dyspnea (n = 7/10, Tables EV1 and EV7, Appendix Fig. S5). Taking these samples into account, we followed the development of cellular proportions, and the pathways score over time. After the aforementioned decline in epithelial cell proportions during the acute phase of infection, the samples collected 3 months post infection still showed an elevated immune cell fraction, which returned to the level of controls after 12 months (Appendix Fig. S4). While the percentage of neutrophils remained elevated in the 3 month follow-up samples, non-resident macrophage numbers decreased more rapidly after infection. The proportion of epithelial cells gradually increased over time and recovered to the level of controls at 12 months post infection.
Figure 4. Hypermethylation is associated with long-term repression of genes involved in ciliary function.

(A) Postinfection follow-up samples were collected 3 and 12 months after infection and subjected to scRNA-seq. (B) Boxplot depicting pathways score levels (based on genes from Fig. 3A, lower panel) over time, groups were compared using pairwise Wilcoxon test, FDR-adj. P value < 0.001, higher than controls (ΔΔΔ) or lower than controls (***). The box represents the 25–75% quantiles, whiskers extend to 1.5 times of the interquartile range, and the median is indicated by a line (see Table EV5, for sample numbers, please see (A) (C) Cytoscape network of genes that remained repressed in ciliated cells comparing 12 month follow-up samples to controls (FDR-adj. P value < 0.05, MAST test adjusted for age and fraction of genes per cell, Dataset EV6). Module themes were assigned based on the most enriched pathways (FDR < 0.05, Table EV8). Dashed black lines: predicted protein interactions, solid lines: experimentally established protein interactions. Arrows indicate the directionality of interactions. (D) Dot plot showing example genes from the Cytoscape network (all genes are shown in Appendix Fig. S8). Circle color indicates expression strength and circle size represents the percentage of cells per group expressing the respective gene. All genes shown were significantly downregulated comparing acute phase (n = 14) vs. controls (n = 10) and 12 months (n = 5) vs. controls (FDR-adj. P value < 0.05, MAST test adjusted for age, fraction of genes per cell and sex, if applicable; see Dataset EV6).
Epithelial cells show differences in gene expression recovery
Following the reduction in the acute phase of infection, the pathways score increased gradually from the acute phase to 12 months post infection in basal and secretory cells. Although ciliated cells also showed a partial recovery of the pathways score in the 3-month follow-up samples, overall expression of constituent genes remained repressed at 12 months after infection (Fig. 4B; Table EV5). As our data structure did not allow for a fully longitudinal assessment, we stratified the cohort to compare the acute phase to the respective follow-up time point in a patient-matched manner (Appendix Fig. S6). The matched comparison supported the trends observed in the combined analysis, showing a repression of the majority of pathway score genes compared to controls at both short and long-term follow-up time points. To identify those pathways score genes that remained repressed in ciliated cells, we performed a differential expression analysis comparing the 12-month follow-up samples to controls (Dataset EV6). In line with the maintained repression of the pathways score, we found a large number of downregulated genes in ciliated cells (n = 106), while a much smaller number remained repressed in basal and secretory cells. Most of those genes that were downregulated in secretory cells, however, were also repressed in ciliated cells (Appendix Fig. S7a). On the contrary, especially in secretory cells, pathways score genes tended to be upregulated 12 months post infection and showed little overlap with those genes that remained repressed in ciliated cells (Appendix Fig. S7b). This indicates that it is distinct subsets of pathway genes in the different epithelial cell subtypes that either regained their transcriptional levels or remained repressed at 12 months after infection.
Ciliated cells exhibit persistent gene suppression
To further assess the functions of repressed pathways score genes in ciliated cells, we conducted a gene network analysis (Fig. 4C; Table EV8), which showed that a large proportion of the persistently suppressed genes was involved in ciliogenesis, microtubule-based movement, and the regulation of protein localization, with many of the genes from the latter two modules having been described specifically in the context of the ciliary function, such as DNAH3, DNAH5 (Tilley et al, 2015), CCT3, and CCT8 (Seo et al, 2010). Also, the ciliogenesis regulator RFX3 remained repressed in ciliated cells at 12 months post infection (Dataset EV6). Depicting the expression of the individual network genes confirmed that the overall suppression observed during the acute phase was sustained, albeit slightly increasing after 3 and 12 months post infection, but not yet reaching the level of controls (Fig. 4D; Appendix Fig. S8). In line, analysis of transcription factor binding motifs in those hyperDMRs whose target genes remained repressed 12 months post infection in ciliated cells revealed enrichment for transcription factors involved in transcriptional repression, cell differentiation, and reprogramming, such as HEY2, GLIS1, and REST (Table EV9) (Jetten et al, 2022; Jin et al, 2023; Weber et al, 2014). Notably, in contrast to the persistently reduced expression of hyperDMRs target genes, no long-term impact on gene expression of the hypoDMR-related genes described in Fig. 2 was observed (Appendix Fig. S9; Table EV10).
Independent follow-up cohort: symptom-linked ciliary transcriptional perturbation in post-COVID-19
While the mDNA-seq and scRNA-seq cohort allowed us to track expression levels across time points, the follow-up cohort was unbalanced insofar as the samples were composed mainly of male donors with severe acute disease. To verify our observations in an independent cohort, we included scRNA-seq data from samples collected 6 months post-SARS-CoV-2 infection from individuals with mild acute disease and a higher proportion of females (n = 15, Table EV11, Appendix Fig. S5). In line with the scRNA-seq data from the samples collected 3 and 12 months post infection, the pathways score levels were significantly reduced compared to controls at 6 months post infection (Appendix Fig. S10a). As this independent cohort was composed of n = 6 donors that reported persisting respiratory symptoms and n = 9 without persisting symptoms, we were further able to examine symptom-dependent differences in the pathways score. All patients experiencing respiratory symptoms reported a reduction in physical fitness compared to their pre-COVID-19 state and did not experience dyspnea symptoms prior to infection. In ciliated cells, pathways score levels were significantly reduced in patients with persisting respiratory symptoms vs. those without (multiple linear regression, adjusted for age, sex, and fraction of genes per cell, coefficient = −0.002 (95% CI −0.004 to −0.001), P value < 0.001). These differences were most pronounced in the differentiated ciliated cell population (Appendix Fig. S10b). A detailed examination of the pathways score genes through differential gene expression analysis revealed that genes involved in ciliogenesis and the coordination of ciliary beating, such as RFX3, EZR and DNAH3 (El Zein et al, 2009; Kawaguchi et al, 2022; Tilley et al, 2015), were among the most strongly repressed genes in patients with persisting respiratory symptoms (Appendix Fig. S10c,d; Dataset EV7).
Discussion
In this study, we conducted the first characterization of the genome-wide DNA methylome together with the single-cell transcriptome in the nasal mucosa of adult COVID-19 patients. By collecting single-cell gene expression data not only during the acute phase, but also 3, 6 and 12 months post infection, we investigated both immediate and persistent changes in gene expression in the upper airways.
Previous studies on DNA methylation changes in COVID-19 have primarily focused on array-based investigations of blood-derived samples (Balnis et al, 2021; Bernardes et al, 2020; Konigsberg et al, 2021), that are limited to a subset of 3.5% of all CpGs in the human genome (Pidsley et al, 2016). In contrast, we assessed global epigenetic alterations using mDNA-seq in cells from the nasal mucosa, the primary site of SARS-CoV-2 infection and replication (Wolfel et al, 2020). The combination of methylome and single-cell transcriptome data further allowed us to infer cell type-specific effects related to the methylation changes.
We identified a hypoDMR within the cluster of chemokine receptors on chr3p21.3 that associated with the upregulation of CCR1, particularly in macrophages. This DMR was in close proximity to the genetic risk locus linked to severe COVID-19 (Zeberg and Paabo, 2020), aligning with previous research indicating that upregulation of CCR1 in macrophages is related to severe COVID-19 outcomes (Chua et al, 2020; Trump et al, 2021). It has been suggested that active chromatin states in this risk locus govern the expression of CCR1 particularly in macrophages (Stikker et al, 2022). The observed inverse correlation between DNA methylation and CCR1 expression in macrophages, implies that DNA hypomethylation adds an additional layer of regulation to CCR1 induction and macrophage recruitment, as it has been previously described in the context of COVID-19 (Chua et al, 2020; Stikker et al, 2022; Trump et al, 2021).
Previous studies on DNA methylation in blood of COVID-19 patients have identified a large proportion of hypomethylated regions, aligning with an activated immune response (Balnis et al, 2021; Bernardes et al, 2020). Despite the critical role immune cells play in antiviral defense, the primary targets for infection are epithelial cells, in particular ciliated cells (Ahn et al, 2021; Lukassen et al, 2020; Wu et al, 2023). In the acute phase of COVID-19, there is a significant depletion of ciliated cells, necessitating extensive regeneration of the epithelial layer (Robinot et al, 2021; Schreiner et al, 2022; Ziegler et al, 2021). Not only a loss of cells but also functional impairment of the epithelium has been described due to SARS-CoV-2 infection, including deciliation and diminished ciliary beat frequency (Li et al, 2023; Vijaykumar et al, 2023). Correspondingly, impaired upper airway mucociliary clearance has been described in dyspneic COVID-19 patients (Pezato et al, 2023). In line with these reports, our study shows pronounced DNA hypermethylation in nasal epithelial cells of COVID-19 patients, associated with repression of genes involved in epithelial cell function.
Differences in gene expression can result from heritable changes in the epigenetic landscape that promote reprogramming of the cellular response and phenotype. Therefore, methylation changes in epithelial cells initiated in the acute phase of COVID-19 may mediate the observed long-lasting repression of hypermethylation-related genes involved in ciliogenesis up to 12 months post infection. This notion is supported by earlier animal models and in vitro studies that showed prolonged effects on ciliogenesis-related genes following SARS-CoV-2 infection (Robinot et al, 2021; Schreiner et al, 2022). Although we lack DNA methylation data for the follow-up samples, several other studies have shown that DNA methylation patterns can persist long after SARS-CoV-2 infection (Balnis et al, 2023; Balnis et al, 2022; Huoman et al, 2022). The fact that secretory cells, the progenitors of ciliated cells, showed similar sustained expression changes points towards an impaired differentiation potential. In agreement with this, altered epithelial differentiation and a reduced proportion of ciliated cells have been observed in patients with severe post-COVID sequelae (Fähnrich et al, 2024). It is therefore conceivable that the transcriptional programs of newly differentiated ciliated cells may remain altered due to propagated epigenetic perturbations induced during the acute infection phase, also affecting progenitor cells. Given the role of DNA methylation in persistently altering transcriptional responses, we posit that an inherited reprogramming of epithelial cells may underlie COVID-19 sequelae like dyspnea or olfactory dysfunction.
While this study provides valuable insights into epigenetic mechanisms of SARS-CoV-2 infection, it is important to consider certain limitations. The generalizability of results may be influenced by the relatively small number of study participants, therefore larger cohorts are needed to validate our data. The limited sample size, especially in the follow-up analyses, poses certain challenges. The majority of 3 and 12-month follow-up samples were obtained from male participants with persisting respiratory symptoms, restricting our ability to account for potential sex-specific effects. To address this, we included an independent 6-month follow-up cohort that allowed us to assess symptom-dependent transcriptional changes. Although detailed baseline health information was unavailable for most participants due to the nature of the COVID-19 pandemic and the timing of recruitment, the independent cohort provided an opportunity to evaluate respiratory health relative to the pre-infection status.
Another limitation is the absence of mDNA-seq data of the follow-up samples due to a lack of available DNA. Thus, we were not able to analyze DNA methylation and gene expression levels concurrently in the follow-up samples, which limits the direct association to epigenetic changes. However, as mentioned above it is well-established that epigenetic reprogramming can lead to persistent alterations in gene expression. The genome-wide mDNA-seq was performed in a mixture of cells, and while we used the scRNA-seq data to discern the cells likely affected by the methylation changes, the specific cell types contributing to the COVID-19-related DNA methylation changes remain uncertain.
To our knowledge, this is the first study providing a comprehensive examination of the upper airway DNA methylome coupled with single-cell transcriptomics in the context of COVID-19. Our data reveal critical insights into SARS-CoV-2-induced DNA methylation changes in nasopharyngeal cells, representing the first airway barrier to be affected by the virus. Furthermore, we present preliminary evidence indicating a link between persisting transcriptional repression in epithelial cells and the presence of respiratory post-acute COVID-19 sequelae.
Methods
Reagents and tools table
| Reagent/resource | Reference or source | Identifier or catalog number |
|---|---|---|
| Experimental models | ||
| Recombinant DNA | ||
| Antibodies | ||
| Oligonucleotides and other sequence-based reagents | ||
| Chemicals, enzymes, and other reagents | ||
| DMEM/F12 medium | Gibco | 11039 |
| Dithiothreitol (DTT) | AppliChem | A2948 |
| Fetal bovine serum (FBS) | Gibco | 10500 |
| DMSO | Sigma-Aldrich | D8418 |
| PBS | Sigma-Aldrich | D8537 |
| Red Blood Cell Lysis Buffer | Roche | 11814389001 |
| Accutase | Thermo Fisher | 00-4555-56 |
| Chromium Next GEM Single Cell 3’ Kits v3.1 | 10X Genomics | PN-1000121, PN-1000120, PN-1000123 |
| QIAamp® DNA Blood Mini Kit | QIAGEN | 51104 |
| NEBNext® Enzymatic Methyl-seq Kit (Protocol for Large Insert Libraries) | New England Biolabs | E7120 |
| Software | ||
| OTP pipeline | https://gitlab.com/one-touch-pipeline/otp | |
| bwa v.0.7.8 | https://github.com/lh3/bwa | |
| GATK | https://github.com/broadinstitute/gatk | |
| methylCtools v.1.0.0 | https://github.com/hovestadt/methylCtools | |
| EPISCORE | https://github.com/aet21/EpiSCORE | |
| DSS v.2.38 | https://github.com/haowulab/DSS | |
| BisSNP | https://github.com/dnaase/Bis-tools | |
| Cellranger v.3.0.1 | 10X Genomics | |
| Seurat v.3.2.2 | https://github.com/satijalab/seurat | |
| scanpy v.1.6.0 | https://github.com/scverse/scanpy | |
| harmony v.0.0.5 | https://github.com/immunogenomics/harmony | |
| bbknn v.1.4.0 | https://github.com/Teichlab/bbknn | |
| fgsea v.1.24.0 | https://github.com/alserglab/fgsea | |
| Cytoscape v.3.8.2 | https://cytoscape.org/ Shannon et al, 2003 | |
| Other | ||
| 35 µm cell strainer | Falcon | 352235 |
| Neubauer chamber | NanoEnTek | DHC-N01 |
| NovaSeq 6000 Sequencing System | Illumina | |
| ME220 Focused-Ultrasonicator | Covaris | |
Study design and participants
Written informed consent was given by all patients or their legal representatives. Adult patients enrolled in either the prospective observational cohort study Pa-COVID-19 at Charite–Universitätsmedizin Berlin (Kurth et al, 2020) or the SC2-study at the University of Leipzig Medical Center (Chua et al, 2020) were included in the analyses. Both studies were approved by the respective institutional review boards (Charité–Universitätsmedizin Berlin: EA2/066/20; University Hospital Leipzig: 123/20-ek) and were conducted in accordance with the Declaration of Helsinki. Nasopharyngeal swabs were collected from SARS-CoV-2-positive patients and controls and subjected to mDNA-seq and scRNA-seq. Samples were obtained from March to May, 2020, during the first wave of the COVID-19 pandemic in Germany (SARS-CoV-2 wild-type). The presence or absence of SARS-CoV-2 RNA was confirmed by real-time PCR. Controls tested negative for SARS-CoV-2 and had not been vaccinated against SARS-CoV-2. Those patients who attended follow-up visits at 3 and 12 months post infection were resampled for scRNA-seq. In addition, independent follow-up samples were collected 6 months post infection as part of the SC2-study from former non-hospitalized COVID-19 patients with mild acute disease. The persistence of respiratory symptoms was assessed using the modified Medical Research Council (mMRC) dyspnea scale (Mahler et al, 1987). If the mMRC grade was ≥1, the patient was classified as having persistent respiratory symptoms. No formal sample size calculation was performed; the sample size was determined based on maximal availability. Data collection and analysis were not performed blind to the conditions of the experiments.
Isolation of cells from nasal swabs and single-cell 3’ RNA library preparation
Nasopharyngeal swabs were collected from all COVID-19 patients that were hospitalized in Charité – Universitätsmedizin Berlin or the University Hospital Leipzig from March to May 2020 that were willing to participate in this study. In addition, nasopharyngeal swabs were collected 6 months post infection from former non-hospitalized COVID-19 patients with mild acute disease. Controls were individuals hospitalized for orthopedic/esthetic surgery and tested negative for SARS-CoV-2. Cells used for single-cell RNA and whole-genome methylation sequencing were isolated from freshly collected nasopharyngeal swabs and processed in analogy to previous publications (Chua et al, 2020; Loske et al, 2022; Trump et al, 2021). Following sampling, the swabs were directly transferred into 500 µL precooled DMEM/F12 medium (Gibco), kept on ice and processed further within one hour after collection. Subsequently, 500 µL of 13 mM DTT (AppliChem) were added to the nasopharyngeal swabs. In order to dissociate cells, the suspension was mixed by pipetting cautiously against the swab, followed by dipping the swab 20 times into the medium. Samples were then incubated in a thermomixer (37 °C, 500 rpm, 10 min), spun down (350×g, 4 °C, 5 min) and the supernatant removed without disturbing the cell pellet. In some cases, at this stage, cell pellets were resuspended in cryopreservation medium [20% fetal bovine serum (FBS, Gibco), 10% DMSO (Sigma-Aldrich), 70% DMEM/F12] and stored at −80 °C. To continue the protocol with frozen cells, these were quickly thawed at 37 °C, spun down (350×g, 4 °C, 5 min), and processed as described in the following.
If blood traces were visible, cell pellets were resuspended in 500 µL PBS (Sigma-Aldrich) and treated with 1 mL of RBC Lysis Buffer (Roche) at 25 °C for 10 min and spun down thereafter (350×g, 4 °C, 5 min). For all samples, 500 µL Accutase (Thermo Fisher) were added to the cell pellets for a 10-min incubation at room temperature. To terminate the enzymatic digestion, 500 µL DMEM/F12 with 10% FBS were added, and cells were spun down (350×g, 4 °C, 5 min). Next, pellets were resuspended in 100 µL 1× PBS and filtered through a 35 µm cell strainer (Falcon) to ensure the removal of cell clumps. Cells were counted using a disposable Neubauer chamber (NanoEnTek). Single-cell suspensions and RNA libraries were generated with the Chromium Next GEM Single Cell 3’ Kits v3.1 (10X Genomics). For the single-cell suspension, a master mix containing 17,500 cells per sample was loaded onto the 10X Chromium Controller. The remaining cells were either used directly for DNA isolation or pelleted and stored at −80 °C until further use. The generation of gel bead emulsions together with the subsequent steps of reverse transcription, cDNA amplification, and library preparation were performed as described in the manufacturer’s protocol. The incubation at 85 °C during cDNA synthesis was prolonged by 5 min to ensure virus inactivation. Final 3’ RNA libraries were combined to pools of eight or up to 24 samples (S2 or S4 flow cell, respectively) and sequenced with the NovaSeq 6000 Sequencing System (Illumina; paired-end, single indexing).
Whole-genome DNA methylation sequencing (mDNA-seq)
DNA was isolated from human airway-derived cell pellets using the QIAamp® DNA Blood Mini Kit (QIAGEN), following the instructions of the Blood or Body Fluid Spin Protocol. Up to 150 ng of isolated DNA were fragmented to an average length of 350–400 bp using the ME220 Focused-Ultrasonicator (Covaris). DNA libraries were prepared with the NEBNext® Enzymatic Methyl-seq Kit (New England Biolabs). In brief, DNA was first end-repaired, dA-tailed, and adapter-ligated. In the next step, 5-methylcytosines and 5-hydroxymethylcytosines were oxidized by the TET2 enzyme. The oxidized cytosine derivatives evade the subsequent deamination reaction, during which APOBEC deaminates cytosines to uracils. Finally, libraries were amplified using unique dual-index primers. All samples were sequenced using the NovaSeq 6000 Sequencing System (Illumina; 150-bp paired-end) in pools of 12 samples on S4 flow cells.
Processing and analysis of whole-genome methylation sequencing data
Whole-genome methylation data were pre-processed by the OTP pipeline (Reisinger et al, 2017). In particular, adapter sequences were clipped, and paired-end reads were mapped to the human genome (assembly GRCh37/hg19) with bwa v.0.7.8. Duplicate reads were identified using the MarkDuplicates tool from GATK (Van der Auwera and O’Connor, 2020) and removed. Subsequently, methylation calling for each cytosine in the human genome was performed using methylCtools v.1.0.0 (Hovestadt et al, 2014) which also calculates a probability score for a cytosine being a single-nucleotide polymorphism (SNP). For the whole cohort, we excluded all CpGs from downstream analysis if the SNP score in any of the samples was greater or equal to 0.25 or if the CpG position had a coverage of less than 5X in all samples. In addition, we filtered out high-mappability regions from ENCODE (Amemiya et al, 2019).
Partially methylated domains (PMDs) were identified for each sample using MethylSeekR (Burger et al, 2013). As input, chromosome-wide methylation count matrices were generated, including the total read coverage and the number of methylated cytosines for each CpG position. After PMDs were identified, the remaining regions were further subdivided into lowly methylated (LMRs) and unmethylated regions by using the the segmentUMRsLMRs function. LMRs, i.e., putative regulatory regions, were used to determine differentially methylated regions (DMRs) using DSS v.2.38 (Wu et al, 2015). As input, we used a summarized LMR methylation value, calculated by averaging the methylation levels of the all CpGs with a single-nucleotide polymorphism (SNP) probability score below 0.25, as determined by methylCtools v.1.0.0. within each LMR (Hovestadt et al, 2014). DMRs between SARS-CoV-2-positive (n = 19) and negative (n = 14) samples were determined while adjusting for participants’ age, sex, and cell lineage composition (Table EV1). Where available, cell compositions were derived from the corresponding scRNA-seq data. In case no matching scRNA-seq data were available, cellular composition was calculated using EPISCORE (Teschendorff et al, 2020), which constructs a sample-specific DNA methylation reference matrix based on the scRNA-seq data from the matched samples, and subsequently uses this matrix for inferring the cellular composition for the unmatched samples based on their methylation values. If an LMR region was flagged as differentially methylated and the average CpG coverage was greater or equal 10X, we reported the LMR together with the FDR-adjusted p value from the DSS Wald-test. DMRs were screened for overlaps with enhancers from GeneHancer v.4.8 (Fishilevich et al, 2017), ENCODE (Encode Project Consortium, 2012), and Roadmap (15-state model, enhancers identified in primary cells of the Blood & T-cell or HSC & B-cell groups, (Roadmap Epigenomics Consortium et al, 2015) databases. Furthermore, DMR overlaps with promoters and gene bodies were determined based on GENCODE v19 annotation (Frankish et al, 2019). If a DMR overlapped with an enhancer, the DMR’s genomic feature was classified as such. If no overlapping enhancer was found, the DMR was screened for promoters, followed by gene bodies, and annotated accordingly. DMRs for which no overlapping element was found, were classified as intergenic. DMR target genes were assigned as follows: In case the DMR overlapped with GeneHancer v.4.8 enhancers (Fishilevich et al, 2017), the respective enhancer target genes were annotated. If no overlapping enhancer was found, the gene with the closest TSS to the DMR was annotated, provided the distance was within 1 million bp. SNPs in each sample were identified using BisSNP (Liu et al, 2012) and used to determine methylation quantitative trait loci (meQTL), i.e., genetic variants that may affect the methylation of surrounding CpG sites. To this end, all identified SNPs in a 5 kb genomic region around each DMR were tested for association with the average DMR methylation. In particular, we determined if a SNP was present on one or both alleles for each of the 33 samples in the cohort and performed a Spearman correlation test by using the cor.test function in R. For a SNP considered for testing we demanded a minimum of 3 out of the 33 samples to have the SNP called and not called. The obtained p-values were FDR-adjusted and a significant SNP-DMR association (methylation quantitative trait loci, meQTL) was inferred if the adjusted P value was less than 0.1. In case a meQTL was detected, the corresponding DMR was classified as genotype-associated (gDMR), DMRs with no significant SNP association were termed ngDMRs (non-genotype-associated). A heatmap of the average methylation values per DMR across the 33 samples was generated by using the ComplexHeatmap package (Gu et al, 2016) in R. Rows and columns were clustered individually by using the ward.D2 method in the hclust function.
Processing and analysis of single-cell 3’ RNA sequencing data
Cellranger v.3.0.1 was used for processing the scRNA-seq data. For read alignment, the hg19 reference genome (10x genomics, version 3.1.0) was extended by the SARS-CoV-2 genome (Refseq-ID: NC_045512), which was added as an additional chromosome. Cellranger output files were further processed using Seurat v.3.2.2 (Stuart et al, 2019). Genes expressed in at least three different cells were retained and only cells containing 200 or more genes with a mitochondrial reads percentage of less than 15% were used for further analyses. Counts of Unique Molecular Identifiers were then plotted against gene counts per cell for each sample and an upper gene count cut-off was determined visually in order to exclude outliers. All samples were merged into one object, metadata and counts were exported and loaded into Scanpy v.1.6.0 (Wolf et al, 2018) for further processing. Counts were normalized to 10,000 reads per cell and log-transformed. Highly variable genes were identified and used for subsequent sample integration. The scaled and PCA transformed data were integrated using harmony v.0.0.5 (Korsunsky et al, 2019) and bbknn v.1.4.0, (Polanski et al, 2020) based on 80 principal components. Next, UMAP embedding and Leiden clusters (Traag et al, 2019) were calculated and Leiden cluster resolution of 1.1 was used to annotate different cell types and states based on marker gene expression (Appendix Fig. S1). Macrophage/dendritic cell, T-cell and Secretory clusters were further subclustered for cell type identification. Finally, the object was converted to a h5seurat file using SeuratDisk v.0.0.0.9014 and loaded into R v.4.2.3 (R Core Team, 2022) where subsequent analyses were performed using Seurat v.4.3.0.1 (Butler et al, 2018).
Differentially expressed DMR target genes between SARS-CoV-2-positive samples and controls were calculated using the FindMarkers function (logfc.threshold=0.01, min.pct=0.05) in Seurat under the use of the MAST test. MAST is based a hurdle model adapted to scRNA-seq data and allows for the consideration of covariates, which were set to participants’ age, the proportion of genes detected within each cell (cellular detection rate, see (Finak et al, 2015)) and sex, where applicable. For correlating DNA methylation with gene expression, pseudo bulk expression per cell type and sample was calculated using the AverageExpression function in Seurat and transformed back into log-space using log1p. Two-tailed Spearman correlation between average methylation at the hypoDMR on chr3p21 and pseudo bulk expression of all enhancer target genes was calculated using the cor.test function in R. Gene set enrichment analysis was performed with fgsea v.1.24.0 (Korotkevich et al, 2021) under the use of Gene Ontology gene sets (c5.all.v2023.1.Hs.symbols.gmt). Only the top six most significant pathways with positive or negative enrichment scores were considered. The pathways score for repressed pathway genes from the gene set enrichment analysis (n = 323) as well as the hypoDMR network score were calculated for each cell using the ModuleScore function in Seurat, which determines a score by averaging expression levels of a given gene set and subtracting the expression levels of a randomly selected control gene set of similar expression strength. The pathways score was visualized as a FeaturePlot, downsampled to 9000 cells per group using the subset function. For all pathways score-related analyses, epithelial cells were grouped into basal cells = Basal, early_progenitor, Basal_diff; secretory cells = Club, Goblet, Sec_diff and ciliated cells = Ciliated, Cil_diff, SAA_rich_Cil cells (see Appendix Fig. S2). Cellular proportion shifts were determined with scCODA (Büttner et al, 2021) under use of the AnnData object in scanpy, with mDCs set as the reference cell type. For comparisons, the object was subset to the two groups of interest, and credible effects (FDR-adj. P < 0.05) were extracted using the result.effect_df function. Differences in the pathways score between groups were assessed by pairwise Wilcoxon test in R. Differentially expressed pathways score genes between 12 month follow-up samples and controls were calculated as described above, except that sex could not be used as a covariate, as the 12 month follow-up samples were derived from male participants only. Differentially expressed pathway genes were visualized using the DotPlot function (Seurat). Multiple linear regression for the 6 month follow-up samples was performed with the lm function in R while adjusting for age, sex and fraction of genes detected within each cell.
Promoter Capture Hi-C interaction data
Promoter Capture Hi-C interaction data were retrieved from supplementary data S1 from Javierre et al, 2016 (Javierre et al, 2016). In particular, promoter-enhancer regions from file PCHiC_peak_matrix_cutoff5.tsv were scanned for overlaps with our DMR regions using intersectBed. An interaction plot was created with the Python package gelviz v.0.9 (Bieg, 2021).
Gene network analyses
Hypo DMR target genes were subjected to Enrichr-KG (Evangelista et al, 2023) and screened for overrepresentation in Gene Ontology pathways. To assess the function of differentially expressed pathways score genes comparing 12 month follow-up samples to controls in the ciliated cell group, we used Cytoscape v.3.8.2 (Shannon et al, 2003) with the ReactomeFIPlugIn v.2021 (Wu et al, 2014). All genes that were repressed in the acute phase of infection as well as 12 months post infection in ciliated cells were loaded into the Gene Set/Mutation Analysis tool, and the network was constructed without linker genes. After module clustering, enrichment for GO Biological Process pathways was performed considering all modules containing at least three genes (FDR-adj. P < 0.05).
Motif enrichment analysis
Motif enrichment was performed using the SEA tool (Bailey and Grant, 2021) in MEME suite v.5.5.5 under the use of the HOCOMOCO database v.11. Motif abundancies within those hyperDMRs that were related to continuously repressed genes in ciliated cells were compared to motives found in all other hyperDMRs, and only those motives with an FDR-adjusted P value < 0.05 were considered.
Supplementary information
Acknowledgements
First and foremost, we are grateful to the participants of the Pa-COVID-19 and the SC2-studies. The authors thank Illumina GmbH for financial support via the allocation of reagents and sequencing flow cells, as well as Markus Vossmann, Martin Allgaier, and Oliver Krätke for the realization of the sequencing runs at the Illumina Solutions Center Berlin. The authors would further like to thank Philipp Strubel and Stefan Schneider from the BIH Center of Digital Health for their support in data management as well as the BIH Core Unit Genomics for performing sequencing runs. Lastly, the authors wish to thank Intel Germany GmbH for generously donating computational infrastructure. This study was supported by the BIH COVID-19 research program, the European commission (ESPACE, 874719, Horizon 2020), the BMBF-funded de.NBI Cloud within the German Network for Bioinformatics Infrastructure (de.NBI; 031A537B, 031A533A, 031A538A, 031A533B, 031A535A, 031A537C, 031A534A, 031A532B), the BMBF-funded Medical Informatics Initiative (HiGHmed, 01ZZ1802A-01ZZ1802Z), the BMBF-funded SAGE project (031L0265) and the EU ISIDORe PATH2XNAT project (ISID_JRA_f19x). The synopsis figure was created with Biorender.com.
Author contributions
Marey Messingschlager: Conceptualization; Formal analysis; Investigation; Visualization; Writing—original draft; Writing—review and editing. Sebastian D Mackowiak: Conceptualization; Formal analysis; Writing—original draft. Maria Theresa Voelker: Conceptualization; Resources; Writing—original draft. Matthias Bieg: Formal analysis. Jennifer Loske: Conceptualization; Formal analysis; Investigation. Robert Lorenz Chua: Investigation. Johannes Liebig: Investigation. Sören Lukassen: Conceptualization; Resources; Formal analysis. Loreen Thürmann: Conceptualization. Anke Seegebarth: Investigation. Sven Twardziok: Data curation. Daria Doncevic: Formal analysis. Carl Herrmann: Conceptualization. Stephan Lorenz: Resources; Investigation. Sven Klages: Resources; Investigation. Fridolin Steinbeis: Resources. Martin Witzenrath: Resources. Florian Kurth: Resources. Christian Conrad: Conceptualization. Leif E Sander: Resources. Naveed Ishaque: Conceptualization; Resources; Supervision. Roland Eils: Conceptualization; Supervision; Funding acquisition. Irina Lehmann: Conceptualization; Supervision; Funding acquisition; Writing—review and editing. Sven Laudi: Conceptualization; Resources; Supervision; Writing—review and editing. Saskia Trump: Conceptualization; Supervision; Visualization; Writing—original draft; Writing—review and editing.
Source data underlying figure panels in this paper may have individual authorship assigned. Where available, figure panel/source data authorship is listed in the following database record: biostudies:S-SCDT-10_1038-S44321-025-00215-5.
Funding
Open Access funding enabled and organized by Projekt DEAL.
Data availability
The scRNA-seq data for part of the subjects analyzed in acute COVID-19 have been previously published (Chua et al, 2020) and are available in the European Genome-phenome Archive repository under EGAS00001004481. Due to the potential risk of re-identification of pseudonymized raw sequencing data, the counts of total and methylated reads for all SNP-filtered CpG sites per sample (as used for the DMR calling) as well as the FASTQ files for further scRNA-seq data can be obtained through EGAS50000000273 for non-commercial research purposes alone, subject to controlled access as mandated by EU data protection laws. For access, contact the corresponding author, STr. Processed data in the form of a Seurat object are available on FigShare for the independent 6-month follow-up samples (10.6084/m9.figshare.28485914).
The source data of this paper are collected in the following database record: biostudies:S-SCDT-10_1038-S44321-025-00215-5.
Disclosure and competing interests statement
The authors declare no competing interests.
Footnotes
These authors contributed equally: Marey Messingschlager, Sebastian D Mackowiak, Maria Theresa Voelker, Naveed Ishaque, Roland Eils, Irina Lehmann, Sven Laudi, Saskia Trump.
Supplementary information
Expanded view data, supplementary information, appendices are available for this paper at 10.1038/s44321-025-00215-5.
References
- Ahn JH, Kim J, Hong SP, Choi SY, Yang MJ, Ju YS, Kim YT, Kim HM, Rahman MDT, Chung MK et al (2021) Nasal ciliated cells are primary targets for SARS-CoV-2 replication in the early stage of COVID-19. J Clin Investig 131:e148517 [DOI] [PMC free article] [PubMed] [Google Scholar]
- Amemiya HM, Kundaje A, Boyle AP (2019) The ENCODE blacklist: identification of problematic regions of the genome. Sci Rep 9:9354 [DOI] [PMC free article] [PubMed] [Google Scholar]
- Bailey TL, Grant CE (2021) SEA: simple enrichment analysis of motifs. Preprint at https://www.biorxiv.org/content/10.1101/2021.08.23.457422v1
- Balnis J, Madrid A, Hogan KJ, Drake LA, Adhikari A (2023) Whole-genome methylation sequencing reveals that COVID-19-induced epigenetic dysregulation remains 1 year after hospital discharge. Am J Respir Cell Mol Biol 68:594–597 [DOI] [PMC free article] [PubMed] [Google Scholar]
- Balnis J, Madrid A, Hogan KJ, Drake LA, Adhikari A, Vancavage R, Singer HA, Alisch RS, Jaitovich A (2022) Persistent blood DNA methylation changes one year after SARS-CoV-2 infection. Clin Epigenet 14:94 [DOI] [PMC free article] [PubMed] [Google Scholar]
- Balnis J, Madrid A, Hogan KJ, Drake LA, Chieng HC, Tiwari A, Vincent CE, Chopra A, Vincent PA, Robek MD et al (2021) Blood DNA methylation and COVID-19 outcomes. Clin Epigenet 13:118 [DOI] [PMC free article] [PubMed] [Google Scholar]
- Bernardes JP, Mishra N, Tran F, Bahmer T, Best L, Blase JI, Bordoni D, Franzenburg J, Geisen U, Josephs-Spaulding J et al (2020) Longitudinal multi-omics analyses identify responses of megakaryocytes, erythroid cells, and plasmablasts as hallmarks of severe COVID-19. Immunity 53:1296–1314.e1299 [DOI] [PMC free article] [PubMed] [Google Scholar]
- Bieg M (2021) gelviz: a Python python package for plotting genomic elements. https://github.com/HiDiHlabs/gelviz
- Bowe B, Xie Y, Al-Aly Z (2022) Acute and postacute sequelae associated with SARS-CoV-2 reinfection. Nat Med 28:2398–2405 [DOI] [PMC free article] [PubMed] [Google Scholar]
- Bowe B, Xie Y, Al-Aly Z (2023) Postacute sequelae of COVID-19 at 2 years. Nat Med 29:2347–2357 [DOI] [PMC free article] [PubMed] [Google Scholar]
- Burger L, Gaidatzis D, Schubeler D, Stadler MB (2013) Identification of active regulatory regions from DNA methylation data. Nucleic Acids Res 41:e155 [DOI] [PMC free article] [PubMed] [Google Scholar]
- Butler A, Hoffman P, Smibert P, Papalexi E, Satija R (2018) Integrating single-cell transcriptomic data across different conditions, technologies, and species. Nat Biotechnol 36:411–420 [DOI] [PMC free article] [PubMed] [Google Scholar]
- Büttner M, Ostner J, Müller CL, Theis FJ, Schubert B (2021) scCODA is a Bayesian model for compositional single-cell data analysis. Nat Commun 12:6876 [DOI] [PMC free article] [PubMed] [Google Scholar]
- Chua RL, Lukassen S, Trump S, Hennig BP, Wendisch D, Pott F, Debnath O, Thurmann L, Kurth F, Volker MT et al (2020) COVID-19 severity correlates with airway epithelium-immune cell interactions identified by single-cell analysis. Nat Biotechnol 38:970–979 [DOI] [PubMed] [Google Scholar]
- Davis HE, McCorkell L, Vogel JM, Topol EJ (2023) Long COVID: major findings, mechanisms and recommendations. Nat Rev Microbiol 21:133–146 [DOI] [PMC free article] [PubMed] [Google Scholar]
- Davis JD, Wypych TP (2021) Cellular and functional heterogeneity of the airway epithelium. Mucosal Immunol 14:978–990 [DOI] [PMC free article] [PubMed] [Google Scholar]
- Didon L, Zwick RK, Chao IW (2013) RFX3 modulation of FOXJ1 regulation of cilia genes in the human airway epithelium. Respir Res 14:70 [DOI] [PMC free article] [PubMed] [Google Scholar]
- El Zein L, Ait-Lounis A, Morlé L, Thomas JL, Chhin B, Spassky N, Reith W, Durand BND (2009) RFX3 governs growth and beating efficiency of motile cilia in mouse and controls the expression of genes involved in human ciliopathies. J Cell Sci 122:3180–3189 [DOI] [PubMed] [Google Scholar]
- Encode Project Consortium (2012) An integrated encyclopedia of DNA elements in the human genome. Nature 489:57–74 [DOI] [PMC free article] [PubMed] [Google Scholar]
- Evangelista JE, Xie Z, Marino GB, Nguyen N, Clarke DJB, Ma’ayan A (2023) Enrichr-KG: bridging enrichment analysis across multiple libraries. Nucleic Acids Res 51:W168–W179 [DOI] [PMC free article] [PubMed] [Google Scholar]
- Fähnrich A, Reddy KD, Ott F, Maluje Y, Saurabh R, Schaaf A, Winkelmann S, Voß B, Laudien M, Bahmer T et al (2024) scRNA-seq reveals persistent aberrant differentiation of nasal epithelium driven by TNFα and TGFβ in post-COVID syndrome. Preprint at https://www.biorxiv.org/content/10.1101/2024.01.10.574801v2
- Finak G, McDavid A, Yajima M, Deng J, Gersuk V, Shalek AK, Slichter CK, Miller HW, McElrath MJ, Prlic M et al (2015) MAST: a flexible statistical framework for assessing transcriptional changes and characterizing heterogeneity in single-cell RNA sequencing data. Genome Biol 16:278 [DOI] [PMC free article] [PubMed] [Google Scholar]
- Fishilevich S, Nudel R, Rappaport N, Hadar R, Plaschkes I, Iny Stein T, Rosen N, Kohn A, Twik M, Safran M et al (2017) GeneHancer: genome-wide integration of enhancers and target genes in GeneCards. Database (Oxf) 2017:bax028 [DOI] [PMC free article] [PubMed] [Google Scholar]
- Frankish A, Diekhans M, Ferreira AM, Johnson R, Jungreis I, Loveland J, Mudge JM, Sisu C, Wright J, Armstrong J et al (2019) GENCODE reference annotation for the human and mouse genomes. Nucleic Acids Res 47:D766–D773 [DOI] [PMC free article] [PubMed] [Google Scholar]
- Gu Z, Eils R, Schlesner M (2016) Complex heatmaps reveal patterns and correlations in multidimensional genomic data. Bioinformatics 32:2847–2849 [DOI] [PubMed] [Google Scholar]
- Hovestadt V, Jones DT, Picelli S, Wang W, Kool M, Northcott PA, Sultan M, Stachurski K, Ryzhova M, Warnatz HJ et al (2014) Decoding the regulatory landscape of medulloblastoma using DNA methylation sequencing. Nature 510:537–541 [DOI] [PubMed] [Google Scholar]
- Huoman J, Sayyab S, Apostolou E, Karlsson L, Porcile L, Rizwan M, Sharma S, Das J, Rosén A, Lerm M (2022) Epigenetic rewiring of pathways related to odour perception in immune cells exposed to SARS-CoV-2 in vivo and in vitro. Epigenetics 17:1875–1891 [DOI] [PMC free article] [PubMed] [Google Scholar]
- Javierre BM, Burren OS, Wilder SP, Kreuzhuber R, Hill SM, Sewitz S, Cairns J, Wingett SW, Varnai C, Thiecke MJ et al (2016) Lineage-specific genome architecture links enhancers and non-coding disease variants to target gene promoters. Cell 167:1369–1384.e1319 [DOI] [PMC free article] [PubMed] [Google Scholar]
- Jetten AM, Scoville DW, Kang HS (2022) GLIS1-3: links to primary cilium, reprogramming, stem cell renewal, and disease. Cells 11:1833 [DOI] [PMC free article] [PubMed] [Google Scholar]
- Jin L, Liu Y, Wu Y, Huang Y, Zhang D (2023) REST is not resting: REST/NRSF in health and disease. Biomolecules 13:1477 [DOI] [PMC free article] [PubMed] [Google Scholar]
- Katz GM, Bach K, Bobos P, Cheung A, Decary S, Goulding S, Herridge MS, McNaughton CD, Palmer KS, Razak FA et al (2023) Understanding how post-COVID-19 condition affects adults and health care systems. JAMA Health Forum 4:e231933 [DOI] [PubMed] [Google Scholar]
- Kawaguchi K, Nakayama S, Saito D, Kogiso H, Yasuoka K, Marunaka Y, Nakahari T, Asano S (2022) Ezrin knockdown reduces procaterol-stimulated ciliary beating without morphological changes in mouse airway cilia. J Cell Sci 135:jcs259201 [DOI] [PubMed] [Google Scholar]
- Konigsberg IR, Barnes B, Campbell M, Davidson E, Zhen Y, Pallisard O, Boorgula MP, Cox C, Nandy D, Seal S et al (2021) Host methylation predicts SARS-CoV-2 infection and clinical outcome. Commun Med 1:42 [DOI] [PMC free article] [PubMed] [Google Scholar]
- Korotkevich G, Sukhov V, Budin N, Shpak B, Artyomov MN, Sergushichev A (2021) Fast gene set enrichment analysis. Preprint at https://www.biorxiv.org/content/10.1101/060012v3
- Korsunsky I, Millard N, Fan J, Slowikowski K, Zhang F, Wei K, Baglaenko Y, Brenner M, Loh PR, Raychaudhuri S (2019) Fast, sensitive and accurate integration of single-cell data with Harmony. Nat Methods 16:1289–1296 [DOI] [PMC free article] [PubMed] [Google Scholar]
- Kurth F, Roennefarth M, Thibeault C, Corman VM, Muller-Redetzky H, Mittermaier M, Ruwwe-Glosenkamp C, Heim KM, Krannich A, Zvorc S et al (2020) Studying the pathophysiology of coronavirus disease 2019: a protocol for the Berlin prospective COVID-19 patient cohort (Pa-COVID-19). Infection 48:619–626 [DOI] [PMC free article] [PubMed] [Google Scholar]
- Li Q, Vijaykumar K, Phillips SE, Hussain SS, Huynh NV, Fernandez-Petty CM, Lever JEP, Foote JB, Ren J, Campos-Gomez J et al (2023) Mucociliary transport deficiency and disease progression in Syrian hamsters with SARS-CoV-2 infection. JCI Insight 8:e163962 [DOI] [PMC free article] [PubMed] [Google Scholar]
- Liu Y, Siegmund KD, Laird PW, Berman BP (2012) Bis-SNP: combined DNA methylation and SNP calling for Bisulfite-seq data. Genome Biol 13:R61 [DOI] [PMC free article] [PubMed] [Google Scholar]
- Loske J, Rohmel J, Lukassen S, Stricker S, Magalhaes VG, Liebig J, Chua RL, Thurmann L, Messingschlager M, Seegebarth A et al (2022) Pre-activated antiviral innate immunity in the upper airways controls early SARS-CoV-2 infection in children. Nat Biotechnol 40:319–324 [DOI] [PubMed] [Google Scholar]
- Lukassen S, Chua RL, Trefzer T, Kahn NC, Schneider MA, Muley T, Winter H, Meister M, Veith C, Boots AW et al (2020) SARS-CoV-2 receptor ACE2 and TMPRSS2 are primarily expressed in bronchial transient secretory cells. EMBO J 39:e105114 [DOI] [PMC free article] [PubMed] [Google Scholar]
- Mahler DA, Rosiello RA, Harver A, Lentine T, McGovern JF, Daubenspeck JA (1987) Comparison of clinical dyspnea ratings and psychophysical measurements of respiratory sensation in obstructive airway disease. Am Rev Respir Dis 135:1229–1223 [DOI] [PubMed] [Google Scholar]
- Mattei AL, Bailly N, Meissner A (2022) DNA methylation: a historical perspective. Trends Genet 38:676–707 [DOI] [PubMed] [Google Scholar]
- Our World in Data (2024) Data explorer: coronavirus (COVID-19) deaths. https://ourworldindata.org/covid-deaths
- Park A, Iwasaki A (2020) Type I and Type III interferons—induction, signaling, evasion, and application to combat COVID-19. Cell Host Microbe 27:870–878 [DOI] [PMC free article] [PubMed] [Google Scholar]
- Petersen EL, Gossling A, Adam G, Aepfelbacher M, Behrendt CA, Cavus E, Cheng B, Fischer N, Gallinat J, Kuhn S et al (2022) Multi-organ assessment in mainly non-hospitalized individuals after SARS-CoV-2 infection: the Hamburg City Health Study COVID programme. Eur Heart J 43:1124–1137 [DOI] [PMC free article] [PubMed] [Google Scholar]
- Pezato R, David AG, Boggi AC, Melo B, Rosalino CMV, Rodriguez AP, Thamboo A, Voegels RL (2023) Upper airway mucociliary clearance is impaired in dyspneic COVID-19 patients. Indian J Otolaryngol Head Neck Surg 75:772–776 [DOI] [PMC free article] [PubMed] [Google Scholar]
- Pidsley R, Zotenko E, Peters TJ, Lawrence MG, Risbridger GP, Molloy P, Van Djik S, Muhlhausler B, Stirzaker C, Clark SJ (2016) Critical evaluation of the Illumina methylationEPIC BeadChip microarray for whole-genome DNA methylation profiling. Genome Biol 17:208 [DOI] [PMC free article] [PubMed] [Google Scholar]
- Polanski K, Young MD, Miao Z, Meyer KB, Teichmann SA, Park JE (2020) BBKNN: fast batch alignment of single cell transcriptomes. Bioinformatics 36:964–965 [DOI] [PMC free article] [PubMed] [Google Scholar]
- Purvis TL, Hearn T, Spalluto C, Knorz VJ, Hanley KP, Sanchez-Elsner T, Hanley NA, Wilson DI (2010) Transcriptional regulation of the Alstrom syndrome gene ALMS1 by members of the RFX family and Sp1. Gene 460:20–29 [DOI] [PMC free article] [PubMed] [Google Scholar]
- R Core Team (2022) R: a language and environment for statistical computing. R Foundation for Statistical Computing, Vienna, Austria., R Foundation for Statistical Computing, Vienna, Austria
- Reisinger E, Genthner L, Kerssemakers J, Kensche P, Borufka S, Jugold A, Kling A, Prinz M, Scholz I, Zipprich G et al (2017) OTP: an automatized system for managing and processing NGS data. J Biotechnol 261:53–62 [DOI] [PubMed] [Google Scholar]
- Roadmap Epigenomics Consortium, Kundaje A, Meuleman W, Ernst J, Bilenky M, Yen A, Heravi-Moussavi A, Kheradpour P, Zhang Z, Wang J et al (2015) Integrative analysis of 111 reference human epigenomes. Nature 518:317–330 [DOI] [PMC free article] [PubMed] [Google Scholar]
- Robinot R, Hubert M, de Melo GD, Lazarini F, Bruel T, Smith N, Levallois S, Larrous F, Fernandes J, Gellenoncourt S et al (2021) SARS-CoV-2 infection induces the dedifferentiation of multiciliated cells and impairs mucociliary clearance. Nat Commun 12:4354 [DOI] [PMC free article] [PubMed] [Google Scholar]
- Schreiner T, Allnoch L, Beythien G, Marek K, Becker K, Schaudien D, Stanelle-Bertram S, Schaumburg B, Mounogou Kouassi N, Beck S et al (2022) SARS-CoV-2 infection dysregulates cilia and basal cell homeostasis in the respiratory epithelium of hamsters. Int J Mol Sci 23:5124 [DOI] [PMC free article] [PubMed] [Google Scholar]
- Seo S, Baye LM, Schulz NP, Beck JS, Zhang Q (2010) BBS6, BBS10, and BBS12 form a complex with CCT/TRiCfamily chaperonins and mediate BBSome assembly. Proc Natl Acad Sci USA 107:1488–1493 [DOI] [PMC free article] [PubMed] [Google Scholar]
- Shannon P, Markiel A, Ozier O, Baliga NS, Wang JT, Ramage D, Amin N, Schwikowski B, Ideker T (2003) Cytoscape: a software environment for integrated models of biomolecular interaction networks. Genome Res 13:2498–2504 [DOI] [PMC free article] [PubMed] [Google Scholar]
- Sobolik-Delmaire T, Raman D, Sai J, Fan G-H, Richmond A (2013) Chemokine receptors. In: Lennarz WJ, Lane, MD, (eds). Encyclopedia of biological chemistry, second edition. Elsevier, pp 480–485
- Stikker BS, Stik G, van Ouwerkerk AF, Trap L, Spicuglia S, Hendriks RW, Stadhouders R (2022) Severe COVID-19-associated variants linked to chemokine receptor gene control in monocytes and macrophages. Genome Biol 23:96 [DOI] [PMC free article] [PubMed] [Google Scholar]
- Stuart T, Butler A, Hoffman P, Hafemeister C, Papalexi E, Mauck 3rd WM, Hao Y, Stoeckius M, Smibert P, Satija R (2019) Comprehensive integration of single-cell data. Cell 177:1888–1902.e1821 [DOI] [PMC free article] [PubMed] [Google Scholar]
- Teschendorff AE, Zhu T, Breeze CE, Beck S (2020) EPISCORE: cell type deconvolution of bulk tissue DNA methylomes from single-cell RNA-Seq data. Genome Biol 21:221 [DOI] [PMC free article] [PubMed] [Google Scholar]
- Tilley AE, Walters MS, Shaykhiev R, Crystal RG (2015) Cilia dysfunction in lung disease. Annu Rev Physiol 77:379–406 [DOI] [PMC free article] [PubMed] [Google Scholar]
- Traag VA, Waltman L, van Eck NJ (2019) From Louvain to Leiden: guaranteeing well-connected communities. Sci Rep 9:5233 [DOI] [PMC free article] [PubMed] [Google Scholar]
- Trump S, Lukassen S, Anker MS, Chua RL, Liebig J, Thurmann L, Corman VM, Binder M, Loske J, Klasa C et al (2021) Hypertension delays viral clearance and exacerbates airway hyperinflammation in patients with COVID-19. Nat Biotechnol 39:705–716 [DOI] [PubMed] [Google Scholar]
- Van der Auwera GA, O’Connor BD (2020) Genomics in the Cloud. O’Reilly Media, Inc.
- Vanderboom PM, Mun DG, Madugundu AK, Mangalaparthi KK, Saraswat M, Garapati K, Chakraborty R, Ebihara H, Sun J, Pandey A (2021) Proteomic signature of host response to SARS-CoV-2 infection in the nasopharynx. Mol Cell Proteom 20:100134 [DOI] [PMC free article] [PubMed] [Google Scholar]
- Vijaykumar K, Leung H, Barrios A, Fernandez-Petty C, Solomon G, Hathorne H, Wade J, Monroe K, Slaten K, Li Q et al (2023) COVID-19 causes ciliary dysfunction as demonstrated by human intranasal micro-optical coherence tomography imaging. Am J Respir Cell Mol Biol 69:592–595 [DOI] [PMC free article] [PubMed] [Google Scholar]
- Voiriot G, Dorgham K, Bachelot G, Fajac A, Morand-Joubert L, Parizot C, Gerotziafas G, Farabos D, Trugnan G, Eguether T et al (2022) Identification of bronchoalveolar and blood immune-inflammatory biomarker signature associated with poor 28-day outcome in critically ill COVID-19 patients. Sci Rep 12:9502 [DOI] [PMC free article] [PubMed] [Google Scholar]
- Weber D, Wiese C, Gessler M (2014) Hey bHLH transcription factors. Curr Top Dev Biol 110:285–315 [DOI] [PubMed] [Google Scholar]
- Wolf FA, Angerer P, Theis FJ (2018) SCANPY: large-scale single-cell gene expression data analysis. Genome Biol 19:15 [DOI] [PMC free article] [PubMed] [Google Scholar]
- Wolfel R, Corman VM, Guggemos W, Seilmaier M, Zange S, Muller MA, Niemeyer D, Jones TC, Vollmar P, Rothe C et al (2020) Virological assessment of hospitalized patients with COVID-2019. Nature 581:465–469 [DOI] [PubMed] [Google Scholar]
- World Health Organization (2023) From emergency response to long-term COVID-19 disease management: sustaining gains made during the COVID-19 pandemic. World Health Organization
- Wu C-T, Lidsky PV, Xiao Y, Cheng R, Lee IT, Nakayama T, Jiang S, He W, Demeter J, Knight MG et al (2023) SARS-CoV-2 replication in airway epithelia requires motile cilia and microvillar reprogramming. Cell 186:112–130.e120 [DOI] [PMC free article] [PubMed] [Google Scholar]
- Wu G, Dawson E, Duong A, Haw R, Stein L (2014) ReactomeFIViz: a Cytoscape app for pathway and network-based data analysis. F1000Res 3:146 [DOI] [PMC free article] [PubMed] [Google Scholar]
- Wu H, Xu T, Feng H, Chen L, Li B, Yao B, Qin Z, Jin P, Conneely KN (2015) Detection of differentially methylated regions from whole-genome bisulfite sequencing data without replicates. Nucleic Acids Res 43:e141 [DOI] [PMC free article] [PubMed] [Google Scholar]
- Zeberg H, Paabo S (2020) The major genetic risk factor for severe COVID-19 is inherited from Neanderthals. Nature 587:610–612 [DOI] [PubMed] [Google Scholar]
- Ziegler CGK, Miao VN, Owings AH, Navia AW, Tang Y, Bromley JD, Lotfy P, Sloan M, Laird H, Williams HB et al (2021) Impaired local intrinsic immunity to SARS-CoV-2 infection in severe COVID-19. Cell 184:4713–4733.e4722 [DOI] [PMC free article] [PubMed] [Google Scholar]
Associated Data
This section collects any data citations, data availability statements, or supplementary materials included in this article.
Supplementary Materials
Data Availability Statement
The scRNA-seq data for part of the subjects analyzed in acute COVID-19 have been previously published (Chua et al, 2020) and are available in the European Genome-phenome Archive repository under EGAS00001004481. Due to the potential risk of re-identification of pseudonymized raw sequencing data, the counts of total and methylated reads for all SNP-filtered CpG sites per sample (as used for the DMR calling) as well as the FASTQ files for further scRNA-seq data can be obtained through EGAS50000000273 for non-commercial research purposes alone, subject to controlled access as mandated by EU data protection laws. For access, contact the corresponding author, STr. Processed data in the form of a Seurat object are available on FigShare for the independent 6-month follow-up samples (10.6084/m9.figshare.28485914).
The source data of this paper are collected in the following database record: biostudies:S-SCDT-10_1038-S44321-025-00215-5.