

Abstract
This work reports the successful production of rare earth (RE) metal using Na-RE-F. Presently, RE metals are primarily produced using RE-fluoride due to its higher air and moisture stability compared to RE-chloride. However, its preparation requires the use of corrosive and hazardous chemicals, such as hydrofluoric acid (HF) or ammonium bifluoride (NH4HF2). The present study demonstrates that Na-RE-F is an alternative salt to the typically used RE-fluoride. The Na-RE-F for this work is produced via a scalable hydrometallurgical approach using three different RE salts as feedstock, including acetate, nitrate, and chloride. HF is neither used nor generated during the salt preparation process. Furthermore, the Na-RE-F powder dries in air (without dry HF), and only water evolves during the drying process. Analyses of the Na-RE-F show that NaF liberates as a flux during the heating process, which lowers the salt reduction temperature to <900 °C, thus minimizing or eliminating the need for additional flux. Calciothermic reduction of the Na-RE-F salt is successfully employed to obtain RE metal. This work represents a safer, greener, and more widely deployable approach for producing the RE metals needed for permanent magnets which support the transition to a cleaner society through the decarbonization of the transportation industry.
Subject terms: Magnetic materials, Energy
This work reports the metallothermic production of rare earth (RE) Nd metal using NaNdF4 as an alternative fluoride salt, without HF use or generation, enabling safer, scalable production of critical RE metals for advanced technologies and industry
Introduction
Rare earth elements (REEs) are increasingly susceptible to supply risks due to their limited geographical availability and the fact that they are subject to rising geopolitical tensions. Some REEs, such as neodymium (Nd), praseodymium (Pr), dysprosium (Dy), and terbium (Tb), are used for permanent magnets that support many clean energy and renewable energy applications, e.g., electric vehicles, defense systems, electronics, etc. Hence, REEs have been termed “the vitamins of modern industry”1–5.
Reduction of rare earth (RE) salts to metals is typically accomplished through molten salt electrolytic or metallothermic methods. The molten salt electrolytic method is the widely used approach because of its relatively simple process-flow and better suitability for continuous production6. The electrolyte for the molten-salt bath can be chloride- or fluoride-based, and the feedstock can be RE-chloride or RE-oxides, respectively. The molten salts for both the chloride and fluoride electrolytic routes require heating a mixture of RE-halides and alkali or alkaline earth salts to 800–1000 °C. Unlike the metallothermic methods, the electrolytic methods use consumable graphite electrodes which results in CO2 emissions7–11. Fluoride-based baths have higher current efficiency (<87%), compared to chloride-based baths (<50%)12 because the hygroscopic nature of RE-chlorides and the formation of oxychlorides limit yield and contaminate the obtained RE-metal product.
In the metallothermic methods, the RE-feedstock materials are exothermically reduced to metals using more reactive metals like calcium (calciothermic reduction)13. This method can use RE-oxides, chlorides, or fluorides as feedstock. RE-fluoride is less hygroscopic than RE-chloride and both have lower melting temperatures than RE-oxide. The energy cost for direct metallothermic reduction of RE-oxides, as well as the potential for oxidation of the obtained RE-metals due to the lack of a protective flux, makes it less practical. Although calciothermic reduction of RE-chloride has been attempted, it was limited by low yield, and the difficulties with handling the hygroscopic and high vapor pressure RE-chlorides14.
From the foregoing discussion, the practical (hence preferred) application of both the electrolytic and metallothermic approaches requires RE-fluoride, which can be prepared via wet or dry processing techniques. The former involves the wet chemical reaction of RE chloride or nitrate salts and hydrofluoric acid (HF), followed by drying at 600–700 °C in a dry hydrogen fluoride environment15. In the dry processing method, RE2O3 is directly reacted with an excess of dry hydrogen fluoride (200%) at ≥700 °C to obtain anhydrous RE-fluoride16,17. The health hazards18–24 associated with using or generating HF create a considerable technical gap in the anhydrous RE-fluorides preparation for RE metal supply chain. Furthermore, the high melting point of RE-fluorides (>1300 °C) necessitates fluxing with LiF, NaF, KF, etc. during RE metal production. Thus, the need for an alternate feedstock to generate RE metals is timely.
In this work, we report the use of NaNdF4 (NNF) to overcome most of the challenges faced in the RE metal production using the calciothermic reduction process. NNF has the following advantages (a) in-situ formation of NaF as a fluxing agent during reduction, (b) lower liquidus temperatures (~1100 °C)25, (c) facile room temperature synthesis by co-precipitation26, and (d) no requirement for toxic HF or NH4HF2. Furthermore, reports on using NNF in human cancer pathological studies indicate that it would be a non-toxic feedstock27,28. We have demonstrated the use of NNF for Nd metal production using the calciothermic process. Unlike conventional RE-fluoride reduction, NNF not only ensures fluoride ion availability but also represents a strategic shift toward safer, more sustainable, and regulation-compliant rare earth metal production.
Results
The reaction between Nd(CH3COO)3 · 2H2O (neodymium acetate hydrate) and aqueous sodium fluoride solution yields single phase precipitate of α-NaNdF4 (α-NNF) [space group: (no. 225)] (Fig. 1), in agreement with a previous report [Powder Diffraction File (PDF) No. 00-028-1114]. The reaction proceeds as:
| 1 |
Fig. 1. X-ray diffraction (XRD) patterns of the samples synthesized with the three precursor salts.
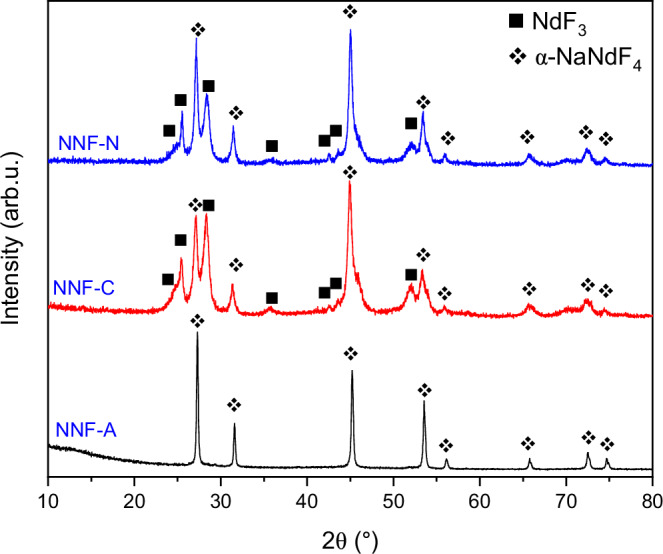
The diffraction pattern for the sample synthesized using the acetate precursor, i.e., NNF-A, comprised of a single α-NaNdF4 phase (denoted with a diamond symbol). The NNF-C and NNF-N samples (synthesized using the chloride and nitrate precursors, respectively) had two phases corresponding to α-NaNdF4 and NdF3 (denoted with a solid square symbol) phases.
The reaction of NdCl3 · 6H2O (neodymium chloride hydrate) and Nd(NO3)3 · 6H2O (neodymium nitrate hydrate) with sodium fluoride both yielded two phases (Fig. 1): α-NNF [space group: (no. 225)] and NdF3 [space group: (no. 193)] [Powder Diffraction File(PDF) No. 00-009-0416]. The contents of the NdF3 phases were 10% for neodymium chloride hydrate and 5% for neodymium nitrate hydrate (Table 1). The formation of two phases in the products can be attributed to having more than one phase of the salts in the starting materials. For example, both NdCl3 and NdOCl would be present for the chloride salt, as further explained in the supplementary information. A recent study by Gibson et al. reported a negative Gibbs' energy for NNF, indicating its thermodynamic stability at 298.15 K29. Additional phase analysis information is provided in Supplementary Figs. 2–4 and Supplementary Tables 1–3. The scanning electron microscopy (SEM) analysis of the fluoride samples in the present study was used to confirm that they have particle sizes of <100 nm (Supplementary Figs. 5–7). Hereinafter, the NaNdF4 produced from acetate, chloride and nitrate will be referred to as NNF-A, NNF-C, and NNF-N, respectively.
Table 1.
Measured fractions of α-NaNdF4 and secondary NdF3 phases contained in the as-synthesized fluoride salts from the various precursor materials
| As-synthesized fluoride salt | Weight % of phases in as-synthesized material | |
|---|---|---|
| NdF3 | α-NaNdF4 | |
| NNF-A | - | 100 |
| NNF-C | 10 ± 2 | 90 ± 2 |
| NNF-N | 6 ± 1 | 94 ± 1 |
The differential scanning calorimetry (DSC) data (Fig. 2a) depicts one exothermic and two endothermic peaks for all three samples. The NNF-A and NNF-N exhibit the first exothermic peaks at T = 394 °C and T = 355 °C, respectively. The first exothermic peak is not pronounced for NNF-C. This first peak for all the samples is a concomitant occurrence of two thermal events, namely, the volatilization of the water of crystallization (endothermic) and the conversion of α-NaNdF4 to β-NaNdF4 phase (exothermic)26, with the latter being more prominent.
Fig. 2. Thermal analysis of the sodium neodymium fluoride samples obtained from neodymium acetate (NNF-A), neodymium chloride (NNF-C), and neodymium nitrate (NNF-N) precursors.

a The differential scanning calorimetry (DSC) plot of the three fluoride samples. The exothermic peak is due to transformation, while the two endothermic peaks correspond to the melting of and transformation. b thermogravimetric analysis (TGA) patterns of the fluoride samples obtained from the different precursor salts. The higher mass loss for NNF-A is due to the higher α-NaNdF4 content.
The endothermic peaks at 642 °C, 750 °C and 700 °C (broad peak) represent the melting of the eutectic mixture comprising NaF and β-NaNdF425 for NNF-N, NNF-C, and NNF-A, respectively. The variation in the peak positions, and the broadness of the peak for NNF-A, are possibly due to the differing contents of the β-NaNdF4 in the three fluorides. Also, respectively, the endothermic peaks at 815 °C, 813 °C, and 821 °C represent the phase transformation in the samples25,26.
The thermal gravimetric analysis (TGA) results show less than 2% mass loss for all the samples, with the NNF-A sample losing the most (Fig. 2b). This is possibly due to the higher phase fraction of NaNdF4 in the NNF-A sample which, in turn, contributed to higher water of crystallization content. The TGA profile of NNF-A depicts two mass loss regions: (a) 150 °C to 300 °C for volatilization of adsorbed water and (b) >350 °C for volatilization of water of crystallization.
Mass spectrometric analysis was performed in the quasi-multiple ion detection (QMID) mode during the TG-DSC experiments and are depicted in Fig. 3.
Fig. 3. Mass spectrometric analysis of the sodium neodymium fluoride samples performed in quasi-multiple ion detection (QMID) mode.

a There are two peaks in the NNF-A sample corresponding to water at 220 °C and 400 °C, b The NNF-C has a sharp peak at ~100 °C and two less prominent peaks at 300 °C and 400 °C, and c The NNF-N has a sharp peak at ~100 °C and another prominent peak at 470 °C. All three fluorides did not exhibit the evolution of any hydrogen fluoride. NNF-A sample synthesized using the acetate precursor, NNF-C sample synthesized using the chloride precursor, NNF-N sample synthesized using the nitrate precursor.
The peaks from the QMID plots help determine the chemical species with a certain mass number that evolves during thermal treatment. There are two notable peaks of mass number 18 (due to water) in all three fluorides. The first peak at <300 °C represents the volatilization of surface water, while the second peak at ~400–500 °C represents the volatilization of the crystallization water. These results corroborate the findings of the DSC studies that show a thermal event at ~400–500 °C (Fig. 2a), along with a mass loss observed in the TGA plot (Fig. 2b). The absence of HF evolution was confirmed by the flat line corresponding to mass number 20 in all the three fluorides. The absence of HF was further validated by heating the sample to 600 °C for 3 h (to ensure complete drying), while testing with a HF gas detector.
To investigate the phases in the NNF powder samples after the volatilization of water of crystallization, the as-synthesized samples were heat treated at 500 °C for 3 h and the powder X-ray diffraction (XRD) patterns were recorded (Fig. 4).
Fig. 4. XRD patterns obtained after drying the as-synthesized samples at 500 °C for 3 h.

The X-ray diffraction (XRD) pattern obtained by heating as-synthesized powders of NNF-A (black plot), NNF-C (red plot), and NNF-N (blue plot) at 500 °C for 3 h shows three phases for each of the samples. The open circle, solid square, and open square symbols correspond to β-NaNdF4, NdF3, and NaF phases, respectively. NNF-A, sample synthesized using the acetate precursor; NNF-C, sample synthesized using the chloride precursor; NNF-N, sample synthesized using the nitrate precursor.
Three phases corresponding to β-NaNdF4 (β-NNF) [space group: (no. 176)], NdF3 [space group: (no. 193)], and NaF [space group: (no. 225)] were observed. The phase fractions of the samples are presented in Table 2. The phase decomposition of the α-NaNdF4 phase can be explained by the deviation from the single-phase region below 785 °C (Supplementary Fig. 8). Below this temperature, the composition corresponding to the α-NaNdF4 phase falls in a two-phase region of β-NaNdF4 and NdF326. Furthermore, below 732 °C, the β-NNF phase exists as a line compound, and any deviation in stoichiometry leads to a two-phase region of β-NaNdF4 and NaF phases (Supplementary Fig. 8). This explains the formation of three phases upon sample heating and is consistent with previous reports26.
Table 2.
Measured fractions of β-NaNdF4, NdF3, and NaF phases after volatilization of the water of crystallization from the samples at 500 °C
| Heated fluoride salt | Weight % of phases in the samples after drying at 500 °C | ||
|---|---|---|---|
| NdF3 | β-NaNdF4 | NaF | |
| NNF-A | 35 ± 1 | 64 ± 2 | 1 ± 0 |
| NNF-C | 54 ± 2 | 41 ± 2 | 5 ± 1 |
| NNF-N | 46 ± 1 | 48 ± 2 | 6 ± 1 |
All the samples formed significant amounts of NdF3 phase, in addition to the β-NaNdF4 phase. NNF-A had the least amount of NaF while the amounts in NNA-C and NNA-N are comparable. The collected metal after calciothermic reduction is shown in Fig. 5a. The XRD of the reduced and polished metal in Fig. 5b shows peaks matching with Nd metal [space group: (no. 194)]. The analysis of the Nd metal shows that it contains C:176 ppm, N: 52 ppm, O: 925 ppm, and S: 1 ppm. It is common for metals produced by calciothermic or electrolytic methods to undergo further purification which helps to reduce the impurities30,31, such as those from the slag or the unreacted salts, etc. In the present work, the metal production yield was 70–80%, which is expected to increase at higher-scale operations.
Fig. 5. Characterization of Nd metal produced by calciothermic reduction of sodium neodymium fluoride.

a Nd metal seated on tantalum cap after calciothermic reduction. The purple surface color is due to the unreacted material and slag on the metal, which was removed by mechanical polishing. The portions of the image corresponding to Nd metal and Ta cap are identified in the picture; b X-ray diffraction (XRD) pattern from the samples reduced to metal. All the peaks correspond to Nd metal [space group: (no. 194)]. The asterisk represents CaF2 phase from the slag.
TG-DSC measurement was performed on a sample of the metal, and the results are plotted in Fig. 6. The DSC plot depicts two endotherms at 852 °C and 1016 °C corresponding to a transformation of the unreacted fluoride sample from β-NaNdF4 to α-NaNdF4 and melting of metallic Nd, respectively. The TGA plot depicts little to no mass change, as expected for Nd metal.
Fig. 6. TG-DSC of rare earth metal obtained from reducing rare-earth fluoride.
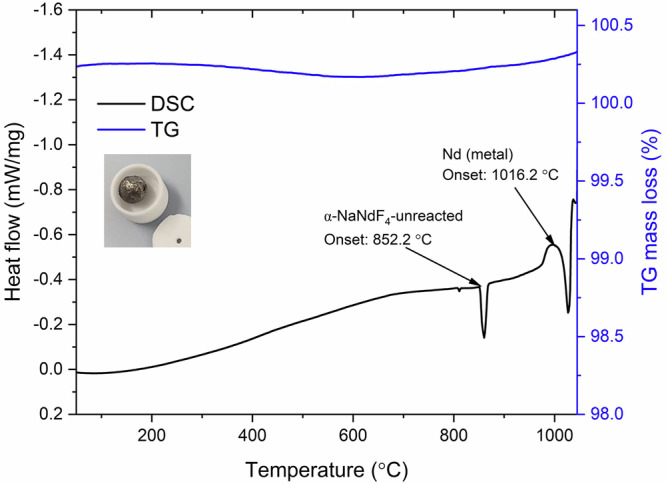
The thermogravimetric analysis (TGA) result (blue plot) shows little variation in the mass change over the temperature range. The differential scanning calorimetry (DSC) plot depicts two endothermic transformations likely corresponding to the melting of the unreacted α-NaNdF4 phase (852.2 °C) and the melting of Nd metal (1016.2 °C). The inset is a spherical ball of Nd metal obtained after the TG-DSC experiment.
Methods
Neodymium acetate (99%) from Sigma Aldrich was used for this work. Neodymium chloride and neodymium nitrate were synthesized by dissolving industrial grade of neodymium hydroxide in hydrochloric and nitric acids, respectively, and drying at 80 °C. Neodymium chloride hexahydrate (10 mmol, 3.6 g) and neodymium nitrate hexahydrate (10 mmol, 4.4 g) were dissolved in 50 mL of water each. To this Nd salt solution, 2.1 g NaF in 50 ml water (50 mmol) were added, and the contents were stirred at 25 °C for 6 h. We found that a slightly lower ratio yielded no NaNdF4, and a slightly higher ratio resulted in almost 100% NaNdF4 but required even more excess NaF. The resulting NaNdF4 precipitate was filtered, washed, and dried overnight at 80 °C in the air. To obtain dehydrated NaNdF4 product, the sample was heat treated at 500 °C for 3 h in air.
Structural analysis of the NaNdF4 product was performed by powder XRD using a Bruker D-8 X-ray diffractometer with Cu-Kα radiation. The XRD analysis was used to determine the phase constituents via the reference intensity ratio method with Match! Software (Version 3.15), and with Corundum as the reference. Simultaneous thermogravimetric analysis and differential scanning calorimetry (TGA-DSC) were performed using a STA449F1 system (Netzsch, Selb, Germany) with Al2O3 crucibles from 30 °C to 1050 °C. The temperature was scanned at 10 °C/min in ultra-high purity nitrogen gas flow (60 mL/min). Evolved gas analysis was performed using an Aeolos QMS 403D quadrupole mass spectrometer connected to the TGA furnace via a heated transfer line. Resublimed calcium prepared at Materials Preparation Center, Ames National Laboratory was used at a Ca: NaNdF4 ratio of ~2.6 to reduce the NaNdF4 to metals.
The reduction process was performed in a 0.75 × 5 × 1.2 (width × length × thickness) cubic inch tantalum crucible. A spun cap was welded at the bottom, and another loose spun cap was used as a lid. The tantalum crucible was placed in a quartz tube with a secondary quartz tube to retain the tantalum cap. The assembly was then suspended into an induction coil (Supplementary Fig. 1a), which was then heated from room temperature to 880 °C in 15 min. The reduction set-up was maintained under vacuum till 700 °C, and then backfilled with Ar to −100 mmHg (Supplementary Fig. 1b). The temperature was monitored with a two-color pyrometer until the coating obscured the view at ~880 °C (Supplementary Fig. 1c). The run continued for 23 min, following which an eruption of vapor and an induction heated plasma was observed. The induction power was terminated at this stage. The quartz tube was broken to bring out the sample. The contents were machined to remove the slag and tantalum to collect the neodymium metal (Supplementary Fig. 1d). The nitrogen and oxygen were analyzed with LECO-ON836 using 0.1 g of sample in a graphite crucible under helium atmosphere. The carbon and sulfur were analyzed using LECO-CS844 using 0.5 g of sample in an alumina crucible under an O2 atmosphere. The morphology of the fluoride samples was recorded using a FEI Teneo SEM.
The present study demonstrates the metallothermic reduction of fluoride salts to Nd metal, using NaNdF4 synthesized via a facile route that excludes the use of HF. The fluoride salts were synthesized through room-temperature reactions involving only an aqueous solvent. The elimination of HF in synthesizing the fluorides improves the operational safety of the process. Three different rare earth salts have been utilized as starting materials to demonstrate the versatility of the process. Results show that only water evolved from the salts during the heating process.
Supplementary information
Acknowledgements
This work was supported by the Critical Materials Innovation Hub funded by the U.S. Department of Energy, Office of Energy Efficiency and Renewable Energy, Advanced Materials and Manufacturing Technologies Office. The work was performed at Ames National Laboratory, operated for the U.S. Department of Energy by Iowa State University of Science and Technology under Contract No. DE-AC02-07CH11358.
Author contributions
A.K.: Data collection, Experimentation, Data analysis, Writing: original draft; H.P., T.R., and M.B.: Experimentation, Data analysis; D.P. and I.C.N.: Data analysis, Writing: review and editing, Supervision, Acquiring of funding.
Peer review
Peer review information
Nature Communications thanks the anonymous reviewers for their contribution to the peer review of this work. A peer review file is available.
Data availability
Data sets generated during the current study are available from the corresponding author upon request. Determination of an acceptable request and subsequent data provision are subject to Ames National Laboratory approval.
Competing interests
The authors declare the following competing interests. All authors are co-inventors on a related pending patent application entitled “preparation of rare earth metals with double salts”. (Patent Application No. 20250075359). Applicant: Iowa State University Research Foundation, Inc. (Ames, IA).
Footnotes
Publisher’s note Springer Nature remains neutral with regard to jurisdictional claims in published maps and institutional affiliations.
These authors contributed equally: Denis Prodius, Ikenna C. Nlebedim.
Supplementary information
The online version contains supplementary material available at 10.1038/s41467-025-59468-w.
References
- 1.Balaram, V. Rare earth elements: a review of applications, occurrence, exploration, analysis, recycling, and environmental impact. Geosci. Front.10, 1285–1303 (2019). [Google Scholar]
- 2.Elshkaki, A. Sustainability of emerging energy and transportation technologies is impacted by the coexistence of minerals in nature. Commun. Earth Environ.2, 1–13 (2021). [Google Scholar]
- 3.Filho, W. L. et al. Understanding rare earth elements as critical raw materials. Sustainability15, 1919 (2023). [Google Scholar]
- 4.Pawar, G. & Ewing, R. C. Recent advances in the global rare-earth supply chain. MRS Bull.47, 244–249 (2022). [Google Scholar]
- 5.Ormerod, J., Karati, A., Baghel, A. P. S., Prodius, D. & Nlebedim, I. C. Sourcing, refining and recycling of rare-earth magnets. Sustainability15, 14901 (2023). [Google Scholar]
- 6.Liao, C. et al. Research status of electrolytic preparation of rare earth metals and alloys in fluoride molten salt system: a mini review of China. Metals14, 407 (2024). [Google Scholar]
- 7.Vogel, H., Flerus, B., Stoffner, F. & Friedrich, B. Reducing greenhouse gas emission from the neodymium oxide electrolysis. Part I: analysis of the anodic gas formation. J. Sustain. Met.3, 99–107 (2017). [Google Scholar]
- 8.Vogel, H., Friedrich, B., Vogel, H. & Friedrich, B. Reducing greenhouse gas emission from the neodymium oxide electrolysis. Part II: basics of a process control avoiding PFC emission. Int. J. Nonferrous Metall.6, 27–46 (2017). [Google Scholar]
- 9.Cvetković, V. S. et al. Investigation on the electrochemical behaviour and deposition mechanism of neodymium in NdF3–LiF–Nd2O3 melt on Mo electrode. Metals10, 576 (2020). [Google Scholar]
- 10.Vogel, H., Friedrich, B., Scholz, H. & Franz, H. Development and research trends of the neodymium electrolysis—A literature review. In Production of non-ferrous metals – indispensable foundation for the industry and our prosperity; Proceedings of the 8th European Metallurgical Conference, Düsseldorf - Vol. 2, 689–702 (GDMB Verlag GmbH, 2015).
- 11.Vahidi, E. & Zhao, F. Assessing the environmental footprint of the production of rare earth metals and alloys via molten salt electrolysis. Resour. Conserv. Recycl.139, 178–187 (2018). [Google Scholar]
- 12.Zhu, H. Rare earth metal production by molten salt electrolysis. In Encyclopedia of Applied Electrochemistry (eds Kreysa, G., Ota, K.-i. & Savinell, R. F.) 1765–1772 (Springer, 2014).
- 13.Herget, C. Metallurgical ways to NdFeB alloys, permanent magnets from coreduced NdFeB. In Proceedings of the Eighth International Workshop on Rare-earth Magnets and Their Applications and the Fourth International Symposium on Magnetic Anisotropy and Coercivity in Rare Earth-Transition Metal Alloys 407–422 (University of Dayton, School of Engineering, 1985).
- 14.Ivanov, V. A., Dedyukhin, A. S., Polovov, I. B., Volkovich, V. A. & Rebrin, O. I. Fabrication of rare-earth metals by metallothermic reduction: thermodynamic modeling and practical realization. AIP Conf. Proc.2015, 020033 (2018). [Google Scholar]
- 15.Carlson, O. N., Schmidt, F. A. & Spedding, F. H. Preparation of yttrium metal by reduction of yttrium trifluoride with calcium (Ames Laboratory, 1956).
- 16.Spedding, F. H. & Daane, A. H. The Rare Earths (Wiley, 1961).
- 17.Brashear, D. R. & Zevenbergen, L. A. Preparation of enriched rare-earth metals by hydrofluorination and reduction. Nucl. Instrum. Methods Phys. Res. A438, 23–29 (1999). [Google Scholar]
- 18.Braun, J., Stöß, H. & Zober, A. Intoxication following the inhalation of hydrogen fluoride. Arch. Toxicol.56, 50–54 (1984). [DOI] [PubMed] [Google Scholar]
- 19.Bajraktarova-Valjakova, E. et al. Hydrofluoric acid: burns and systemic toxicity, protective measures, immediate and hospital medical treatment. Open Access Maced. J. Med. Sci.6, 2257 (2018). [DOI] [PMC free article] [PubMed] [Google Scholar]
- 20.Sanz-Gallén, P., Nogué, S., Munné, P. & Faraldo, A. Hypocalcaemia and hypomagnesaemia due to hydrofluoric acid. Occup. Med.51, 294–295 (2001). [DOI] [PubMed] [Google Scholar]
- 21.Stuke, L. E., Arnoldo, B. D., Hunt, J. L. & Purdue, G. F. Hydrofluoric acid burns: a 15-year experience. J. Burn Care Res.29, 893–896 (2008). [DOI] [PubMed] [Google Scholar]
- 22.Peters, D. & Miethchen, R. Symptoms and treatment of hydrogen fluoride injuries. J. Fluor. Chem.79, 161–165 (1996). [Google Scholar]
- 23.Zierold, C. D. & Chauviere, M. Hydrogen fluoride inhalation injury because of a fire suppression system. Mil. Med.177, 108–112 (2012). [DOI] [PubMed] [Google Scholar]
- 24.Lund, K., Ekstrand, J., Boe, J., Søstrand, P. & Kongerud, J. Exposure to hydrogen fluoride: an experimental study in humans of concentrations of fluoride in plasma, symptoms, and lung function. Occup. Environ. Med.54, 32–37 (1997). [DOI] [PMC free article] [PubMed] [Google Scholar]
- 25.Thoma, R. E., Insley, H. & Hebert, G. M. The sodium fluoride-lanthanide trifluoride systems. Inorg. Chem.5, 1222–1229 (1966). [Google Scholar]
- 26.Yang, S., Jayanthi, K., Anderko, A., Riman, R. E. & Navrotsky, A. Thermochemical investigation of the stability and conversion of nanocrystalline and high-temperature phases in sodium neodymium fluorides. Chem. Mater.33, 9571–9579 (2021). [Google Scholar]
- 27.Wang, X. et al. Single ultrasmall Mn2+-doped NaNdF4 nanocrystals as multimodal nanoprobes for magnetic resonance and second near-infrared fluorescence imaging. Nano. Res.11, 1069–1081 (2018). [Google Scholar]
- 28.Lu, S. et al. Multifunctional nano-bioprobes based on rattle-structured upconverting luminescent nanoparticles. Angew. Chem.54, 7915–7919 (2015). [DOI] [PubMed] [Google Scholar]
- 29.Gibson, A., Yang, S., Riman, R. E., Navrotsky, A. & Woodfield, B. F. Heat capacity and thermodynamic functions of sodium rare earth ternary fluorides. J. Chem. Thermodyn.188, 107154 (2024). [Google Scholar]
- 30.Huffine, C. L. & Williams, J. M. Refining and purification of rare-earth metals. Technical Report AECU-4426 (General Electric Co., Aircraft Nuclear Propulsion Dept., Cincinnati, OH, 1959). 10.2172/4213369.
- 31.Spedding, F. H. & Daane, A. H. Production of rare earth metals in quantity allows testing of physical properties. JOM6, 504–510 (1954). [Google Scholar]
Associated Data
This section collects any data citations, data availability statements, or supplementary materials included in this article.
Supplementary Materials
Data Availability Statement
Data sets generated during the current study are available from the corresponding author upon request. Determination of an acceptable request and subsequent data provision are subject to Ames National Laboratory approval.