

Abstract
To investigate whether time-restricted feeding (TRF) can alleviate cardiac remodeling in spontaneously hypertensive rats (SHRs) by regulating autophagy levels. A 16-week TRF intervention was conducted on Wistar Kyoto (WKY) rats and SHRs, with dietary intake confined to the interval from 9:00 am to 5:00 pm each day. The study examined the impact of TRF on blood pressure (BP), cardiac morphology and function, and the expression levels of key proteins involved in autophagy and its associated signaling cascades. Transmission Electron Microscopy (TEM) was utilized to further evaluate autophagic changes in left ventricular (LV) tissues. TRF significantly mitigated systolic blood pressure (SBP), diastolic blood pressure (DBP), and mean blood pressure (MBP) in SHRs. Additionally, TRF improved ejection fraction (EF) and diminished interventricular septal thickness at end-diastole (IVS-d). The study further revealed that TRF enhanced the expression of microtubule-associated protein-I light chain 3 (LC3-I), while reducing that of microtubule-associated protein-II light chain 3 (LC3-II). Moreover, TRF suppressed the expression levels of Beclin-1, phosphorylated phosphoinositide 3-kinase (p-PI3K), phosphorylated protein kinase B (p-AKT), and phosphorylated mechanistic target of rapamycin (p-mTOR) in the LV tissues. TEM analysis confirmed that TRF could inhibit autophagy levels in the LV tissues. TRF can attenuate cardiac remodeling in SHRs by regulating autophagy levels.
Supplementary Information
The online version contains supplementary material available at 10.1038/s41598-025-01587-x.
Keywords: Time-restricted feeding, Hypertension, Cardiac remodelling, Autophagy, Spontaneously hypertensive rats
Subject terms: Cardiology, Medical research
Introduction
Persistent high blood pressure (BP) can cause alterations in cardiac structure and function, leading to major adverse cardiac events (MACE), including heart failure and death. The primary detrimental effect of hypertension on the heart is the induction of ventricular remodeling1. Chronic elevation in BP increases the pressure load on the heart, reducing its compliance. This promotes the transformation of fibroblasts into myofibroblasts and leads to collagen deposition, resulting in myocardial fibrosis (MF) and substantial impairment of cardiac structure and function2,3. Studies have established that MF constitutes a significant pathological basis for triggering cardiac MACE events, with its severity being closely related to the development of MACE4,5. MF-induced heart failure, arrhythmia, and sudden cardiac death have increasingly become the predominant causes of cardiovascular disease mortality6,7. Recent findings have elucidated a close relationship between autophagy and hypertension, as well as the ensuing cardiac remodeling process8,9. Autophagy, a process wherein cells degrade their own components, plays a crucial role in maintaining normal metabolism and function of myocardial cells10,11. Notably, autophagy exerts a dual role in the cardiovascular system, potentially alleviating cell damage induced by environmental changes while also promoting active cell death under specific conditions12. Hence, the regulation of cardiac remodeling by autophagy is complex, potentially achieved by either enhancing autophagy to mitigate remodeling or by reducing autophagy to attain similar effects13–16. The phosphoinositide 3-kinase(PI3 K)/protein kinase B (AKT)/mechanistic target of rapamycin(mTOR) signaling plays a key role in regulating autophagy and has been implicated in cardiac remodeling17,18. This pathway influences essential cellular processes such as metabolism, survival, and autophagy, all of which are critical for maintaining the normal function of cardiomyocytes19. Consequently, both autophagy and this pathway are key targets in elucidating the molecular mechanisms underlying cardiac remodeling.
However, the effectiveness of drug treatment for hypertension is limited, and clinically, we are unable to achieve a complete cure for hypertension; instead, we can only control the progression of the condition. In recent years, dietary interventions for hypertension have garnered increasing attention20. Time-restricted feeding (TRF), a form of intermittent fasting (IF), represents a novel, healthy eating method. TRF entails confining daily eating to a window of 6 to 10 h, followed by a fasting period of at least 14 h21,22. Due to its more reasonable fasting duration compared to traditional dietary interventions, TRF has aroused great public interest23. Recent studies have demonstrated that TRF can effectively protect cardiovascular function by reducing serum triacylglycerol levels, inflammatory markers, BP, and atherogenic lipids in different animal models, without the necessity to specifically limit diet quality or quantity24. However, research on the relationship between TRF and cardiac remodeling induced by hypertension remains limited, and the underlying mechanism through which TRF lowers BP and improves cardiac remodeling is not yet fully understood. To our knowledge, this study is the first to elucidate the underlying mechanisms by which TRF improves cardiac remodeling in SHRs.
Our preliminary study25 have suggested that TRF may improve cardiac structure and function by modulating the renin-angiotensin system. However, the assessments of cardiac function and structure were not sufficiently detailed, and the potential mechanisms were not explored. Therefore, to address these gaps, we hypothesized that a 16-week TRF intervention could ameliorate cardiac remodeling in spontaneously hypertensive rats (SHRs) by regulating autophagy. This study aimed to investigate the effects of TRF on cardiac remodeling and autophagy in SHRs, thereby clarifying the underlying mechanisms of TRF-mediated cardioprotection in hypertension.
Methods and materials
Laboratory animals
24 SHRs and 24 Wistar-Kyoto (WKY) rats, aged 7 weeks and weighing 220–220 g, were selected as male subjects and met specific pathogen-free (SPF) standards. These rats were purchased from Beijing Huafukang Technology Co., Ltd., China, with the experimental animal license number SCXK (Beijing) 2019-0008. The rats were kept in a well-ventilated and hygienic animal facility, where the room temperature was maintained at (22 ± 2)°C, and the relative humidity was controlled to (60 ± 5)%. A 12-hour light/dark cycle was established. The experiment was initiated following an initial week of adaptive feeding for the animals.
Experiment protocols
After the adaptation phase, all WKY rats were randomly divided into the WKY-NON-FASTING group (n = 6) and the WKY-TRF group (n = 6) using a random number table method, while SHRs were divided into the SHR-NON-FASTING group (n = 6) and the SHR-NON-FASTING group (n = 6). Rats in the WKY-NON-FASTING and SHR-NON-FASTING groups had ad libitum access to food throughout the 16-week period. In contrast, the WKY-TRF and SHR-TRF groups underwent a 16-week TRF intervention, during which they were allowed to eat only during an 8-hour window from 9 am to 5 pm daily, mimicking typical human eating patterns without restricting food intake. All rats had free access to water and standard chow. This experimental protocol was approved by the Institutional Animal Care and Use Committee (IACUC) of Hebei Kangtai Medical Laboratory Services Co., Ltd., China, with approval number MDL2023-08–30-01. All experimental procedures adhered to the Animal Research: Reporting of In Vivo Experiments (ARRIVE) guidelines.
BP and heart rate (HR) levels measurement
At the beginning of the experiment and after the 16-week TRF intervention, BP and HR levels were assessed in each group using a non-invasive tail-cuff method. This assessment included systolic BP (SBP), diastolic BP (DBP), mean BP (MBP), and HR. BP and HR measurements were performed using a constant-temperature non-invasive BP measuring instrument (XH200, Beijing Zhongshi Dichuang Technology Development Co., Ltd, China) and a biological signal acquisition and processing system (MADLAB-4 C/501H, Beijing, China). During the measurement process, rats were initially placed in pre-warmed, constant-temperature cages, with the cage size optimized for comfort. The measuring device was then gently positioned on the rat’s tail, and data collection commenced once the animals had settled. The average value of three consecutive measurements was considered the final result and recorded for analysis.
Cardiac ultrasound
Cardiac structure and function in rats were assessed using an ultrasound system (D6LAB, VINNO Technology (Suzhou) Co., Ltd., China). Key parameters measured included interventricular septal thickness at end-diastole (IVS-d), left ventricular posterior wall thickness at end-diastole (LVPW-d), left ventricular end-diastolic diameter (LVID-d), and left ventricular ejection fraction (EF). For the procedure, an assistant anesthetized the rats and positioned them on the operating table. The operator proceeded to measure three consecutive cardiac cycles for each rat and recorded the final results for analysis.
Euthanasia and tissue collection
After the 16-week TRF intervention, all rats underwent a 6-hour fasting period. Thereafter, they were anesthetized with 1.25% tribromoethanol (150 mg/kg). Upon effective anesthesia, the rat’s thoracic cavity was accessed, and the heart was swiftly excised. Excess fluids were removed by aspiration, and the major blood vessels were carefully organized. The heart was then photographed for subsequent observation and analysis. Subsequently, the left ventricular (LV) tissues were separated. A portion of these LV tissues was fixed in 4% formaldehyde, embedded in paraffin, and sectioned into 4 μm-thick cross-sections using a microtome (RM2235, Leica, Germany) for staining analysis. Another part of the LV tissues was fixed in 2.5% glutaraldehyde and sliced to a thickness of 70 nm using an ultramicrotome (EM UC6, Leica, Germany) for transmission electron microscopy(TEM) observation. Finally, the remaining LV tissue was preserved at −80 °C for subsequent Western blotting experiments.
Hematoxylin & eosin (HE) and sirus red staining
HE staining was performed to observe the microstructure of myocardial cells. The distribution of type I and III collagen was investigated using Sirus red staining. The HE-stained sections were observed under an optical microscope (DM3000, Leica, Germany), whereas the Sirius red-stained sections were examined under a polarizing microscope (NPL-107 T, Novel, China). For both staining methods, three non-overlapping fields of view were selected for imaging and subsequent analysis.
Western blotting
Total protein was extracted from the LV tissue of each rat, and the protein concentration was measured using a BCA assay kit (MD913053, MDL, China). Subsequently, the protein samples were separated via SDS-PAGE gel electrophoresis (mini-PROTEAN® Tetra Cell with miniTrans-Blot® Module and PowerPac™ Universal Power Supply, BIO-Rad, USA). The separated proteins were then transferred onto a nitrocellulose (NC) membrane (1215458, GVS, USA). The membrane was sealed with blocking buffer and subsequently incubated with the following primary antibodies diluted at 4 °C. PI3 K (AF6241, 1:1000, Affinity, China), AKT (AF6261, 1:1000, Affinity, China), mTOR (AF6308, 1:1000, Affinity, China), p-PI3 K (AF3241, 1:1000, Affinity, China), p-AKT (AF0016, 1:1000, Affinity, China), p-mTOR (AF3308, 1:1000, Affinity, China), LC3(AF5402, 1:1000, Affinity, China), Beclin-1(AF5128, 1:1000, Affinity, China), and β-actin (AF7018, 1: 3000, Affinity, China) overnight. Following this, the membrane was incubated with the secondary antibody working solution at room temperature for 60 min. The membrane was then visualized and recorded using a chemiluminescence imaging system (ChemiScope6100, CLINX, China). Semi-quantitative analysis of the results was performed using ImageJ 1.53 software (NIH, USA).
Transmission electron microscopy
Following sample preparation, LV tissues were analyzed using a TEM (JEM-1230, JEOL, Japan) to observe autophagosomes. Images were captured at an accelerating voltage of 80 kV with a magnification of ×10,000.
Statistical analysis
Statistical analysis was performed using SPSS 28.0 software (IBM, USA). Data are presented as mean ± standard error of the mean. One-way analysis of variance (ANOVA) was employed for between-group comparisons, and the LSD test was used for within-group comparisons. Statistical significance was set at P < 0.05.
Results
Comparisons of BP and HR levels across 4 groups at the baseline and after the TRF intervention
Compared to both the WKY-NON-FASTING and WKY-TRF groups, the SHR-NON-FASTING group exhibited significantly higher HR and BP levels, including SBP, DBP, and MBP, at both baseline and after the TRF intervention (P < 0.001). Similarly, the HR and BP levels in the SHR-TRF group were significantly higher than those in the WKY-NON-FASTING and WKY-TRF groups (SBP, DBP and MBP: P < 0.001; HR: P < 0.01). However, compared to the SHR-NON-FASTING group, the SHR-TRF group showed a significant decrease only in BP levels after TRF intervention (P < 0.001), despite no significant difference in baseline HR and BP. No significant differences in HR and BP levels were observed between the WKY-NON-FASTING and WKY-TRF groups at baseline or after the TRF intervention (P > 0.05). These findings are shown in Table 1; Fig. 1.
Table 1.
Comparison of BP and HR levels between 4 groups at the baseline and the after TRF point.
| Group | SBP(mmHg) | DBP (mmHg) | MBP(mmHg) | HR(bpm) | ||||
|---|---|---|---|---|---|---|---|---|
| Baseline | After TRF | Baseline | After TRF | Baseline | After TRF | Baseline | After TRF | |
| WKY-NON-FASTING (n = 6) |
148.510± 3.849 |
120.873± 4.881 |
95.968± 7.918 |
97.079± 9.753 |
113.482± 4.779 |
106.571± 8.853 |
355.556 ± 8.371 | 355.444 ± 34.609 |
| WKY-TRF (n = 6) |
148.188± 11.498 |
122.137± 5.705 |
100.030± 8.595 |
99.815± 4.531 |
115.527± 8.07 |
108.583± 3.533 |
361.056 ± 27.112 | 349.056 ± 29.424 |
| SHR-NON-FASTING (n = 6) |
176.787± 13.192*& |
207.023± 6.269*& |
128.631± 5.214*& |
164.557± 8.041*& |
144.683± 6.198*& |
176.371± 5.540*& |
448.778 ± 39.508 | 482.833 ± 31.790 |
| SHR-TRF (n = 6) |
180.421± 9.010*& |
154.682± 6.371*&% |
134.036± 7.123*& |
120.851± 5.892*&% |
149.498± 6.869*& |
132.128± 4.767*&% |
450.944 ± 16.846 | 443.779 ± 43.011 |
*Compared with WKY-NON-FASTING group, P < 0.001; &: Compared with WKY-TRF group, P < 0.001; %: Compared with SHR-NON-FASTING group P < 0.001.
Fig. 1.

Comparison of BP and HR levels across 4 groups at the baseline and the after TRF point. (****: P < 0.001; **: P < 0.01; ns: No statistical difference, P > 0.05).
Comparisons of cardiac ultrasound results across 4 groups after the TRF intervention
Compared to both the WKY-NON-FASTING group (IVS-d: P < 0.01; LVPW-d & LVID-d: P < 0.05; LVEF: P < 0.001) and the WKY-TRF group (IVS-d & LVPW-d: P < 0.01; LVID-d: P < 0.05; LVEF: P < 0.001), the SHR-NON-FASTING group demonstrated significant increases in IVS-d, LVID-d, and LVPW-d, while LVEF significantly decreased. Conversely, the IVS-d level in the SHR-TRF group was significantly reduced, and LVEF was significantly elevated compared to the SHR-NON-FASTING group (IVS-d: P < 0.01; LVEF: P < 0.05). Additionally, LVEF in the SHR-TRF group was significantly lower compared to the WKY-NON-FASTING group (P < 0.05) and the WKY-TRF group (P < 0.01). No significant differences were observed in IVS-d, LVID-d, and LVPW-d between the SHR-TRF group and the WKY-NON-FASTING group, nor between the SHR-TRF group and the WKY-TRF group (P > 0.05). Similarly, there were no significant differences in IVS-d, LVID-d, LVPW-d, and LVEF between the WKY-NON-FASTING group and the WKY-TRF group (P > 0.05). These findings are shown in Table 2; Fig. 2.
Table 2.
Comparison of cardiac ultrasound results between 4 groups at the end of TRF intervention.
| Group | IVS-d (mm) | LVID-d (mm) | LVPW-d(mm) | LVEF(%) |
|---|---|---|---|---|
| WKY-NON-FASTING (n = 6) | 1.852 ± 0.527 | 6.126 ± 0.951 | 1.518 ± 0.115 | 78.971 ± 11.212 |
| WKY-TRF (n = 6) | 1.873 ± 0.361 | 6.169 ± 1.138 | 1.615 ± 0.177 | 84.538 ± 7.450 |
| SHR-NON-FASTING (n = 6) | 2.627 ± 0.291**&& | 7.946 ± 1.632*& | 2.153 ± 0.166*&& | 53.545 ± 7.570***&&& |
| SHR-TRF (n = 6) | 1.981 ± 0.282%% | 7.450 ± 0.691 | 1.766 ± 0.247 | 66.125 ± 6.498*&&% |
***: Compared with WKY-NON-FASTING group, P < 0.001; **: Compared with WKY-NON-FASTING group, P < 0.01; *: Compared with WKY-NON-FASTING group, P < 0.05; &&&: Compared with WKY-TRF group, P < 0.001; &&: Compared with WKY-TRF group, P < 0.01; &: Compared with WKY-TRF group, P < 0.05; %%: Compared with SHR-NON-FASTING group P < 0.01; %: Compared with SHR-NON-FASTING group P < 0.05.
Fig. 2.

Comparison of Cardiac Ultrasound parameters across 4 groups after TRF intervention (****: P < 0.001; **: P < 0.01*: P < 0.05; ns: No statistical difference, P > 0.05).
Comparisons of gross cardiac appearance and HE staining of LV tissues across 4 groups after the TRF intervention
Compared to the WKY-NON-FASTING and WKY-TRF groups, both the SHR-NON-FASTING and SHR-TRF groups exhibited significantly larger heart sizes. Notably, the heart size in the SHR-TRF group was smaller than that in the SHR-NON-FASTING group but still significantly larger than in the WKY-NON-FASTING and WKY-TRF groups. No significant difference in heart size was observed between the WKY-NON-FASTING and WKY-TRF groups. Histologically, the myocardial cells in the SHR-NON-FASTING group exhibited irregular morphology, blurred cell contours, disorganized arrangement, and a significant increase in cross-sectional area, suggesting severe myocardial hypertrophy. In contrast, the myocardial cells in the SHR-TRF group displayed more regular morphology, a more orderly arrangement, and clearer cell contours, accompanied by a slight reduction in cross-sectional area. The pathological characteristics of myocardial hypertrophy, such as cell enlargement and disorganization, were notably alleviated compared to the SHR-NON-FASTING group. These findings are shown in Figs. 3 and 4.
Fig. 3.

Gross Cardiac Appearance across 4 groups. (A: WKY-NON-FASTING Group; B: WKY-TRF Group; C: SHR-NON-FASTING Group; D: SHR-TRF Group).
Fig. 4.

HE staining in the LV tissues across 4 groups (A: WKY-NON-FASTING Group; B: WKY-TRF Group; C: SHR-NON-FASTING Group; D: SHR-TRF Group).
Comparisons of sirus red staining of LV tissues across 4 groups after the TRF intervention
Sirius red staining was used to distinguish between type I collagen (col-I) and type III collagen (col-III). In the WKY-NON-FASTING and WKY-TRF groups, minimal amounts of col-I (red/orange) and col-III (green) were observed, indicating negligible collagen deposition and no significant fibrosis. Conversely, the SHR-NON-FASTING group exhibited a marked increase in both col-I and col-III content, with notable collagen fiber aggregation and prominent MF. The SHR-TRF group exhibited a significant reduction in col-I and col-III content compared to the SHR-NON-FASTING group, although some collagen fiber aggregation persisted. These results indicate a partial alleviation of MF in the SHR-TRF group. These findings are shown in Fig. 5.
Fig. 5.

Sirus red staining in the LV tissues across 4 groups (A: WKY-NON-FASTING Group; B: WKY-TRF Group; C: SHR-NON-FASTING Group; D: SHR-TRF Group).
Comparisons of Beclin-1, microtubule-associated protein-I light chain 3 (LC3-I) and microtubule-associated protein-II light chain 3(LC3-II) expression levels across 4 groups after the TRF intervention
The expression levels of Beclin-1 and LC3-II were significantly higher in the SHR-NON-FASTING group compared to those in the WKY-NON-FASTING and WKY-TRF groups (P < 0.001). The SHR-TRF group exhibited significantly lower expression levels of these proteins compared to those in the SHR-NON-FASTING group (Beclin-1: P < 0.001; LC3-II: P < 0.01), although they remained significantly higher than those in the WKY-NON-FASTING and WKY-TRF groups (P < 0.001). Additionally, LC3-I expression was significantly lower in the SHR-NON-FASTING group compared to that in the WKY-NON-FASTING and WKY-TRF groups (P < 0.001). In the SHR-TRF group, LC3-I expression was significantly lower than that in the SHR-NON-FASTING group (P < 0.01), yet it was still significantly higher than that in the WKY-NON-FASTING group (P < 0.05) and the WKY-TRF group (P < 0.01). No significant differences in Beclin-1, LC3-I, and LC3-II expression were observed between the WKY-NON-FASTING and WKY-TRF groups (P > 0.05). These findings are shown in Table 3; Fig. 6.
Table 3.
Comparison of Beclin-1, LC3-I and LC3-II expression between 4 groups after intervention.
| Group | Beclin−1 expression level | LC3-I expression level | LC3-II expression level |
|---|---|---|---|
| WKY-NON-FASTING(n = 6) | 0.534± 0.045 | 0.366± 0.042 | 0.373± 0.039 |
| WKY-TRF(n = 6) | 0.507± 0.025 | 0.372± 0.038 | 0.345± 0.040 |
| SHR-NON-FASTING(n = 6) | 0.826± 0.068**&& | 0.210± 0.027**&& | 0.668± 0.040**&& |
| SHR-TRF(n = 6) | 0.724 ± 0.044**&&% | 0.292 ± 0.043*&% | 0.538 ± 0.041**&&%% |
**Compared with WKY-NON-FASTING Group, P < 0.001; *: Compared with WKY-NON-FASTING group, P < 0.05;.
&&Compared with WKY-TRF group, P < 0.001; &: Compared with WKY-TRF group, P < 0.01;.
%%Compared with SHR-NON-FASTING group, P < 0.001; %: Compared with SHR-NON-FASTING group, P < 0.01;.
Fig. 6.
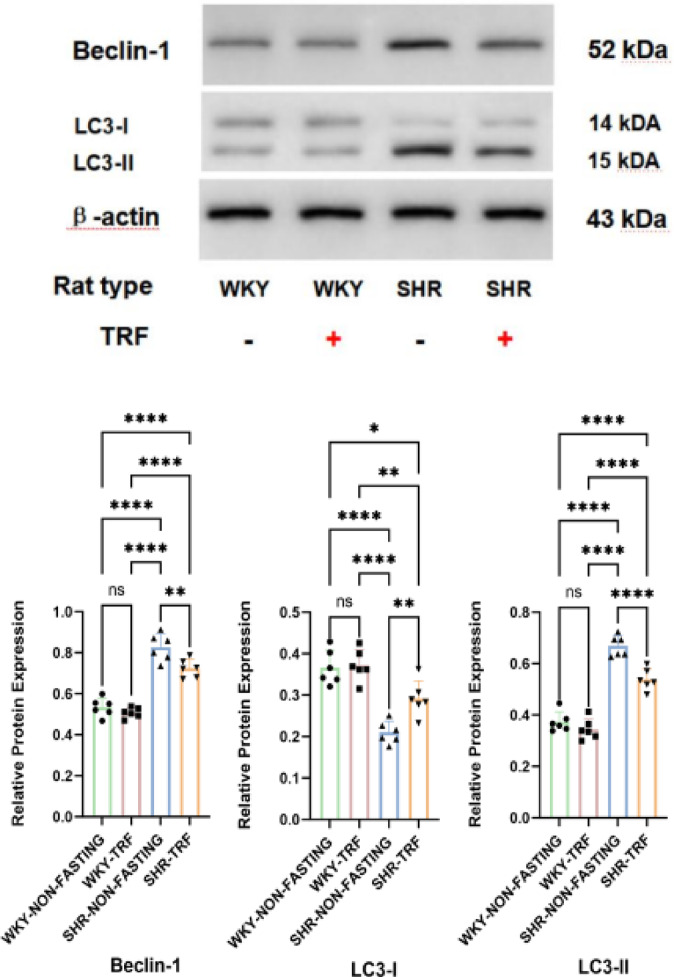
Comparison of Beclin-1, LC3-I and LC3-II expression across 4 groups after TRF intervention (****: P < 0.001; **: P < 0.01; *: P < 0.05; ns: No statistical difference, P > 0.05).
Comparisons of PI3 K/p-PI3 K, AKT/p-AKT, and mTOR/p-mTOR expression levels across 4 groups after the TRF intervention
The expression levels of p-PI3 K, p-AKT, and p-mTOR were significantly higher in the SHR-NON-FASTING group compared to those in the WKY-NON-FASTING and WKY-TRF groups (P < 0.001). These levels were significantly decreased in the SHR-TRF group compared to those in the SHR-NON-FASTING group (p-PI3 K: P < 0.001; p-AKT & p-mTOR: P < 0.05). Despite these decreases, the levels of p-PI3 K, p-AKT, and p-mTOR in the SHR-TRF group remained significantly higher than those in the WKY-TRF group (p-PI3 K: P < 0.001; p-AKT & p-mTOR: P < 0.01). Notably, the expression level of p-PI3 K in the SHR-TRF group was significantly higher than that in the WKY-TRF group (P < 0.001). Furthermore, there was no significant difference in the expression levels of p-PI3 K, p-AKT, and p-mTOR between the WKY-NON-FASTING and WKY-TRF groups (P > 0.05). When compared to the WKY-NON-FASTING group, there was no significant difference in the expression levels of p-AKT and p-mTOR in the SHR-TRF group (P > 0.05). No significant differences were observed in the expression levels of PI3 K, AKT, and mTOR among the four groups (P > 0.05). These findings are shown in Tables 4 and 5, and Fig. 7.
Table 4.
Comparison of PI3 K, AKT and mTOR expression between 4 groups after TRF intervention.
| Group | PI3 K expression level | AKT expression level | mTOR expression level |
|---|---|---|---|
| WKY-NON-FASTING(n = 6) | 0.556± 0.048 | 0.472± 0.054 | 0.358± 0.041 |
| WKY-TRF(n = 6) | 0.557± 0.041 | 0.480± 0.038 | 0.344± 0.035 |
| SHR-NON-FASTING(n = 6) | 0.569± 0.039 | 0.474± 0.027 | 0.357± 0.045 |
| SHR-TRF(n = 6) | 0.556 ± 0.026 | 0.487 ± 0.035 | 0.373 ± 0.028 |
Table 5.
Comparison of p-PI3 K, p-AKT and p-mTOR expression between 4 groups after TRF intervention.
| Group | p-PI3 K expression level | p-AKT expression level | p-mTOR expression level |
|---|---|---|---|
| WKY-NON-FASTING(n = 6) | 0.402± 0.043 | 0.618± 0.099 | 0.543± 0.106 |
| WKY-TRF(n = 6) | 0.379± 0.036 | 0.545± 0.122 | 0.466± 0.058 |
| SHR-NON-FASTING(n = 6) | 0.788± 0.028**&& | 0.903± 0.057**&& | 0.848± 0.110**&& |
| SHR-TRF(n = 6) | 0.677 ± 0.042**&&%% | 0.735 ± 0.074&% | 0.669 ± 0.087&% |
**Compared with WKY-NON-FASTING Group, P < 0.001; *: Compared with WKY-NON-FASTING group, P < 0.05; &&: Compared with WKY-TRF group, P < 0.001; &: Compared with WKY-TRF group, P < 0.01;.
%%Compared with SHR-NON-FASTING group, P < 0.001; %: Compared with SHR-NON-FASTING group, P < 0.05;.
Fig. 7.

Comparison of PI3 K/p-PI3 K, AKT/p-AKT and mTOR/p-mTOR expression across 4 groups after TRF intervention (****: P < 0.001; **: P < 0.01; *: P < 0.05; ns: No statistical difference, P > 0.05).
Comparisons of autophagosome formation in LV tissues across 4 groups observed by TEM
TEM revealed significantly enhanced autophagic activity in LV tissues from the SHR-NON-FASTING group, characterized by the presence of giant autophagosomes alongside multiple smaller autophagic vesicles. These morphological features suggest a markedly elevated autophagic flux under hypertensive conditions. In contrast, the SHR-TRF group also exhibited numerous autophagic vesicles; however, these were smaller in size, and no large autophagosomes were observed. Although autophagic activity was still apparent, it was less pronounced compared to the SHR-NON-FASTING group. These findings suggest that TRF intervention mitigates the excessive autophagic response associated with hypertensive pathology, potentially restoring autophagic homeostasis in myocardial tissue. In both WKY groups, intact and well-preserved mitochondrial structures were observed, with clearly defined membranes and densely packed cristae. No mature autophagosomes were detected, indicating low autophagic flux under normotensive conditions. These findings are shown in Fig. 8.
Fig. 8.

Autophagosome formation in the LV tissues across 4 groups observed by TEM. (A: WKY-NON-FASTING Group; B: WKY-TRF Group; C: SHR-NON-FASTING Group; D: SHR-TRF Group).
Discussion
Hypertension remains a significant global public health concern, affecting numerous patients and contributing to high incidence and mortality rates that have yet to be fully addressed. Prolonged elevated BP not only impairs cardiac structure and function but also results in various serious complications26,27. Unfortunately, the underlying mechanisms of hypertension are still unclear, and disease progression is primarily managed through pharmacological interventions and other approaches. However, recent research has highlighted the crucial role of a healthy diet in managing and preventing hypertension28. Therefore, effective management of hypertension and its associated cardiac remodeling remains a significant challenge in current clinical treatment. Many dietary interventions often require strict restrictions on nutrient intake, which can lead to poor patient compliance. TRF, an innovative form of IF, offers a new solution to these challenges. TRF confines daily food intake to a window of 6 to 10 h, followed by a fasting period of at least 14 h29,30. Compared to traditional dietary interventions, TRF features a shorter fasting duration, making it more acceptable to the general public and garnering widespread attention31. Recent research progress is promising, demonstrating that TRF can reduce serum triglycerides and inflammatory markers, potentially regulate BP and atherogenic lipid levels, and protect cardiovascular function. Importantly, TRF does not necessitate strict limitations on diet quality or quantity in animal models32.
To evaluate the effects of TRF on hypertensive cardiac remodeling, we initially measured the rats’ BP both before and after the intervention. The results indicate that, prior to the intervention, BP levels in all SHRs were significantly elevated compared to those in the control group. Notably, the BP levels in both the SHR-NON-FASTING group and the SHR-TRF group were nearly identical before the initiation of TRF. After a 16-week period of TRF intervention, we observed a significant reduction in BP among the SHRs that underwent TRF. Although their BP values remained higher than those of the WKY rats, they were significantly lower than those of the SHRs who did not receive the TRF intervention. These findings suggested that TRF effectively mitigated SBP, DBP, and MBP in SHRs. While TRF did not normalize these pressures, its antihypertensive effects cannot be disregarded.Our study also found that the HR of SHRs was significantly higher than that of WKY rats, which aligns with the basic pathological changes of hypertension. However, TRF intervention did not significantly reduce the heart rate of SHR rats. Previous studies have shown that IF can modulate autonomic function in mice by reducing sympathetic activity and increasing parasympathetic activity, thereby exerting an antihypertensive effect3. This differs from our findings, which may be due to the fact that HR can only serve as a rough indicator of autonomic nervous system (ANS) activity and does not accurately reflect the full extent of ANS function. Alternatively, the specific pathological state of SHRs may explain the discrepancy. In the context of spontaneous hypertension, the heart and vascular systems of these rats have already adapted to a higher level of sympathetic activation. Therefore, although BP improves, the HR may not show significant changes. Additionally, Although several animal studies have confirmed that IF exerts substantial BP-lowering effects across various animal models33–36, the underlying mechanisms are multifactorial.TRF may lower BP through other pathways, including the renin-angiotensin-aldosterone system (RAS), insulin resistance, and gut microbiota composition25,37,38. These factors are potential reasons for the observed differences.However, the efficacy of different IF intervention methods may vary depending on the specific model and experimental conditions. For instance, a study employing alternate-day fasting (ADF) for four weeks successfully restored BP to normal levels in stroke-prone SHRs39. This suggests that the antihypertensive effect of IF could be influenced by multiple factors, including the mode of intervention, duration, and intensity. Additionally, the pathogenesis of hypertension differs among different animal models, which may also impact the intervention outcomes.
To further assess the structure and function of the heart and to elucidate the specific effects of TRF intervention on cardiac remodeling, we employed a comprehensive evaluation approach, including heart size measurement, cardiac ultrasound analysis, and pathological staining. Firstly, we found that the hearts of SHRs not receiving TRF intervention were significantly larger than those of WKY rats. Cardiac ultrasound analysis corroborated this, showing notable increases in IVS-d, LVID-d, and LVPW-d, along with a reduction in LVEF. Additionally, pathological staining revealed myocardial cell enlargement and the deposition of col-I and col-III in SHRs. These results indicate that, by 24 weeks of age, SHRs without TRF intervention had gradually experienced the failure of their cardiac compensation mechanisms and had entered the decompensated phase of hypertensive cardiac remodeling. Our findings reveal that, following TRF intervention, there were no significant alterations in the overall appearance of the heart in SHRs, as corroborated by cardiac ultrasound analysis. Specifically, LVID-d remained similar between the SHR-TRF and SHR-NON-FASTING groups, suggesting that TRF intervention did not alleviate cardiac dilation. For LVPW-d, we observed a certain degree of reduction in the SHR-TRF group compared to the SHR-NON-FASTING group, although the difference did not reach statistical significance. This may be due to the small sample size or the limited effect of TRF intervention on cardiac structure. Furthermore, although TRF effectively lowered the BP levels in SHRs, it did not reduce it to normal levels, and the SHRs still experienced elevated pressure load on the heart, which may also explain why these two parameters did not show significant changes. However, it is noteworthy that IVS-d was reduced in the SHR-TRF group, and LVEF was significantly higher compared to the SHR-NON-FASTING group. In the pathological process of hypertensive cardiac remodeling, the interventricular septum is often the first and most affected region40. Therefore, it may be more sensitive to changes in BP levels. Collectively, these data suggest that TRF intervention can alleviate myocardial hypertrophy induced by hypertension, reduce myocardial hypertrophy to some extent, but does not significantly improve cardiac dilation, and effectively improve cardiac function. In contrast, HE staining revealed that TRF intervention led to a slight reduction in the cross-sectional area of myocardial cells in SHRs, suggesting a subtle histological improvement at the cellular level that may not be readily detected through cardiac ultrasound imaging alone. This change highlights the potential cellular benefits of TRF in mitigating myocardial hypertrophy. Additionally, the assessment of col-I and col-III distribution in the LV tissue via Sirius red staining revealed that both col-I and col-III were significantly elevated in SHRs without TRF intervention, indicating pronounced MF. However, following TRF intervention, the deposition of collagen fibers was notably reduced, further emphasizing the potential of TRF in alleviating MF induced by hypertension. Collectively, these histological findings underscore the therapeutic efficacy of TRF in addressing myocardial hypertrophy and fibrosis in SHRs. Specifically, the reduction in in the cross-sectional area of myocardial cells observed through HE staining suggests a reduction in the extent of hypertrophy, while the alleviation of fibrosis confirmed by Sirius red staining further supports the hypothesis that TRF may effectively counteract the changes in myocardial structure and function caused by hypertension. Integrating these two histological markers, TRF emerges as a promising intervention strategy for mitigating hypertensive cardiac remodeling.
Finally, our study focused on evaluating the effects of TRF on autophagy levels and the activity of autophagy-related pathways in the LV myocardium of SHRs. The aim was to comprehensively understand the specific role of TRF in autophagy and to explore its potential mechanisms in alleviating hypertension-induced cardiac remodeling. Autophagy plays multiple roles in the cardiovascular system, serving as a protective mechanism to help cells cope with stress and damage, and potentially promoting cell death under certain conditions, making it a double-edged sword41. The intimate relationship between autophagy levels and MF cannot be overlooked9. Numerous investigations have corroborated that precise modulation of autophagy via various drugs or botanical extracts can diminish myocardial injury and significantly improve cardiac function, effectively combating MF14,15,42. Additionally, fluctuations in autophagy levels may play a crucial role in the progression of heart disease43,44. In the realm of autophagy research, microtubule-associated protein light chain 3 (LC3) and Beclin-1 are established as the two principal biomarkers of autophagic vesicles, extensively utilized to assess the overall level of cellular autophagy activity. LC3 exists in two forms: LC3-I and LC3-II. LC3-I is predominantly localized in the cytoplasm. During autophagy activation and autophagic vesicle formation, LC3-I can undergo ubiquitination modification mediated by autophagy-related gene (ATG) 3, binding tightly to phosphatidylethanolamine (PE) on the surface of autophagic vesicles and converting into LC3-II. Owing to its localization on the outer membrane of autophagosomes, the expression level of LC3-II exhibits a linear positive correlation with the number of autophagic vesicles45,46. Furthermore, Beclin-1, a key regulatory protein of autophagy, plays a pivotal role in recruiting autophagy-related proteins to the bilayer membrane structure, thereby facilitating autophagy initiation and vesicle formation47. The autophagy process can be divided into two stages. The first stage involves the binding of PE to LC3, a reaction facilitated by the activation of ATG7, ATG10, and ATG4. This binding event catalyzes the conversion of LC3 from its cytoplasmic LC3-I form to the LC3-II form, which subsequently associates with the autophagic vesicle membrane. The second stage involves the covalent conjugation of ATG12 and ATG5. Under the activation of ATG7 and ATG10, ATG5 is linked to ATG12, forming a non-covalent complex with ATG16, known as the ATG12-ATG5-ATG16 complex48. This complex is instrumental in autophagy, as it facilitates the recruitment of LC3-II and promotes the expansion of autophagosome membranes, thereby encapsulating intracellular degradation substrates and ultimately forming the bilayer membrane structure of autophagosomes. After the formation of autophagosomes, the ATG12-ATG5-ATG16 complex detaches from the autophagosome membrane, while LC3-II remains attached to the membrane43. Consequently, detecting the levels of LC3-I, LC3-II, and Beclin-1 can effectively elucidate the autophagy status within biological cells. In this study, in comparison to WKY rats, SHRs exhibited a significant increase in the levels of LC3-II and Beclin-1, accompanied by a marked decrease in LC3-I levels. These findings suggest that overactivation of autophagy may serve as one of the initiating factors for hypertension and cardiac remodeling in SHRs. Additionally, SHRs subjected to TRF intervention exhibited a significant decrease in autophagy levels, which may constitute one of the mechanisms through which TRF attenuates cardiac remodeling. In line with these observations, our TEM findings also provided morphological evidence of autophagy dysregulation. The presence of a giant autophagosome in the SHR-NON-FASTING group not only reflects markedly elevated autophagic activity but may also indicate impaired autophagic clearance, possibly due to disruptions in autophagosome-lysosome fusion or lysosomal dysfunction. This accumulation suggests dysregulated autophagic flux rather than a purely adaptive increase, underscoring the pathological burden on cardiomyocytes under hypertensive stress. In contrast, SHRs receiving TRF intervention exhibited a moderate number of autophagosomes in LV tissues, although these structures were smaller than those in the SHR-NON-FASTING group. This observation suggests that TRF may partially suppress excessive autophagic activation under hypertensive conditions. The absence of oversized autophagosomes may reflect improved autophagosome turnover, possibly through enhanced autophagosome–lysosome fusion efficiency or restored lysosomal degradative capacity. Thus, it is plausible that TRF modulates autophagic flux not by completely suppressing autophagy, but by promoting a more balanced autophagic process, preventing pathological accumulation of autophagosomes and preserving cellular homeostasis. Nevertheless, further investigation is required to confirm this. The regulation of autophagy levels is affected by multiple signaling pathways, with the PI3 K/AKT/mTOR pathway being the most critical. This pathway is involved in regulating cell cycle progression, metabolism, gene transcription, and other cellular functions, and it represents the primary classical signaling pathway that modulates autophagy levels49,50. Activation of the PI3 K/AKT/mTOR pathway can promote the upregulation of mTOR expression levels, and mTOR exerts its inhibitory effect on autophagy by inactivating autophagy-related genes51. However, our study revealed that in non-SHR myocardial tissue, there was a concurrent increase in autophagy levels and upregulation of AKT pathway expression. Furthermore, in SHRs subjected to TRF intervention, both cardiac autophagy levels and PI3 K/AKT/mTOR pathway activity decreased simultaneously once again. Normally, the PI3 K/AKT/mTOR pathway serves as the primary inhibitory pathway for autophagy, and its activation usually leads to the inhibition of autophagy. However, a study by Wang52 also arrived at similar findings, demonstrating that autophagy levels and PI3 K/AKT/mTOR pathway activity increased simultaneously in cardiac tissues of SHRs. This may be attributed to the intricate regulatory mechanisms in hypertension, wherein the organism could activate alternative pathways such as AMP-activated protein kinase (AMPK) or the p53 tumor suppressor protein to stimulate autophagy and protect cells from damage. Despite the activation of the PI3 K/AKT/mTOR pathway, autophagy can still be upregulated through other signaling pathways. Under specific circumstances, the activation of the PI3 K/AKT/mTOR pathway may trigger a negative feedback mechanism, thereby activating autophagy-related factors and enhancing autophagy levels. For example, even when the PI3 K/AKT/mTOR pathway is activated, AMPK can still sense the energy status of cells and promote autophagy by inhibiting mTOR. This phenomenon may be related to the unique pathological state of SHR hypertension, which can lead to special adaptive changes in myocardial or vascular cells. These adaptive changes may promote the upregulation of autophagy as a protective cellular response, aiding in the clearance of damaged organelles and proteins and maintaining intracellular homeostasis. The level of autophagy in the heart varies under different pathological conditions, and both excessive and insufficient autophagy can impact cardiac function and structure. For example, Liu et al.13 found that curcumin attenuated isoproterenol-induced MF in rats by inhibiting autophagy. Conversely, a study on a mouse model of myocardial infarction showed that alginate inhibited MF after infarction by increasing autophagy levels, thereby promoting improvements in cardiac remodeling53. These interventions effectively maintain cardiac autophagy homeostasis and alleviate pathological changes by modulating autophagy levels. In this study, TRF intervention significantly reduced autophagy levels and inhibited the PI3 K/AKT/mTOR pathway, which may underlie the improvement in cardiovascular health. By simultaneously reducing excessive autophagy and activating the PI3 K/AKT/mTOR pathway, TRF may help increase BP levels, improve cardiac structure and function, and alleviate MF. This dual regulatory mechanism may play a critical role in mitigating cardiac pathological changes, promoting cardiovascular stability, and enhancing myocardial function. However, the relationship between autophagy, PI3 K/AKT/mTOR signaling, and cardiovascular function is complex, and the specific mechanisms depend on different contexts. Although the results suggest that TRF has a positive role in regulating these pathways, the long-term effects and potential side effects of modulating autophagy and PI3 K/AKT/mTOR activity in a chronic hypertensive environment need further exploration. Future studies should investigate the balance between autophagy inhibition and activation at different stages of disease progression, as both excessive and insufficient autophagy may have negative effects on cardiac health. Additionally, this study revealed that TRF had no significant effect on autophagy in the hearts of normal WKY rats, suggesting that TRF intervention may only modulate abnormal autophagy levels in the heart and not affect normal autophagy status. This further suggests that the regulation of cardiac autophagy by TRF is not limited to simple activation or inhibition, but is dynamically regulated at appropriate autophagy targets based on the pathological state of the organism to maintain cardiovascular stability.
Furthermore, while our current analyses primarily focused on cardiomyocytes (CMs), and autophagy-related markers were assessed at the LV tissues level, emerging evidence suggests that other cardiac cell types, such as cardiac fibroblasts (CFs) and endothelial cells, also play indispensable roles in the pathogenesis of cardiac remodeling54. CFs, in particular, are key regulators of extracellular matrix (ECM) deposition and fibrosis, with their activation contributing significantly to adverse structural changes following cardiac stress55,56. Autophagy in CFs has emerged as a critical factor in fibroblast proliferation, differentiation, and fibrotic responses, and has been closely associated with cardiac remodelling57. Therefore, whether TRF exerts similar autophagic regulation in CFs remains to be elucidated. This is particularly relevant given that CFs may respond differently to metabolic or circadian interventions. Future investigations using cell-type-specific approaches, such as immunofluorescence co-staining or fluorescence-activated cell sorting (FACS) coupled with autophagy assays, would enable a more precise delineation of TRF’s cell-specific effects. Additionally, non-myocyte populations, including endothelial cells and macrophages, are also integral to cardiac remodeling through their regulation of vascular homeostasis, inflammation, and tissue repair. Notably, these cell types have been shown to undergo autophagic regulation in cardiovascular disease contexts58,59, suggesting that TRF may also modulate angiogenic, inflammatory, or reparative processes via autophagy in these non-cardiomyocyte populations. Taken together, these insights underscore the importance of future studies aimed at elucidating the cell-type-specific effects of TRF on autophagy, particularly in CFs, endothelial cells, and macrophages, to achieve a more comprehensive understanding of its regulatory role in cardiac remodeling.
Our study highlights the significant potential of TRF as a non-pharmacological intervention for managing hypertension and cardiac remodeling in animal models. TRF, which involves an 8-hour feeding window from 9 am to 5 pm, aligns well with typical human daily routines. Unlike other intermittent fasting regimens, such as ADF, TRF offers a shorter fasting duration, thereby enhancing its feasibility and acceptability in clinical settings. Future studies could explore the potential of further reducing the fasting window or alternating TRF schedules to minimize fasting time while optimizing patient adherence. However, it is important to note that TRF may not be suitable for hypertensive patients with diabetes who require insulin injections, as they need to consume food post-injection. Additionally, future research should consider potential species-specific differences between animal models and human patients. While TRF shows promise for broader clinical applications, further studies are essential to assess its efficacy and safety across diverse populations with varying clinical conditions.
To our knowledge, this study represents the first investigation to concurrently examine the effects of TRF on hypertension-induced cardiac remodeling and its impact on cardiac autophagy levels. Our findings indicate that TRF can effectively inhibit cardiac remodeling caused by hypertension, a phenomenon potentially linked to its regulatory impact on cardiac autophagy. Nonetheless, this study is not without its limitations. Firstly, the investigation did not employ activators or inhibitors of autophagy and its related pathways, thereby precluding a more precise elucidation of the specific interrelationships among these factors. Secondly, no intervention trials were conducted in conjunction with other pharmacological agents. Finally, the study did not include other dietary interventions or control groups with established treatments, making it challenging to comprehensively assess the comparative efficacy of TRF against existing therapeutic strategies. These limitations not only underscore the constraints of this study but also offer crucial insights and directions for future studies.
Electronic supplementary material
Below is the link to the electronic supplementary material.
Acknowledgements
Not applicable.
Author contributions
Xin Yi and Jiaxu An performed the experiments and analyzed the data. Xin Yi, Canzhang Liu and Jie Yan performed the animal experiments. Razif Abas, Raja Abdul Wafy Raja Muhammad Rooshdi and Ummi Nadira Daut designed the whole experiments, analyzed the data and gave final approval of the version to be published. All authors read and approved the final manuscript.
Funding
Not applicable.
Data availability
The datasets used and/or analyzed during the current study are available from the corresponding author on reasonable request.
Declarations
Competing interests
The authors declare no competing interests.
Consent for publication
Not applicable.
Footnotes
Publisher’s note
Springer Nature remains neutral with regard to jurisdictional claims in published maps and institutional affiliations.
References
- 1.Di Palo, K. E. & Barone, N. J. Hypertension and heart failure: prevention, targets, and treatment. Cardiol. Clin.40 (2), 237–244. 10.1016/j.ccl.2021.12.011 (2022). [DOI] [PubMed] [Google Scholar]
- 2.Frangogiannis, N. G. Cardiac fibrosis. Cardiovascular. Res.117 (6), 1450–1488. 10.1093/cvr/cvaa324 (2021). [DOI] [PMC free article] [PubMed] [Google Scholar]
- 3.Nwabuo, C. C. & Vasan, R. S. Pathophysiology of hypertensive heart disease: beyond left ventricular hypertrophy. Curr. Hypertens. Rep.22 (2), 11. 10.1007/s11906-020-1017-9 (2020). [DOI] [PubMed] [Google Scholar]
- 4.Hughes, A. et al. Myocardial fibrosis and prognosis in heart transplant recipients. Circ. Cardiovasc. Imaging. 12 (10), e009060. 10.1161/CIRCIMAGING.119.009060 (2019). [DOI] [PMC free article] [PubMed] [Google Scholar]
- 5.Yang, Z. et al. Association of myocardial fibrosis detected by late gadolinium-enhanced MRI with clinical outcomes in patients with diabetes: a systematic review and meta-analysis. BMJ Open.12 (1), e055374. 10.1136/bmjopen-2021-055374 (2022). [DOI] [PMC free article] [PubMed] [Google Scholar]
- 6.Aune, D., Huang, W., Nie, J. & Wang, Y. Hypertension and the Risk of All-Cause and Cause-Specific Mortality: An Outcome-Wide Association Study of 67 Causes of Death in the National Health Interview Survey. BioMed research international, 2021, 9376134. (2021). 10.1155/2021/9376134 [DOI] [PMC free article] [PubMed]
- 7.Iyer, N. R. et al. Markers of focal and diffuse nonischemic myocardial fibrosis are associated with adverse cardiac remodeling and prognosis in patients with hypertension: the REMODEL study. Hypertens. (Dallas Tex. : 1979). 79 (8), 1804–1813. 10.1161/HYPERTENSIONAHA.122.19225 (2022). [DOI] [PMC free article] [PubMed] [Google Scholar]
- 8.Ma, Y. et al. Mitophagy in hypertension-mediated organ damage. Front. Cardiovasc. Med.10, 1309863. 10.3389/fcvm.2023.1309863 (2024). [DOI] [PMC free article] [PubMed] [Google Scholar]
- 9.Lu, C., Yang, Y., Zhu, Y., Lv, S. & Zhang, J. An Intervention Target for Myocardial Fibrosis: Autophagy. BioMed research international, 2018, 6215916. (2018). 10.1155/2018/6215916 [DOI] [PMC free article] [PubMed]
- 10.Sciarretta, S., Maejima, Y., Zablocki, D. & Sadoshima, J. The role of autophagy in the heart. Annu. Rev. Physiol.80, 1–26 (2018). [DOI] [PubMed] [Google Scholar]
- 11.Yamaguchi, O. Autophagy in the heart. Circulation Journal: Official J. Japanese Circulation Soc.83 (4), 697–704. 10.1253/circj.CJ-18-1065 (2019). [DOI] [PubMed] [Google Scholar]
- 12.Tian, X. et al. MicroRNA-199a-5p aggravates primary hypertension by damaging vascular endothelial cells through Inhibition of autophagy and promotion of apoptosis. Experimental Therapeutic Med.16 (2), 595–602. 10.3892/etm.2018.6252 (2018). [DOI] [PMC free article] [PubMed] [Google Scholar]
- 13.Liu, R. et al. Curcumin alleviates isoproterenol-induced cardiac hypertrophy and fibrosis through Inhibition of autophagy and activation of mTOR. Eur. Rev. Med. Pharmacol. Sci.22 (21), 7500–7508. 10.26355/eurrev_201811_16291 (2018). [DOI] [PubMed] [Google Scholar]
- 14.Li, Q. et al. AMPK-mediated cardioprotection of Atorvastatin relates to the reduction of apoptosis and activation of autophagy in infarcted rat hearts. Am. J. Translational Res.8 (10), 4160–4171 (2016). [PMC free article] [PubMed] [Google Scholar]
- 15.Zhang, Z. et al. Sulforaphane prevents the development of cardiomyopathy in type 2 diabetic mice probably by reversing oxidative stress-induced Inhibition of LKB1/AMPK pathway. J. Mol. Cell. Cardiol.77, 42–52. 10.1016/j.yjmcc.2014.09.022 (2014). [DOI] [PubMed] [Google Scholar]
- 16.Weng, L. Q. et al. Aliskiren ameliorates pressure overload-induced heart hypertrophy and fibrosis in mice. Acta Pharmacol. Sin.35 (8), 1005–1014. 10.1038/aps.2014.45 (2014). [DOI] [PMC free article] [PubMed] [Google Scholar]
- 17.Jiang, B. et al. The role of autophagy in cardiovascular disease: Cross-interference of signaling pathways and underlying therapeutic targets. Front. Cardiovasc. Med.10, 1088575. 10.3389/fcvm.2023.1088575 (2023). [DOI] [PMC free article] [PubMed] [Google Scholar]
- 18.Huang, W. et al. Emodin ameliorates myocardial fibrosis in mice by inactivating the ROS/PI3K/Akt/mTOR axis. Clin. Experimental Hypertens. (New York N Y : 1993). 46 (1), 2326022. 10.1080/10641963.2024.2326022 (2024). [DOI] [PubMed] [Google Scholar]
- 19.Ghafouri-Fard, S. et al. Interplay between PI3K/AKT pathway and heart disorders. Mol. Biol. Rep.49 (10), 9767–9781. 10.1007/s11033-022-07468-0 (2022). [DOI] [PMC free article] [PubMed] [Google Scholar]
- 20.Aljuraiban, G. S., Gibson, R., Chan, D. S., Van Horn, L. & Chan, Q. The role of diet in the prevention of hypertension and management of blood pressure: an umbrella review of Meta-Analyses of interventional and observational studies. Adv. Nutr. (Bethesda Md). 15 (1), 100123. 10.1016/j.advnut.2023.09.011 (2024). [DOI] [PMC free article] [PubMed] [Google Scholar]
- 21.Gabel, K. et al. Differential effects of Alternate-Day fasting versus daily calorie restriction on insulin resistance. Obes. (Silver Spring Md). 27 (9), 1443–1450. 10.1002/oby.22564 (2019). [DOI] [PMC free article] [PubMed] [Google Scholar]
- 22.Zhang, X. et al. Effects of alternate-day fasting, time-restricted fasting and intermittent energy restriction DSS-induced on colitis and behavioral disorders. Redox Biol.32, 101535. 10.1016/j.redox.2020.101535 (2020). [DOI] [PMC free article] [PubMed] [Google Scholar]
- 23.Rynders, C. A. et al. Effectiveness of intermittent fasting and Time-Restricted feeding compared to continuous energy restriction for weight loss. Nutrients11 (10), 2442. 10.3390/nu11102442 (2019). [DOI] [PMC free article] [PubMed] [Google Scholar]
- 24.de Cabo, R. & Mattson, M. P. Effects of intermittent fasting on health, aging, and disease. N. Engl. J. Med.381 (26), 2541–2551. 10.1056/NEJMra1905136 (2019). [DOI] [PubMed] [Google Scholar]
- 25.Yi, X. et al. Time-restricted feeding reduced blood pressure and improved cardiac structure and function by regulating both Circulating and local renin-angiotensin systems in spontaneously hypertensive rat model. PloS One. 20 (4), e0321078. 10.1371/journal.pone.0321078 (2025). [DOI] [PMC free article] [PubMed] [Google Scholar]
- 26.Xu, M. et al. Metformin induction of heat shock factor 1 activation and the mitochondrial unfolded protein response alleviate cardiac remodeling in spontaneously hypertensive rats. FASEB Journal: Official Publication Federation Am. Soc. Experimental Biology. 38 (9), e23654. 10.1096/fj.202400070R (2024). [DOI] [PubMed] [Google Scholar]
- 27.Zhao, J. et al. Calcium-sensing receptor-mediated macrophage polarization improves myocardial remodeling in spontaneously hypertensive rats. (Maywood N J). 249, 10112. 10.3389/ebm.2024.10112 (2024). Experimental biology and medicine. [DOI] [PMC free article] [PubMed] [Google Scholar]
- 28.Ozemek, C., Laddu, D. R., Arena, R. & Lavie, C. J. The role of diet for prevention and management of hypertension. Curr. Opin. Cardiol.33 (4), 388–393. 10.1097/HCO.0000000000000532 (2018). [DOI] [PubMed] [Google Scholar]
- 29.Świątkiewicz, I., Woźniak, A. & Taub, P. R. Time-Restricted eating and metabolic syndrome: current status and future perspectives. Nutrients13 (1), 221. 10.3390/nu13010221 (2021). [DOI] [PMC free article] [PubMed] [Google Scholar]
- 30.Moon, S. et al. Beneficial effects of Time-Restricted eating on metabolic diseases: A systemic review and Meta-Analysis. Nutrients12 (5), 1267. 10.3390/nu12051267 (2020). [DOI] [PMC free article] [PubMed] [Google Scholar]
- 31.Wu, B. et al. Adherence to diet and meal timing in a randomized controlled feeding study of Time-Restricted feeding. Nutrients14 (11), 2283 (2022). [DOI] [PMC free article] [PubMed] [Google Scholar]
- 32.Regmi, P., Heilbronn, L. K., Time-Restricted & Eating Benefits, mechanisms, and challenges in translation. iScience23 (6), 101161. 10.1016/j.isci.2020.101161 (2020). [DOI] [PMC free article] [PubMed] [Google Scholar]
- 33.Xu, Z., Qin, Y., Lv, B., Tian, Z. & Zhang, B. Intermittent fasting improves High-Fat Diet-Induced obesity cardiomyopathy via alleviating lipid deposition and apoptosis and decreasing m6A methylation. Heart Nutrients14(2). (2022). [DOI] [PMC free article] [PubMed]
- 34.Sims, B. M. et al. Time restricted feeding decreases renal innate immune cells and blood pressure in hypertensive mice. J. Hypertens.40 (10), 1960–1968 (2022). [DOI] [PMC free article] [PubMed] [Google Scholar]
- 35.Badreh, F., Joukar, S., Badavi, M. & Rashno, M. Restoration of the Renin-Angiotensin system balance is a part of the effect of fasting on cardiovascular rejuvenation: role of age and fasting models. Rejuven. Res.23 (4), 302–312 (2020). [DOI] [PubMed] [Google Scholar]
- 36.Hou, T. et al. Time-restricted feeding protects the blood pressure circadian rhythm in diabetic mice. Proc. Natl. Acad. Sci. U.S.A.118(25). (2021). [DOI] [PMC free article] [PubMed]
- 37.Mitchell, S. J. et al. Daily fasting improves health and survival in male mice independent of diet composition and calories. Cell Metabol.29 (1), 221–228e3. 10.1016/j.cmet.2018.08.011 (2019). [DOI] [PMC free article] [PubMed] [Google Scholar]
- 38.Shi, H. et al. Restructuring the gut microbiota by intermittent fasting lowers blood pressure. Circul. Res.128 (9), 1240–1254 (2021). [DOI] [PMC free article] [PubMed] [Google Scholar]
- 39.Camelo, L., Marinho, T. S., Águila, M. B., Souza-Mello, V. & Barbosa-da-Silva, S. Intermittent Fasting Exerts Beneficial Metabolic Effects on Blood Pressure and Cardiac Structure by Modulating Local renin-angiotensin System in the Heart of Mice Fed high-fat or high-fructose DietsN.Y.), 6351–62 (Nutrition research (New York, 2019). 10.1016/j.nutres.2018.12.005 [DOI] [PubMed]
- 40.Loncaric, F. et al. Basal ventricular septal hypertrophy in systemic hypertension. Am. J. Cardiol.125 (9), 1339–1346. 10.1016/j.amjcard.2020.01.045 (2020). [DOI] [PubMed] [Google Scholar]
- 41.Luo, W. et al. Hydrogen sulfide switch phenomenon regulating autophagy in cardiovascular diseases. Cardiovasc. Drugs Ther.34 (1), 113–121. 10.1007/s10557-019-06927-4 (2020). [DOI] [PubMed] [Google Scholar]
- 42.Fernandes, R. O. et al. Sulforaphane effects on postinfarction cardiac remodeling in rats: modulation of redox-sensitive prosurvival and proapoptotic proteins. J. Nutr. Biochem.34, 106–117. 10.1016/j.jnutbio.2016.05.004 (2016). [DOI] [PubMed] [Google Scholar]
- 43.Klionsky, D. J., Abdel-Aziz, A. K., Abdelfatah, S., Abdellatif, M., Abdoli, A., Abel,S., Abeliovich, H., Abildgaard, M. H., Abudu, Y. P., Acevedo-Arozena, A., Adamopoulos,I. E., Adeli, K., Adolph, T. E., Adornetto, A., Aflaki, E., Agam, G., Agarwal, A.,Aggarwal, B. B., Agnello, M., Agostinis, P., … Tong, C. K. (2021). Guidelines for the use and interpretation of assays for monitoring autophagy (4th edition)1. Autophagy,17(1), 1–382. https://doi.org/10.1080/15548627.2020.1797280. [DOI] [PMC free article] [PubMed]
- 44.Gatica, D., Chiong, M., Lavandero, S. & Klionsky, D. J. Molecular mechanisms of autophagy in the cardiovascular system. Circul. Res.116 (3), 456–467. 10.1161/CIRCRESAHA.114.303788 (2015). [DOI] [PMC free article] [PubMed] [Google Scholar]
- 45.Kuma, A., Matsui, M. & Mizushima, N. LC3, an autophagosome marker, can be incorporated into protein aggregates independent of autophagy: caution in the interpretation of LC3 localization. Autophagy3 (4), 323–328. 10.4161/auto.4012 (2007). [DOI] [PubMed] [Google Scholar]
- 46.Kaludercic, N. et al. Comprehensive autophagy evaluation in cardiac disease models. Cardiovascular. Res.116 (3), 483–504. 10.1093/cvr/cvz233 (2020). [DOI] [PMC free article] [PubMed] [Google Scholar]
- 47.Laddha, S. V., Ganesan, S., Chan, C. S. & White, E. Mutational landscape of the essential autophagy gene BECN1 in human cancers. Mol. cancer Research: MCR. 12 (4), 485–490. 10.1158/1541-7786.MCR-13-0614 (2014). [DOI] [PMC free article] [PubMed] [Google Scholar]
- 48.Qu, X. et al. Promotion of tumorigenesis by heterozygous disruption of the Beclin 1 autophagy gene. J. Clin. Investig.112 (12), 1809–1820. 10.1172/JCI20039 (2003). [DOI] [PMC free article] [PubMed] [Google Scholar]
- 49.Tan, Y. et al. Astragalus polysaccharide exerts anti-Parkinson via activating the PI3K/AKT/mTOR pathway to increase cellular autophagy level in vitro. Int. J. Biol. Macromol.153, 349–356. 10.1016/j.ijbiomac.2020.02.282 (2020). [DOI] [PubMed] [Google Scholar]
- 50.Hou, X. et al. Advanced glycation endproducts trigger autophagy in cadiomyocyte via RAGE/PI3K/AKT/mTOR pathway. Cardiovasc. Diabetol.13, 78. 10.1186/1475-2840-13-78 (2014). [DOI] [PMC free article] [PubMed] [Google Scholar]
- 51.Ghosh, R. & Pattison, J. S. Macroautophagy and Chaperone-Mediated autophagy in heart failure: the known and the unknown. Oxidative Med. Cell. Longev.2018, 8602041. 10.1155/2018/8602041 (2018). [DOI] [PMC free article] [PubMed] [Google Scholar]
- 52.Wang, W. et al. Augmentation of autophagy by Atorvastatin via Akt/mTOR pathway in spontaneously hypertensive rats. Hypertens. Research: Official J. Japanese Soc. Hypertens.38 (12), 813–820. 10.1038/hr.2015.85 (2015). [DOI] [PubMed] [Google Scholar]
- 53.Sciarretta, S. et al. Trehalose-Induced activation of autophagy improves cardiac remodeling after myocardial infarction. J. Am. Coll. Cardiol.71 (18), 1999–2010. 10.1016/j.jacc.2018.02.066 (2018). [DOI] [PMC free article] [PubMed] [Google Scholar]
- 54.Tallquist, M. D. Cardiac fibroblast diversity. Annu. Rev. Physiol.82, 63–78. 10.1146/annurev-physiol-021119-034527 (2020). [DOI] [PMC free article] [PubMed] [Google Scholar]
- 55.Kurose, H. Cardiac fibrosis and fibroblasts. Cells10 (7), 1716. 10.3390/cells10071716 (2021). [DOI] [PMC free article] [PubMed] [Google Scholar]
- 56.Jiang, W., Xiong, Y., Li, X. & Yang, Y. Cardiac fibrosis: cellular effectors, molecular pathways, and Exosomal roles. Front. Cardiovasc. Med.8, 715258. 10.3389/fcvm.2021.715258 (2021). [DOI] [PMC free article] [PubMed] [Google Scholar]
- 57.Xu, S., Zhang, Y., Zhou, G. & Liu, A. Bidirectional negative feedback actions of DNMT3A and miR-145 in regulating autophagy in cardiac fibroblasts and affecting myocardial fibrosis. J. Bioenerg. Biomembr.55 (5), 341–352. 10.1007/s10863-023-09980-9 (2023). [DOI] [PubMed] [Google Scholar]
- 58.Pan, J. A. et al. Irisin ameliorates doxorubicin-induced cardiac perivascular fibrosis through inhibiting endothelial-to-mesenchymal transition by regulating ROS accumulation and autophagy disorder in endothelial cells. Redox Biol.46, 102120. 10.1016/j.redox.2021.102120 (2021). [DOI] [PMC free article] [PubMed] [Google Scholar]
- 59.Honold, L. & Nahrendorf, M. Resident and Monocyte-Derived macrophages in cardiovascular disease. Circul. Res.122 (1), 113–127. 10.1161/CIRCRESAHA.117.311071 (2018). [DOI] [PMC free article] [PubMed] [Google Scholar]
Associated Data
This section collects any data citations, data availability statements, or supplementary materials included in this article.
Supplementary Materials
Data Availability Statement
The datasets used and/or analyzed during the current study are available from the corresponding author on reasonable request.