

Abstract
Objectives: To develop and validate a risk prediction model for alcoholic fatty liver disease (AFLD) based on clinical characteristics and liver stiffness measurements. Methods: This retrospective cohort study included 148 AFLD patients and 148 healthy controls from a tertiary hospital between January 2018 and December 2023. Participants underwent biochemical tests (lipid profile, liver function, uric acid) and liver stiffness measurements using Elastography Protocol for Quantification (Elast PQ). The external validation cohort, was from another hospital, with data collected from May 2019 to December 2023. It included 90 patients diagnosed with AFLD and 90 healthy controls. Machine learning methods (random forest, support vector machine, logistic regression) were employed to compare model performance. Logistic regression was used to identify predictive factors. Model performance was evaluated using Receiver Operating Characteristic (ROC) curve analysis, confusion matrices, calibration curves, and Decision Curve Analysis (DCA). Results: Univariate analysis revealed significant associations between body mass index (BMI), alcohol consumption, blood lipids, and liver function with AFLD (P < 0.001). Multivariate analysis identified high-aensity lipoprotein (HDL) (P = 0.041), alanine aminotransferase (ALT) (P = 0.007), and Elast PQ (P = 0.038) as independent risk factors. The logistic regression model showed an area under the curve (AUC) of 0.81 in the training set, 0.67 in the validation set, and 0.79 in the external validation cohort. The optimal cutoff value of 0.403 maximized sensitivity (0.62) and specificity (0.69), with an accuracy of 0.66. DCA indicated a high clinical net benefit. The risk prediction score enables rapid AFLD risk assessment and demonstrates strong predictive ability. Conclusions: The AFLD risk prediction model, based on clinical features and liver stiffness assessment, exhibits strong predictive power and significant clinical value for early diagnosis and management.
Keywords: Alcoholic fatty liver disease, risk prediction model, logistic regression, liver stiffness, early diagnosis
Introduction
Alcoholic fatty liver disease (AFLD) is a liver disorder resulting from chronic excessive alcohol consumption, leading to fat accumulation in the liver. It is among the most prevalent liver diseases worldwide. According to the World Health Organization (WHO), the prevalence of alcohol-related liver diseases is steadily increasing, making it a leading cause of liver transplantation and liver cancer [1]. Early diagnosis of AFLD is essential for effective disease management, since untreated fatty liver may progress to more severe conditions, such as alcoholic hepatitis, liver fibrosis, cirrhosis, and liver cancer [2]. Currently, the clinical diagnosis of AFLD relies heavilyon liver biopsy and imaging techniques, both of which have notable limitations. Liver biopsy is invasive and costly, while imaging methods often fail to accurately detect early fat deposition and assess the extent of liver fibrosis [3,4]. In response to these limitations, non-invasive diagnostic technologies have become a major focus of research for early AFLD detection. One promising approach is the Elastography Protocol for Quantification (Elast PQ), a novel non-invasive method for assessing liver stiffness. Elast PQ has demonstrated promise in diagnosing various liver diseases [5], and it reflects liver fibrosis and fat deposition by evaluating liver stiffness. It has shown high sensitivity and specificity, particularly for the diagnoses of non-alcoholic fatty liver disease (NAFLD) and liver cirrhosis [6,7]. However, while Elast PQ has been successfully used to assess liver fibrosis, its application for the early diagnosis of AFLD is still in its infancy. Moreover, its combined use with other biomarkers remains insufficiently validated. As such, exploring the clinical value of combining Elast PQ with conventional biochemical markers is an ongoing research focus.
The pathogenesis of AFLD is multifactorial, involving dysregulated fat metabolism, hepatocellular injury, and inflammatory responses [8]. Clinically, routine biochemical markers such as blood lipids, liver function markers, and uric acid levels are commonly used in AFLD diagnosis [9]. Elevated triglycerides (TG) and total cholesterol (TC) are typically associated with liver fat accumulation, while liver function markers such as alanine aminotransferase (ALT) and aspartate aminotransferase (AST) reflect liver cell damage and inflammation [10,11]. Moreover, elevated blood uric acid (UA) levels are strongly associated with the development and progression of fatty liver. Recent studies indicate that UA, a metabolic waste product, not only correlates with metabolic syndrome but also exacerbates liver damage by triggering oxidative stress and inflammation [12]. However, individual biomarkers have limitations due to their susceptibility to factors like diet, physical activity, and coexisting liver disease. As a result, the integration of multiple biomarkers, especially for early liver disease screening, is increasingly viewed as a promising strategy to improve diagnostic accuracy. Research has demonstrated that a comprehensive evaluation of blood lipids, liver function, and uric acid levels can enhance the sensitivity and specificity of AFLD diagnosis [9]. Despite this, the combined use of Elast PQ and other biomarkers for early AFLD screening remains insufficiently explored, and there is currently no systematic multi-biomarker diagnostic model available.
This study aims to investigate the clinical utility of combining Elast PQ with conventional biochemical markers for the early diagnosis of AFLD. This would be a novel strategy for early screening of AFLD through multi-biomarker analysis, overcoming the limitations of individual markers and strengthening diagnostic accuracy. By selecting the optimal model using machine learning and integrating clinical features, this study may provide a personalized and practical tool for early AFLD screening.
Materials and methods
Study design and participants
This retrospective cohort study aimed to evaluate the clinical utility of combining Elast PQ technology with blood lipid profiles, liver function tests, and blood uric acid levels for the early diagnosis of AFLD. Participants were selected from the electronic medical records of a tertiary hospital, including both AFLD patients and healthy controls, between January 2018 and December 2023. AFLD patients were either suspected or confirmed cases with a history of excessive alcohol consumption (men ≥ 40 g/day, women ≥ 20 g/day). The inclusion of suspected cases allowed for the evaluation of the diagnostic method in the early stages of the disease, in which symptoms may not yet be evident but early detection is critical. Confirmed cases were included in order to validate the diagnostic approach in patients with a definitive diagnosis, as a positive control. The healthy control group consisted of individuals with no history of liver disease and normal liver function.
148 AFLD patients and 148 healthy controls were enrolled, resulting in a total sample size of 296 participants. This study was approved by the ethics committee of Beijing Huilongguan Hospital. Given the retrospective nature of the study and the anonymized handling of data, informed consent was waived. The sample size was calculated through power analysis (80% statistical power, α = 0.05) to ensure adequate statistical power.
Inclusion and exclusion criteria
AFLD patients were diagnosed based on imaging techniques (e.g., ultrasound, computed tomography [CT], or magnetic resonance imaging [MRI]) and biochemical markers, alongside a history of excessive alcohol consumption (men ≥ 40 g/day, women ≥ 20 g/day). Exclusion criteria included the presence of other liver diseases (such as viral hepatitis, non-alcoholic fatty liver disease, or autoimmune liver disease), recent alcohol cessation (within 3 months), and other significant comorbidities (e.g., advanced heart disease, kidney disease, or metabolic disorders) that may confound liver disease assessment [13,14]. The control group consisted of individuals with no history of liver disease, normal liver function, and no excessive alcohol consumption. Controls were matched to the AFLD group based on age and gender.
Additionally, the model was further validated using an external cohort obtained from another hospital, with data collected from May 2019 to December 2023. This external validation aimed to assess the model’s generalizability across different clinical settings. A total of 90 AFLD patients and 90 healthy individuals were included. The inclusion criteria for AFLD patients and healthy controls in the external cohort were consistent with those used in the original study, and the same screening procedures were applied.
Clinical data and laboratory tests
Basic clinical data, including gender, age, alcohol consumption, weight, and height, were extracted from the electronic medical record system for all participants. Laboratory tests included blood lipid profile, liver function tests, and blood uric acid levels. Blood lipid measurements (total cholesterol [TC], triglycerides [TG], low-density lipoprotein [LDL], and high-density lipoprotein cholesterol [HDL-C]) were performed using the Cobas 8000 series biochemical analyzer (Roche Diagnostics). All samples were collected in the morning after an overnight fast and analyzed within 24 hours, with blood samples stored at 4°C. Liver function tests, including alanine aminotransferase [ALT], aspartate aminotransferase [AST], and gamma-glutamyl transferase [GGT], were conducted using the Beckman Coulter AU5800 automatic analyzer. Blood uric acid levels were measured using the same analyzer. All blood samples were venous, collected after an overnight fast, and serum samples were stored at 4°C before analysis within 24 hours.
Elast PQ technology measurement
Elast PQ is a non-invasive tool for assessing liver stiffness to evaluate the degree of liver fibrosis. All AFLD patients underwent liver stiffness measurement using the PHILIPS (IU-Elite) ultrasonic diagnostic instrument (Philips, Eindhoven, Netherlands), which employs Transient Elastography (TE) to quantify liver stiffness in kilopascals (kPa). Each subject underwent at least 10 measurements, with reliable values (success rate ≥ 60%, IQR/M ratio ≤ 30%) selected for analysis. Based on liver stiffness values, the Elast PQ helps identify the degree of liver fibrosis.
Data processing and model development
Data preprocessing and grouping
All collected data were preprocessed using R software (version 4.0.3). Missing values were imputed, outliers detected, and the data were standardized to ensure quality. The dataset was then split into a training set (70%) and a validation set (30%) for model development and validation.
Machine learning methods
To optimize the diagnostic model, machine learning methods, including Random Forest (RF), Support Vector Machine (SVM), and Logistic Regression (LR), were employed. The training set was used to develop a predictive model, and its performance was compared using Receiver Operating Characteristic (ROC) curves.
Univariate and multivariate logistic regression analysis
Univariate logistic regression analysis was initially done to examine the relationship between each variable (including Elast PQ parameters, blood lipids, liver function, and blood uric acid) and AFLD. Statistically significant variables (P < 0.05) identified in the univariate analysis were selected to test as independent predictors for subsequent multivariate logistic regression analysis.
Multivariate logistic regression analysis was performed to develop an AFLD diagnostic model, incorporating clinical features (e.g., alcohol consumption history, BMI). A bidirectional stepwise regression method, involving both forward and backward selection, was used to identify the optimal predictive factors. Model fitting and selection were guided by the Akaike Information Criterion (AIC).
ROC curve and AUC analysis
ROC curve analysis was employed to assess the diagnostic performance of the model. The area under the curve (AUC) was calculated to assess sensitivity, specificity, and accuracy. A higher AUC indicates greater diagnostic power. Various parameter combinations were compared, and the optimal combination was selected for final validation.
Model validation and evaluation
The classification accuracy of the model was evaluated using confusion matrices, which provided metrics including the correct classification rate, false positive rate, false negative rate, and overall accuracy. Additionally, calibration curves were used to assess the agreement between the predicted probabilities and actual clinical outcomes. Decision Curve Analysis (DCA) was employed to evaluate the net clinical benefit of the model under various decision thresholds.
Statistical analysis
All statistical analyses were performed using R, version 4.4.0 and Zstats software (www.zstats.net). Continuous variables were expressed as means ± standard deviations (Mean ± SD), and group comparisons were conducted using independent sample t-tests or Mann-Whitney U tests, depending on the data distribution. Categorical variables were compared using the Chi-square test. Univariate and multivariate logistic regression analyses were performed for variable selection and model development. Statistical significance level was set at P < 0.05.
Results
Baseline characteristics comparison
A total of 148 patients with AFLD and 148 healthy controls were included in this study. The average age of the AFLD group was 43.96 ± 15.36 years, while the control group had a mean age of 46.19 ± 15.31 years. Males comprised 43.92% and 54.05% of the AFLD and control groups, respectively. No significant differences were observed between the two groups in terms of age or gender distribution. However, the AFLD group had significantly higher BMI and daily alcohol consumption compared to the control group (P < 0.001). Additionally, AFLD patients showed significantly elevated levels of TC, TG, and LDL (P < 0.001), and significantly lower levels of HDL (P < 0.001). Liver function markers (ALT, AST, GGT), blood uric acid levels, and liver stiffness (measured by Elast PQ, kPa) were also significantly higher in the AFLD group (P < 0.001) (Table 1). No significant differences were found between the training and testing sets regarding baseline characteristics (P > 0.05), indicating no bias in selecting the two groups (Table 2).
Table 1.
Comparison of baseline characteristics between AFLD and control groups
| Variable | Total (n = 296) | AFLD (n = 148) | Control (n = 148) | Statistic | P |
|---|---|---|---|---|---|
| Age, Mean ± SD | 45.07 ± 15.35 | 43.96 ± 15.36 | 46.19 ± 15.31 | t = -1.25 | 0.212 |
| Sex, n (%) | χ2 = 3.04 | 0.081 | |||
| 0 | 151 (51.01) | 83 (56.08) | 68 (45.95) | ||
| 1 | 145 (48.99) | 65 (43.92) | 80 (54.05) | ||
| BMI, M (Q1, Q3) | 26.49 (22.55, 31.53) | 30.40 (23.99, 32.66) | 23.48 (21.71, 29.13) | Z = -6.12 | < 0.001 |
| Alcohol, M (Q1, Q3) | 40.00 (10.00, 107.25) | 86.00 (16.00, 116.00) | 15.00 (8.00, 81.50) | Z = -5.03 | < 0.001 |
| TC, M (Q1, Q3) | 5.82 (5.31, 6.53) | 6.23 (5.55, 6.75) | 5.59 (5.16, 6.06) | Z = -4.56 | < 0.001 |
| TG, M (Q1, Q3) | 1.91 (1.25, 3.22) | 2.75 (1.64, 3.53) | 1.44 (1.11, 2.21) | Z = -6.45 | < 0.001 |
| LDL, Mean ± SD | 3.61 ± 0.84 | 3.82 ± 0.86 | 3.40 ± 0.77 | t = 4.45 | < 0.001 |
| HDL, M (Q1, Q3) | 1.20 (0.96, 1.55) | 1.02 (0.91, 1.33) | 1.35 (1.09, 1.64) | Z = -6.20 | < 0.001 |
| ALT, M (Q1, Q3) | 40.00 (23.00, 90.25) | 76.50 (33.00, 106.00) | 30.00 (19.75, 58.00) | Z = -6.79 | < 0.001 |
| AST, M (Q1, Q3) | 53.50 (33.75, 97.50) | 74.00 (42.75, 115.50) | 45.50 (31.00, 70.00) | Z = -5.12 | < 0.001 |
| GGT, M (Q1, Q3) | 59.50 (36.75, 113.00) | 93.50 (44.75, 128.00) | 45.00 (33.75, 78.25) | Z = -5.65 | < 0.001 |
| UA, M (Q1, Q3) | 405.83 (335.80, 522.80) | 465.86 (373.63, 553.49) | 371.16 (317.37, 444.13) | Z = -5.43 | < 0.001 |
| ElastPQ, M (Q1, Q3) | 6.51 (4.90, 10.12) | 9.02 (5.43, 11.00) | 5.35 (4.77, 8.11) | Z = -6.33 | < 0.001 |
t: t-test, Z: Mann-Whitney test, χ2: Chi-square test, SD: standard deviation, M: Median, Q1: 1st Quartile, Q3: 3st Quartile, AFLD: Alcoholic Fatty Liver Disease, TC: Total Cholesterol, TG: Triglycerides, LDL: Low-Density Lipoprotein, HDL: High-Density Lipoprotein Cholesterol, ALT: Alanine Aminotransferase, AST: Aspartate Aminotransferase, GGT: Gamma-Glutamyl Transferase, UA: Uric Acid, Elast PQ: Elastography Protocol for Quantification.
Table 2.
Balance check between training set and validation set
| Variable | Total (n = 296) | validation (n = 89) | train (n = 207) | Statistic | P |
|---|---|---|---|---|---|
| Age, Mean ± SD | 45.23 ± 15.34 | 46.59 ± 14.58 | 44.65 ± 15.65 | t = 1.00 | 0.317 |
| Sex, n (%) | χ2 = 0.02 | 0.879 | |||
| 0 | 151 (51.01) | 46 (51.69) | 105 (50.72) | ||
| 1 | 145 (48.99) | 43 (48.31) | 102 (49.28) | ||
| BMI, M (Q1, Q3) | 28.04 (22.57, 31.60) | 26.51 (21.80, 32.06) | 28.17 (22.76, 31.35) | Z = -0.38 | 0.707 |
| Alcohol, M (Q1, Q3) | 62.00 (10.00, 108.00) | 40.50 (10.25, 100.50) | 62.50 (10.25, 108.75) | Z = -0.33 | 0.739 |
| TC, M (Q1, Q3) | 5.83 (5.32, 6.58) | 5.86 (5.32, 6.58) | 5.82 (5.32, 6.57) | Z = -0.07 | 0.945 |
| TG, M (Q1, Q3) | 2.06 (1.25, 3.26) | 1.94 (1.26, 3.40) | 2.06 (1.25, 3.17) | Z = -0.50 | 0.619 |
| LDL, Mean ± SD | 3.62 ± 0.85 | 3.55 ± 0.86 | 3.65 ± 0.84 | t = -1.02 | 0.309 |
| HDL, M (Q1, Q3) | 1.19 (0.96, 1.55) | 1.18 (0.97, 1.53) | 1.19 (0.96, 1.55) | Z = -0.15 | 0.879 |
| ALT, M (Q1, Q3) | 43.50 (23.00, 91.00) | 40.00 (24.00, 87.50) | 48.50 (23.00, 92.50) | Z = -0.14 | 0.893 |
| AST, M (Q1, Q3) | 55.00 (34.00, 100.00) | 56.50 (34.50, 94.00) | 54.00 (34.00, 101.00) | Z = -0.21 | 0.830 |
| GGT, M (Q1, Q3) | 61.50 (37.75, 113.00) | 56.50 (39.00, 110.75) | 64.00 (36.25, 113.00) | Z = -0.35 | 0.725 |
| UA, M (Q1, Q3) | 407.45 (336.40, 526.18) | 408.81 (340.42, 541.81) | 406.14 (335.78, 516.91) | Z = -0.97 | 0.332 |
| ElastPQ, M (Q1, Q3) | 7.12 (4.91, 10.16) | 6.61 (4.85, 9.80) | 7.12 (4.94, 10.24) | Z = -0.20 | 0.843 |
t: t-test, Z: Mann-Whitney test, χ2: Chi-square test, SD: standard deviation, M: Median, Q1: 1st Quartile, Q3: 3st Quartile, AFLD: Alcoholic Fatty Liver Disease, TC: Total Cholesterol, TG: Triglycerides, LDL: Low-Density Lipoprotein, HDL: High-Density Lipoprotein Cholesterol, ALT: Alanine Aminotransferase, AST: Aspartate Aminotransferase, GGT: Gamma-Glutamyl Transferase, UA: Uric Acid, Elast PQ: Elastography Protocol for Quantification.
Model selection using machine learning
To determine the optimal diagnostic model, we compared the classification performance of RF, SVM, and LR models. ROC curve analysis indicated that the LR model achieved the highest AUC value (AUC = 0.803), followed by the RF model (AUC = 0.777) and the SVM model (AUC = 0.688) (Figure 1). Statistical comparisons revealed that the LR model had a significantly higher AUC than the SVM model (P < 0.05), while no significant difference was observed between LR and RF (P = 0.22). These results suggest that the LR model provided the best classification performance for AFLD diagnosis.
Figure 1.
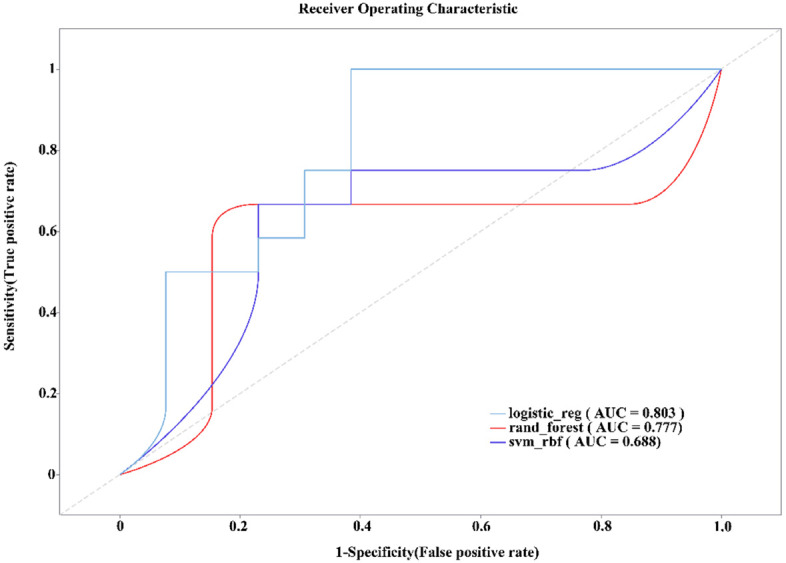
The classification performances of the Random Forest, Support Vector Machine (SVM) and Logistic Regression models are compared through machine learning. AUC: Area Under the Curve.
Univariate and multivariate logistic regression analysis
Univariate logistic regression analysis revealed significant associations between AFLD and several variables, including BMI, alcohol consumption, TC, TG, LDL, HDL, ALT, AST, GGT (P < 0.001). Additionally, blood uric acid and liver stiffness (P = 0.001) were identified as significant predictors. After adjusting for potential confounders, the multivariate logistic regression model incorporated age, alcohol consumption, LDL, HDL, ALT, and Elast PQ, and the results confirmed that HDL (P = 0.041), ALT (P = 0.007), and Elast PQ (P = 0.038) were significantly associated with AFLD (Tables 3, 4).
Table 3.
Univariate logistic regression analysis
| Variable | Univariate Logistic Regression | ||||
|---|---|---|---|---|---|
|
| |||||
| β | S.E. | Z | P | OR (95% CI) | |
| Age | -0.01 | 0.01 | -1.26 | 0.208 | 0.99 (0.97-1.01) |
| BMI | 0.19 | 0.03 | 5.71 | < 0.001 | 1.21 (1.13-1.29) |
| Alcohol | 0.02 | 0.00 | 5.24 | < 0.001 | 1.02 (1.01-1.02) |
| TC | 0.98 | 0.20 | 4.80 | < 0.001 | 2.67 (1.79-3.99) |
| TG | 0.88 | 0.15 | 5.67 | < 0.001 | 2.41 (1.78-3.26) |
| LDL | 0.72 | 0.18 | 4.04 | < 0.001 | 2.06 (1.45-2.93) |
| HDL | -3.18 | 0.54 | -5.89 | < 0.001 | 0.04 (0.01-0.12) |
| ALT | 0.03 | 0.00 | 6.26 | < 0.001 | 1.03 (1.02-1.04) |
| AST | 0.02 | 0.00 | 5.13 | < 0.001 | 1.02 (1.01-1.03) |
| GGT | 0.02 | 0.00 | 5.49 | < 0.001 | 1.02 (1.01-1.03) |
| UA | 0.01 | 0.00 | 4.97 | 0.001 | 1.01 (1.01-1.01) |
| ElastPQ | 0.36 | 0.06 | 6.15 | 0.001 | 1.44 (1.28-1.61) |
| Sex | |||||
| 0 | 1.00 (Reference) | ||||
| 1 | -0.50 | 0.28 | -1.78 | 0.074 | 0.61 (0.35-1.05) |
OR: Odds Ratio, CI: Confidence Interval, TC: Total Cholesterol, TG: Triglycerides, LDL: Low-Density Lipoprotein, HDL: High-Density Lipoprotein Cholesterol, ALT: Alanine Aminotransferase, AST: Aspartate Aminotransferase, GGT: Gamma-Glutamyl Transferase, UA: Uric Acid, Elast PQ: Elastography Protocol for Quantification.
Table 4.
Multivariate logistic regression analysis
| Variable | Multivariate Logistic Regression | ||||
|---|---|---|---|---|---|
|
| |||||
| β | S.E. | Z | P | OR (95% CI) | |
| Age | -0.02 | 0.01 | -1.47 | 0.142 | 0.98 (0.96-1.01) |
| Alcohol | -0.01 | 0.01 | -1.76 | 0.079 | 0.99 (0.97-1.00) |
| LDL | -0.54 | 0.32 | -1.68 | 0.092 | 0.58 (0.31-1.09) |
| HDL | -2.04 | 1.00 | -2.04 | 0.041 | 0.13 (0.02-0.92) |
| ALT | 0.02 | 0.01 | 2.69 | 0.007 | 1.02 (1.01-1.04) |
| ElastPQ | 0.27 | 0.13 | 2.08 | 0.038 | 1.31 (1.02-1.68) |
OR: Odds Ratio, CI: Confidence Interval, LDL: Low-Density Lipoprotein Cholesterol, HDL: High-Density Lipoprotein Cholesterol, ALT: Alanine Aminotransferase, Elast PQ: Elastography Protocol for Quantification.
Model construction and validation
The model demonstrated strong performance in the training set (207 cases), with an AUC of 0.81 (95% CI: 0.75-0.87), indicating excellent discriminatory power in AFLD diagnosis (Figure 2A). The calibration curve also confirmed a high degree of agreement between predicted probabilities and actual clinical outcomes (Figure 3A). The optimal cutoff value, identified through ROC curve analysis, was 0.403, which maximized sensitivity (0.71) and specificity (0.80), yielding an accuracy of 0.76 (Figure 3).
Figure 2.

Receiver Operating Characteristic (ROC) curves in the training set (A) and validation set (B), with corresponding AUC values, used to evaluate model diagnostic performance. ROC: receiver operating characteristic; AUC: area under the curve.
Figure 3.

Calibration curves in the training set (A) and validation set (B), assessing the agreement between predicted probabilities and actual clinical outcome.
When tested on the validation set (89 cases), the model maintained an AUC of 0.67 (95% CI: 0.56-0.78), suggesting a moderate discriminatory ability for AFLD diagnosis (Figure 2B). The calibration curve again indicated strong concordance between predicted probabilities and actual clinical outcomes (Figure 3B). At the same cutoff value of 0.403, the model achieved a sensitivity of 0.62 and specificity of 0.69. The classification accuracy in the validation set, evaluated using the confusion matrix, showed an accuracy of 0.66, a positive predictive value (PPV) of 0.67, and a negative predictive value (NPV) of 0.65, suggesting reliable diagnostic performance (Figure 4).
Figure 4.
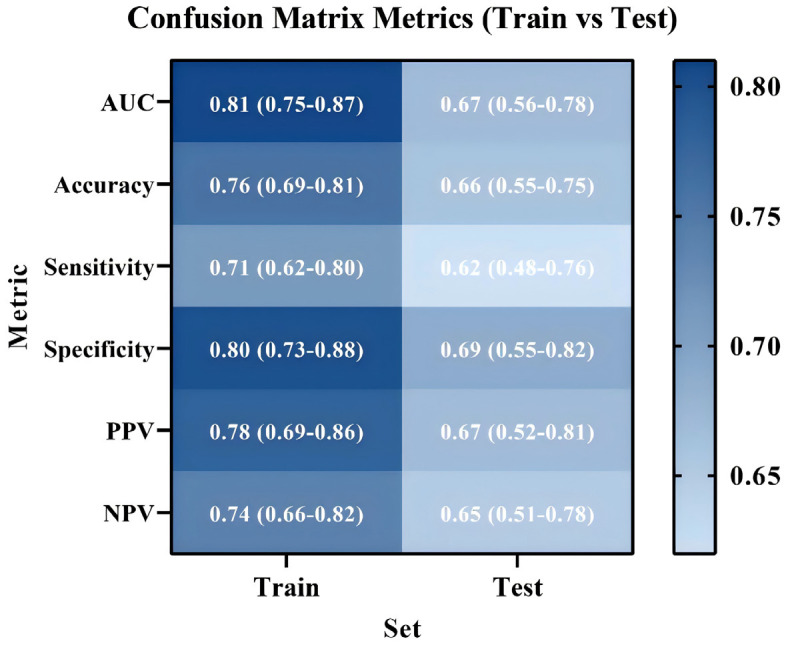
Confusion matrices in the training and validation sets, evaluating classification performance including accuracy, sensitivity, and specificity. PPV: positive predictive value; NPV: negative predictive value.
DCA further evaluated the clinical utility of the model, showing that decision-making based on the AFLD diagnostic model provided a higher net benefit (Figure 5). This suggests that the model has high clinical applicability and can optimize early diagnosis and disease assessment in AFLD.
Figure 5.

Decision Curve Analysis (DCA) in the training set (A) and validation set (B), assessing the net benefit of the model at different decision thresholds.
Risk prediction score model
A risk prediction score for AFLD was developed based on the regression coefficients from the multivariate logistic regression model. The nomogram (Figure 6) provides a visual tool to calculate the risk score, allowing clinicians to quickly assess the likelihood of AFLD based on clinical features such as age, alcohol consumption, LDL, HDL, ALT, and liver stiffness. The distribution of risk scores revealed that higher scores corresponded to a greater probability of AFLD, validating the model’s strong predictive power.
Figure 6.

Nomogram for the risk prediction score, allowing individualized risk assessment based on predicted risk values. LDL: Low-Density Lipoprotein Cholesterol; HDL: High-Density Lipoprotein Cholesterol; ALT: Alanine Aminotransferase; Elast PQ: Elastography Protocol for Quantification.
External validation
In the baseline data of the external validation cohort, no significant differences were observed between the two groups in terms of age or sex distribution (P = 0.299, P = 0.110). Compared with the healthy control group, AFLD patients exhibited significantly higher levels of BMI, alcohol consumption, TC, TG, LDL-C, ALT, AST, GGT, UA, and liver stiffness (ElastPQ) (P < 0.001) (Table 5).
Table 5.
Baseline characteristics of the external validation cohort
| Variable | Total (n = 180) | AFLD (n = 90) | Control (n = 90) | Statistic | P |
|---|---|---|---|---|---|
| Age, Mean ± SD | 46.23 ± 14.56 | 45.18 ± 15.12 | 47.29 ± 13.91 | t = -1.04 | 0.299 |
| Sex, n (%) | χ2 = 2.56 | 0.110 | |||
| 0 (Male) | 92 (51.11) | 50 (55.56) | 42 (46.67) | ||
| 1 (Female) | 88 (48.89) | 40 (44.44) | 48 (53.33) | ||
| BMI, M (Q1, Q3) | 27.20 (23.68, 32.30) | 30.15 (24.56, 33.09) | 24.90 (22.65, 30.12) | Z = -5.14 | < 0.001 |
| Alcohol, M (Q1, Q3) | 35.00 (12.00, 95.00) | 82.00 (20.00, 120.00) | 12.00 (5.00, 60.00) | Z = -5.11 | < 0.001 |
| TC, M (Q1, Q3) | 5.86 (5.34, 6.46) | 6.17 (5.55, 6.79) | 5.58 (5.16, 6.05) | Z = -4.65 | < 0.001 |
| TG, M (Q1, Q3) | 2.05 (1.30, 3.05) | 2.78 (1.63, 3.55) | 1.48 (1.12, 2.10) | Z = -5.62 | < 0.001 |
| LDL-C, Mean ± SD | 3.58 ± 0.88 | 3.83 ± 0.90 | 3.33 ± 0.76 | t = 3.85 | < 0.001 |
| HDL, M (Q1, Q3) | 1.18 (0.98, 1.56) | 1.05 (0.92, 1.30) | 1.40 (1.15, 1.62) | Z = -6.35 | < 0.001 |
| ALT, M (Q1, Q3) | 42.00 (24.00, 94.50) | 78.00 (35.00, 110.00) | 32.00 (19.00, 58.00) | Z = -6.74 | < 0.001 |
| AST, M (Q1, Q3) | 51.00 (34.00, 95.00) | 70.00 (43.00, 110.00) | 45.00 (30.00, 68.00) | Z = -4.90 | < 0.001 |
| GGT, M (Q1, Q3) | 62.00 (39.00, 120.00) | 95.00 (50.00, 130.00) | 48.00 (35.00, 77.00) | Z = -5.34 | < 0.001 |
| UA, M (Q1, Q3) | 410.00 (340.00, 530.00) | 470.00 (380.00, 560.00) | 375.00 (315.00, 450.00) | Z = -5.12 | < 0.001 |
| ElastPQ, M (Q1, Q3) | 6.42 (4.75, 9.98) | 8.85 (5.20, 11.00) | 5.30 (4.55, 7.90) | Z = -6.27 | < 0.001 |
The external validation results showed an AUC of 0.79 (95% CI: 0.72-0.83), demonstrating the model’s excellent diagnostic performance when applied to data from patients collected at another hospital (Figure 7A). The calibration curve further indicated a strong consistency between the predicted probabilities and the actual clinical outcomes, suggesting that the model reliably reflects the risk for AFLD (Figure 7B). In the external dataset, the model achieved an accuracy of 0.72, a PPV of 0.72, a NPV of 0.74, sensitivity of 0.78, and specificity of 0.67 (Figure 7C), highlighting its strong predictive ability and capacity to effectively differentiate AFLD patients from healthy controls. Decision curve analysis (DCA) demonstrated that the model provided higher net benefits within moderate risk thresholds (approximately 0.2 to 0.4), indicating that it effectively balances false positives and false negatives, outperforming traditional “all-high-risk” or “all-low-risk” strategies (Figure 7D).
Figure 7.

External validation results of the model. A: Receiver operating characteristic (ROC) curve of the model in the external dataset; B: Calibration curve illustrates the agreement between the model’s predicted probabilities and the actual clinical outcomes; C: Confusion matrix metrics of the model in the external dataset; D: Decision curve analysis (DCA) displays the net benefit of the model at various risk thresholds.
Discussion
Alcoholic fatty liver disease (AFLD) is a prevalent liver disorder primarily caused by chronic alcohol consumption. Early diagnosis and timely intervention are essential for preventing its progression to alcoholic hepatitis, liver fibrosis, and even cirrhosis [14]. While imaging techniques and liver biopsy remain the standard diagnostic approaches for AFLD, these methods are limited by factors such as invasiveness, high cost, and technical complexity. As a result, there has been an increasing emphasis on developing non-invasive, sensitive, and efficient diagnostic tools. In this study, we combined Elast PQ technology with conventional biochemical markers, including blood lipids, liver function tests, and serum uric acid, to develop a multi-indicator diagnostic model aimed at facilitating early diagnosis of AFLD. Our findings revealed significant abnormalities in several biomarkers, including weight, alcohol consumption, blood lipids, liver function, liver stiffness, and serum uric acid, which were consistent with the known pathogenesis of AFLD and corroborated existing literature. Moreover, the consistency observed between the training and testing sets supported the robustness and external applicability of the model.
The onset and progression of AFLD are often associated with the interaction of multiple factors, including obesity and metabolic syndrome. Elevated BMI and excessive alcohol consumption are key risk factors for AFLD [14,15]. Studies have demonstrated that BMI is closely related to the development and progression of AFLD, with hepatic fat accumulation being one of the primary mechanisms. This fat accumulation is typically related to obesity, metabolic syndrome, and insulin resistance [16]. Excessive alcohol consumption is a direct etiological factor in AFLD, promoting hepatic fat deposition through several mechanisms, including oxidative stress and impaired fatty acid metabolism, which ultimately leads to liver damage [17]. Additionally, AFLD patients often exhibit significant dyslipidemia, particularly alterations in TG, LDL, and HDL levels. These lipid abnormalities are closely related to hepatic fat deposition, liver injury, and complications, such as atherosclerosis [18]. An increase in TG and decrease in HDL are particularly associated with hepatic fat deposition and inflammatory response in AFLD [19,20], a finding that aligns with our results. Specifically, HDL exerts a protective effect on the liver by reducing fat deposition and inflammation. However, low HDL levels accelerate liver damage and fibrosis progression in patients with fatty liver disease [21,22]. This was further confirmed by multivariate analysis in this study, which identified HDL as an independent predictor of AFLD.
Liver function indicators (such as ALT, AST, and GGT) reflect the extent of liver injury, while uric acid levels and liver stiffness (measured by Elast PQ technology) are increasingly recognized for their roles in the early screening and evaluation of AFLD progression. Studies have shown that elevated levels of ALT and AST are closely associated with the severity of liver injury in AFLD patients [23], which is consistent with our findings of significantly increased ALT levels in AFLD patients. Furthermore, uric acid plays a crucial role in the pathogenesis of AFLD. Recent research indicates that elevated uric acid exacerbates liver damage by triggering inflammatory and apoptotic pathways [24]. Our study corroborated these findings, demonstrating a significant association between elevated uric acid levels and AFLD. Liver stiffness, assessed through non-invasive techniques like Elast PQ, reflects the degree of liver fibrosis [25]. Research has also demonstrated that liver stiffness is closely related to the degree of liver fibrosis in patients with fatty liver [26]. Our study further confirms this relationship, revealing that liver stiffness in AFLD patients was significantly higher than in healthy controls. As a biomarker for assessing liver fibrosis and predicting disease progression in AFLD, liver stiffness has shown promise in other studies as well [27]. An increase in liver stiffness typically reflects the accumulation of fat in the liver and the progression of fibrosis. Early changes in liver stiffness may indicate further disease progression, which could eventually lead to liver fibrosis, cirrhosis, and cancer [28]. Therefore, the assessment of liver stiffness is not only an important tool for AFLD diagnosis but also a valuable biomarker for predicting disease progression.
In this study, both univariate and multivariate logistic regression analyses revealed significant correlations between multiple clinical indicators and AFLD, supporting an early diagnosis and risk assessment of AFLD. By analyzing a range of biochemical markers and clinical features, we developed a clinically valuable predictive model and validated its performance. Univariate logistic regression analysis showed that AFLD was significantly associated with BMI, alcohol consumption, blood lipids (TC, TG, LDL, HDL), liver function markers (ALT, AST, GGT), serum uric acid, and liver stiffness. By multivariate analysis, after controlling for potential confounders (including age and alcohol consumption), we identified HDL, ALT, and liver stiffness (Elast PQ) as independent predictors of AFLD. HDL, a protective lipoprotein, serves not only a metabolic marker for AFLD but also a key factor in its development and fibrosis progression [18]. HDL exerts its protective effects by inhibiting fat accumulation, reducing oxidative stress, and mitigating inflammation. A decrease in HDL levels accelerates AFLD progression [29]. The observed correlation between HDL and AFLD in our study underscores its critical role in disease pathogenesis. ALT, a well-established marker of hepatocellular injury, is frequently elevated in AFLD patients. Elevated ALT typically indicate acute or chronic liver injury, commonly seen in early AFLD, signaling hepatic fat deposition and inflammation [30]. The correlation between ALT and AFLD in our study emphasizes the importance of liver function tests for the early diagnosis of AFLD. Elast PQ technology, which measures liver stiffness as an indicator of liver fibrosis, has gained increasing recognition for its role in AFLD diagnosis [31]. Our study further validates the significant correlation between liver stiffness and AFLD, highlighting its potential as a tool for early detection and risk assessment of the disease.
Based on the results from univariate and multivariate regression analyses, we developed a diagnostic model for AFLD, using both training and validation sets. The model performed exceptionally well in the training set, with an AUC of 0.81. Validation using ROC curves, calibration curves, and confusion matrices confirmed the model’s accuracy and clinical applicability. In the validation set, the AUC was 0.67 (95% CI: 0.56-0.78), slightly lower than in the training set but still effectively distinguishing AFLD patients from healthy controls. This suggests that the model was generalizable across different datasets and highlights its potential application in clinical practice, particularly in resource-limited settings where rapid diagnosis is needed. The confusion matrix analysis showed an accuracy of 0.66, a positive predictive value (PPV) of 0.67, and a negative predictive value (NPV) of 0.65, indicating solid classification accuracy for early AFLD screening. The relatively high NPV suggests that the model is particularly effective at identifying individuals without the disease, thereby minimizing the risk of misdiagnosis and suggesting clinical use [32]. DCA of the model’s clinical utility showed that the decisions based on the AFLD diagnostic model resulted in a higher net benefit. DCA, which evaluates the practical value of a model by considering clinical decision thresholds, sensitivity, specificity, and the cost-effectiveness [33]. This analysis suggests that the AFLD diagnostic model offers substantial economic and practical value, aiding early screening and enabling personalized treatment strategies for AFLD.
A key advantage of the risk scoring model lies in its simplicity and high practical utility. Clinicians can quickly calculate individual risk scores for patients using a nomogram, facilitating its integration into clinical practice [34]. Designed with routine clinical data, the model is well-suited for real-world healthcare settings. By assessing key clinical features, healthcare providers can evaluate AFLD risk reducing reliance on expensive equipment or complex tests, and enabling personalized management [35]. This approach emphasizes the significance of established AFLD risk factors - such as alcohol consumption, dyslipidemia (LDL and HDL), liver function markers (e.g., ALT), and liver stiffness - and illustrates the interplay of these factors in the pathogenesis of AFLD.
Although the risk scoring model demonstrated promising diagnostic performance, further optimization is necessary. The model showed strong performance in the training set (AUC = 0.81), but its performance in the validation set was slightly lower (AUC = 0.67), suggesting that the model’s generalizability requires additional validation. This variation could stem from factors such as sample diversity, data quality, and other potential confounders. Specifically, the conclusions drawn from the machine learning model need further validation using clinical data to improve its clinical applicability and reliability, which remains a limitation of this study. To address this limitation, future research should focus on validating the model’s stability and generalizability using larger-scale, multi-center cohorts. Moreover, the model can be refined based on the specific characteristics of different regions or populations, enhancing its applicability across diverse patient groups. Future studies should also explore the inclusion of additional biomarkers, such as metabolites and inflammatory markers, to improve the model’s accuracy. Given the multifactorial pathogenesis of AFLD, incorporating indicators of hepatic fat accumulation, inflammation, and oxidative stress could further strengthen the model. The integration of multi-omics data with machine learning techniques may also enhance its diagnostic sensitivity and specificity. Furthermore, the current risk scoring model should be evaluated in future clinical research for its predictive capacity across different stages of AFLD, particularly in early stages with lower liver stiffness or in patients with comorbidities. Long-term follow-up studies will also be invaluable for assessing the model’s performance.
Conclusion
This study successfully developed an AFLD risk prediction tool using a multivariate logistic regression model and validated its effectiveness for early AFLD diagnosis. Key predictors such as liver stiffness (measured by Elast PQ), liver function markers (e.g., ALT), and HDL cholesterol significantly enhanced the model’s diagnostic accuracy. Clinicians can use this tool to assess an individual’s AFLD risk based on easily obtainable clinical features (e.g., alcohol consumption, blood lipids, liver function tests) and non-invasive tests (e.g., Elast PQ). This facilitates early intervention and personalized treatment strategies. The model demonstrated excellent diagnostic performance in the training set (AUC = 0.81) and validation set (AUC = 0.67), indicating its potential for clinical use. Further validation, through confusion matrix analysis and decision curve analysis, confirmed the model’s strong clinical utility, with good sensitivity, specificity, and net benefit. These findings suggest that the developed AFLD diagnostic model holds substantial clinical value in enhancing early screening and disease assessment for AFLD.
Disclosure of conflict of interest
None.
References
- 1.Niu X, Zhu L, Xu Y, Zhang M, Hao Y, Ma L, Li Y, Xing H. Global prevalence, incidence, and outcomes of alcohol related liver diseases: a systematic review and meta-analysis. BMC Public Health. 2023;23:859. doi: 10.1186/s12889-023-15749-x. [DOI] [PMC free article] [PubMed] [Google Scholar]
- 2.Osna NA, Donohue TM Jr, Kharbanda KK. Alcoholic liver disease: pathogenesis and current management. Alcohol Res. 2017;38:147–161. [PMC free article] [PubMed] [Google Scholar]
- 3.Gomes NBN, Torres US, Ferraz M, D’Ippolito G. Advanced magnetic resonance imaging for detection of liver fibrosis and inflammation in autoimmune hepatitis: a state-of-the-art review. Semin Ultrasound CT MR. 2024;45:464–475. doi: 10.1053/j.sult.2024.07.010. [DOI] [PubMed] [Google Scholar]
- 4.Xiong M, Xu Y, Zhao Y, He S, Zhu Q, Wu Y, Hu X, Liu L. Quantitative analysis of artificial intelligence on liver cancer: a bibliometric analysis. Front Oncol. 2023;13:990306. doi: 10.3389/fonc.2023.990306. [DOI] [PMC free article] [PubMed] [Google Scholar]
- 5.Atzori SM, Pasha Y, Maurice JB, Taylor-Robinson SD, Campbell L, Lim AKP. Prospective evaluation of liver shearwave elastography measurements with 3 different technologies and same day liver biopsy in patients with chronic liver disease. Dig Liver Dis. 2024;56:484–494. doi: 10.1016/j.dld.2023.10.020. [DOI] [PubMed] [Google Scholar]
- 6.Taru MG, Neamti L, Taru V, Procopciuc LM, Procopet B, Lupsor-Platon M. How to identify advanced fibrosis in adult patients with Non-Alcoholic Fatty Liver Disease (NAFLD) and Non-Alcoholic Steatohepatitis (NASH) using ultrasound elastography-a review of the literature and proposed multistep approach. Diagnostics (Basel) 2023;13:788. doi: 10.3390/diagnostics13040788. [DOI] [PMC free article] [PubMed] [Google Scholar]
- 7.Roccarina D, Iogna Prat L, Pallini G, Guerrero Misas M, Buzzetti E, Saffioti F, Aricò FM, Mantovani A, Koutli E, Goyale A, Rosselli M, Luong TV, Pinzani M, Tsochatzis EA. Comparison of point-shear wave elastography (ElastPQ) and transient elastography (FibroScan) for liver fibrosis staging in patients with non-alcoholic fatty liver disease. Liver Int. 2022;42:2195–2203. doi: 10.1111/liv.15297. [DOI] [PubMed] [Google Scholar]
- 8.Wang Z, Liu Y, Zhao X, Liu S, Liu Y, Wang D. Aronia melanocarpa prevents alcohol-induced chronic liver injury via regulation of Nrf2 signaling in C57BL/6 mice. Oxid Med Cell Longev. 2020;2020:4054520. doi: 10.1155/2020/4054520. [DOI] [PMC free article] [PubMed] [Google Scholar]
- 9.Torruellas C, French SW, Medici V. Diagnosis of alcoholic liver disease. World J Gastroenterol. 2014;20:11684–11699. doi: 10.3748/wjg.v20.i33.11684. [DOI] [PMC free article] [PubMed] [Google Scholar]
- 10.Wu KT, Kuo PL, Su SB, Chen YY, Yeh ML, Huang CI, Yang JF, Lin CI, Hsieh MH, Hsieh MY, Huang CF, Lin WY, Yu ML, Dai CY, Wang HY. Nonalcoholic fatty liver disease severity is associated with the ratios of total cholesterol and triglycerides to high-density lipoprotein cholesterol. J Clin Lipidol. 2016;10:420–425. e1. doi: 10.1016/j.jacl.2015.12.026. [DOI] [PubMed] [Google Scholar]
- 11.Cui X, Du M, Wei K, Dai C, Yang RYH, Zhou B, Luo Z, Yang X, Yu Y, Lin W, Wu Y, Liu Y. Study of Xuanhuang Pill in protecting against alcohol liver disease using ultra-performance liquid chromatography/time-of-flight mass spectrometry and network pharmacology. Front Endocrinol (Lausanne) 2023;14:1175985. doi: 10.3389/fendo.2023.1175985. [DOI] [PMC free article] [PubMed] [Google Scholar]
- 12.Ma L, Wang J, Ma L, Ge Y, Wang XM. The effect of lipid metabolism disorder on patients with hyperuricemia using Multi-Omics analysis. Sci Rep. 2023;13:18211. doi: 10.1038/s41598-023-45564-8. [DOI] [PMC free article] [PubMed] [Google Scholar]
- 13.Kim E, Park SH. Diagnosis and severity assessment of alcohol-related liver disease. Korean J Gastroenterol. 2020;76:60–64. doi: 10.4166/kjg.2020.76.2.60. [DOI] [PMC free article] [PubMed] [Google Scholar]
- 14.Kong LZ, Chandimali N, Han YH, Lee DH, Kim JS, Kim SU, Kim TD, Jeong DK, Sun HN, Lee DS, Kwon T. Pathogenesis, early diagnosis, and therapeutic management of alcoholic liver disease. Int J Mol Sci. 2019;20:2712. doi: 10.3390/ijms20112712. [DOI] [PMC free article] [PubMed] [Google Scholar]
- 15.Seitz HK, Bataller R, Cortez-Pinto H, Gao B, Gual A, Lackner C, Mathurin P, Mueller S, Szabo G, Tsukamoto H. Alcoholic liver disease. Nat Rev Dis Primers. 2018;4:16. doi: 10.1038/s41572-018-0014-7. [DOI] [PubMed] [Google Scholar]
- 16.Kitazawa A, Fukuda Y. Sex-specific association of body mass index and fatty liver index with prevalence of renal hyperfiltration: a cross sectional study using Japanese health check-up data. BMC Nephrol. 2023;24:85. doi: 10.1186/s12882-023-03137-x. [DOI] [PMC free article] [PubMed] [Google Scholar]
- 17.Lai JR, Hsu YW, Pan TM, Lee CL. Monascin and ankaflavin of monascus purpureus prevent alcoholic liver disease through regulating AMPK-mediated lipid metabolism and enhancing both anti-inflammatory and anti-oxidative systems. Molecules. 2021;26:6301. doi: 10.3390/molecules26206301. [DOI] [PMC free article] [PubMed] [Google Scholar]
- 18.Sun FR, Wang BY. Alcohol and metabolic-associated fatty liver disease. J Clin Transl Hepatol. 2021;9:719–730. doi: 10.14218/JCTH.2021.00173. [DOI] [PMC free article] [PubMed] [Google Scholar]
- 19.Zhang P, Wang W, Mao M, Gao R, Shi W, Li D, Calderone R, Sui B, Tian X, Meng X. Similarities and differences: a comparative review of the molecular mechanisms and effectors of NAFLD and AFLD. Front Physiol. 2021;12:710285. doi: 10.3389/fphys.2021.710285. [DOI] [PMC free article] [PubMed] [Google Scholar]
- 20.Ran B, Guo CE, Li W, Li W, Wang Q, Qian J, Li H. Sea buckthorn (Hippophae rhamnoides L. ) fermentation liquid protects against alcoholic liver disease linked to regulation of liver metabolome and the abundance of gut microbiota. J Sci Food Agric. 2021;101:2846–2854. doi: 10.1002/jsfa.10915. [DOI] [PubMed] [Google Scholar]
- 21.Tsuzaki K, Kotani K, Fujiwara S, Sano Y, Sakane N Mima Study Group. High-density lipoprotein size distribution can differ between subjects with alcoholic and non-alcoholic fatty liver disease. Clin Lab. 2014;60:319–322. doi: 10.7754/clin.lab.2013.130228. [DOI] [PubMed] [Google Scholar]
- 22.Coronati M, Baratta F, Pastori D, Ferro D, Angelico F, Del Ben M. Added fructose in non-alcoholic fatty liver disease and in metabolic syndrome: a narrative review. Nutrients. 2022;14:1127. doi: 10.3390/nu14061127. [DOI] [PMC free article] [PubMed] [Google Scholar]
- 23.Kirpich IA, McClain CJ, Vatsalya V, Schwandt M, Phillips M, Falkner KC, Zhang L, Harwell C, George DT, Umhau JC. Liver injury and endotoxemia in male and female alcohol-dependent individuals admitted to an alcohol treatment program. Alcohol Clin Exp Res. 2017;41:747–757. doi: 10.1111/acer.13346. [DOI] [PMC free article] [PubMed] [Google Scholar]
- 24.Khazoom F, L’Écuyer S, Gilbert K, Gagné MA, Bouchard C, Rose CF, Rousseau G, Charbonney E. Impact of uric acid on liver injury and intestinal permeability following resuscitated hemorrhagic shock in rats. J Trauma Acute Care Surg. 2020;89:1076–1084. doi: 10.1097/TA.0000000000002868. [DOI] [PubMed] [Google Scholar]
- 25.Sun L, Li N, Zhang L, Chen J. The role of ElastPQ in assessing liver stiffness for non-alcoholic fatty liver disease in patients treated with atypical antipsychotic drugs. Neuropsychiatr Dis Treat. 2023;19:1491–1502. doi: 10.2147/NDT.S409210. [DOI] [PMC free article] [PubMed] [Google Scholar]
- 26.Ravichandran A, Murekatete B, Moedder D, Meinert C, Bray LJ. Photocrosslinkable liver extracellular matrix hydrogels for the generation of 3D liver microenvironment models. Sci Rep. 2021;11:15566. doi: 10.1038/s41598-021-94990-z. [DOI] [PMC free article] [PubMed] [Google Scholar]
- 27.Cai C, Song X, Chen X, Zhou W, Jin Q, Chen S, Ji F. Transient elastography in alcoholic liver disease and nonalcoholic fatty liver disease: a systemic review and meta-analysis. Can J Gastroenterol Hepatol. 2021;2021:8859338. doi: 10.1155/2021/8859338. [DOI] [PMC free article] [PubMed] [Google Scholar]
- 28.Stickel F, Datz C, Hampe J, Bataller R. Pathophysiology and management of alcoholic liver disease: update 2016. Gut Liver. 2017;11:173–188. doi: 10.5009/gnl16477. [DOI] [PMC free article] [PubMed] [Google Scholar]
- 29.Yang YM, Cho YE, Hwang S. Crosstalk between oxidative stress and inflammatory liver injury in the pathogenesis of alcoholic liver disease. Int J Mol Sci. 2022;23:774. doi: 10.3390/ijms23020774. [DOI] [PMC free article] [PubMed] [Google Scholar]
- 30.Diao Y, Nie J, Tan P, Zhao Y, Zhao T, Tu J, Ji H, Cao Y, Wu Z, Liang H, Huang H, Li Y, Gao X, Zhou L. Long-term low-dose ethanol intake improves healthspan and resists high-fat diet-induced obesity in mice. Aging (Albany NY) 2020;12:13128–13146. doi: 10.18632/aging.103401. [DOI] [PMC free article] [PubMed] [Google Scholar]
- 31.Wong VW. Application of point shear wave elastography in alcohol-related liver disease. Hepatol Int. 2020;14:161–163. doi: 10.1007/s12072-020-10027-z. [DOI] [PubMed] [Google Scholar]
- 32.Huelsmann M, Neuhold S, Strunk G, Moertl D, Berger R, Prager R, Abrahamian H, Riedl M, Pacher R, Luger A, Clodi M. NT-proBNP has a high negative predictive value to rule-out short-term cardiovascular events in patients with diabetes mellitus. Eur Heart J. 2008;29:2259–2264. doi: 10.1093/eurheartj/ehn334. [DOI] [PubMed] [Google Scholar]
- 33.Zhong J, Liao X, Peng S, Cao J, Liu Y, Liu C, Qiu J, Guan X, Zhang Y, Liu X, Peng S. A visualized dynamic prediction model for overall survival in elderly patients with pancreatic cancer for smart medical services. Front Public Health. 2022;10:885624. doi: 10.3389/fpubh.2022.885624. [DOI] [PMC free article] [PubMed] [Google Scholar]
- 34.Song D, Ge Q, Chen M, Bai S, Lai X, Huang G, Liu M, Lin M, Xu J, Dong F. Development and validation of a nomogram for prediction of the risk of MAFLD in an overweight and obese population. J Clin Transl Hepatol. 2022;10:1027–1033. doi: 10.14218/JCTH.2021.00317. [DOI] [PMC free article] [PubMed] [Google Scholar]
- 35.Duan F, Liu C, Liu Y, Chang C, Zhai H, Xing H, Cheng J, Yang S. Nomogram to predict the survival of chinese patients with alcohol-related liver disease. Can J Gastroenterol Hepatol. 2021;2021:4073503. doi: 10.1155/2021/4073503. [DOI] [PMC free article] [PubMed] [Google Scholar]