

Abstract
Objective: To evaluate the effect of FOLFOX-HAIC combined with PD-1 inhibitor immunotherapy on the survival of patients with advanced hepatocellular carcinoma (HCC). Method: This retrospective study analyzed 137 patients with advanced HCC, of which 71 received FOLFOX-HAIC chemotherapy (control group) and 66 received FOLFOX-HAIC combined with PD-1 inhibitors (research group) between January 2020 and August 2021. Propensity score matching (PSM) was employed to account for confounding variables. Cox regression analysis was utilized to identify independent risk factors that sabotaged patients’ survival, and Kaplan-Meier curves were applied to demonstrate patients’ overall survival (OS). Results: A significantly higher disease control rate (DCR) was observed in the research group than that in the control group (77.27% vs. 60.56%, P = 0.035). Prior to PSM analysis, the OS of patients in the research group was calculated to be 25 months, which was significantly higher than the 14 months in the control group (P = 0.015). While post PSM analysis, the median OS turned out to be 27 months in the research group, still significantly higher in comparison to the control group (P = 0.001), whose OS was 14 months. By multivariate analysis, the maximum tumor diameter, Eastern Cooperative Oncology Group Performance Status score, and treatment regimen were identified as independent factors affecting patients’ prognosis. Conclusion: FOLFOX-HAIC combined with PD-1 inhibitor immunotherapy can significantly prolong the survival in patients with advanced HCC. Apparently, this combined therapy is advantageous at extending patient’s survival time in comparison to the use of FOLFOX-HAIC therapy alone.
Keywords: FOLFOX-HAIC, PD-1 inhibitor, middle and advanced liver cancer, survival, targeted immunotherapy
Introduction
Primary liver cancer is one of the most common malignant tumors worldwide, with hepatocellular carcinoma (HCC) being the most prevalent subtype, accounting for up to 80% of all liver cancer cases [1]. According to the 2020 Global Cancer Statistics, liver cancer was the second most prevalent cause of cancer-related mortality, rising from third place in 2018 [2], with over 900,000 incident cases and approximately 830,000 deaths recorded annually. What’s worse, among these liver cancer-associated incident cases and deaths, approximately half of them occur in China. This malignancy is ranked as the fifth leading cause of death in China and the most lethal of all malignant tumors [3,4]. Liver cancer often occurs insidiously and progresses rapidly. Most patients, once diagnosed, are already at an advanced stage, accompanied by serious conditions such as viral hepatitis and cirrhosis, leading to reduction in surgical rates and increases in treatment burden; most importantly, with a five-year survival rate of less than 10% [5,6]. Therefore, middle- and late-stage liver cancer poses a significant threat to public health, making it essential to explore effective treatment plans to improve survival rates and quality of life for liver cancer patients.
For patients with early-stage HCC, radical treatment options such as liver transplantation, local ablation, or surgical resection can be pursued. However, even after curative treatments, the recurrence rate of HCC remains as high as 80% [7]. For HCC patients who do not fit surgery or other radical treatments, Transarterial Chemoembolization (TACE) and systemic antitumor therapies are the primary options for treatment. These treatments aim to control disease progression, alleviate symptoms, and extend patients’ survival as long as possible [8]. FOLFOX regimen (oxaliplatin + leucovorin calcium + 5-fluorouracil) combined with Hepatic Artery Infusion Chemotherapy (FOLFOX-HAIC) is an endovascular intervention that delivers chemotherapeutics directly into the feeding artery of liver tumors via an indwelling arterial catheter or fully implantable catheter system. This combined therapy has proved to be safe and effective in the treatment of advanced HCC [9]. Programmed Death-1 (PD-1) is an immune checkpoint receptor expressed in immune cells such as T cells and B cells, while PD-L1 (ligand of PD-1) is expressed in various tissue cells, including tumor tissue cells. The binding of PD-L1 to PD-1 is a major mechanism for tumors to escape from immune protection within human bodies. Hence, the inhibitors of PD-1 and PD-L1 can intervene in this mechanism by disrupting their interactions, thereby activating T cells and restoring the immune system’s ability to target tumor cells [10,11]. PD-1 inhibitors used in clinical practices include Nivolumab, Pembrolizumab, and Cemiplimab. These drugs have shown promise in disrupting the PD-1/PD-L1 interaction and restoring immune cell activity against tumor cells, making them a key component of tumor immunotherapy [12,13].
This study retrospectively analyzed the effect of FOLFOX-HAIC combined with PD-1 inhibitors on survival in patients with advanced HCC, with hope to provide valuable insights into an effective treatment strategy that could significantly improve clinical outcomes and guide therapeutic approaches for patients with advanced HCC.
Methods and materials
Case selection
This study is a retrospective analysis of 137 patients with intermediate or advanced HCC who were either non-stable or refused surgical resection, visiting our hospital between January 2020 and August 2021. Among them, 71 patients with intermediate or advanced HCC who received FOLFOX-HAIC alone were designated as the control group, and the remaining 66 patients undergoing FOLFOX-HAIC combined with PD-1 inhibitor targeted immunotherapy were designated as the research group. This study was approved by the Medical Ethics Committee of Sun Yat-sen University Cancer Center Gansu Hospital.
Inclusion Criteria: (1) Diagnosis of HCC confirmed by clinical evaluation or histopathological examination, in accordance with the European Association for the Study of the Liver’s clinical practice guidelines [14]; (2) Liver function classified as A or B according to the Child-Pugh classification; (3) Eastern Cooperative Oncology Group Performance Status (ECOG PS) scores between 0 and 2 [15]; (4) At least one measurable intrahepatic lesion; (5) No history of organ transplantation or immunodeficiency diseases; (6) Patients with severe underlying conditions (e.g., heart, brain, lung, or renal insufficiency).
Exclusion Criteria: (1) Previous systemic treatments or radiation therapy; (2) Other malignancies or symptomatic brain metastases; (3) Autoimmune diseases or other immune system disorders; (4) Incomplete follow-up or missing data; (5) Allergy or intolerance to the study medication.
Therapeutic regimen
Patients in the control group received FOLFOX-HAIC alone. The treatment procedures were as follows: Patients were initially sterilized and anesthetized locally with 2% lidocaine, after which their femoral arteries (or alternative) were punctured using the Seldinger technique. A 5F vascular sheath was inserted through the puncture with a 5FR catheter being guided into the celiac trunk artery and superior mesenteric artery to confirm the tumor’s feeding artery via digital subtraction angiography. A microcatheter was then inserted into the feeding artery to perform the second angiography. Subsequently, the chemotherapy protocol was delivered: 85 mg/m2 oxaliplatin via arterial pump for 2 hours, 400 mg/m2 leucovorin calcium over 1 hour, 400 mg/m2 5-fluorouracil as an arterial bolus, and 2400 mg/m2 5-fluorouracil for 46 hours via arterial infusion. The treatment was repeated every 3 weeks.
Patients in the research group underwent the same FOLFOX-HAIC treatment as the control group in addition to PD-1 inhibitors. The four PD-1 inhibitors used in the study were cindillimab, carilizuzumab, triprizumab, and tirellizumab. The recommended dose for cindillimab, carilizumab, and tirellizumab was 200 mg per dose, administered intravenously every 3 weeks. Triprizumab was given at 3 mg/kg, intravenously every 2 weeks. The infusion process lasted 60 minutes, and patients were monitored for treatment-related adverse reactions, with adjustments or discontinuation required for significant adverse events or disease progression.
Data collection
General data
Basic information, including age, gender (male/female), body mass index (BMI), smoking history (yes/no), alcohol consumption history (yes/no), cirrhosis status (yes/no), maximum tumor diameter, ECOG PS score (0-1/2), and Child-Pugh grade (A/B), was obtained from both groups via the hospital’s electronic medical record system.
Laboratory data collection
All patients underwent blood tests for serum alpha-fetoprotein (AFP), serum albumin (Alb), total bilirubin (TBil), alanine aminotransferase (ALT), and aspartate aminotransferase (AST).
Follow-ups
Patients underwent imaging examinations (CT or MRI) of the upper abdomen every 3-6 weeks after treatment. In addition, they were followed up by telephone calls, WeChat texting, and mandated hospital visits every 3 months. These follow-ups lasted for a total of 3 years and were discontinued either until the death of patients or the study cut-off date (August 29, 2024).
Therapeutic efficacy evaluation
The first efficacy evaluation was conducted about one month after the completion of the first treatment, with subsequent evaluations carried out every 2-3 months until disease progression or patient death. Enhanced CT or MR imaging results before and after treatment were assessed using the Modified Response Evaluation Criteria in Solid Tumors (mRECIST) [16]. Responses to tumor treatment were categorized as Progressive Disease (PD), Stable Disease (SD), Partial Response (PR), and Complete Response (CR), as defined in Table 1. The key indicators in the efficacy assessment included Objective Response Rate (ORR), calculated as ORR = (CR + PR)/total cases × 100%, and Disease Control Rate (DCR), calculated as DCR = (CR + PR + SD)/total cases × 100%.
Table 1.
mRECIST
| Category | mRECIST Criteria Description |
|---|---|
| CR | All target lesion enhancements are visible during the arterial phase and have completely disappeared. |
| PR | The sum of the diameters of the target lesion enhancements during the arterial phase and has decreased by ≥ 30%. |
| SD | The sum of the diameters of the target lesion enhancements during the arterial phase has decreased but not reached PR, or has increased but not reached PD. |
| PD | The sum of the diameters of the target lesion enhancements during the arterial phase has increased by ≥ 20% or new lesions have appeared. |
Note: mRECIST, Modified Response Evaluation Criteria in Solid Tumors; CR, Complete Response; PR, Partial Response; SD, Stable Disease; PD, Progressive Disease.
Statistical methods
Data analysis was performed using SPSS 26.00 and R 4.3.3 software. Continuous variables were assessed for normality using the Shapiro-Wilk test. Variables conforming to normal distribution were expressed as Mean ± Standard Deviation and compared using the independent sample t-test. Non-normally distributed variables were expressed as median (interquartile range) and compared using the Mann-Whitney U test. Categorical data were expressed as frequencies and percentages [n (%)], with group comparisons conducted using the chi-square test. To control for potential confounders, propensity score matching (PSM) was applied using R software. The Cox proportional hazards model was used to analyze independent risk factors that affected patients’ survival. Kaplan-Meier survival curves were generated, and group differences were compared using the Log-Rank test. Receiver operating characteristic (ROC) curves were used to assess the efficacy of independent prognostic factors. Statistical significance was set at P < 0.05.
Results
Comparison of baseline data between the two groups
The mean age and maximum tumor diameter in the research group were significantly lower than those in the control group (P = 0.001, 0.014). However, there were no statistically significant differences between the two groups in terms of gender, BMI, histories of smoking and alcohol use, ECOG PS, cirrhosis status, AFP level, Child-Pugh grade, and the levels of ALT, AST, Alb, and TBil (all P > 0.05). See Table 2.
Table 2.
Analysis of the basic clinical characteristics in the two groups
| Factor | Control group (n = 71) | Research group (n = 66) | t/χ2 | P |
|---|---|---|---|---|
| Age | 59.94±6.47 | 56.48±5.97 | 3.246 | 0.001 |
| Gender | ||||
| Male | 57 | 54 | 0.053 | 0.819 |
| Female | 14 | 12 | ||
| BMI (kg/cm2) | 22.39±3.01 | 21.84±2.91 | 1.098 | 0.274 |
| Maximum tumor diameter (cm) | 9.44±2.23 | 8.54±2.00 | 2.492 | 0.014 |
| History of smoking | ||||
| Yes | 54 | 53 | 0.361 | 0.548 |
| No | 17 | 13 | ||
| History of alcohol use | ||||
| Yes | 56 | 53 | 0.043 | 0.836 |
| No | 15 | 13 | ||
| ECOG PS | ||||
| 0-1 point | 36 | 38 | 0.650 | 0.420 |
| ≥ 2 point | 35 | 28 | ||
| Cirrhosis | ||||
| Yes | 40 | 34 | 0.320 | 0.571 |
| No | 31 | 32 | ||
| AFP | ||||
| ≥ 400 ng/mL | 38 | 33 | 0.170 | 0.680 |
| < 400 ng/mL | 33 | 33 | ||
| Child-Pugh | ||||
| A | 52 | 53 | 0.953 | 0.329 |
| B | 19 | 13 | ||
| ALT (IU/L) | 55.22±8.90 | 54.57±9.84 | 0.405 | 0.686 |
| AST (IU/L) | 62.45±9.63 | 62.27±11.88 | 0.101 | 0.920 |
| Alb (µmol/L) | 42.48±6.51 | 40.78±6.41 | 1.539 | 0.126 |
| TBil (g/L) | 19.98±4.18 | 21.36±4.42 | -1.874 | 0.063 |
Note: BMI, Body Mass Index; ECOG PS, Eastern Cooperative Oncology Group performance status; AFP, Alpha-fetoprotein; AST, Aspartate Aminotransferase; ALT, Alanine Aminotransferase; Alb, Albumin; TBil, Total Bilirubin; Child-Pugh, Child-Pugh Score.
Evaluation and analysis of therapeutic efficacies in the two groups
Using the mRECIST, the control group showed CR in 5 patients (7.04%), PR in 18 patients (25.35%), PD in 28 patients (39.44%), and SD in 20 patients (28.17%), with an ORR of 32.39%, and a DCR of 60.56%. In the research group, 9 patients achieved CR (13.64%), 23 patients PR (34.85%), 15 patients PD (22.73%), and 20 patients SD (28.79%), with an ORR of 48.49%, and a DCR of 77.27%.
Comparatively, the DCR in the research group was significantly better than that in the control group (P = 0.035), while there was no significant difference in ORR between the two groups (P = 0.055). See Table 3.
Table 3.
Evaluation of therapeutic efficacy after treatment in both groups
| Tumor response | Control group (n = 71) | Research group (n = 66) | t/χ2 | P |
|---|---|---|---|---|
| CR | 5 (7.04) | 9 (13.64) | 4.955 | 0.175 |
| PR | 18 (25.35) | 23 (34.85) | ||
| PD | 28 (39.44) | 15 (22.73) | ||
| SD | 20 (28.17) | 19 (28.79) | ||
| ORR | 32.39% | 48.49% | 3.685 | 0.055 |
| DCR | 60.56% | 77.27% | 4.435 | 0.035 |
Note: CR, Complete Response; PR, Partial Response; PD, Progressive Disease; SD, Stable Disease; ORR, Overall Response Rate; DCR, Disease Control Rate.
Survival analysis
At the end of the 3-year follow-ups, 13 patients (18.31%) had survived and 58 patients (81.69%) died in the control group. The results from the research group were 23 (34.85%) and 43 (65.15%), respectively. Kaplan-Meier survival analysis revealed that the median overall survival (OS) of patients in the research group was 25 months, significantly higher than the 14 months in the control group (P = 0.015). See Figure 1.
Figure 1.
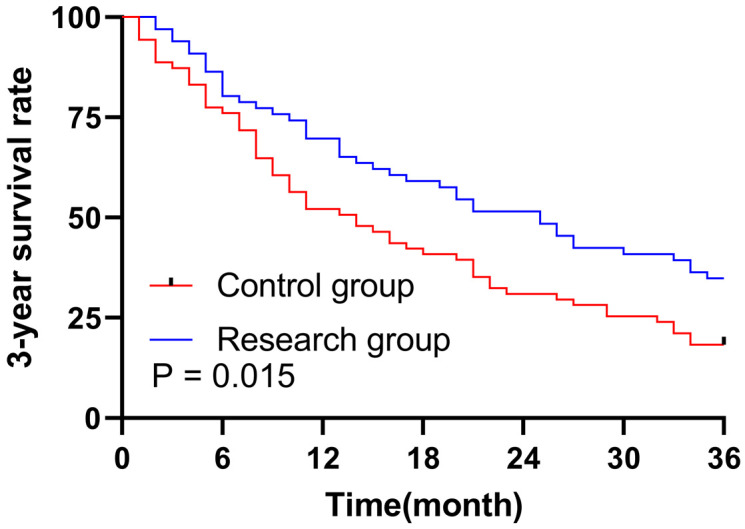
Survival curve analysis of the 3-year overall survival in both groups.
Univariate and multivariate analyses of patients’ survival
Cox regression analysis of survival in HCC patients revealed that age [Hazard Ratio (HR) = 0.963, P = 0.014], gender (HR = 0.624, P = 0.042), maximum tumor diameter (HR = 1.182, P < 0.001), smoking history (HR = 0.431, P < 0.001), ECOG PS scores (HR = 0.300, P < 0.001), cirrhosis (HR = 3.406, P < 0.001), AFP (HR = 4.318, P < 0.001), Child-Pugh grade (HR = 0.462, P = 0.001), ALT (HR = 1.064, P < 0.001), AST (HR = 1.054, P < 0.001), Alb (HR = 0.919, P < 0.001), TBil (HR = 1.086, P < 0.001), and treatment regimen (HR = 0.616, P = 0.016) were all significantly associated with patient survival. See Table 4. After adjusting for potential confounders, the maximum tumor diameter (HR = 1.004, P < 0.001), ECOG PS score (HR = 0.662, P = 0.025), AFP (HR = 1.831, P = 0.032), and treatment regimen (HR = 0.737, P = 0.004) were identified as independent prognostic factors for the prediction of patients’ survival time. See Table 5.
Table 4.
Univariate Cox regression analysis of risk factors affecting patients’ outcomes
| Factor | β | S.E. | P | HR | 95% CI | |
|---|---|---|---|---|---|---|
|
| ||||||
| Lower | Upper | |||||
| Age | -0.038 | 0.015 | 0.014 | 0.963 | 0.935 | 0.992 |
| BMI | -0.004 | 0.035 | 0.915 | 0.996 | 0.930 | 1.067 |
| Gender | -0.472 | 0.232 | 0.042 | 0.624 | 0.395 | 0.984 |
| Maximum diameter of tumor | 0.249 | 0.042 | 0.000 | 1.283 | 1.182 | 1.392 |
| History of smoking | -0.841 | 0.225 | 0.000 | 0.431 | 0.278 | 0.670 |
| History of alcohol use | -0.409 | 0.229 | 0.074 | 0.664 | 0.424 | 1.041 |
| ECOG PS | -1.204 | 0.214 | 0.000 | 0.300 | 0.197 | 0.456 |
| Cirrhosis | 1.226 | 0.228 | 0.000 | 3.406 | 2.180 | 5.321 |
| AFP | 1.463 | 0.227 | 0.000 | 4.318 | 2.765 | 6.742 |
| Child Pugh | -0.772 | 0.222 | 0.001 | 0.462 | 0.299 | 0.715 |
| ALT | 0.062 | 0.011 | 0.000 | 1.064 | 1.042 | 1.087 |
| AST | 0.052 | 0.009 | 0.000 | 1.054 | 1.036 | 1.072 |
| Alb | -0.084 | 0.017 | 0.000 | 0.919 | 0.890 | 0.950 |
| TBil | 0.129 | 0.024 | 0.000 | 1.137 | 1.086 | 1.191 |
| Treatment | -0.485 | 0.202 | 0.016 | 0.616 | 0.415 | 0.915 |
Note: BMI, Body Mass Index; ECOG PS, Eastern Cooperative Oncology Group performance status; AFP, Alpha-fetoprotein; ALT, Alanine Aminotransferase; AST, Aspartate Aminotransferase; Alb, Albumin; TBil, Total Bilirubin; Child Pugh, Child-Pugh Score; HR, Hazard Ratio; S.E., Standard Error; CI, Confidence Interval.
Table 5.
Multivariate Cox regression analysis of independent risk factors affecting patients’ outcomes
| Factor | β | S.E. | P | HR | 95% CI | |
|---|---|---|---|---|---|---|
|
| ||||||
| Lower | Upper | |||||
| Age | -0.027 | 0.017 | 0.109 | 0.974 | 0.943 | 1.006 |
| Gender | 0.099 | 0.256 | 0.698 | 1.105 | 0.668 | 1.826 |
| Maximum diameter of tumor | 0.235 | 0.061 | 0.000 | 1.004 | 0.891 | 1.132 |
| History of smoking | -0.219 | 0.243 | 0.367 | 0.803 | 0.499 | 1.293 |
| ECOG PS | -0.412 | 0.247 | 0.025 | 0.662 | 0.408 | 1.076 |
| Cirrhosis | 0.441 | 0.277 | 0.112 | 1.554 | 0.903 | 2.674 |
| AFP | 0.605 | 0.282 | 0.032 | 1.831 | 1.053 | 3.185 |
| Child Pugh | -0.258 | 0.250 | 0.302 | 0.773 | 0.473 | 1.261 |
| ALT | 0.018 | 0.013 | 0.162 | 1.018 | 0.993 | 1.044 |
| AST | 0.011 | 0.012 | 0.378 | 1.011 | 0.987 | 1.035 |
| Alb | -0.036 | 0.019 | 0.060 | 0.964 | 0.929 | 1.002 |
| TBil | 0.059 | 0.028 | 0.067 | 1.061 | 1.003 | 1.122 |
| Treatment | -0.306 | 0.224 | 0.004 | 0.737 | 0.475 | 1.142 |
Note: ECOG PS, Eastern Cooperative Oncology Group performance status; AFP, Alpha-fetoprotein; ALT, Alanine Aminotransferase; AST, Aspartate Aminotransferase; Alb, Albumin; TBil, Total Bilirubin; Child Pugh, Child-Pugh Score; HR, Hazard Ratio; S.E., Standard Error; CI, Confidence Interval.
Independent prognostic factors for predicting patients’ outcomes
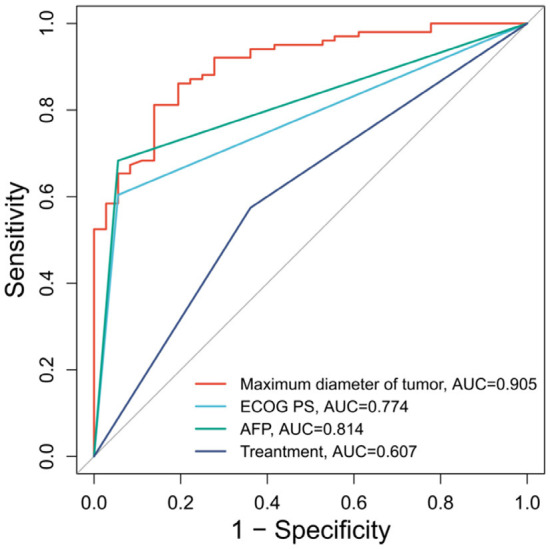
ROC curve analysis for predicting the 3-year survival in patients after treatment showed that the maximum tumor diameter with a cutoff value of 8.17 cm was accurate in the prediction (AUC = 0.905, specificity = 86.11%, sensitivity = 81.19%, Youden index = 67.30%). The AFP level also performed well in predicting patients’ survival time, with an AUC of 0.814, specificity of 94.44%, sensitivity of 68.32%, and Youden index of 62.76%. In contrast, ECOG PS scores demonstrated high specificity (94.44%) but low sensitivity (60.40%) and Youden index (54.84%) in terms of the prediction work. The treatment regimen was the least accurate in general among all the prognostic factors (AUC = 0.607, specificity = 63.89%, sensitivity = 57.43%, Youden index = 21.31%). See Table 6 and Figure 2.
Table 6.
ROC curve analysis of independent prognostic factors
| Marker | Cutoff | AUC | Specificity | Sensitivity | Youden_index |
|---|---|---|---|---|---|
| Maximum diameter of tumor | 8.17 | 0.905 | 86.11% | 81.19% | 67.30% |
| ECOG PS | - | 0.774 | 94.44% | 60.40% | 54.84% |
| AFP | - | 0.814 | 94.44% | 68.32% | 62.76% |
| Treatment | - | 0.607 | 63.89% | 57.43% | 21.31% |
Note: ROC, Receiver operating characteristics; ECOG PS, Eastern Cooperative Oncology Group performance status; AFP, Alpha-fetoprotein; HR, Hazard Ratio; S.E., Standard Error; AUC, Area Under the Curve.
Figure 2.
The ROC curve of each factor in predicting patient treatment outcomes. Note: ROC, Receiver operating characteristics; ECOG PS, Eastern Cooperative Oncology Group performance status; AFP, Alpha-fetoprotein.
Comparison of baseline data between the two groups after PSM
After PSM, there were no statistically significant differences between the groups in terms of age, sex, BMI, tumor diameter, histories of smoking and alcohol use, ECOG PS scores, cirrhosis status, AFP level, Child-Pugh grade, or the levels of ALT, AST, Alb, and TBil (all P > 0.05). See Figure 3A, 3B and Table 7.
Figure 3.

Comparison of baseline data between the control group and the research group after PSM. A. Comparison of SMD for covariate balance. B. Density distribution plots of the two groups before and after PSM. Note: SMD, Standardized mean difference; BMI, Body Mass Index; ECOG PS, Eastern Cooperative Oncology Group performance status; AFP, Alpha-fetoprotein; AST, Aspartate Aminotransferase; ALT, Alanine Aminotransferase; Alb, Albumin; TBil, Total Bilirubin; Child-Pugh, Child-Pugh Score; PSM, Propensity Score Matching.
Table 7.
Analysis of the basic clinical characteristics of patients in the two groups after PSM
| Factor | Control group (n = 41) | Research group (n = 41) | t/χ2 | P |
|---|---|---|---|---|
| Age | 59.78±6.18 | 58.10±7.13 | 1.142 | 0.257 |
| Gender | ||||
| Male | 32 | 35 | 0.734 | 0.391 |
| Female | 9 | 6 | ||
| BMI (kg/cm2) | 21.90±2.80 | 21.86±3.28 | 0.06 | 0.952 |
| Maximum tumor diameter (cm) | 9.39±2.29 | 9.70±1.90 | -0.654 | 0.515 |
| History of smoking | ||||
| Yes | 30 | 33 | 0.617 | 0.432 |
| No | 11 | 8 | ||
| History of alcohol use | ||||
| Yes | 28 | 33 | 1.600 | 0.206 |
| No | 13 | 8 | ||
| ECOG PS | ||||
| 0-1 point | 20 | 23 | 0.440 | 0.507 |
| ≥ 2 point | 21 | 18 | ||
| Cirrhosis | ||||
| Yes | 24 | 20 | 0.785 | 0.376 |
| No | 17 | 21 | ||
| AFP | ||||
| ≥ 400 ng/mL | 26 | 19 | 2.413 | 0.120 |
| < 400 ng/mL | 15 | 22 | ||
| Child-Pugh | ||||
| A | 32 | 34 | 0.311 | 0.577 |
| B | 9 | 7 | ||
| ALT (IU/L) | 52.83±10.51 | 55.30±7.82 | -1.207 | 0.231 |
| AST (IU/L) | 60.18±10.41 | 61.96±7.55 | -0.887 | 0.378 |
| Alb (µmol/L) | 43.35±6.85 | 41.97±5.94 | 0.976 | 0.332 |
| TBil (g/L) | 20.60±4.22 | 21.47±4.25 | -0.928 | 0.356 |
Note: BMI, Body Mass Index; ECOG PS, Eastern Cooperative Oncology Group performance status; AFP, Alpha-fetoprotein; AST, Aspartate Aminotransferase; ALT, Alanine Aminotransferase; Alb, Albumin; TBil, Total Bilirubin; Child-Pugh, Child-Pugh Score; PSM, Propensity Score Matching.
Therapeutic efficacy evaluation after PSM
After PSM, the control group showed 2 CR (4.88%), 8 PR (19.51%), 19 PD (46.34%), and 12 SD (29.27%), with an ORR of 24.39% and a DCR of 53.66%. While the research group presented 4 CR (9.76%), 15 PR (36.59%), 9 PD (21.95%), and 13 SD (31.71%), with an ORR of 46.34% and a DCR of 78.06%. Comparatively, the ORR and DCR in the research group were significantly higher than those in the control group (P = 0.038, P = 0.020). See Table 8.
Table 8.
Post-PSM Evaluation of therapeutic efficacy of patients after treatment
| Tumor response | Control group (n = 41) | Research group (n = 41) | t/χ2 | P |
|---|---|---|---|---|
| CR | 2 (4.88) | 4 (9.76) | 5.658 | 0.130 |
| PR | 8 (19.51) | 15 (36.59) | ||
| PD | 19 (46.34) | 9 (21.95) | ||
| SD | 12 (29.27) | 13 (31.71) | ||
| ORR | 24.39% | 46.34% | 4.321 | 0.038 |
| DCR | 53.66% | 78.05% | 5.423 | 0.020 |
Note: CR, Complete Response; PR, Partial Response; PD, Progressive Disease; SD, Stable Disease; ORR, Overall Response Rate; DCR, Disease Control Rate; PSM, Propensity Score Matching.
Survival analysis after PSM
After PSM, 5 patients (18.31%) in the control group survived, while 36 patients (81.69%) died. In the research group, the numbers were 17 (34.85%) and 24 (65.15%), respectively. Kaplan-Meier analysis showed that the median OS of patients in the research group was 27 months, which was markedly higher than the 14 months in the control group (P = 0.001). See Figure 4.
Figure 4.
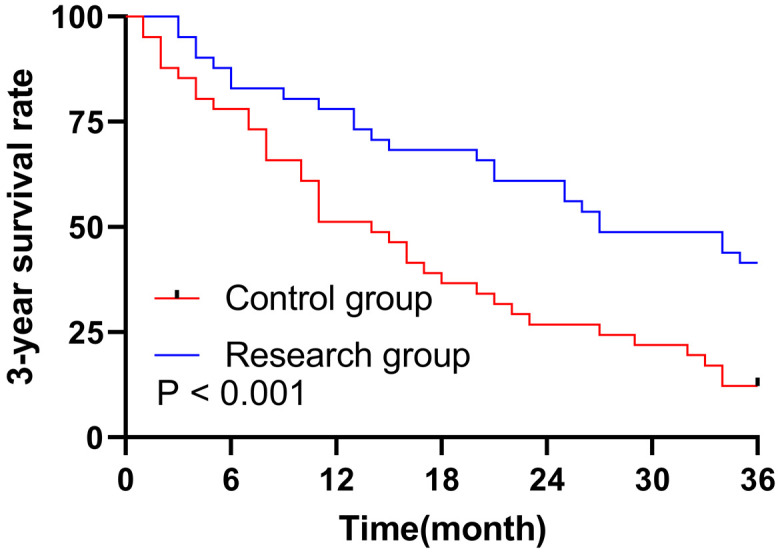
Survival curve analysis of the 3-year overall survival in the two groups after PSM. Note: PSM, Propensity score matching.
Univariate and multivariate analyses of patients’ survival after PSM
Cox regression analysis after PSM revealed that age (HR = 0.958, P = 0.026), maximum tumor diameter (HR = 1.185, P = 0.004), smoking history (HR = 0.407, P = 0.002), alcohol history (HR = 0.545, P = 0.029), ECOG PS scores (HR = 0.321, P < 0.001), cirrhosis (HR = 3.902, P < 0.001), AFP (HR = 4.538, P < 0.001), Child-Pugh grade (HR = 0.464, P = 0.012), ALT (HR = 1.060, P < 0.001), AST (HR = 1.060, P < 0.001), Alb (HR = 0.921, P < 0.001), TBil (HR = 1.146, P < 0.001), and treatment regimen (HR = 2.329, P = 0.002) were notably associated with patients’ survival after treatment. See Table 9. The maximum tumor diameter (HR = 0.995, P = 0.002), ECOG PS score (HR = 0.812, P = 0.008), and treatment regimen (HR = 1.707, P = 0.012) were identified as independent factors affecting patients’ outcomes (Table 10).
Table 9.
Univariate Cox regression analysis of the risk factors affecting patients’ outcomes after PSM
| Factor | β | S.E. | P | HR | 95% CI | |
|---|---|---|---|---|---|---|
|
| ||||||
| Lower | Upper | |||||
| Age | -0.042 | 0.019 | 0.026 | 0.958 | 0.923 | 0.995 |
| BMI | 0.018 | 0.046 | 0.695 | 1.018 | 0.931 | 1.113 |
| Gender | -0.350 | 0.307 | 0.253 | 0.704 | 0.386 | 1.285 |
| Maximum diameter of tumor | 0.169 | 0.058 | 0.004 | 1.185 | 1.057 | 1.328 |
| History of smoking | -0.898 | 0.289 | 0.002 | 0.407 | 0.231 | 0.717 |
| History of alcohol use | -0.606 | 0.277 | 0.029 | 0.545 | 0.317 | 0.939 |
| ECOG PS | -1.137 | 0.277 | 0.000 | 0.321 | 0.187 | 0.551 |
| Cirrhosis | 1.361 | 0.304 | 0.000 | 3.902 | 2.149 | 7.085 |
| AFP | 1.513 | 0.303 | 0.000 | 4.538 | 2.508 | 8.212 |
| Child Pugh | -0.769 | 0.305 | 0.012 | 0.464 | 0.255 | 0.843 |
| ALT | 0.058 | 0.014 | 0.000 | 1.060 | 1.031 | 1.090 |
| AST | 0.058 | 0.014 | 0.000 | 1.060 | 1.031 | 1.090 |
| Alb | -0.082 | 0.021 | 0.000 | 0.921 | 0.883 | 0.961 |
| TBil | 0.136 | 0.031 | 0.000 | 1.146 | 1.078 | 1.217 |
| Treatment | 0.846 | 0.267 | 0.002 | 2.329 | 1.380 | 3.932 |
Note: BMI, Body Mass Index; ECOG PS, Eastern Cooperative Oncology Group performance status; AFP, Alpha-fetoprotein; ALT, Alanine Aminotransferase; AST, Aspartate Aminotransferase; Alb, Albumin; TBiI, Total Bilirubin; Child Pugh, Child-Pugh Score; HR, Hazard Ratio; S.E., Standard Error; CI, Confidence Interval.
Table 10.
Multivariate Cox regression analysis of independent risk factors affecting patients’ outcome after PSM
| Factor | β | S.E. | P | HR | 95% CI | |
|---|---|---|---|---|---|---|
|
| ||||||
| Lower | Upper | |||||
| Age | -0.039 | 0.026 | 0.129 | 0.961 | 0.914 | 1.012 |
| Maximum diameter of tumor | -0.005 | 0.069 | 0.002 | 0.995 | 0.870 | 1.139 |
| History of smoking | 0.160 | 0.361 | 0.658 | 1.173 | 0.578 | 2.379 |
| History of alcohol use | -0.088 | 0.314 | 0.778 | 0.915 | 0.495 | 1.693 |
| ECOG PS | -0.208 | 0.356 | 0.008 | 0.812 | 0.404 | 1.631 |
| Cirrhosis | 0.344 | 0.353 | 0.330 | 1.410 | 0.707 | 2.814 |
| AFP | 0.797 | 0.364 | 0.058 | 2.219 | 1.088 | 4.526 |
| Child Pugh | -0.742 | 0.377 | 0.059 | 0.476 | 0.227 | 0.997 |
| ALT | 0.038 | 0.018 | 0.051 | 1.038 | 1.002 | 1.077 |
| AST | 0.025 | 0.019 | 0.191 | 1.025 | 0.988 | 1.064 |
| Alb | -0.025 | 0.026 | 0.330 | 0.975 | 0.926 | 1.026 |
| TBil | 0.065 | 0.037 | 0.077 | 1.067 | 0.993 | 1.147 |
| Treatment | 0.535 | 0.286 | 0.012 | 1.707 | 0.974 | 2.992 |
Note: ECOG PS, Eastern Cooperative Oncology Group performance status; AFP, Alpha-fetoprotein; ALT, Alanine Aminotransferase; AST, Aspartate Aminotransferase; Alb, Albumin; TBil, Total Bilirubin; Child Pugh, Child-Pugh Score; HR, Hazard Ratio; S.E., Standard Error; CI, Confidence Interval.
Evaluation of independent prognostic factors for predicting patients’ outcomes after PSM
After PSM, the ROC curve analysis for predicting the 3-year survival in patients post treatment showed that the maximum tumor diameter with a cutoff value of 9.085 cm was highly accurate in the prediction, with an AUC of 0.818, a specificity of 90.91%, a sensitivity of 73.33%, and a Youden index of 64.24%. The AUC for the ECOG PS score was 0.763, indicating good predictive power, with a specificity of 90.91%, a sensitivity of 61.67%, and a Youden index of 52.58%. Relatively, the treatment regimen showed weak predictive power, with an AUC of 0.686, a specificity of 77.27%, a sensitivity of 60.00%, and a Youden index of 37.27%. See Table 11 and Figure 5.
Table 11.
ROC curve analysis of independent prognostic factors after PSM
| Marker | Cut off | AUC | Specificity | Sensitivity | Youden_index |
|---|---|---|---|---|---|
| Maximum diameter of tumor | 9.085 | 0.818 | 90.91% | 73.33% | 64.24% |
| ECOG PS | - | 0.763 | 90.91% | 61.67% | 52.58% |
| Treatment | - | 0.686 | 77.27% | 60.00% | 37.27% |
Note: ROC, Receiver operating characteristics; ECOG PS, Eastern Cooperative Oncology Group performance status; AFP, Alpha-fetoprotein; HR, Hazard Ratio; S.E., Standard Error; AUC, Area Under the Curve; PSM, Propensity Score Matching.
Figure 5.
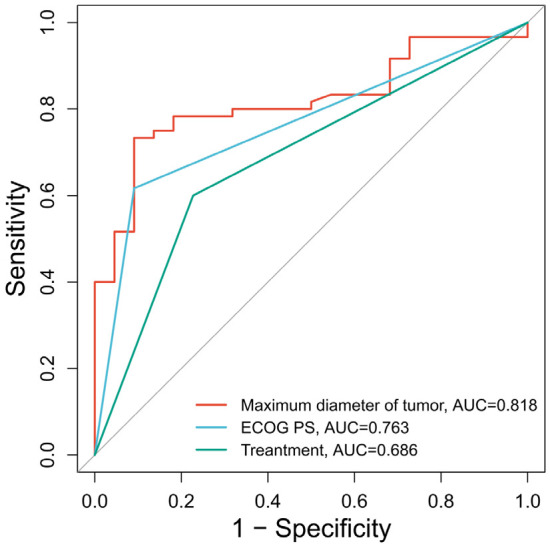
ROC curves of various factors predicting treatment outcomes of patients after PSM. Note: ROC, Receiver operating characteristics; ECOG PS, Eastern Cooperative Oncology Group performance status; PSM, Propensity Score Matching.
Discussion
HCC is a leading cause of liver malignancy worldwide, with high morbidity and mortality rates. Its incidence is expected to rise in the next 10 to 20 years, potentially peaking around 2030 [17]. In China, where new cases and deaths account for approximately half of the global liver cancer burden, the incidence has reached the highest among individuals aged between 40 and 59, with men being 2-6 times more likely to develop HCC than women [18]. Hepatitis B (HBV) and C (HCV) infections contribute to over 77% of liver cancer cases in China [19]. Due to the liver’s regenerative capacity and low pain sensitivity, most patients are diagnosed at advanced stages [8]. Current HCC treatments include surgical resection, liver transplantation, ablation, and interventional therapies such as TACE and HAIC, which are commonly used for unresectable advanced HCC [20]. However, monotherapies often demonstrate limited efficacy due to tumor heterogeneity. Recent studies suggest that combined therapies involving targeted drugs and immune checkpoint inhibitors offer improved clinical outcomes [21,22]. This study aims to evaluate the impact of FOLFOX-HAIC combined with targeted immunotherapy on the survival in patients with intermediate or advanced HCC, aiming to offer a new therapeutic approach for clinical settings.
This study demonstrated that FOLFOX-HAIC combined with PD-1 inhibitor therapy showed superior clinical efficacy compared to FOLFOX-HAIC monotherapy in patients with unresectable HCC. The combined therapy significantly improved both DCR and OS of patients, making it a promising approach for the treatment of advanced HCC. To address baseline differences between the control and research groups, such as differences in age and tumor size, PSM was applied. This approach notably adjusted for different factors and reduced bias in case selection, allowing high reliability in the study comparison [23]. After PSM, the median OS in the research group was 27 months, significantly higher than 14 months in the control group. Additionally, the research group showed higher ORR and DCR, confirming the enhanced efficacy of the combined therapy in prolonging patients’ survival. HAIC, which directly delivers FOLFOX into the hepatic artery, ensures high drug concentration at the tumor site while minimizing damage to normal liver tissue. HAIC, in comparison to TACE, is a safer and more localized approach for HCC treatment that reduces systemic toxicity and avoids embolism complications [24]. Studies, including those by Shao-Hua Li et al., have shown that FOLFOX-HAIC significantly improves patients’ survival, particularly patients with macrovascular invasion and positive HBsAg [24]. Moreover, combining HAIC with targeted immunotherapy has shown better outcomes compared to monotherapy, with notable improvements in ORR and DCR [25,26]. For instance, a patient who underwent Liver Transplantation followed by FOLFOX-HAIC and PD-1 inhibitor therapy achieved complete remission, with undetectable ctDNA and normalized AFP levels after treatment [27]. This suggests that the combined therapy may help patients with advanced HCC who are resistant to traditional treatments, particularly those with large tumors or macrovascular invasion. This FOLFOX-HAIC plus PD-1 inhibitors regimen, which targets the tumor directly through localized chemotherapy and leverages immune regulations within human bodies to enhance therapeutic outcomes, could become a highly effective treatment for advanced, unresectable HCC. However, further prospective studies are needed to validate these results, explore its long-term efficacy, and refine treatment protocols for HCC patients.
We further identified the maximum tumor diameter (HR = 0.995, P = 0.002), ECOG PS (HR = 0.812, P = 0.008), and treatment regimen (HR = 1.707, P = 0.012) as independent factors affecting the prognosis of HCC patients through Cox regression analysis. These factors are closely related to treatment outcomes and serve as crucial references for optimizing the treatment strategies for intermediate and advanced HCC patients. Specifically, the maximum tumor diameter was a significant risk factor. A tumor size greater than 5 cm has been defined in various studies as a risk factor for HCC recurrence. In general, larger tumors are associated with higher malignancy degree and worse prognosis in patients [28]. For instance, Bin-Yong Liang et al. found that the 5-year recurrence-free survival and OS rates of patients whose tumor diameters were shorter than 5 cm were 38.3% and 61.5%, respectively, notably higher in comparison to patients otherwise, whose 5-year recurrence-free survival and OS rates were 25.1% and 59.9%, respectively. This indicates that the long-term survival outcomes deteriorate significantly as tumor size increases. A tumor size greater than 5 cm is therefore an independent risk factor for tumor recurrence and poor long-term survival [29].
In addition, the ECOG PS score demonstrated significant impact on the treatment outcomes as well. In multiple malignancies, such as non-small cell lung cancer, advanced melanoma, and urological cancer, patients with impaired ECOG PS showed a lower ORR after PD-1 inhibitor treatment compared to those with a favorable ECOG PS. The ECOG PS score has been reported as an independent prognostic factor for the outcomes of patients with melanoma and non-small cell lung cancer after immunotherapy. There was one study that investigated PD-1 inhibitors combined with antiangiogenesis therapy for patients with unresectable HCC, where an ECOG PS score of 2 was recognized as an independent risk factor affecting patients’ progression-free survival [30]. This result has highlighted the importance of ECOG PS in predicting the efficacy of immunotherapy in HCC patients.
The combination of FOLFOX-HAIC and PD-1 inhibitor therapy has demonstrated significant efficacy in treating HCC patients. Hence, the combined therapy is recommended to prolong the survival of HCC patients in clinical settings. In addition, our ROC curve analysis showed that the optimal cut-off value for predicting the 3-year survival in HCC patients was 9.085 cm for the maximum tumor diameter, 2 points for the ECOG PS, as well as the FOLFOX-HAIC and PD-1 inhibitor combination, with areas under the curves to be 0.818, 0.763, and 0.686, respectively. These findings provide valuable insights into refining treatment strategies for HCC patients based on individual prognostic factors.
This study provides compelling evidence for the effectiveness of FOLFOX-HAIC combined with PD-1 inhibitor-targeted immunotherapy in patients with intermediate or advanced HCC. However, there are some limitations to consider. First, as a retrospective analysis, the study is susceptible to potential selection bias and information bias. While efforts were made to control for confounding variables using the PSM method, not all biases could be fully accounted for. Second, the relatively small sample size of the study may limit the generalizability and statistical power of the results. Furthermore, the study did not address all possible clinical variables that might influence prognosis, such as the patients’ genetic background and tumor microenvironment, factors that could significantly impact treatment efficacy and patient outcomes. Therefore, further research is needed to validate the findings through prospective, multicenter clinical trials with larger sample sizes. These future studies should also investigate additional prognostic factors to enhance the understanding of HCC treatment and its outcomes.
In conclusion, this study demonstrates that FOLFOX-HAIC combined with PD-1 inhibitor-targeted immunotherapy holds potential for prolonging survival in patients with intermediate or advanced HCC. This treatment strategy provides a novel approach for clinical management. Additionally, the study identifies maximum tumor diameter, ECOG PS score, and treatment regimen as independent factors influencing the prognosis of HCC patients, offering valuable insights for individualized treatment strategies.
Disclosure of conflict of interest
None.
References
- 1.Yeo YH, Abdelmalek M, Khan S, Moylan CA, Rodriquez L, Villanueva A, Yang JD. Current and emerging strategies for the prevention of hepatocellular carcinoma. Nat Rev Gastroenterol Hepatol. 2024:1–18. doi: 10.1038/s41575-024-01021-z. [DOI] [PubMed] [Google Scholar]
- 2.Sung H, Ferlay J, Siegel RL, Laversanne M, Soerjomataram I, Jemal A, Bray F. Global cancer statistics 2020: GLOBOCAN estimates of incidence and mortality worldwide for 36 cancers in 185 countries. CA Cancer J Clin. 2021;71:209–249. doi: 10.3322/caac.21660. [DOI] [PubMed] [Google Scholar]
- 3.Villanueva A. Hepatocellular carcinoma. N Engl J Med. 2019;380:1450–1462. doi: 10.1056/NEJMra1713263. [DOI] [PubMed] [Google Scholar]
- 4.Liu M, Zhou J, Liu X, Feng Y, Yang W, Wu F, Cheung OK, Sun H, Zeng X, Tang W, Mok MTS, Wong J, Yeung PC, Lai PBS, Chen Z, Jin H, Chen J, Chan SL, Chan AWH, To KF, Sung JJY, Chen M, Cheng AS. Targeting monocyte-intrinsic enhancer reprogramming improves immunotherapy efficacy in hepatocellular carcinoma. Gut. 2020;69:365–379. doi: 10.1136/gutjnl-2018-317257. [DOI] [PubMed] [Google Scholar]
- 5.Sarveazad A, Agah S, Babahajian A, Amini N, Bahardoust M. Predictors of 5 year survival rate in hepatocellular carcinoma patients. J Res Med Sci. 2019;24:86. doi: 10.4103/jrms.JRMS_1017_18. [DOI] [PMC free article] [PubMed] [Google Scholar]
- 6.Yang JD, Hainaut P, Gores GJ, Amadou A, Plymoth A, Roberts LR. A global view of hepatocellular carcinoma: trends, risk, prevention and management. Nat Rev Gastroenterol Hepatol. 2019;16:589–604. doi: 10.1038/s41575-019-0186-y. [DOI] [PMC free article] [PubMed] [Google Scholar]
- 7.Milana F, Polidoro MA, Famularo S, Lleo A, Boldorini R, Donadon M, Torzilli G. Surgical strategies for recurrent hepatocellular carcinoma after resection: a review of current evidence. Cancers (Basel) 2023;15:508. doi: 10.3390/cancers15020508. [DOI] [PMC free article] [PubMed] [Google Scholar]
- 8.Llovet JM, Kelley RK, Villanueva A, Singal AG, Pikarsky E, Roayaie S, Lencioni R, Koike K, Zucman-Rossi J, Finn RS. Hepatocellular carcinoma. Nat Rev Dis Primers. 2021;7:6. doi: 10.1038/s41572-020-00240-3. [DOI] [PubMed] [Google Scholar]
- 9.Sidaway P. FOLFOX-HAIC active in large HCC. Nat Rev Clin Oncol. 2022;19:5. doi: 10.1038/s41571-021-00577-y. [DOI] [PubMed] [Google Scholar]
- 10.Nikoo M, Hassan ZF, Mardasi M, Rostamnezhad E, Roozbahani F, Rahimi S, Mohammadi J. Hepatocellular carcinoma (HCC) immunotherapy by anti-PD-1 monoclonal antibodies: a rapidly evolving strategy. Pathol Res Pract. 2023;247:154473. doi: 10.1016/j.prp.2023.154473. [DOI] [PubMed] [Google Scholar]
- 11.Magen A, Hamon P, Fiaschi N, Soong BY, Park MD, Mattiuz R, Humblin E, Troncoso L, D’Souza D, Dawson T, Kim J, Hamel S, Buckup M, Chang C, Tabachnikova A, Schwartz H, Malissen N, Lavin Y, Soares-Schanoski A, Giotti B, Hegde S, Ioannou G, Gonzalez-Kozlova E, Hennequin C, Le Berichel J, Zhao Z, Ward SC, Fiel I, Kou B, Dobosz M, Li L, Adler C, Ni M, Wei Y, Wang W, Atwal GS, Kundu K, Cygan KJ, Tsankov AM, Rahman A, Price C, Fernandez N, He J, Gupta NT, Kim-Schulze S, Gnjatic S, Kenigsberg E, Deering RP, Schwartz M, Marron TU, Thurston G, Kamphorst AO, Merad M. Intratumoral dendritic cell-CD4(+) T helper cell niches enable CD8(+) T cell differentiation following PD-1 blockade in hepatocellular carcinoma. Nat Med. 2023;29:1389–1399. doi: 10.1038/s41591-023-02345-0. [DOI] [PMC free article] [PubMed] [Google Scholar]
- 12.Chen YH, Tsai CH, Chen YY, Wang CC, Wang JH, Hung CH, Kuo YH. Real-world comparison of pembrolizumab and nivolumab in advanced hepatocellular carcinoma. BMC Cancer. 2023;23:810. doi: 10.1186/s12885-023-11298-z. [DOI] [PMC free article] [PubMed] [Google Scholar]
- 13.Wong JSL, Kwok GGW, Tang V, Li BCW, Leung R, Chiu J, Ma KW, She WH, Tsang J, Lo CM, Cheung TT, Yau T. Ipilimumab and nivolumab/pembrolizumab in advanced hepatocellular carcinoma refractory to prior immune checkpoint inhibitors. J Immunother Cancer. 2021;9:e001945. doi: 10.1136/jitc-2020-001945. [DOI] [PMC free article] [PubMed] [Google Scholar]
- 14.European Association for the Study of the Liver. EASL clinical practice guidelines: management of hepatocellular carcinoma. J Hepatol. 2018;69:182–236. doi: 10.1016/j.jhep.2018.03.019. [DOI] [PubMed] [Google Scholar]
- 15.Shiroyama T, Suzuki H, Tamiya M, Tamiya A, Tanaka A, Okamoto N, Nakahama K, Taniguchi Y, Isa SI, Inoue T, Imamura F, Atagi S, Hirashima T. Clinical characteristics of liver metastasis in nivolumab-treated patients with non-small cell lung cancer. Anticancer Res. 2018;38:4723–4729. doi: 10.21873/anticanres.12779. [DOI] [PubMed] [Google Scholar]
- 16.Lencioni R, Llovet JM. Modified RECIST (mRECIST) assessment for hepatocellular carcinoma. Semin Liver Dis. 2010;30:52–60. doi: 10.1055/s-0030-1247132. [DOI] [PMC free article] [PubMed] [Google Scholar]
- 17.Omata M, Cheng AL, Kokudo N, Kudo M, Lee JM, Jia J, Tateishi R, Han KH, Chawla YK, Shiina S, Jafri W, Payawal DA, Ohki T, Ogasawara S, Chen PJ, Lesmana CRA, Lesmana LA, Gani RA, Obi S, Dokmeci AK, Sarin SK. Asia-pacific clinical practice guidelines on the management of hepatocellular carcinoma: a 2017 update. Hepatol Int. 2017;11:317–370. doi: 10.1007/s12072-017-9799-9. [DOI] [PMC free article] [PubMed] [Google Scholar]
- 18.European Association for the Study of the Liver. Corrigendum to “EASL clinical practice guidelines: management of hepatocellular carcinoma” [J Hepatol 69 (2018) 182-236] J Hepatol. 2019;70:817. doi: 10.1016/j.jhep.2018.03.019. [DOI] [PubMed] [Google Scholar]
- 19.Xu Y, Xia C, Li H, Cao M, Yang F, Li Q, Cao M, Chen W. Survey of hepatitis B virus infection for liver cancer screening in China: a population-based, cross-sectional study. Chin Med J (Engl) 2024;137:1414–1420. doi: 10.1097/CM9.0000000000003171. [DOI] [PMC free article] [PubMed] [Google Scholar]
- 20.Anwanwan D, Singh SK, Singh S, Saikam V, Singh R. Challenges in liver cancer and possible treatment approaches. Biochim Biophys Acta Rev Cancer. 2020;1873:188314. doi: 10.1016/j.bbcan.2019.188314. [DOI] [PMC free article] [PubMed] [Google Scholar]
- 21.Dyhl-Polk A, Mikkelsen MK, Ladekarl M, Nielsen DL. Clinical trials of immune checkpoint inhibitors in hepatocellular carcinoma. J Clin Med. 2021;10:2662. doi: 10.3390/jcm10122662. [DOI] [PMC free article] [PubMed] [Google Scholar]
- 22.Marzi L, Mega A, Gitto S, Pelizzaro F, Seeber A, Spizzo G. Impact and novel perspective of immune checkpoint inhibitors in patients with early and intermediate stage HCC. Cancers (Basel) 2022;14:3332. doi: 10.3390/cancers14143332. [DOI] [PMC free article] [PubMed] [Google Scholar]
- 23.Kurz CF, Krzywinski M, Altman N. Propensity score matching. Nat Methods. 2024;21:1770–1772. doi: 10.1038/s41592-024-02405-4. [DOI] [PubMed] [Google Scholar]
- 24.Li SH, Mei J, Cheng Y, Li Q, Wang QX, Fang CK, Lei QC, Huang HK, Cao MR, Luo R, Deng JD, Jiang YC, Zhao RC, Lu LH, Zou JW, Deng M, Lin WP, Guan RG, Wen YH, Li JB, Zheng L, Guo ZX, Ling YH, Chen HW, Zhong C, Wei W, Guo RP. Postoperative adjuvant hepatic arterial infusion chemotherapy with FOLFOX in hepatocellular carcinoma with microvascular invasion: a multicenter, phase III, randomized study. J. Clin. Oncol. 2023;41:1898–1908. doi: 10.1200/JCO.22.01142. [DOI] [PMC free article] [PubMed] [Google Scholar]
- 25.Lu YC, Yang YC, Ma D, Wang JQ, Hao FJ, Chen XX, Chen YJ. FOLFOX-HAIC combined with targeted immunotherapy for initially unresectable hepatocellular carcinoma: a real-world study. Front Immunol. 2024;15:1471017. doi: 10.3389/fimmu.2024.1471017. [DOI] [PMC free article] [PubMed] [Google Scholar]
- 26.Li QJ, He MK, Chen HW, Fang WQ, Zhou YM, Xu L, Wei W, Zhang YJ, Guo Y, Guo RP, Chen MS, Shi M. Hepatic arterial infusion of oxaliplatin, fluorouracil, and leucovorin versus transarterial chemoembolization for large hepatocellular carcinoma: a randomized phase III trial. J. Clin. Oncol. 2022;40:150–160. doi: 10.1200/JCO.21.00608. [DOI] [PubMed] [Google Scholar]
- 27.Zhao Y, Chen D, Yang B, Xu J, Wang L, Huang G, Wei L, Chen Z. Successful liver transplantation with ctDNA clearance after PD-1 inhibitor plus FOLFOX‑HAIC treatment in HCC: a case report. Oncol Lett. 2024;27:51. doi: 10.3892/ol.2023.14185. [DOI] [PMC free article] [PubMed] [Google Scholar]
- 28.Jiang K, Li J, Liu Z, Chen M, Cai W, Liu L, Yin D. Impact of major hepatectomy on recurrence after resection of hepatocellular carcinoma at CNLC Ib stage: a propensity score matching study. Int J Surg. 2024;111:857–864. doi: 10.1097/JS9.0000000000001879. [DOI] [PMC free article] [PubMed] [Google Scholar]
- 29.Liang BY, Gu J, Xiong M, Zhang EL, Zhang ZY, Chen XP, Huang ZY. Tumor size may influence the prognosis of solitary hepatocellular carcinoma patients with cirrhosis and without macrovascular invasion after hepatectomy. Sci Rep. 2021;11:16343. doi: 10.1038/s41598-021-95835-5. [DOI] [PMC free article] [PubMed] [Google Scholar]
- 30.Yao J, Zhu X, Wu Z, Wei Q, Cai Y, Zheng Y, Hu X, Hu H, Zhang X, Pan H, Zhong X, Han W. Efficacy and safety of PD-1 inhibitor combined with antiangiogenic therapy for unresectable hepatocellular carcinoma: a multicenter retrospective study. Cancer Med. 2022;11:3612–3622. doi: 10.1002/cam4.4747. [DOI] [PMC free article] [PubMed] [Google Scholar]