

Abstract
Late-Onset GM2-Gangliosidoses (LOGG) are rare, neurodegenerative lysosomal disorders that include late-onset Tay-Sachs (LOTS) and Sandhoff disease (LOSD) subtypes. Cerebellar atrophy is common, even in the absence of clinical ataxia, particularly in LOTS. Recent reports have also described brainstem atrophy in LOTS. We assessed brainstem substructure atrophy in LOGG, including LOSD. 10 LOGG patients (7 LOTS, 3 LOSD) and 7 age-matched controls had structural MRI brain imaging. A FreeSurfer brainstem substructure module was used for automatic segmentation and included the pons, medulla, superior cerebellar peduncle (SCP), midbrain, and total brainstem. Clinical ataxia severity was assessed with the LOTS Severity Scale, Brief Ataxia Rating Scale, Friedreich’s Ataxia Rating Scale and Scale for the Assessment and Rating of Ataxia. There were differences between LOGG and controls in the pons (12,785.06 ± 1,603.84 vs. 15,457.14 ± 2,748.41 mm3, p = 0.0069) and SCP (196.93 ± 31.20 vs. 293.57 ± .70.16 mm3, p = 0.0003). In LOTS vs. controls, there was similar pons (p = 0.0055) and SCP atrophy (p = 0.0023). The LOSD group was too small for independent comparisons. There were no significant associations between SCP/pons volume and clinical scales or disease duration. Cerebellar volume, which was analyzed in a previous study by Rowe et al. (2021), was relatively preserved in LOSD compared to the SCP/pons, while in LOTS, the pontocerebellar atrophy profile was dominated by cerebellar atrophy. These findings provide anatomical and clinical insights to the cerebellar/brainstem atrophy observed in LOGG and highlight a need to stratify LOGG by subtypes.
Keywords: Late-Onset GM2-Gangliosidosis, Tay-Sachs disease, Sandhoff disease, Structural MRI
Introduction
Late-Onset GM2-Gangliosidosis (LOGG) is a heterogenous group of rare, neurodegenerative lysosomal disorders, with two main disease subtypes, late-onset Tay-Sachs disease (LOTS) and late-onset Sandhoff disease (LOSD), which are caused by pathogenic variants in the HEXA or HEXB genes, respectively [1]. Both subtypes have a combination of neuromuscular features with prominent weakness, varying degrees of cerebellar ataxia, alongside cognitive and neuropsychiatric involvement, preferentially involving LOTS [2]. A recent scoping review summarized the clinical and imaging differences between LOTS and LOSD, with cerebellar atrophy characteristic of LOTS, even in the absence of clinical ataxia, while LOSD patients frequently have less atrophy, or even normal imaging [2]. Rowe et al. (2021) quantified structural and metabolic abnormalities in LOGG, revealing cerebellar atrophy, most notably in the cerebellar cortex, which was associated with clinical ataxia measures [3]. Cerebellar atrophy was primarily driven by the LOTS cohort, given less atrophy was seen in the LOSD patients [2–4]. Subsequently, Májovská et al. (2022) [5] performed manual segmentations of MRI brain imaging and reported pontocerebellar atrophy as the hallmark neuroradiological finding in LOTS. We sought to explore and expand on this observation using a specialized FreeSurfer software pipeline to re-analyze structural imaging data from the LOGG cohort previously described in Stephen et al. (2020) [4] and quantified in Rowe et al. (2021) [3].
Materials and Methods
Ten genetically defined LOGG patients (7 LOTS, 3 LOSD) and 7 age-matched healthy controls were consented. Disease severity was assessed with the LOTS Severity Scale, Brief Ataxia Rating Scale, the Friedreich’s Ataxia Rating Scale, and the Scale for the Assessment and Rating of Ataxia, as per Stephen et al. (2020) [4].
Imaging data from Rowe et al. (2021) [3] were reprocessed using FreeSurfer recon-all (v 7.1) [6] then further analyzed with a brainstem substructure module based on the Desikan-Killiany atlas [7]. Differences in the reprocessed data versus the original data [3] were statistically insignificant and attributed to expected changes in system architecture, software and/or dependent libraries resulting from hardware and software upgrades. Brainstem substructure volumetric outputs from this module included pons, medulla, superior cerebellar peduncle (SCP), midbrain, and total brainstem volumes. However, total brainstem was excluded from further analyses as the outputs were reported previously [3]. The module generates these substructures (Fig. 1) based on a Bayesian segmentation algorithm, for which a probabilistic atlas was built from the manual segmentations outlined in Appendix C of Iglesias et al. (2015) [7]. No manual edits to the segmentation outputs were performed. Volumes were normalized by estimated total intracranial volume (eTIV).
Fig. 1.
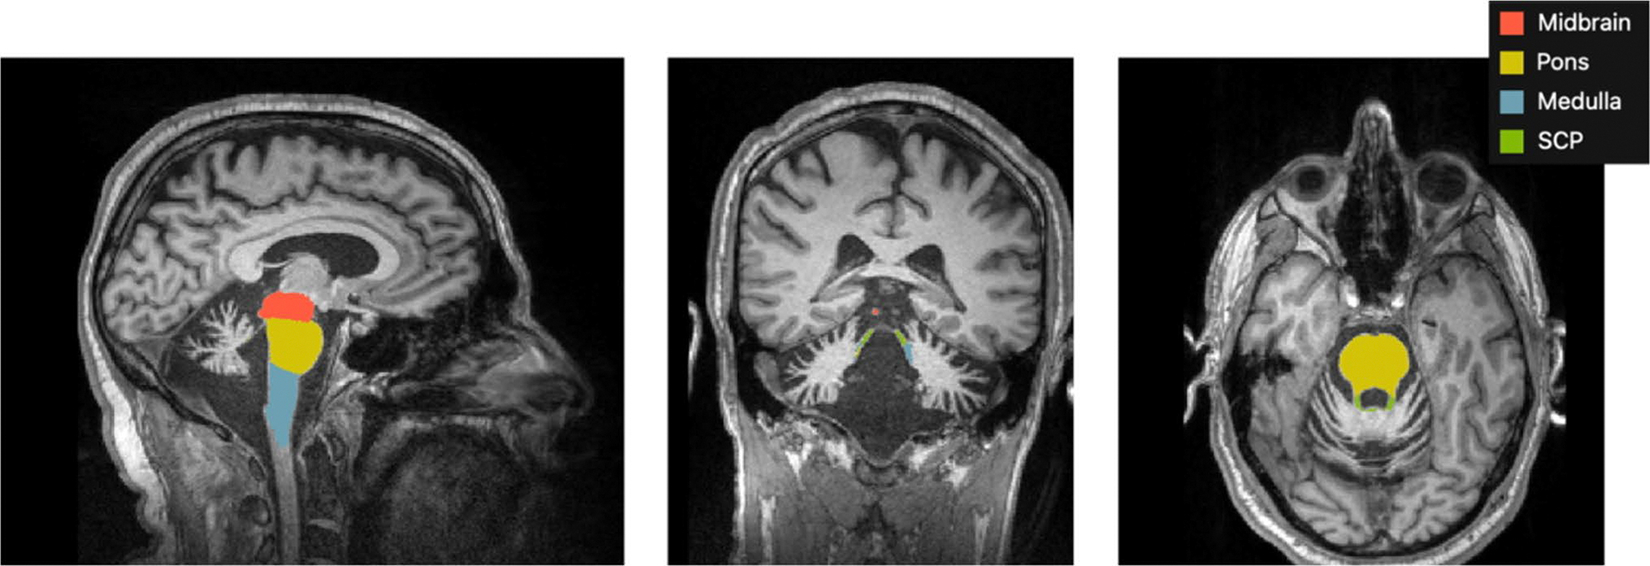
Brainstem substructure module outputs (excluding total brainstem) from FreeSurfer in a LOTS participant
For between-group comparisons (LOGG vs. controls and LOTS vs. controls), an ANCOVA controlling for age was conducted in MATLAB. The LOSD group was too small for independent comparisons. Statistics were controlled for multiple comparisons using the false discovery rate (FDR) method, but original p-values are reported herein. Following between-group comparisons, the significant volumetric outputs from both sub-cohorts were correlated with disease duration and motor assessments using R’s partial correlation function, controlling for age.
Results
Demographic details and markers of disease severity (clinical rating scale scores) of the LOGG cohort are shown in Table 1. The LOGG cohort (n = 10, male:female 6:4 in LOGG, with 5:2 in LOTS and 1:2 in LOSD) had a mean age at assessment ± standard deviation of 42.0 ± 12.6 years (LOTS: 37.6 ± 11.2, LOSD: 53.3 ± 10.5). The control group (n = 7, male:female 4:3) had a mean age of 42.7 ± 14.3 years. Mean disease duration for LOGG was 22.6 ± 11.6 years (LOTS: 20.9 ± 9.0 years; LOSD: 26.7 ± 18.1 years).
Table 1.
Demographic details and markers of disease severity in LOGG and Control groups described as mean ± standard deviation (except male:female ratio)
| Parameter | Participant Group |
|||
|---|---|---|---|---|
| Total LOGG (n = 10) | LOTS (n = 7) | LOSD (n = 3) | Controls (n = 7) | |
|
| ||||
| Demographic Details | ||||
| Male:Female (n) | 6:4 | 5:2 | 1:2 | 4:3 |
| Age at Assessment (years) | 42.0 ± 12.6 | 37.6 ± 11.2 | 53.3 ± 10.5 | 42.7 ± 14.3 |
| Age at Disease Onset (years) | 19.4 ± 9.7 | 16.7 ± 9.3 | 25.7 ± 9.3 | |
| Disease Duration (years) | 22.6 ± 11.6 | 20.9 ± 9.0 | 26.7 ± 18.1 | |
| Disease Severity Rating Scale Scores | ||||
| BARS | 5.1 ± 4.1 | 6.2 ± 3.8 | 2.3 ± 2.8 | |
| SARA | 8.4 ± 4.3 | 9.9 ± 3.7 | 5.0 ± 4.3 | |
| FARS | 25.2 ± 14.0 | 27.6 ± 13.0 | 19.7 ± 17.5 | |
| LOTS Severity Scale | 6.9 ± 3.1 | 7.4 ± 3.3 | 5.7 ± 2.9 | |
Abbreviations: BARS: Brief Ataxia Rating Scale; SARA: Scale for the Assessment and Rating of Ataxia; FARS: Friedreich’s Ataxia Rating Scale
Table 2 describes medulla, pons, midbrain and SCP volume differences in LOGG and LOTS relative to controls. Raw mean volumes with standard deviations (not eTIV-normalized) are also reported for LOGG, LOTS, LOSD, and controls. When comparing LOGG patients (n = 10) to controls (n = 7), there was significant volume loss of the pons (12,785.06 ± 1,603.84 vs. 15,457.14 ± 2,748.41 mm3, p = 0.0069) and SCP (196.93 ± 31.20 vs. 293.57 ± 70.16 mm3, p = 0.0003) but not the midbrain or medulla. When comparing only the LOTS group (n = 7) to controls, there was significant volume loss in the pons (12,709.07 ± 1,954.83 vs. 15,457.14 ± 2,748.41 mm3, p = 0.0055) and SCP (196.88 ± 37.80 vs. 293.57 ± 70.16 mm3, p = 0.0023). There were no significant associations between the SCP/pons volumes and clinical scales or disease duration.
Table 2.
Percent change, unadjusted p-values, and 95% confidence intervals for ANCOVA between-group comparisons using eTIV-normalized brainstem substructure data. 95% Confidence intervals are reported as fractions due to eTIV normalization. Raw mean volumes with standard deviations (not eTIV-normalized) for brainstem substructures are also reported. While p-values are unadjusted for false discovery rate, results account for multiple comparisons, with significant results highlighted in bold
| Medulla | Pons | SCP | Midbrain | |
|---|---|---|---|---|
|
| ||||
| % Change P Values 95% CI | ||||
| 10 LOGG vs 7 Control | 2.0% 0.7037 [−2.4, 3.6] × 10−4 | −12.0% 0.0069* [−19.2, −4.0] × 10−4 | −29.5% 0.0003* [−7.9, −3.0] × 10−5 | 3.0% 0.2814 [−1.0, 3.3] × 10−4 |
| 7 LOTS vs 7 Control | 4.4% 0.5568 [−2.2, 4.8] × 10−4 | −14.5% 0.0055* [−22.4, −5.6] × 10−4 | −31.4% 0.0023* [−8.8, −2.8] × 10−5 | 2.3% 0.4746 [−1.7, 3.5] × 10−4 |
| Volume (mm3) mean ± SD | ||||
| LOGG (n = 10) (LOTS + LOSD) | 4,426.26 ± 549.14 | 12,785.06 ± 1,603.84 | 196.93 ± 31.20 | 5,869.48 ± 499.59 |
| LOTS (n = 7) | 4,615.16 ± 556.69 | 12,709.07 ± 1,954.83 | 196.88 ± 37.80 | 5,944.08 ± 578.87 |
| LOSD (n = 3) | 3,985.52 ± 104.92 | 12,962.37 ± 208.16 | 197.04 ± 17.92 | 5,695.41 ± 230.11 |
| Control (n = 7) | 4,638.04 ± 1,055.78 | 15,457.14 ± 2,748.41 | 293.57 ± 70.16 | 6,056.91 ± 799.17 |
Statistically significant after FDR Correction
Discussion
We found prominent pons and SCP atrophy in the 10 LOGG patients and 7 LOTS sub-cohort. SCP atrophy was similar in both sub-cohorts based on mean volumetric outputs. However, in the LOTS patients, the pontocerebellar atrophy profile was still dominated by the cerebellar atrophy (p = 7.38 × 10⁻⁶) previously reported [3] compared to the SCP (p = 0.0023), whereas cerebellar volume was relatively preserved in LOSD. The difference in the variance between the LOTS and LOSD brain volumes is likely related to the relative homogeneity of the LOSD population sampled (which had minimal atrophy), compared to a wide range of degree of atrophy in LOTS, thereby causing this larger variance.
Our findings broadly align with Májovská et al. (2022) [5], but are expanded to include LOSD. It is important to acknowledge methodological differences between these studies. Májovská et al. [5] utilized manual delineation, whereas we used automatic segmentations. In their larger sample size, they reported differences in SCP and pons volume between LOTS and controls. While they did not observe correlations between pontocerebellar atrophy and specific clinical features (they did not use clinical rating scale scores) or duration [5], we previously showed correlations between the degree of cerebellar atrophy and clinical ataxia severity [3]. Our scoping review also notes that cerebellar atrophy can be present in LOTS, even in the absence of ataxia [2]. In contrast, while brain imaging was frequently normal in LOSD, when cerebellar atrophy was present, it was more likely than LOTS to be associated with ataxia [2]. Furthermore, it was noted that the degree of brainstem and SCP atrophy did not correlate with clinical ataxia severity or other clinical measures.
Regarding the neuroanatomical underpinnings of the SCP atrophy, the axons in the SCP originate in the neurons of the deep cerebellar nuclei (DCN) and convey projections to extracerebellar structures. Thus, in addition to cerebellar volume loss, SCP atrophy reflects neuronal loss in the DCN. While it is notable that the hypothalamus, substantia nigra and other brainstem nuclei reveal a substantial burden of characteristic ballooned neurons [8–10], to our knowledge, there are no neuropathological studies of the DCN in LOGG. Our finding of SCP atrophy predicts neuronal loss in the DCN in LOGG, but it remains to be shown whether DCN neuronal loss is uniformly distributed, or whether there is a dichotomy between neuronal loss in the motor-related dorsal dentate nucleus versus the cognitive-related ventrolateral dentate nucleus [11–13]. The severity of pontine atrophy is similar to the degree of cerebellar white matter atrophy in Rowe et al. (2021) [3], reflecting that the cerebellar white matter contains pontocerebellar axons. These pontine volumetric changes may be useful longitudinal neuroimaging biomarkers, as in other ataxias [14, 15].
Our study has limitations. The small sample size and unequal distribution of LOTS and LOSD patients in the sample limit generalizations to the LOGG population, however this was unavoidable given the ultra-rare prevalence of LOTS and particularly LOSD. Additionally, this work builds on our previous work in FreeSurfer, for which the brainstem module currently only supports segmentation of the SCP. Future work should investigate if the middle or inferior cerebellar peduncles are equally vulnerable in this population through other segmentation methods.
The observation that in addition to cerebellar volume loss, both the pons and SCP are smaller in LOGG, and particularly in LOTS, has neuropathological and systemic implications. Both the afferent and efferent arcs of the cerebrocerebellar system are implicated in these disorders: the afferent arc from cerebral cortex to cerebellum by way of volume loss in the pons and pontocerebellar projection, and the efferent arc by way of volume loss in the SCP projection from the cerebellum back to thalamus and cerebral cortex. Our findings highlight the importance of analyzing both cerebellum and brainstem substructures radiographically and neuropathologically in LOGG, and we draw attention to their potential clinical relevance in these disorders.
Conclusion
The onset, progression, and distribution of volumetric atrophy in LOGG remains poorly described. The clinical and imaging differences between LOTS and LOSD indicate that future studies with larger sample sizes should stratify these subtypes when investigating their imaging features. The SCP is small, and incremental but important changes may be missed on gross inspection. We therefore recommend that imaging studies in LOGG target the SCP for quantitative analysis.
Acknowledgements
The authors would like to thank Oula Puonti and Juan Eugenio Iglesias of the Athinoula A. Martinos Center for Biomedical Imaging for their support and guidance regarding FreeSurfer analyses. We also acknowledge our patients and their families for participating in this research study.
Funding
This study was supported by the National Tay-Sachs & Allied Diseases Association Inc. and Sanofi US Services Inc. Imaging was performed at the Athinoula A. Martinos Center for Biomedical Imaging at the Massachusetts General Hospital using resources provided by the Center for Functional Neuroimaging Technologies (P41EB015896) and the Center for Mesoscale Mapping (P41EB030006), Biotechnology Resource Grants supported by the National Institute of Biomedical Imaging and Bioengineering, and the National Institutes of Health (NIH). The NIH also provided support through grants R00EB016689 and R01EB027779 (to R.L.B.) and GLIA-CTN U54TR002823 (to F.S.E.). This research was also supported in part by the Athinoula A. Martinos Center for Biomedical Imaging. The content is solely the responsibility of the authors and does not necessarily represent the official views of the NIH.
Footnotes
Competing Interests The authors declare no competing interests.
Ethics Approval The study was approved by the Mass General Brigham Institutional Review Board.
Consent to Participate All participants underwent the informed consent process in accordance with the Ethical Principles and Guidelines for the Protection of Human Subjects of Research.
Consent to Publish Consent to publish a participant’s data was included within the informed consent documents.
Disclosures O.E. Rowe was employed by Cognito Therapeutics at the time of analysis and drafting of the report.
F.S. Eichler receives consulting fees from Ionis Pharmaceuticals and SwanBio Therapeutics and grant support from National Tay-Sachs and Allied Diseases and Cystinosis Research Foundation and has received financial support from bluebird bio and Minoryx Therapeutics for the conduct of clinical trials.
J.D. Schmahmann is site PI for Biohaven Pharmaceuticals clinical trials NCT03701399 and NCT02960893; consults for Biohaven Pharmaceuticals; receives royalties from Oxford University Press, Elsevier, MacKeith Press, and Springer; and is the inventor of the Brief Ataxia Rating Scale, Cerebellar Cognitive Affective / Schmahmann Syndrome Scale, the Patient Reported Outcome Measure of Ataxia, and the Cerebellar Neuropsychiatry Rating Scale, which are licensed to the General Hospital Corporation. He is supported in part by the MINDlink foundation, the National Ataxia Foundation and the Raynor Cerebellum Project.
R.L. Barry has been employed by the National Institute of Biomedical Imaging and Bioengineering at the NIH, USA since January 2024. This article was co-authored by R.L. Barry in his personal capacity. The opinions expressed in the article are his own and do not necessarily reflect the views of the NIH, the Department of Health and Human Services, or the United States government.
C.D. Stephen has provided scientific advisory for SwanBio Therapeutics and received research funding from Sanofi-Genzyme for a study of video oculography in late-onset GM2 Gangliosidosis. His institution has received financial support from Sanofi-Genzyme, SwanBio Therapeutics and Encora Therapeutics and previously from Biogen and Biohaven, for the conduct of clinical trials. He has received honoraria from the American Academy of Neurology and The International Parkinson and Movement Disorders Society. He has received grant support from the National Institutes of Health K23 NS118045.
Data Availability
As the study population is incredibly rare, we are unable to share this data in order to protect participant privacy.
References
- 1.Toro C, Zainab M, Tifft CJ. The GM2 gangliosidoses: Unlocking the mysteries of pathogenesis and treatment. Neurosci Lett. 2021;764:136195. 10.1016/j.neulet.2021.136195. [DOI] [PMC free article] [PubMed] [Google Scholar]
- 2.Godbole NP, Haxton E, Rowe OE, et al. Clinical and imaging predictors of late-onset GM2 gangliosidosis: A scoping review. Ann Clin Transl Neurol. 2024;11(1):207–24. 10.1002/acn3.51947. [DOI] [PMC free article] [PubMed] [Google Scholar]
- 3.Rowe OE, Rangaprakash D, Weerasekera A, et al. Magnetic resonance imaging and spectroscopy in late-onset GM2-gangliosidosis. Mol Genet Metab. 2021;133(4):386–96. 10.1016/j.ymgme.2021.06.008. [DOI] [PMC free article] [PubMed] [Google Scholar]
- 4.Stephen CD, Balkwill D, James P, et al. Quantitative oculomotor and nonmotor assessments in late-onset GM2 gangliosidosis. Neurology. 2020;94(7):e705–17. 10.1212/wnl.0000000000008959. [DOI] [PMC free article] [PubMed] [Google Scholar]
- 5.Májovská J, Hennig A, Nestrasil I, et al. Pontocerebellar atrophy is the hallmark neuroradiological finding in late-onset Tay-Sachs disease. Neurol Sci. 2022;43(5):3273–81. 10.1007/s10072-021-05757-3. [DOI] [PubMed] [Google Scholar]
- 6.Fischl B, Salat DH, Busa E, et al. Whole brain segmentation: automated labeling of neuroanatomical structures in the human brain. Neuron. 2002;33(3):341–55. 10.1016/s0896-6273(02)00569-x. [DOI] [PubMed] [Google Scholar]
- 7.Iglesias JE, Van Leemput K, Bhatt P, et al. Bayesian segmentation of brainstem structures in MRI. Neuroimage. 2015;113:184–95. 10.1016/j.neuroimage.2015.02.065. [DOI] [PMC free article] [PubMed] [Google Scholar]
- 8.Yokoyama T, Nakamura S, Horiuchi E, et al. Late onset GM2 gangliosidosis presenting with motor neuron disease: an autopsy case. Neuropathology. 2014;34(3):304–8. 10.1111/neup.12088. [DOI] [PubMed] [Google Scholar]
- 9.Kornfeld M Neuropathology of chronic GM2 gangliosidosis due to hexosaminidase a deficiency. Clin Neuropathol. 2008;27(5):302–8. 10.5414/npp27302. [DOI] [PubMed] [Google Scholar]
- 10.Suzuki K Neuropathology of Late Onset Gangliosidoses: A review. Dev Neurosci. 1991;13(4–5):205–10. 10.1159/000112161. [DOI] [PubMed] [Google Scholar]
- 11.Dum RP, Strick PL. An unfolded map of the cerebellar dentate nucleus and its projections to the cerebral cortex. J Neurophysiol. 2003;89(1):634–9. 10.1152/jn.00626.2002. [DOI] [PubMed] [Google Scholar]
- 12.Schmahmann JD, Guell X, Stoodley CJ, Halko MA. The theory and neuroscience of cerebellar cognition. Annu Rev Neurosci. 2019;42:337–64. 10.1146/annurev-neuro-070918-050258. [DOI] [PubMed] [Google Scholar]
- 13.Guell X, D’Mello AM, Hubbard NA, et al. Functional territories of human dentate nucleus. Cereb Cortex. 2020;30(4):2401–17. 10.1093/cercor/bhz247. [DOI] [PMC free article] [PubMed] [Google Scholar]
- 14.Faber J, Berger M, Wilke C, et al. Stage-dependent biomarker changes in spinocerebellar ataxia type 3. Ann Neurol. 2024;95(2):400–6. 10.1002/ana.26824. [DOI] [PubMed] [Google Scholar]
- 15.Stephen CD, Vangel M, Gupta AS, MacMore JP, Schmahmann JD. Rates of change of pons and middle cerebellar peduncle diameters are diagnostic of multiple system atrophy of the cerebellar type. Brain Commun. 2024;6(1):fcae019. 10.1093/braincomms/fcae019. [DOI] [PMC free article] [PubMed] [Google Scholar]
Associated Data
This section collects any data citations, data availability statements, or supplementary materials included in this article.
Data Availability Statement
As the study population is incredibly rare, we are unable to share this data in order to protect participant privacy.