

Abstract
Context
Obesity induces alterations in adipocyte size, tissue inflammation, vascularization, and extracellular matrix composition. Previous studies have shown that a leaf extract of Eucalyptus tereticornis Sm. (Myrtaceae), with ursolic acid, oleanolic acid, and ursolic acid lactone mixed with minor metabolites, provided a superior antiobesity effect than reconstituted triterpenoid mixtures in adipocyte cell lines and a pre-diabetic mouse model. Further identification of the molecular mechanisms of action of this mixture of triterpenes is required.
Objective
This study analyzes the effect of the natural extract and its components on early RNA expression profiles in human primary cultured adipocytes and a mouse cell line.
Materials and methods
RNA was sequenced using the DNBseq platform and the EnrichR software to perform gene enrichment analysis using the Gene Ontology database, Kyoto Encyclopedia of Genes and Genomes, and Reactome. To conduct clustering analysis, the normalized counts of each gene and applied k-means clustering were standardized.
Results
The combination of molecules in the natural extract has an additive or synergic effect that increases the number of genes regulated associated with the biological functionality of differentiating adipocytes, with UAL playing a central role. The natural extract modulates PPAR, Wnt, and Extracellular Matrix organization pathways significantly in both cellular models. Remarkably, the extract downregulates the expression of genes involved in lipid metabolism, adipogenesis, and adipocyte fat load, such as PRKAR2B, LPIN1, FABP4, Scd1, MC5R, CD36, PEG10, and HMGCS1.
Discussion and Conclusions
Our study shows that Eucalyptus tereticornis extract is a promising option for treating adipocyte tissue dysfunction derived from obesity.
Keywords: Natural extract, triterpenes, adipose tissue, transcriptome, adipocyte
Introduction
Being overweight and obese are major risk factors for several chronic diseases. According to the World Obesity Federation, 51% of the global population will be living either overweight or obese by 2035, and 1 in 4 people will be obese (World Obesity Federation 2023). Obesity is a complex, chronic, multifactorial disease caused by excess calories stored as body fat. Increased adipocyte size correlates with cellular stress and metabolic changes leading to adipose tissue inflammation. Adipose tissue dysfunction is associated with metabolic diseases such as insulin resistance (IR), type 2 diabetes mellitus (T2DM), cardiovascular disease (CVD), cancer, and non-alcoholic fatty liver disease (NAFLD) (Ghaben and Scherer 2019; Lin and Li 2021; Morigny et al. 2021; Sarma et al. 2021). Thus, drugs that act on adipose tissue metabolism can effectively treat obesity and associated diseases.
Herbs are a rich source of effective drugs against diseases, and some plants present anti-obesity properties (El-Shiekh et al. 2019; W. Sun et al. 2021). Eucalyptus is a diverse genus used in traditional medicine due to its secondary metabolites exhibiting antioxidant, antidiabetic, antitumor, antibacterial, and antifungal properties (Chandorkar et al. 2021; Surbhi et al. 2021). Eucalyptus tereticornis Sm. (Myrtaceae) is used in traditional medicine to treat diabetes mellitus (Villaseñor and Lamadrid 2006). Our previous studies have shown that an extract from Eu leaves, OBE100, exhibits hypoglycemic, hypolipidemic, antioxidant, and anti-inflammatory activities (Guillén et al. 2015; Ceballos et al. 2018; Acín et al. 2021; Betancur et al. 2021). OBE100 contains three pentacyclic triterpenes as main molecules (47.6% ursolic acid (UA), 14.1% oleanolic acid (OA), and 16.3% ursolic acid lactone (UAL))(Betancur et al. 2021). Triterpenes are molecules with anti-obesity, anti-inflammatory, and antidiabetic activities (Chen et al. 2020; Nguyen et al. 2021). UA reduces fat mass and improves adipose tissue metabolism, modulating adipogenesis and lipolysis and promoting the beiging of white adipose tissue, which is associated with glucose control improvement and plasma lipid level reduction (Nguyen et al. 2021; Sun et al. 2021). OA is also an anti-obesity agent, regulating the expression of transcription factors involved in adipogenesis, lipogenesis, and fatty acid oxidation, promoting anti-adipogenic pathways (Claro-Cala et al. 2022). UAL presents anti-inflammatory and antilipogenic activities (Balcazar et al. 2021).
Interestingly, UA, OA, and UAL mixed with unknown minor metabolites in OBE100 extract present superior anti-obesity properties. OBE100, but not a purified extract containing UA and OA, reduces fat content in the liver and adipose tissue, and OBE100 increases the anti-inflammatory, hypoglycemic, and hypolipidemic effects more than reconstituted triterpenoid mixtures (Acín et al. 2021; Betancur et al. 2021). Transcriptome sequencing (RNA-Seq) is a high-sensitivity technique used to analyze expression across the transcriptome. The overall aim of this study was to use genome-wide mRNA-Seq analysis to compare and study the changes in gene expression regulation in differentiating adipocytes treated for 24 h with the triterpenoids and OBE100 in human and mouse adipose cells to understand better how they regulate the process of adipogenesis and to unravel the mechanistic details of the anti-obesity activities of these compounds.
Material and methods
Triterpenoid samples preparation
Eucalyptus tereticornis (Eu) leaves were collected in the district of Mariangola, Cesar, Valledupar - Colombia, in 2011. A specimen was deposited in the Herbarium of the University of Antioquia (# 178511). OBE100 was extracted as previously described (Betancur et al. 2021). Briefly, the dried leaves of Eu were extracted by a liquid-liquid separation with hexane: methanol: water 4:3:1 (v/v). The organic phase was collected and vacuum-filtered. The precipitate formed, named OBE100, was collected, stored, and submitted to an HPLC-MS/MS analysis. 1H NMR and 13 C NMR identified the major compounds of OBE100. The two-dimensional spectra were obtained in an AMX300 spectrometer (Bruker BioSpin GmbH, Rheinstetten, Germany) operating at 300 MHz for 1H and 75.0 for 13 C using CDCl3 or dimethyl sulfoxide d6. Shifts are reported in δ units (ppm) and coupling constants (J) in Hz (Ceballos et al. 2018). We used UA, OA, and UAL as individual treatments and to prepare M1, an artificial mixture with the same concentrations of triterpenoids present in OBE100. UA and OA were acquired commercially from Sigma-Aldrich No U6753 and O5504 (St. Louis, MO, USA). UAL is not available commercially, and it was purified from OBE100. The extract (300 mg) was fractionated on a silica 60 G column (CAS No. 7631-86-9, EC Number 231-545-4. Merck Millipore, Burlington, MA, USA), eluted with dichloromethane: hexane 1:2 (v/v) mobile phase with gradually increasing polarity, and followed by thin layer chromatography (TLC aluminum sheets, silica gel 60 F254 MS-grade, 1.51022, Merck Millipore) with the same mobile phase. In this way, 50 fractions were obtained; fractions 22-28 (100 mg) were used for purification by preparative chromatography on 0.25 mm PTLC (Preparative TLC) Glass Plates (Z740216, Merck) using the chloroform: methanol: water 10:1:0.05 (v/v/v) Rf≈ 0.78 system. This yielded 13 mg of UAL, identified by nuclear magnetic resonance (NMR). Dichloromethane (270997), Hexane (3485), Chloroform (650498), and Methanol (34860) were obtained from Merck.
Cell culture and treatments
3T3-L1(CL-173TM) mouse pre-adipocytes were purchased from ATCC (Manassas, VA, USA). Cells were cultured in Dulbecco’s Modified Eagle’s Medium (DMEM, Sigma-Aldrich No D5523) with 10% fetal bovine serum (FBS, from Sigma-Aldrich No F2442), 2 mM glutamine (Sigma-Aldrich No G7513), 1% penicillin/streptomycin (Sigma-Aldrich No A5955), and 25 mM glucose (Sigma-Aldrich No G7021) (Growth Medium 2 – GM2) at 37 °C and 5% CO2. Differentiation was induced two days post confluence by adding GM2 containing 0.5 mM 3-isobutyl-1-methylxanthine (IBMX, Sigma-Aldrich No I7018), 0.25 μM dexamethasone (Sigma-Aldrich No D4902), 2 μM Rosiglitazone (Sigma-Aldrich No R2408), and 1 μg/ml insulin (Novolin R 100 UI/mL, novo nordisk Colombia SAS, Bogota, Colombia). After two days of incubation, the medium was replaced with GM2 containing 1 μg/ml insulin. Two days later, the medium was replaced by GM2 and incubated for 24 h with different treatments. Primary adipocyte culture was obtained from women undergoing cosmetic abdominal fat-reduction procedures of three patients, as previously described (Ceballos et al. 2018). Human primary adipocyte culture was obtained from the abdominal fat of three young women. Samples were washed several times with 1XPBS and 1% antibiotic. Then, samples were treated with 0.075% collagenase type II in DMEM 5.5. mM glucose without serum for 30-45 min at 37 °C, with gentle and constant agitation. After collagenase inactivation with DMEM supplemented with 10% FBS, cells were centrifuged for 10 min at 1200 × g. The cell pellet was resuspended in 1X PBS and centrifuged under the same conditions. The supernatant was discarded, and the cells were resuspended in DMEM 5.5 mM glucose and 10% FBS (Growth medium). After 24 h, the culture was washed twice with PBS, and cells were cultured and maintained at 37°C and 5% CO2 in the growth medium until cells reached 80% confluence. Pre-adipocytes were induced into adipocytes after 100% confluence, cultured in a differentiation medium (DMEM 25 mM glucose, 10% FBS, 0.5 mM IBMX, 5 μM dexamethasone, 10 μM insulin, and 2 μM Rosiglitazone) for 7 days. The cells were incubated with DMEM, 25 mM glucose, 10% SFB, and different treatments for another 24 h. This study did not require ethical approval since we waste products from aesthetic procedures.
Crude extract OBE100, M1, UA, OA, and UAL were reconstituted in dimethyl sulfoxide (DMSO) at 25 mg/ml (stock solution). The final concentration of the compounds in the culture medium was OBE100 50 µg/ml, M1 39 µg/ml (UA+OA+UAL mix), UA 23.8 µg/ml, OA 7 µg/ml, and UAL 8.2 µg/ml. The concentration used for the three different triterpenes, both in the mixture called M1 and individually, was that determined in the fraction called OBE100. The cells were exposed to several treatments for 24 h. The concentration used was non-toxic for the cells. Three independent experiments were performed, each in triplicate.
RNA-Seq analysis
According to the manufacturer’s instructions, total RNA was extracted from cells with the RNeasy kit (QIAGEN, Valencia, CA, USA No 74104). RNA integrity was assessed on an Agilent 2100 Bioanalyzer; only RNA Integrity Number (RIN) ≥ 8.0 samples were advanced to library construction. Polyadenylated RNA (500 ng input) was enriched and fragmented, followed by first and second-strand cDNA synthesis using the MGIEasy RNA Library Prep Set (MGI Tech, Shenzhen, China). After end repair, a tailing, and adaptor ligation, libraries were amplified with 12 PCR cycles and purified with AMPure XP beads (Beckman Coulter). The Bioanalyzer and qPCR verified library quality (insert size and concentration). Qualified libraries were circularized to form DNA nanoballs (DNBs) and loaded onto DNBSEQ G400 flow cells. Paired end 150 bp sequencing was performed on an MGI DNBSEQ G400 platform, targeting ≥ 20 million raw reads per sample. Data were analyzed as described previously (Ribeiro et al. 2018). Briefly Raw reads were processed with FastQC v0.11.9 for quality assessment and Trimmomatic v0.36 for adaptor and quality trimming (Q < 20 bases removed; reads < 30 bp discarded). Clean reads were aligned to the GRCh38 (human) and GRCm39 (mouse) reference genomes with STAR v2.7.11b. Gene-level counts were generated using feature Counts v2.0.3, and differential expression was assessed with DESeq2 v1.38.0 in R v4.3.1. Genes were considered differentially expressed if the absolute value of log2 fold change ≥ 1 and the FDR ≤ 0.05. Human-mouse orthologous genes were extracted from the Mouse Genome Informatics (MGI) database. The Pearson correlation in log2-fold changes between orthologous genes was calculated in R.
Gene enrichment analysis
The present study utilized the EnrichR software (https://maayanlab.cloud/Enrichr/) to conduct gene enrichment analysis, employing databases such as Gene Ontology, Kyoto Encyclopedia of Genes and Genomes (KEGG), and Reactome (Chen et al. 2013). Enrichment outcomes were determined based on a combined score exceeding 15, calculated by EnrichR using the P value (Fisher’s exact test) and Z score (correction to the test). Subsequently, the enrichment results were presented as the percentage of genes enriched within each ontology category (Chen et al. 2013).
Clustering analysis of gene expression profiles
A clustering analysis approach was used to examine the RNAseq expression data. To conduct the analysis, we standardized the normalized counts of each gene and applied k-means clustering, utilizing Euclidean distance as a metric with random initialization and 10,000 executions. This study employed k-means clustering to categorize gene expression profiles as was implemented before (Fernandez et al., 2023). The analysis used the R programming language (version 4.3.2) and precisely the kmeans function from the “stats” package. Before clustering, the normalized gene counts were subjected to scaling using z-score. To determine the optimal number of clusters (K), the elbow method was applied to discern the intrinsic structure of the gene expression dataset. Subsequently, the kmeans function was utilized, taking the scaled gene expression data matrix, the specified number of clusters, euclidean distance as a metric, and 10000 executions as input parameters. The algorithm iteratively assigned genes to clusters based on their expression profiles and updated cluster centroids until convergence. Cluster plots were employed to represent the categorized gene expression profiles.
Transcription factor motif analysis
Cytoscape app iRegulon was used to detect the transcription factor motifs overrepresented in the promoter of the differentially expressed genes. Gene promoters were considered between nucleotides − 300 and + 50 relatives to the Transcription Start Site. The motif similarity was set as 0.001. Significance was tested using the normalized enrichment score greater than 5, and the transcription factors that passed the filter were used to construct the regulatory network visualized by Cytoscape (Shannon et al., 2003).
Statistical analysis
All statistical tests were performed in GraphPad Prism 10 (GraphPad Software, San Diego, CA, USA). For each experimental condition, we first evaluated the distribution of the data with the Shapiro-Wilk normality test (α = 0.05) and assessed homogeneity of variances with the F test. If the data were normally distributed and variances were homogeneous, we applied an unpaired, two tailed Student’s t test. We used the Mann-Whitney U test when either assumption was violated. Unless stated otherwise, results are reported as geometric mean ± standard deviation (SD). Statistical significance was accepted at p < 0.05.
Results
Consistent gene expression patterns in differentiating mouse and human adipocytes
Murine adipocytes, such as the 3T3-L1 cell line, have served as a prevalent model for exploring bioactive molecules involved in the modulation of adipocyte differentiation and energy metabolism. Nevertheless, due to the inherent disparities between murine and human metabolic pathways (Börgeson et al. 2022), there remains a critical need to decipher the shared genes and pathways between the two species models for studying adipocyte biomolecules. In the present work, a comprehensive investigation was initiated comparing gene expression profiles between murine 3T3-L1 cells and primary human adipose tissue cells. RNA-Seq datasets were acquired to examine adipocyte genes (Differentiating Control-DC) common to both species. In each species, the DC was contrasted with pre-adipocytes (Control-C), thereby yielding differentially expressed genes (DEGs) (Figure 1(A)). Our findings indicate that, in the context of differentiation, around 3000 genes are regulated in both positive and negative directions in both humans (2942 DEGs, with 1348 upregulated and 1594 down-regulated) and mice (3649 DEGs, with 1741 upregulated and 1908 down-regulated).
Figure 1.

Correspondence in transcriptomic profiles in differentiating human and mouse adipocytes. (a) Bar chart illustrating the combined count of genes exhibiting upregulation and downregulation in differentiating adipocytes from human and mouse models. (b) Pearson correlation plot depicting the expression correlation of orthologous genes identified as differentially expressed in at least one species under logical or and (c) under logical and In the correlation plots, every data point represents an orthologous gene, with its expression quantified using log2 fold change. The blue line denotes the linear regression, while the shaded grey region indicates the 95% confidence interval. The red line signifies perfect identity. (d) Heat map of Z-score normalized orthologue DEGs by unsupervised hierarchical clustering analysis. (e) Principal component analysis (PCA) on orthologous DEGS utilizing FPKM values. The variance percentages for each principal component (PC1 and PC2) are presented. Cumulative distribution plots depict the log2 fold change for (f) upregulated genes in both mice (indicated by the blue line) and humans (shown by the purple line), as well as (g) downregulated genes. (h) Gene ontology enrichment analysis on shared orthologous DEGs in human and mouse differentiating adipocytes. (i) Bar plots depict orthologous DEGs in differentiating adipocytes from humans and mice. C: Control group, DC: Differentiating control.
The union of the two DEG lists from each species was executed using a join/OR approach, permitting DEGs to belong to either species. Subsequent filtration was employed to isolate orthologous genes common to mice and humans (Table S1). Within this dataset, 3461 orthologous genes exhibiting differential expression in at least one of the mice or human groups were analyzed. This analysis unveiled a 72.5% concordance in the direction of regulation, with 33.3% displaying upregulation and 39.2% downregulation in both species (Figure 1(B)). There was a considerable correlation, and the Pearson correlation coefficient registered was r = 0.45. To identify a standard gene profile in adipocyte differentiation across both species, an additional filter utilizing an intersection/AND approach was employed to select orthologous genes displaying differential expression in mice and humans (Figure 1(C)). A robust correlation was evident among this gene subset, with an r = 0.62. Of the 1121 genes scrutinized, 933 (83.3%) manifested an identical direction of change across both species, with 36.7% upregulated and 46.6% downregulated.
The expression profiles were visualized using a heat map, showing that the differentiating cells in mice and humans have the same profile (Figure 1(D)). To ensure that the genes of both species were included in the Principal Component Analysis (PCA), the data were transformed to FPKM (Fragments Per Kilobase of transcript per Million mapped reads). The PCA analysis reveals that the most significant differences are in PC1 (53.2% of the variance), indicating that the differences are more pronounced between differentiating and undifferentiating cells than between species (Figure 1(E)). Although the gene expression profiles are similar in the two species, this does not imply that the magnitude of gene expression is identical. We performed a cumulative frequency analysis to explore whether the expression magnitudes are comparable. This analysis revealed that for both up-regulated (Figure 1(F)) and down-regulated genes (Figure 1(G)), the cumulative frequency using the fold change (Log2 FC) is nearly identical between both species. These results suggest that the genes analyzed depend on cellular activation rather than species-specific factors.
We then identify the biological processes to which these genes are associated. The enrichment analysis revealed eight gene ontologies. Among the upregulated genes, associations with the regulation of fatty acid beta-oxidation, fatty acid synthesis, and the degradation of isoleucine, leucine, and valine were identified. Conversely, the negatively regulated genes were associated with extracellular matrix and intercellular junctions (Figure 1(H)). Specifically, genes upregulated in both humans and mice were involved in fatty acid metabolism, including ACADL, ACADVL, ACAA2, ECHS1, TECR, HSD17B4, ACAT2, SLC25A1, and ACADM (Figure 1(1)).
In contrast, genes that express by constituting or regulating the extracellular matrix were identified among the down-regulated genes, such as ADAMTSL1, COL14A1, COL16A1, LOXL3, and TGFB3 (Figure 1(I)). The analyses underline the uniform activation pattern exhibited by the 933 human-mouse orthologous genes. Their biological function is closely related to fatty acid metabolism and regulation of extracellular matrix remodeling, making them promising candidates for investigating the modulatory effects of plant extracts in these two model species.
OBE100 extract and ursolic acid lactone modulate the gene expression profile of differentiating adipocytes
Using the list of 933 orthologous genes differentially expressed in differentiating adipocytes of both species, the impact of individual triterpenes (UA, UAL, OA), a mixture of triterpenes (M1) and natural extracts (OBE100) was evaluated. The RNA-seq data were subjected to a PCA, which revealed that the treatments affect differentiating adipocytes in both species, although with notable distinctions. In the case of the human model, OA treatment, M1 mixture, and OBE100 extract clustered together, indicating similarities in their impact on differentiating adipocytes. However, it was observed that the UAL triterpene presented the most significant disparities concerning the differentiating adipocytes, while the UA triterpene showed the most moderate differences. In contrast, in the murine model, the pattern was significantly different. In this case, treatment with OBE100 extract exhibited the most significant differences for differentiating adipocytes (Figure 2(A)).
Figure 2.

Gene expression profile of differentiating adipocytes treated with triterpenes. (a) PCA for human and mouse models across five treatments (DC: differentiating control, UA: Ursolic acid, UAL: Ursolic acid lactone, OA: Oleanolic acid, M1: triterpenes mix, and OBE100). (b) Bar plot of the total count of upregulated and downregulated genes for each treatment condition. (c,d) Cumulative distribution plots depict the log2 fold change for OBE100 (light blue line) and M1 or UAL (green line) treatments in comparison to differentiating control (red line) for both upregulated (c) and downregulated (d) genes.
Subsequently, the impact of treatments on differential expression by calculating the number of Differentially Expressed Genes (DEGs) using a criterion of FDR < 0.05 was evaluated (Figure 2(B)). This analysis revealed four significant findings: First, the individual treatments influence a small set of genes, with a maximum of 51 genes being regulated (40 up-regulated and 11 down-regulated), as demonstrated by the OBE100 treatment in human adipocytes. Second, the treatments have a more pronounced effect in the human model than the murine model. Third, most DEGs are upregulated in the human model. Finally, it was found that the UAL triterpene, when administered alone, produces a similar effect in terms of the number of DEGs as observed with the OBE100 extract in the human model.
PCA analysis and the number of DEGs suggest that the most impactful treatments are OBE100 and UAL in human adipocytes and OBE100 and M1 in mouse adipocytes. Consequently, cumulative frequency analyses were conducted to explore the effects of OBE100, UAL, and M1 treatments on shifts in gene expression levels, as depicted in Figure 2(C,D). The results reveal that the cumulative frequency distribution of up- and downregulated genes (Figure 2(C,D), respectively) shift significantly from that of differentiating adipocytes, underscoring the capacity of OBE100 and UAL treatments to modulate gene expression in human differentiating adipocytes, as well as the efficacy of OBE100 and M1 treatment in the murine model.
OBE100 alters the expression of genes involved in adipogenesis, thermogenesis, and extracellular matrix organization in differentiating adipocytes
Comprehensive gene ontology analysis was conducted to elucidate the regulatory impact of OBE100 on pivotal biological processes within adipose tissue, encompassing adipogenesis, thermogenesis, and extracellular matrix dynamics (Figure 3(A) and Table S2). The analysis unveiled the inhibitory effect of OBE100 on adipogenesis-related genes, several of which concurrently govern thermogenic processes. These encompassed the PPAR pathway and implicated alterations in fatty acid metabolism, triglycerides, and ketone bodies. Furthermore, OBE100 treatment elicited an upregulation in the expression of genes associated with extracellular matrix components, TGF-β, and WNT pathways, as shown in Figure 3(A) and Table S2. While there were shared regulatory pathways in murine and human models, a distinct gene repertoire was evident.
Figure 3.

OBE100 Treatment alters the gene expression of genes related to adipogenesis, thermogenesis, and extracellular matrix organization in differentiating adipocytes. (a) Gene ontology enrichment for DEGs regulated by OBE100 in human and mouse macrophages. Down-regulated terms are depicted in blue, while up-regulated terms are shown in red. (b) Bar plots illustrating normalized expression levels of differentially expressed genes. *p ≤ 0.05 compared to DC: Differentiating control.
Analyzing down-regulated genes related to adipogenesis and thermogenesis, mainly lipid metabolism regulatory enzymes and lipid-binding proteins were identified. In human adipocytes, examples included PRKAR2B, HMGCS1, LPIN1, CD36, FABP4, MC5R, and APOL6, whereas in the murine cells, this subset encompassed Ehhadh, Sult1a1, Scd1, and Apoc1 (Figure 3(B)). Additionally, this analysis disclosed the regulatory impact of OBE100 on two murine adipokines (Hp and Cfd).
Findings include a significant reduction in inhibiting the expression of extracellular matrix components in differentiating adipocytes following OBE100 treatment. In the human model, implicated genes involved ELN, COL5A1, THBS1, ITGA11, ITGB2, and its regulator TIMP1 (Figure 3(C)). Conversely, in the murine model, these components are closely associated with the WNT pathway, featuring genes such as Dkk3 and Dact1 and constituents involved in a matrix organization, Mfap2, and Adamtsl1. These results highlight the impact of OBE100, which simultaneously attenuates genes associated with adipogenesis and thermogenesis while increasing the expression of genes related to extracellular matrix organization.
The OBE100 extract modulates gene expression in human adipocytes through the combined effects of triterpenes and the minor fraction
Given the nature of the OBE100 extract, it would be relevant to determine whether its effects are limited to a specific molecule or result from its constituents’ synergistic interaction. The gene regulation induced by OBE100 and the major triterpenes (M1) mixture was outlined and compared to achieve this aim. Only the results found in the human model were considered because they presented a more significant number of DEGs. Employing k-means clustering, we categorized profiles as shared or treatment-specific, revealing 35 shared genes (53% of the total), with OBE100 and M1 exhibiting 18 and 13 unique genes, respectively, constituting 27% and 20% (Figure 4(A)).
Figure 4.

OBE100 Extract regulates gene expression in differentiating adipocytes via triterpenes mix and the minor fraction. (a) Venn diagrams depict the modulation of DEGs by OBE and M1 treatment in human adipocytes. (b) Bar graph illustrating five expression profiles, categorized using k-means, according to the average expression of the genes in the four conditions of human adipocytes. (c) The table presents the genes belonging to each profile and the gene ontology enrichment analysis.
Notably, the triterpene mixture (M1) regulated cell cycle genes, including AURKB, CENPM, CIT, DEP Domain Containing 1 (DEPDC1), Kinesin Family Member 18B (KIF18B), NUF2 Component of NDC80 Kinetochore Complex (NUF2), SHC Binding and Spindle Associated 1 (SHCBP1), and Spindle and Kinetochore Associated Complex Subunit 3 (SKA3).
When exploring the genes potentially modulated by the uncharacterized fraction, two distinct profiles, 3 and 4, were identified (Figure 4(B,C)). Profile 3 features negatively regulated genes, predominantly associated with lipid transport and metabolism, including Lipin 1 (LPIN1), Apolipoprotein L6 (APOL6), 3-Hydroxy-3-Methylglutaryl-CoA Synthase 1 (HMGCS1), Cluster of Differentiation 36 (CD36), Fatty Acid Binding Protein 4 (FABP4), and Melanocortin 5 Receptor (MC5R). Conversely, genes in profile 4 are linked to cellular differentiation towards a more mesenchymal phenotype, with notable genes such as Calponin 2 (CNN2), Tropomyosin 1 (TPM1), Transgelin (TAGLN), SH3 and Multiple Ankyrin Repeat Domains 1 (SHANK1), Cadherin 2 (CDH2), Transforming Growth Factor Beta 1 Induced Transcript 1 (TGFB1I1), Paired Related Homeobox 2 (PRRX2), and Growth Arrest-Specific 6 (GAS6). These findings suggest that the minority fraction potentially negatively modulates lipid transport and enhances the expression of a dedifferentiation program toward mesenchymal cell lineages.
Ursolic acid lactone regulates ECM and adipogenesis genes
As shown in Figure 2, among the three triterpenes evaluated, ursolic acid lactone (UAL) elicits the most pronounced effect on differentiating human adipocytes. Consequently, a comparison of the M1 profiles relative to UAL was run. Once the DEGs from the M1 and UAL treatments were integrated, they were subjected to k-means clustering to categorize the gene expression profiles, thus identifying shared and unique patterns among these treatments. This analysis shows that most genes are shared (48 genes, equivalent to 74%). Also, no unique genes were found in the M1 mixture, indicating that the presence of all three triterpenes does not produce synergistic or additive effects on gene regulation, therefore indicating that the effect observed with M1 could be mainly associated with the UAL (Figure 5(A)).
Figure 5.

Ursolic acid lactone regulates ECM and adipogenesis genes. (a) Venn diagrams depict the modulation of DEGs by M1 and UAL treatment in human adipocytes. (b) Bar graph illustrating five expression profiles, categorized using k-means, according to the average expression of the genes in the four conditions of human adipocytes. (c) The table presents the genes that belong to each profile, along with the gene ontology enrichment analysis.
Five distinct profiles were recognized (Figure 5(B)). Among the shared genes, three distinct expression profiles were identified. Profile 1 includes genes that increase their expression without reaching the levels observed in the undifferentiating control (Figure 5(B)). These genes primarily regulate the extracellular matrix and the epithelial-to-mesenchymal transition. Notably, this profile encompasses genes such as elastin (ELN), collagen type V alpha one chain (COL5A1), integrin alpha-11 (ITGA11), integrin beta-2 (ITGB2), thrombospondin 1 (THBS1), cellular communication network factor 1 (CCN1), gremlin1 (GREM1), and vasorin (VASN) (Figure 5(C)).
Profile 2 consists of genes whose expression is up-regulated above the basal levels of the undifferentiated control (Figure 5(B)). This profile includes genes related to the extracellular matrix, such as cysteine-rich secretory protein LCCL domain containing 2 (CRISPLD2), cartilage oligomeric matrix protein (COMP), Dickkopf WNT signaling pathway inhibitor 1 (DKK1), and integrin subunit alpha 5 (ITGA5) (Figure 5(C)). Profile 3 contains genes whose expression increases to reach the basal levels of undifferentiated control. These genes are associated with cellular differentiation from epithelium to mesenchyme, including tensin 3 (TNS3), fibulin 5 (FBLN5), frizzled class receptor 1 (FZD1), and C-X-C motif chemokine ligand 8 (CXCL8).
Additionally, two other gene expression profiles were identified: profile 4, which exhibited downregulation, and profile 5, which showed upregulation, predominantly regulated by UAL (Figure 5(B,C)). Profile 4 reveals the downregulation of genes related to adipogenesis and lipid metabolism. Notable genes in this profile include serine/threonine kinase 2 (MKNK2), involved in the establishment of metabolic genes, and enzymes such as phosphoenolpyruvate carboxykinase 1 (PCK1) and hormone-sensitive lipase E (LIPE). Transcription factors like nuclear receptor subfamily 1 group H member 3 (NR1H3, also known as LXRA) and MLX interacting protein-like (MLXIPL) are also significant.
Conversely, profile five genes are associated with processes such as cytoskeleton formation (actin beta (ACTB) and stathmin 2 [STMN2]), cell junctions (junctional cadherin 5 associated gene [JCAD]), and muscle contraction (tropomyosin 1 [TPM1]).
Transcriptional control mechanisms underlying the effects of OBE100 and UAL on human adipocyte gene expression
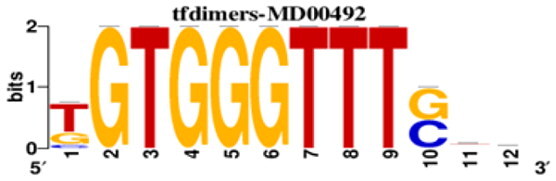
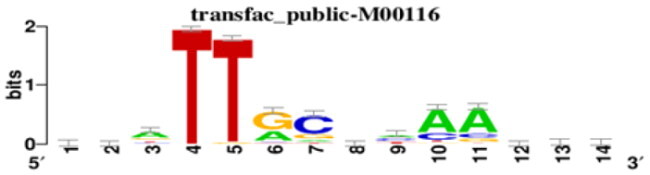
To explore whether the genes regulated by OBE100 and UAL are under the same transcriptional control, the promoters of these genes were examined for transcription factor enrichment (Tables 1, 2). The analyses revealed a coordinated action of E2F1, POU6F1, UHMK1, and MEF2A in modulating the expression of genes negatively regulated by OBE100, such as those in profile 3, including PRKAR2B, CD36, PEG10, HMGCS1, and LPIN1. These genes are implicated in pivotal cellular processes of adipocytes, such as lipid metabolism and differentiation. Conversely, for genes positively regulated by OBE100 in profile 4, we identified transcription factors SMAD1, SMAD3, MAZ, and JAZF1, which control various cellular processes, including cell survival, cytoskeleton organization, developmental pathways, and TGF-beta signaling.
Table 1.
Gene expression profiles influenced by OBE100 are related to key transcription factors.
| A | ||
|---|---|---|
| Transcription factors associated with profile 3 OBE100 | ||
| TF | MOTIF | Targets |
| E2F1 |
|
PRKAR2B, CD36, PEG10, HMGCS1, LPIN1 |
| POU6F1 |

|
PRKAR2B, CD36, PEG10, HMGCS1, LPIN1 |
| UHMK1 |

|
PRKAR2B, CD36, PEG10, HMGCS1, LPIN1 |
| MEF2A |

|
MC5R, CD36, PEG10, HMGCS1, LPIN1 |
| B | ||
| Transcription factors associated with profile 4 OBE | ||
| TF | MOTIF | Targets |
| SMAD1 |

|
GAS6, SHANK1, TAGLN, PRRX2, TPM1, CDH2, CNN2, BASP1, MEX3B, TGFB1I1 |
| MAZ |

|
GAS6, SHANK1, TAGLN, PRRX2, TPM1, CNN2, BASP1, MEX3B, TGFB1I1 |
| JAZF1 |

|
SHANK1, TAGLN, PRRX2, TPM1, CDH2, CNN2, MEX3B, |
| SMAD3 |

|
GAS6, TAGLN, SHANK1, CNN2, BASP1, TPM1, TGFB1I1 |
Promoter motif analysis (–300 to +50 relative to Transcription Start Site, TSS) was conducted for genes belonging to various gene expression profiles. The logo representing each identified transcription factor is displayed.
Table 2.
Gene expression profiles influenced by UAL are related to key transcription factors.
| A | ||
|---|---|---|
| Transcription factors associated with profile 4 UAL | ||
| TF | MOTIF | Targets |
| HNF4 |

|
LIPE, PCK1, FABP4, NR1H3, CSAD, MLXIPL, PPP1R1A, NEAT1, MKNK2, ADH1B. |
| CHURC1 |

|
NEAT1, PPP1R1A, NRH, PCK1, LIPE, CSAD |
| HNF4G |

|
MLXIPL, PCK1, NR1H3, NEAT1, MKNK2, CSAD. |
| IKZF2 |

|
MKNK2, LIPE, PCK1, PPP1R1A, NR1H3, NEAT. |
| B | ||
| Transcription factors associated with profile 5 UAL | ||
| TF | MOTIF | Targets |
| SRF |

|
ACTB, TPM1, STMN2, STC2. |
| FOS |

|
ACTB, TPM1, STMN2, STC2. |
| CEBPA |
|
ACTB, TPM1, STMN2, STC2. |
| HOXA13 |

|
ACTB, TPM1, STMN2, STC2. |
Promoter motif analysis (–300 to +50 relative to Transcription Start Site, TSS) was conducted for genes belonging to various gene expression profiles. The logo representing each identified transcription factor is displayed.
In the case of UAL, we investigated the potential transcriptional regulators of genes in profile 4 and profile 5. Profile 4 genes, downregulated by UAL treatment, were transcriptionally controlled by HNF4A, HANF4G, CHURC1, and IKZF2 (Table 2). Notably, genes such as PCK1 and FABP4, and others associated with PPAR signaling, adipogenesis, and triglyceride metabolism, were identified as potential targets of these TFs. Lastly, our analysis of profile 5 genes, upregulated by UAL treatment, revealed enrichment of transcription factors SRF, FOS, CEBPA, and HOXA13 in their promoters.
Discussion
Obesity is a global health issue. The result of a persistent positive energy balance usually leads to adipocytes increasing their size, and adipose tissue becomes larger and dysfunctional, recruiting macrophages and developing a chronic state of inflammation. This dysfunctional adipose tissue is associated with reduced insulin sensitivity and other pathologies linked to obesity (Reyes-Farias et al. 2021). Previous works have shown that an Eu extract named OBE100 has hypolipidemic, anti-inflammatory, hypoglycemic, and antioxidant activities (Guillén et al. 2015; Ceballos et al. 2018; Acín et al. 2021; Betancur et al. 2021; Mejia-Garcia et al. 2024). This work analyzed how 24-hour treatments of the extract compounds modulate adipocyte gene expression in human and mouse models. A cocktail of adipogenic chemicals was used to differentiate the mouse embryonic fibroblast cell line 3T3-L1 and human pre-adipocytes isolated from the fatty tissue of different donors. The differentiation process regulated a significant number of genes in both cell models.
In 3T3-L1, 1741 genes were up-regulated and 1908 down-regulated (Figure 1(A)). Sun et al. compared the gene expression changes during adipocyte differentiation, and they found that there were 1,462 genes upregulated and 1,015 genes downregulated in the 8-day differentiation process of 3T3-L1; however, they did not use Rosiglitazone in the chemical differentiation cocktail, and we collected cells at day 5 of differentiation (Sun et al. 2020). In human cells, we found that the differentiation process regulates a different number of genes (1348 up-regulated and 1594 down-regulated) (Figure 1(A)). Interestingly, of the 1121 orthologous genes DEGs scrutinized, 83.3% (933) changed in the same direction, underscoring the substantial overlap in their expression profiles in response to adipocyte differentiation in both species (Figure 1(C)). Data was confirmed with the heatmap of the expression profiles of these genes (Figure 1(D)). The PCA also unveiled a spatial distinction between pre-adipocytes and differentiating adipocytes in both species, reinforcing the shared nature of the orthologous DEGs in the differentiation process (Figure 1(E)). Additionally, the latter confirmed through cumulative frequency analysis that their magnitude was homogenous, and similar profiles were shared (Figure 1(F,G)). These two cell line models can make it possible to validate the biological reproducibility of the results obtained.
GO enrichment analysis revealed that early stages of adipocyte differentiation are strongly associated with amino acid and lipid metabolism, increasing the expression of genes involved in fatty acid oxidation and biosynthesis (Figure 1(H,I)). GO analysis had already identified enriched biological processes associated with the “lipid metabolic process,” “oxidation-reduction process,” “fat cell differentiation,” “cell cycle,” “cell adhesion,” and “extracellular matrix organization” as biological processes involved in mouse adipocyte differentiation (Sun et al. 2020). Interestingly, our GO analysis demonstrated that genes involved in extracellular matrix (ECM) organization and cell cycle, such as ADAMTSL1, COL14A1, COL16A1, CENPE, and KIF14, are essential in adipocyte differentiation in both species (Figure 1(H,J)) (Roostalu et al. 2010; Tsutsui et al. 2010; Gil-Cayuela et al. 2015; El-Arabey et al. 2018). The ECM is a network that facilitates fatty tissue cells’ proper structure and function. Obesity is characterized by massive adipose tissue expansion and ECM remodeling, and conditions like hypoxia in hypertrophic adipose tissue lead to an enormous upregulation of collagen proteins (Ruiz-Ojeda et al. 2019; Sun et al. 2023). The different cellular environments and the lack of hypoxic conditions may explain an inhibition of these genes during the first phases of the differentiation process in cell culture (Figure 1(J)). The treatment of differentiating adipocytes with the natural extract (OBE100), the individual triterpenes, and a mixture of them (M1) revealed that the impact of the treatment on gene expression depends on the cell line (Figure 2(A)), having a higher effect in human cells, data to take in consideration in the analysis of their impact (Figure 2(B)). In any case, OBE100 was the only treatment that induced significant differences in the gene expression in both cell lines (Figure 2(A)), regulating the expression of 51 and 21 genes in the human and mouse models, respectively (Figure 2(B)). This data supports our previous observation that OBE100 extract has more significant in vitro and in vivo hypolipidemic effects (Acín et al. 2021; Betancur et al. 2021). UAL is a relatively unknown triterpene that reduces fat content in hepatocytes and adipocytes (Balcazar et al. 2021). Interestingly, UAL treatment in human cells has a similar effect to that observed with the OBE100 extract (Figure 2(B)), data confirmed with the cumulative frequency analysis (Figure 2(C)). These observations collectively suggest that treatments with OBE100 in both models and UAL, at least in the human model, can significantly modulate genes associated with the biological functionality of differentiating adipocytes.
Signaling pathways play a crucial role in the regulation of cellular mechanisms. The natural extract modulates PPAR, Wnt, and extracellular matrix organization pathways significantly in both cellular models (Figure 3(A)). PPARs control the regulation of gene programs involved in lipid metabolism; PPARγ is a master regulator of adipogenesis and modulates gene expression in mature adipocytes. Diabesity is associated with activation of Wnt signaling, and inappropriate ECM remodeling is one of the factors in the pathogenesis of dysfunctional adipose tissue (Crewe et al. 2017; Aamir et al. 2020; Markussen et al. 2022). The alteration of these pathways by OBE100 may help to understand its biological effects. Notably, we found that OBE100 inhibited the expression of genes involved in lipid metabolisms, adipogenesis, and adipocyte fat loads, such as PRKAR2B, a gene that is required for adipogenesis, and low expression levels of this gene are associated with lipolysis, LPIN1 that plays a crucial role in adipogenesis, acting as a co-activator of PGC-1a to regulate fatty acid metabolism, FABP4, and Scd1 which are associated with adipogenesis and lipogenesis blockage, MC5R which is involved in lipolysis but also in glucose uptake, CD36 and PEG10, essential genes in adipocyte differentiation, and HMGCS1 which is a critical enzyme in free cholesterol synthesis (Figure 3(B)) (Hishida et al. 2007; Kerr et al. 2019; Guru et al. 2021; Floresta et al. 2022; Ji et al. 2022; Zhou et al. 2022; Zhu et al. 2022; Weerawatanakorn et al. 2024). ; Since changes in ECM are associated with AT remodeling, the effect of OBE100 increasing the expression of genes involved in ECM and adipogenesis, such as TIMP1 and ITGA11, associated with adipogenesis inhibition, ITGB2, associated with adipocyte viability and proliferation, GREM1 involved in adipogenesis, decreasing in early phases of adipocyte differentiation, and mfap2 associated with thermogenesis (Figure 3B), may help to understand its biological effects in vitro and in vivo (Craft et al. 2014; Morandi et al. 2016; Ma et al. 2020; Wang et al. 2020; Grillo et al. 2023).
OBE100 is a natural extract with a high content of triterpenes and a minor fraction of unknown molecules. Terpenoids show an anti-obesity effect (Claro-Cala et al. 2022). Because OBE100 and UAL modulated the highest number of genes in the human cells, we analyzed the differences in gene expression between the natural extract and the triterpenes (M1) in this model to help understand their effects. After a gene expression profile categorization, we found that triterpenes (M1) regulate exclusively 20%. However, different expression profiles were identified (Figure (4B,C). Profiles 1,2 and 5 showed triterpenes (M1) modulate the expression of genes involved in the cell cycle and EMC (Lin and Cai 2023; Park et al. 2023; Wang et al. 2024). The fact that these genes, such as TIMP1, ITGA11, ITGB2, or GREM1, play an essential role in extracellular matrix organization is interesting because adipose tissue development depends on ECM, adipogenesis, and angiogenesis (Figure 4(C)) (Johnston and Abbott 2022). As described above, profile 3 shows that the minority fraction of OBE100 regulates a different set of genes modulating PPAR signaling and fatty acid metabolism that may explain its broader effects (Figure 4(B,C)).
Promoter motif analysis revealed that the expression of profile 3 genes is controlled by TFs such as E2F1, POU6F1, UHMK1, and MEF2A (Table 1(A)). E2F proteins directly regulate early adipocyte differentiation, E2F1 is an important regulator that modulates differentiation and adipogenesis (Fajas et al. 2002; Jingqing Chen et al. 2020), and MEF2A is involved in different cellular physiopathology networks, including growth and differentiation (Liu et al. 2023). These results suggest that the anti-obesity effects of OBE100 may decrease adipogenesis through modulating adipogenic transcriptional factors. The natural extract also upregulates the expression of PRRX2, CCN2, and TGFB1l1 (profile 4), genes involved in the matrix remodeling of the ECM (Vohnoutka et al. 2019; Fang et al. 2023). These genes are controlled by TFs such as SMAD1 and MAZ (Table 1(B)). The current understanding indicates that OBE100 compounds can target different pathways involved in adipogenesis and ECM remodeling. However, the study of the regulation of these pathways remains in the initial stages. We have shown that regulating adipocyte gene expression depends on the molecules and how we mix them by analyzing the differences in gene expression between the natural extract and the mix of terpenoids without the minor fraction.
Interestingly, UAL, a least well-known triterpene, modulated the highest number of genes in the human model and has also been shown to have antiadipogenic properties (Balcazar et al. 2021). The gene expression profile comparison of M1 profiles relative to UAL showed that this triterpene regulates 100% of DEGs compared to the mixture of UA, OA, and UAL (Figure 5(A)). Profiles 4 and 5 (Figure 5(B,C)) mainly show genes exhibiting more significant change during UAL treatment. UAL inhibits the expression of genes, such as NEAT1, NR1H3, and PCK1, related to adipogenesis and lipid metabolism, which implies that the reactivation of the cell cycle may indicate a transition towards a more undifferentiated state (Profile 4) (Millward et al. 2010; Zhang et al. 2018; 2022). These genes expression is controlled through different TFs such as HNF4A, HNF4G, CHURC1, and IKZF2 (Table 2(A)). HNF4A has been described as inhibiting lipogenesis and promoting lipid catabolism (Lu et al. 2021). At the same time, UAL upregulates, probably through TFs involved in adipogenesis and brown adipocyte development, such as CEBPA, FOS, and SRF (Liu et al. 2020; Hu et al. 2023), the expression of genes such as STMN2, involved in cell proliferation and STC2, whose overexpression is associated with a reduced lipid droplet formation (Profile 5), (Ma et al. 2020; Shao et al. 2023). These results reinforce our earlier analyses with UAL, suggesting two key ideas: first, triterpenes, particularly UAL, positively regulate ECM genes, and second, they reduce the expression of genes important in adipogenesis and lipid metabolism. In summary, we observed that treatment with UAL and the natural extract modulates different gene expression pathways at the beginning of the adipocyte differentiation process. However, the result is antilipogenic in both cases.
Conclusions
This study allows a better understanding of the anti-obesity mechanisms of the natural Eu extract named OBE100. The molecules present in OBE100, including UAL as a critical molecule, are essential in modulating genes in the early phases of adipocyte differentiation. They regulate PPAR, Wnt, and extracellular matrix organization pathways, downregulating the expression of lipid metabolism and adipogenesis genes. OBE100 is a complex mix of molecules whose action involves a complex interplay between gene expression regulation, cell cycle control, epithelial-to-mesenchymal transition (EMT) modulation, and ECM remodeling. Some genes with the most significant impact have been discussed previously, allowing the construction of a hypothetical model of action summarized in Figure 6.
Figure 6.

The mode of action of OBE100 involves multiple pathways and regulatory mechanisms. OBE100 treatment impacts various cellular processes, including regulating gene expression of genes related to cell cycle progression and extracellular matrix (ECM) remodeling. Central to its action is the modulation of gene expression profiles, including genes such as HMGCS1, which plays a role in lipid metabolism. OBE100 may exert its effects on HMGCS1 through transcriptional regulators like PPARα, which is known to control genes involved in lipid metabolism.
Furthermore, OBE100 may influence ECM remodeling, crucial for maintaining tissue integrity and function. By modulating genes involved in ECM dynamics, such as those encoding matrix metalloproteinases and collagens, OBE100 can affect tissue architecture and cell behavior. Overall, the mode of action of OBE100 involves a complex interplay between gene expression regulation, cell cycle control, EMT modulation, and ECM remodeling, with potential implications for various physiological and pathological processes.
Supplementary Material
Acknowledgments
All the authors have read the paper and have agreed to be co-authors of the Data Availability Statement.
Funding Statement
This work was supported by Minciencias, Grant No. 111577756880, and Universidad de Antioquia, Grant No. 2017-16968. The funders played no role in the study design, data collection, analysis, publication decision, or manuscript preparation.
Disclosure statement
The authors declare that the research was conducted without any commercial or financial relationships that could be construed as a potential conflict of interest.
Data availability statement
The datasets generated for this study can be found in the Gene Expression Omnibus (GEO) DataSets (https://www.ncbi.nlm.nih.gov/gds) under the accession number GSE272831
References
- Aamir K, Khan HU, Sethi G, Hossain MA, Arya A.. 2020. Wnt signaling mediates TLR pathway and promote unrestrained adipogenesis and metaflammation: therapeutic targets for obesity and type 2 diabetes. Pharmacol Res. 152:104602. doi: 10.1016/j.phrs.2019.104602. [DOI] [PubMed] [Google Scholar]
- Acín S, Muñoz DL, Guillen A, Soscue D, Castaño A, Echeverri F, Balcazar N.. 2021. Triterpene-enriched fractions from Eucalyptus tereticornis ameliorate metabolic alterations in a mouse model of diet-induced obesity. J Ethnopharmacol. 265:113298. doi: 10.1016/j.jep.2020.113298. [DOI] [PubMed] [Google Scholar]
- Balcazar N, Betancur LI, Muñoz DL, Cabrera FJ, Castaño A, Echeverri LF, Acin S.. 2021. Ursolic acid lactone obtained from Eucalyptus tereticornis increases glucose uptake and reduces inflammatory activity and intracellular neutral fat: an in vitro study. Molecules. 26(8):2282. doi: 10.3390/molecules26082282. [DOI] [PMC free article] [PubMed] [Google Scholar]
- Betancur LI, Muñoz DL, Guillen A, Echeverri LF, Balcazar N, Acín S.. 2021. Major triterpenoids from Eucalyptus tereticornis have enhanced beneficial effects in cellular models when mixed with minor compounds present in raw extract. An Acad Bras Cienc. 93(Suppl. 3):e20201351. doi: 10.1590/0001-3765202120201351. [DOI] [PubMed] [Google Scholar]
- Börgeson E, Boucher J, Hagberg CE.. 2022. Of mice and men: pinpointing species differences in adipose tissue biology. Front Cell Dev Biol. 10:1003118. doi: 10.3389/fcell.2022.1003118. [DOI] [PMC free article] [PubMed] [Google Scholar]
- Ceballos S, Guilí En A, Lorena D, Noz M, Castã A, Echeverri LF, Acín S, Bal N, Bal AN.. 2018. Immunometabolic regulation by triterpenes of Eucalyptus tereticornis in adipose tissue cell line models. Phytomedicine. 50:109–117. doi: 10.1016/j.phymed.2018.03.059. [DOI] [PubMed] [Google Scholar]
- Chandorkar N, Tambe S, Amin P, Madankar C.. 2021. A systematic and comprehensive review on current understanding of the pharmacological actions, molecular mechanisms, and clinical implications of the genus Eucalyptus. Phytomedicine Plus. 1(4):100089. doi: 10.1016/j.phyplu.2021.100089. [DOI] [Google Scholar]
- Chen J, Leong PK, Leung HY, Chan WM, Wong HS, Ko KM.. 2020. 48Biochemical mechanisms of the anti-obesity effect of a triterpenoid-enriched extract of Cynomorium songaricum in mice with high-fat-diet-induced obesity. Phytomedicine. 73:153038. doi: 10.1016/j.phymed.2019.153038. [DOI] [PubMed] [Google Scholar]
- Chen J, Yang Y, Li S, Ying Y, Dai Z, Wang F, Wu Z, Tso P, Wu G.. 2020. E2F1 Regulates Adipocyte Di erentiation and Adipogenesis by Activating ICAT. 1–15. [DOI] [PMC free article] [PubMed] [Google Scholar]
- Claro-Cala CM, Jiménez-Altayó F, Zagmutt S, Rodriguez-Rodriguez R.. 2022. Molecular mechanisms underlying the effects of olive oil triterpenic acids in obesity and related diseases. Nutrients. 14(8):1606. doi: 10.3390/nu14081606. [DOI] [PMC free article] [PubMed] [Google Scholar]
- Craft CS, Pietka TA, Schappe T, Coleman T, Combs MD, Klein S, Abumrad NA, Mecham RP.. 2014. The extracellular matrix protein MAGP1 supports thermogenesis and protects against obesity and diabetes through regulation of TGF-β. Diabetes. 63(6):1920–1932. doi: 10.2337/db13-1604. [DOI] [PMC free article] [PubMed] [Google Scholar]
- Crewe C, An YA, Scherer PE.. 2017. The ominous triad of adipose tissue dysfunction: inflammation, fibrosis, and impaired angiogenesis. J Clin Invest. 127(1):74–82. doi: 10.1172/JCI88883. [DOI] [PMC free article] [PubMed] [Google Scholar]
- El-Arabey AA, Salama SA, Abd-Allah AR.. 2018. CENP-E as a target for cancer therapy: where are we now? Life Sci. 208:192–200. doi: 10.1016/j.lfs.2018.07.037. [DOI] [PubMed] [Google Scholar]
- El-Shiekh RA, Al-Mahdy DA, Hifnawy MS, Abdel-Sattar EA.. 2019. In-vitro screening of selected traditional medicinal plants for their anti-obesity and anti-oxidant activities. South African J Bot. 123:43–50. doi: 10.1016/j.sajb.2019.01.022. [DOI] [Google Scholar]
- Fajas L, Landsberg RL, Huss-Garcia Y, Sardet C, Lees JA, Auwerx J.. 2002. E2Fs regulate adipocyte differentiation. Dev Cell. 3(1):39–49. doi: 10.1016/S1534-5807(02)00190-9. [DOI] [PubMed] [Google Scholar]
- Fang S, Zhang S, Cao Z, Zhao G, Fang Z, Ma Y, Jiang H.. 2023. MicroRNAs in adipose tissue fibrosis: mechanisms and therapeutic potential. J Build Eng. 67:105910. doi: 10.1016/j.jobe.2023.105910. [DOI] [Google Scholar]
- Fernandez GJ, Ramírez-Mejía JM, Castillo JA, Urcuqui-Inchima S.. 2023. Vitamin D modulates expression of antimicrobial peptides and proinflammatory cytokines to restrict Zika virus infection in macrophages. Int Immunopharmacol. 119:110232. doi: 10.1016/j.intimp.2023.110232. [DOI] [PubMed] [Google Scholar]
- Floresta G, Patamia V, Zagni C, Rescifina A.. 2022. Adipocyte fatty acid binding protein 4 (FABP4) inhibitors. An update from 2017 to early 2022. Eur J Med Chem. 240:114604. doi: 10.1016/j.ejmech.2022.114604. [DOI] [PubMed] [Google Scholar]
- Ghaben AL, Scherer PE.. 2019. Adipogenesis and metabolic health. Nat Rev Mol Cell Biol. 20(4):242–258. doi: 10.1038/s41580-018-0093-z. [DOI] [PubMed] [Google Scholar]
- Gil-Cayuela C, Rivera M, Ortega A, Tarazón E, Triviño JC, Lago F, González-Juanatey JR, Almenar L, Martínez-Dolz L, Portolés M.. 2015. RNA sequencing analysis identifies new human collagen genes involved in cardiac remodeling. J Am Coll Cardiol. 65(12):1265–1267. doi: 10.1016/j.jacc.2015.01.029. [DOI] [PubMed] [Google Scholar]
- Grillo E, Ravelli C, Colleluori G, D’Agostino F, Domenichini M, Giordano A, Mitola S.. 2023. Role of gremlin-1 in the pathophysiology of the adipose tissues. Cytokine Growth Factor Rev. 69:51–60. doi: 10.1016/j.cytogfr.2022.09.004. [DOI] [PubMed] [Google Scholar]
- Guillén A, Granados S, Rivas KE, Estrada O, Echeverri LF, Balcázar N.. 2015. Antihyperglycemic activity of Eucalyptus tereticornis in insulin-resistant cells and a nutritional model of diabetic mice. Adv Pharmacol Sci. 2015:418673. doi: 10.1155/2015/418673. [DOI] [PMC free article] [PubMed] [Google Scholar]
- Guru A, Issac PK, Velayutham M, Saraswathi NT, Arshad A, Arockiaraj J.. 2021. Molecular mechanism of down-regulating adipogenic transcription factors in 3T3-L1 adipocyte cells by bioactive anti-adipogenic compounds. Mol Biol Rep. 48(1):743–761. doi: 10.1007/s11033-020-06036-8. [DOI] [PubMed] [Google Scholar]
- Hishida T, Naito K, Osada S, Nishizuka M, Imagawa M.. 2007. Peg10, an imprinted gene, plays a crucial role in adipocyte differentiation. FEBS Lett. 581(22):4272–4278. doi: 10.1016/j.febslet.2007.07.074. [DOI] [PubMed] [Google Scholar]
- Hu T, Li Z, Gong C, Xiong Y, Sun S, Xing J, Li Y, Li R, Wang Y, Wang Y, et al. 2023. FOS inhibits the differentiation of intramuscular adipocytes in goats. Genes. 14(11):2088. doi: 10.3390/genes14112088. [DOI] [PMC free article] [PubMed] [Google Scholar]
- Ji LQ, Hong Y, Tao YX.. 2022. Melanocortin-5 receptor: pharmacology and its regulation of energy metabolism. Int J Mol Sci. 23(15):8727. doi: 10.3390/ijms23158727. [DOI] [PMC free article] [PubMed] [Google Scholar]
- Johnston EK, Abbott RD.. 2022. Adipose tissue development relies on coordinated extracellular matrix remodeling, angiogenesis, and adipogenesis. Biomedicines. 10(9):2227. doi: 10.3390/biomedicines10092227. [DOI] [PMC free article] [PubMed] [Google Scholar]
- Kerr AG, Sinha I, Dadvar S, Arner P, Dahlman I.. 2019. Epigenetic regulation of diabetogenic adipose morphology. Mol Metab. 25:159–167. doi: 10.1016/j.molmet.2019.04.009. [DOI] [PMC free article] [PubMed] [Google Scholar]
- Lin X, Li H.. 2021. Obesity: epidemiology, pathophysiology, and therapeutics. Front Endocrinol. 12:706978. doi: 10.3389/fendo.2021.706978. [DOI] [PMC free article] [PubMed] [Google Scholar]
- Lin Y, Cai H.. 2023. Biological functions and therapeutic potential of SHCBP1 in human cancer. Biomed Pharmacother. 160:114362. doi: 10.1016/j.biopha.2023.114362. [DOI] [PubMed] [Google Scholar]
- Liu B, Ou WC, Fang L, Tian CW, Xiong Y.. 2023. Myocyte enhancer factor 2A plays a central role in the regulatory networks of cellular physiopathology. Aging Dis. 14(2):331–349. doi: 10.14336/AD.2022.0825. [DOI] [PMC free article] [PubMed] [Google Scholar]
- Liu R, Xiong X, Nam D, Yechoor V, Ma K.. 2020. SRF-MRTF signaling suppresses brown adipocyte development by modulating TGF-β/BMP pathway. Mol Cell Endocrinol. 515:110920. doi: 10.1016/j.mce.2020.110920. [DOI] [PMC free article] [PubMed] [Google Scholar]
- Lu H, Lei X, Guo S, Li W, Alnouti Y, Winkler R, John S.. 2021. Hepatocyte nuclear factor 4a and glucocorticoid receptor coordinately regulate lipid metabolism in mice fed a high-fat-high-sugar diet (315). [DOI] [PMC free article] [PubMed] [Google Scholar]
- Ma B, Xu X, He S, Zhang J, Wang X, Wu P, Liu J, Jiang H, Zheng M, Li W, et al. 2020. STC2 modulates ERK1/2 signaling to suppress adipogenic differentiation of human bone marrow mesenchymal stem cells. Biochem Biophys Res Commun. 524(1):163–168. doi: 10.1016/j.bbrc.2020.01.060. [DOI] [PubMed] [Google Scholar]
- Ma X, Sun J, Zhu S, Du Z, Li D, Li W, Li Z, Tian Y, Kang X, Sun G.. 2020. MiRNAs and mRNAs analysis during abdominal preadipocyte differentiation in chickens. Animals. 10(3):468. doi: 10.3390/ani10030468. [DOI] [PMC free article] [PubMed] [Google Scholar]
- Markussen LK, Rondini EA, Johansen OS, Madsen JGS, Sustarsic EG, Marcher AB, Hansen JB, Gerhart-Hines Z, Granneman JG, Mandrup S.. 2022. Lipolysis regulates major transcriptional programs in brown adipocytes. Nat Commun. 13(1):3956. doi: 10.1038/s41467-022-31525-8. [DOI] [PMC free article] [PubMed] [Google Scholar]
- Mejia-Garcia A, Javier G, Fernando L, Balcazar N, Acin S.. 2024. RNA-seq analysis reveals modulation of inflammatory pathways by an enriched-triterpene natural extract in mouse and human macrophage cell lines. Heliyon. 10(2):e24382. doi: 10.1016/j.heliyon.2024.e24382. [DOI] [PMC free article] [PubMed] [Google Scholar]
- Millward CA, DeSantis D, Hsieh CW, Heaney JD, Pisano S, Olswang Y, Reshef L, Beidelschies M, Puchowicz M, Croniger CM.. 2010. Phosphoenolpyruvate carboxykinase (Pck1) helps regulate the triglyceride/fatty acid cycle and development of insulin resistance in mice. J Lipid Res. 51(6):1452–1463. doi: 10.1194/jlr.M005363. [DOI] [PMC free article] [PubMed] [Google Scholar]
- Morandi EM, Verstappen R, Zwierzina ME, Geley S, Pierer G, Ploner C.. 2016. ITGAV and ITGA5 diversely regulate proliferation and adipogenic differentiation of human adipose derived stem cells. Sci Rep. 6(1):28889. doi: 10.1038/srep28889. [DOI] [PMC free article] [PubMed] [Google Scholar]
- Morigny P, Boucher J, Arner P, Langin D.. 2021. Lipid and glucose metabolism in white adipocytes: pathways, dysfunction and therapeutics. Nat Rev Endocrinol. 17(5):276–295. doi: 10.1038/s41574-021-00471-8. [DOI] [PubMed] [Google Scholar]
- Nguyen HN, Ullevig SL, Short JD, Wang L, Ahn YJ, Asmis R.. 2021. Ursolic acid and related analogues: triterpenoids with broad health benefits. Antioxidants. 10(8):1161. doi: 10.3390/antiox10081161. [DOI] [PMC free article] [PubMed] [Google Scholar]
- Nguyen NH, Ha TKQ, Yang JL, Pham HTT, Oh WK.. 2021. Triterpenoids from the genus Gynostemma: chemistry and pharmacological activities. J Ethnopharmacol. 268:113574. doi: 10.1016/j.jep.2020.113574. [DOI] [PubMed] [Google Scholar]
- Park S, Yu Y, Park GC, Shin SC, Kim JM, Lee BJ, Kim YH.. 2023. Proliferation-related features of the human mesenchymal stem cells derived from palatine tonsils, adipose tissues, and bone marrow. Tissue Eng Regen Med. 20(7):1119–1132. doi: 10.1007/s13770-023-00564-7. [DOI] [PMC free article] [PubMed] [Google Scholar]
- Reyes-Farias M, Fos-Domenech J, Serra D, Herrero L, Sánchez-Infantes D.. 2021. White adipose tissue dysfunction in obesity and aging. Biochem Pharmacol. 192:114723. doi: 10.1016/j.bcp.2021.114723. [DOI] [PubMed] [Google Scholar]
- Ribeiro MA, Estill MS, Fernandez GJ, Moraes LN, Krawetz SA, Scarano WR.. 2018. Integrative transcriptome and microRNome analysis identifies dysregulated pathways in human Sertoli cells exposed to TCDD. Toxicology. 409:112–118. doi: 10.1016/j.tox.2018.08.001. [DOI] [PubMed] [Google Scholar]
- Roostalu J, Schiebel E, Khmelinskii A.. 2010. Cell cycle control of spindle elongation. Cell Cycle. 9(6):1084–1090. doi: 10.4161/cc.9.6.11017. [DOI] [PubMed] [Google Scholar]
- Ruiz-Ojeda FJ, Méndez-Gutiérrez A, Aguilera CM, Plaza-Díaz J.. 2019. Extracellular matrix remodeling of adipose tissue in obesity and metabolic diseases. Int J Mol Sci. 20(19):4888. doi: 10.3390/ijms20194888. [DOI] [PMC free article] [PubMed] [Google Scholar]
- Sarma S, Sockalingam S, Dash S.. 2021. Obesity as a multisystem disease: trends in obesity rates and obesity-related complications. Diabetes Obes Metab. 23 Suppl 1(S1):3–16. doi: 10.1111/dom.14290. [DOI] [PubMed] [Google Scholar]
- Shannon P, Markiel A, Ozier O, Baliga NS, Wang JT, Ramage D, Amin N, Schwikowski B, Ideker T.. 2003. Cytoscape: a software environment for integrated models of biomolecular interaction networks. Genome Res. 13(11):2498–2504. doi: 10.1101/gr.1239303. [DOI] [PMC free article] [PubMed] [Google Scholar]
- Shao M, Wang L, Zhang Q, Wang T, Wang S.. 2023. STMN2 overexpression promotes cell proliferation and EMT in pancreatic cancer mediated by WNT/β-catenin signaling. Cancer Gene Ther. 30(3):472–480. doi: 10.1038/s41417-022-00568-w. [DOI] [PubMed] [Google Scholar]
- Sun A, Hu X, Chen H, Ma Y, Yan X, Peng D, Ping J, Yan Y.. 2021. Ursolic acid induces white adipose tissue beiging in high-fat-diet obese male mice. Food Funct. 12(14):6490–6501. doi: 10.1039/d1fo00924a. [DOI] [PubMed] [Google Scholar]
- Sun K, Li X, Scherer PE.. 2023. Extracellular Matrix (ECM) and Fibrosis in Adipose Tissue: overview and Perspectives. Compr Physiol. 13(1):4387–4407. doi: 10.1002/cphy.c220020. [DOI] [PMC free article] [PubMed] [Google Scholar]
- Sun W, Shahrajabian MH, Cheng Q.. 2021. Natural dietary and medicinal plants with anti-obesity therapeutics activities for treatment and prevention of obesity during lock down and in post-covid-19 era. Appl Sci. 11(17):7889. doi: 10.3390/app11177889. [DOI] [Google Scholar]
- Sun W, Yu Z, Yang S, Jiang C, Kou Y, Xiao L, Tang S, Zhu T.. 2020. A transcriptomic analysis reveals novel patterns of gene expression during 3T3-L1 adipocyte differentiation. 1–13. Front Mol Biosci. 7:564339. doi: 10.3389/fmolb.2020.564339. [DOI] [PMC free article] [PubMed] [Google Scholar]
- Surbhi Kumar A, Singh S, Kumari P, Rasane P.. 2021. Eucalyptus: phytochemical composition, extraction methods and food and medicinal applications. Adv Tradit Med. 23:369–380. doi: 10.1007/s13596-021-00582-7. [DOI] [Google Scholar]
- Tsutsui K, Manabe RI, Yamada T, Nakano I, Oguri Y, Keene DR, Sengle G, Sakai LY, Sekiguchi K.. 2010. ADAMTSL-6 is a novel extracellular matrix protein that binds to fibrillin-1 and promotes fibrillin-1 fibril formation. J Biol Chem. 285(7):4870–4882. doi: 10.1074/jbc.M109.076919. [DOI] [PMC free article] [PubMed] [Google Scholar]
- Villaseñor IM, Lamadrid MRA.. 2006. Comparative anti-hyperglycemic potentials of medicinal plants. J Ethnopharmacol. 104(1–2):129–131. doi: 10.1016/j.jep.2005.08.067. [DOI] [PubMed] [Google Scholar]
- Vohnoutka RB, Gulvady AC, Goreczny G, Alpha K, Handelman SK, Sexton JZ, Turner CE.. 2019. The focal adhesion scaffold protein Hic-5 regulates vimentin organization in fibroblasts. Mol Biol Cell. 30(25):3037–3056. doi: 10.1091/MBC.E19-08-0442. [DOI] [PMC free article] [PubMed] [Google Scholar]
- Wang L, Xue Y, Wang X, Pan Y, Li S, Mei J, Jiang S, Zheng Q, Liu Y, Liu Y, et al. 2024. DEPDC1 is a potential therapeutic target in lung adenocarcinoma. Nano Today. 56:102249. doi: 10.1016/j.nantod.2024.102249. [DOI] [Google Scholar]
- Wang L, Zhang C, Guang Jia Y, Lin, Hu L.. 2020. Tissue inhibitor of metalloprotease-1 (TIMP-1) regulates adipogenesis of adipose-derived stem cells (ASCs) via the Wnt signaling pathway in an MMP-independent manner. Curr Med Sci. 40(5):989–996. doi: 10.1007/s11596-020-2265-2. [DOI] [PubMed] [Google Scholar]
- Weerawatanakorn M, Kamchonemenukool S, Koh YC, Pan MH.. 2024. Exploring phytochemical mechanisms in the prevention of cholesterol dysregulation: a review. J Agric Food Chem. 72(13):6833–6849. doi: 10.1021/acs.jafc.3c09924. [DOI] [PMC free article] [PubMed] [Google Scholar]
- World Obesity Federation . 2023. The world obesity atlas 2023. [Google Scholar]
- Zhang H, Xu R, Li B, Xin Z, Ling Z, Zhu W, Li X, Zhang P, Fu Y, Chen J, et al. 2022. LncRNA NEAT1 controls the lineage fates of BMSCs during skeletal aging by impairing mitochondrial function and pluripotency maintenance. Cell Death Differ. 29(2):351–365. doi: 10.1038/s41418-021-00858-0. [DOI] [PMC free article] [PubMed] [Google Scholar]
- Zhang S, Wang L, Li S, Zhang W, Ma X, Cheng G, Yang W, Zan L.. 2018. Identification of potential key genes associated with adipogenesis through integrated analysis of five mouse transcriptome datasets. Int J Mol Sci. 19(11):3557. doi: 10.3390/ijms19113557. [DOI] [PMC free article] [PubMed] [Google Scholar]
- Zhou F, Fan X, Miao Y.. 2022. LPIN1 promotes triglycerides synthesis and is transcriptionally regulated by PPARG in buffalo mammary epithelial cells. Sci Rep. 12(1):2390. doi: 10.1038/s41598-022-06114-w. [DOI] [PMC free article] [PubMed] [Google Scholar]
- Zhu S, Zhang J, Wang W, Jiang X, Chen YQ.. 2022. Blockage of NDUFB9-SCD1 pathway inhibits adipogenesis: blockage of NDUFB9-SCD1 pathway inhibits adipogenesis. J Physiol Biochem. 78(2):377–388. doi: 10.1007/s13105-022-00876-7. [DOI] [PubMed] [Google Scholar]
Associated Data
This section collects any data citations, data availability statements, or supplementary materials included in this article.
Supplementary Materials
Data Availability Statement
The datasets generated for this study can be found in the Gene Expression Omnibus (GEO) DataSets (https://www.ncbi.nlm.nih.gov/gds) under the accession number GSE272831