

Abstract
The human intestine, a biomechanically active organ, generates cyclic mechanical forces crucial for maintaining its health and functions. Yet, the physiological impact of these forces on gut microbiota dynamics remains largely unexplored. In this study, we investigate how cyclic intestinal motility influences the dynamics of gut microbial communities within a 3D gut‐like structure (µGut). To enable the study, a tunable flow Gut Microbiome‐on‐a‐Chip (tfGMoC) is developed that recapitulates the cyclic expansion and compression of intestinal motility while allowing high‐magnification imaging of microbial communities within a 3D stratified, biomimetic gut epithelium. Using deep learning‐based microbial analysis, it is found that hydrodynamic forces organize microbial communities by promoting distinct spatial exploration behaviors in microorganisms with varying motility characteristics. Empirical evidence demonstrates the impact of gut motility forces in maintaining a balanced gut microbial composition, enhancing both the diversity and stability of the community ‐ key factors for a healthy microbiome. This study, leveraging the new tfGMoC platform, uncovers previously unknown effects of intestinal motility on modulating gut microbial behaviors and community organizations. This will be critical for a deeper understanding of host‐microbiome interactions in the emerging field of microbiome therapeutics.
This study introduces a tunable flow Gut Microbiome‐on‐a‐Chip (tfGMoC), a facile platform to simulate gut motility‐driven hydrodynamic forces to investigate microbial dynamics in a 3D gut‐like structure (µGut). The findings demonstrate that hydrodynamic forces facilitate bacterial spatial exploration and influence the organization of microbial communities. The study reveals previously unknown effects of intestinal motility on gut microbial behavior and spatial organization of communities, providing critical insights into gut microbiota dynamics.

1. Introduction
Human gut motility plays a pivotal role in facilitating key intestinal functions, including digestion, nutrient absorption, and waste elimination, all of which have a significant impact on human health.[ 1 ] The coordinated mechanical and hydrodynamic forces generated by peristalsis and segmentation processes, such as shear flow, intestinal wall expansion, and compression directly influence the functions of the intestinal epithelium.[ 1 ] Beyond the epithelium, the human intestine harbors a diverse population of gut microbiota[ 2 ] which are also subjected to these forces.
Clinical evidence suggests a correlation between impaired gut motility and alterations in the composition of gut microbiota.[ 3 ] Mechanical stimuli, such as hydrodynamic force, have been shown to influence various microbial behaviors, including surface colonization, growth, upstream migration, motility switching, and interspecies competitions.[ 4 ] However, most studies focus solely on shear forces, neglecting other motility patterns like peristalsis and segmentation. Additionally, these studies are often conducted on 2D or abiotic surfaces, lacking physiologically relevant host factors and the 3D stratified habitat of the gut, making it difficult to translate findings to the gut environment.
Microorganisms possess diverse motility mechanisms[ 5 ] that enable them to acquire essential resources, such as physical space and nutrients.[ 6 ] In ecological communities like the gut microbiota,[ 7 ] different motility strategies allow species to compete for shared resources[ 8 ] and partition these resources in ways that enable coexistence.[ 9 ] These collective behaviors may result in the spatial organization of microbial communities, influencing their structure,[ 10 ] and contributing to the stability[ 8 , 11 ] and diversity[ 12 ] that are essential for healthy gut microbiota.[ 13 ]
Despite the importance of understanding gut microbial behaviors under physiologically relevant conditions, research in this area faces significant challenges due to the lack of mechanistic platforms. An ideal model system would replicate the complex mechanical forceof gut motility, provide a physiologically relevant 3D habitat that mimics the host environment, and allow for high‐resolution imaging to visualize microbial community dynamics.
Conventional 2D systems, such as soft agar and liquid media that create nutrient patches,[ 14 ] 3D printed host‐microbe models,[ 15 ] and microfluidic devices that generate controlled environments,[ 4c ] are inadequate for recreating the combined effects of intestinal motility and the 3D gut environment. Larval Zebrafish has also been used as a candidate organism to investigate host‐microbe interactions under altered intestinal motility.[ 16 ] However, despite their biological complexity, in vivo platforms face challenges in controlling the mechanical environment and visualizing gut microbial communities, making it difficult to examine community dynamics. The gut‐on‐a‐chip model recapitulates essential intestinal features, such as cellular complexity, cyclic stretching, and fluid shear,[ 17 ] and has been instrumental in exploring various aspects of gut physiology and disease.[ 3 , 4 , 18 ] However, these models typically lack the resolution needed for in situ, high‐magnification visualization of different microbial species, restricting their utility for studying gut microbiota behaviors. Our previous Gut Microbiome‐on‐a‐Chip (GMoC)[ 19 ] addressed some of these limitations but primarily focused on shear flow, omitting the critical cyclic components of gut motility that are essential for accurately representing gut microbial behaviors.
In this study, we present advancements on both technological and scientific fronts. Extending our previously reported GMoC,[ 19 ] we developed a tunable flow Gut Microbiome‐on‐a‐Chip (tfGMoC) capable of simulating cyclic compression‐ and expansion‐like motions that mimic intestinal peristalsis and segmentation. Within this system, we recreated the gut microenvironment, where human intestinal epithelial cells (Caco‐2 cells) formed a 3D structured, functional biomimetic gut epithelium (µGut). Additionally, we incorporated deep learning‐based bacterial quantification to track the spatial dynamics of microbial communities colonizing the µGut.
The tfGMoC allowed us to demonstrate how gut motility‐generated hydrodynamics induce the spatial organization of gut bacterial communities by modulating the differential 3D spatial exploration behaviors of motile and nonmotile gut bacteria. Our findings reveal that hydrodynamic forces are key to fostering a balanced composition within the gut microbial community, enhancing its diversity and stability. These insights provide an unprecedented view into gut microbial community behaviors and their relationship to gut motility. Taken together, our results highlight the critical role of gut motility and its associated hydrodynamics in shaping gut microbial community structure.
2. Results
2.1. Development of a Tunable Flow Gut Microbiome‐on‐a‐Chip (tfGMoC) Recapitulating Gut Motility, 3D Epithelium, and Key Functions
Gut motility is characterized by the peristalsis and segmentation processes of the intestinal walls resulting in cyclic lumen narrowing (compression) and widening (expansion), which ultimately generate peristaltic shear flow of the luminal contents.[ 1a ] In this study, we introduce a novel tunable flow Gut Microbiome‐on‐a‐Chip (tfGMoC) that is inspired by the mechanically active dynamics of the intestinal walls. Our design includes a bilayered polydimethylsiloxane (PDMS) chip that can generate cyclic compression and expansion movements using a deflectable microchannel wall, and shear flows created by continuous media flow using a syringe pump (Figure 1a). The two layers of PDMS are bonded to a microscopic glass slide to support epithelial cell culture and facilitate in situ, high‐magnification microscopy for the investigation and visualization of gut microbial behaviors under mechanical stimuli (Figure 1b). The bottom PDMS layer consists of the cell culture channel (width × height = 1500 × 180 µm, respectively) while the top PDMS layer (width × height of 1500 × 50 µm, respectively) houses an air chamber that is parallelly juxtaposed over the cell culture channel. By controlling the thickness of the bottom PDMS layer (≈400 µm), we create a pneumatically deflectable quake valve[ 20 ] to facilitate cyclic compression and expansion of the ceiling of the cell‐culture chamber by pumping or withdrawing air into the air chamber (Figure 1c; Video S1, Supporting Information). Additionally, this juxtaposed configuration of the chip enables parallelization by incorporating an array of designs side‐by‐side for high throughput applications (Figure 1c). The bottom PDMS layer also consists of a gel channel adjacent to the cell culture channel to house the extracellular matrix (ECM, Type 1 collagen gel) (Figure 1c; Figure S1, Supporting Information). The gel channel is connected to the cell chamber through a narrow opening (width – 150 µm), which serves as a capillary burst valve to confine the ECM within the respective channel. The presence of collagen gel supports cell attachment and promotes the long‐term maintenance of the Caco‐2 cells culture.[ 21 ]
Figure 1.

The tunable flow Gut Microbiome‐on‐a‐Chip (tfGMoC) recapitulates gut motility, 3D gut epithelium, and key functions. a) Cross‐sectional schematic of the tfGMoC model, illustrating the multilayered PDMS chip organization. Air is infused or withdrawn from the top‐air chamber, inducing deflection of the roof of the cell culture chamber, and resulting in cyclic compression and expansion. b) Schematic of the parallelized tfGMoC array chip, featuring the top layer with air chambers, the middle layer with cell culture chambers, and the glass cover slip. Inset: Magnified schematic of a section of the chip showcasing the bonding orientation of the PDMS layers. c) Image of the tfGMoC array chip with the inset highlighting the chip cross‐section under different conditions; expanded state, steady state, and compressed state, showcasing the elasticity of the cell culture channel roof. d) Fluid dynamic simulation illustrating velocity vectors within the tfGMoC model across one actuation cycle. The velocity vectors originate from two components: a constant volumetric flow rate pumping and the peristaltic motion of the air chambers. e) 3D self‐stratified biomimetic gut epithelium developed from Caco‐2 cells (µGut) within the tfGMoC. f) Magnified top‐view of the µGut cultured in the tfGMoC, signifying the convoluted villi‐like structures. g) Cross‐sectional view of the convoluted villi‐like projections of the µGut within the tfGMoC. The µGut exhibits h) micro‐villi structures and i) brush border. j) ZO‐1 expression indicates the formation of the µGut barrier. Computational Fluid dynamics (CFD) modeling shear stress (top) and pressure drop (bottom) in the tfGMoC model under k) shear flow and l) expansion mode. The top row highlights the schematic of the deflected cell channel at different time points. m) Height of the villi after 7 d of µGut culture under static, shear flow, and different modes of mechanical forces within the tfGMoC model. n = 4, **p < 0.01. n) Quantification of mucin secreted by µGut using Alcian blue staining, representing the fold change in mucin secretion relative to static Caco‐2 culture after 7 d. n = 5, **p < 0.01.
Calibration of the deflectable cell channel (refer to methods) was performed using fluorescein isothiocyanate (FITC) fluorescence distribution (Figure S2, Supporting Information). The calibration curve can be used to calculate the volume of air to be pumped (or withdrawn) into the air chamber for varying percentages of deflection of the deflectable cell culture channel. In addition to cyclic mechanical actuation, a constant fluid flow through the cell culture channel at physiologically relevant shear stress (0.03 dyne cm−2; reported in vivo shear stress ≈0.002–0.08 dyne cm−2)[ 22 ] is generated using a syringe pump (Figure S3, Supporting Information).
To understand hydrodynamics, temporal velocity vectors were computed from fluid dynamic simulations in the cell culture chamber during a single actuation cycle (10 s). These simulations revealed the complex fluid flow profile resulting from the combination of cyclic mechanical deflection and constant displacement fluid flow (Figure 1d). Briefly, an initial constant unidirectional fluid flow (T = 0 s, constant flow from syringe pump) undergoes a reversal in the flow direction (T = 2.5 s) as the cell channel roof expands, leading to an increase in the volume of the cell culture chamber. The backflow is nullified when the cell channel is at the maximum expanded state (T = 5 s), resulting in a return to unidirectional fluid flow. As the deflected channel returns from its expanded state to its equilibrium state, the fluid velocity increases (T = 7.5 s) before stabilizing at its initial levels (T = 10 s). Notably, despite the flow reversal, a net forward flow (from inlet to outlet) is generated in the chip, mimicking the physiological peristaltic and segmentation movement of chyme through the intestine (Videos [Link], [Link], [Link], Supporting Information). Fluorescent beads tracking (Videos S3 and S4, Supporting Information) showcased the back‐and‐forth flow corroborating the observations from CFD simulations. Furthermore, the magnitude of the bead's velocity and its directionality matched the simulated velocity profiles for both the compression and expansion modes (Figure S4, Supporting Information). Also, such peristaltic flow profiles favored the culture of the intestinal epithelial cell line (Caco‐2 cells) from a cell monolayer on Day 1 to a multilayered 3D µGut by Day 7. In addition to improved coverage over time, Caco‐2 cells self‐organized to form 3D projections, simulating the in vivo intestinal epithelium‐like features across the length of the cell culture channel (Figure 1e,f). High‐magnification confocal microscopy enabled easy visualization of the functional characteristics of the developed 3D µGut epithelium, highlighting the formation of the crypt‐villus morphogenesis in the 3D Caco‐2 µGut with microvilli structures over 7 days (Figure 1g,h). The cells were organized in a 3D structure forming tight junctions (ZO‐1), a hallmark of a physiologically healthy intestinal epithelial barrier (Figure 1j).
Physiologically, the intestinal epithelium comprises a differentiated distribution of cells including enterocyte (sucrase‐isomaltase; SI),[ 23 ] goblet cells (Mucin 2; MUC2),[ 24 ] enteroendocrine cells (Chromogranin A; CHGA),[ 25 ] paneth cells (Lysozyme; LYSO),[ 26 ] and stem cells (SOX9)[ 27 ] and proliferating cells (Ki67)[ 28 ] organized along the crypt‐villus axis. We have previously reported the heterogeneity of the Caco‐2 cells in a shear‐induced model.[ 19 ] In tfGMoC, we note that peristaltic hydrodynamics facilitates improved physiological relevance in cell stratification as compared to the shear‐only model (Figure S5a, Supporting Information). Similar to the in vivo crypt‐villus organization, the stem cells were spotted at the base of the 3D µGut epithelium, within 0–5 µm of the villi height while proliferative cells (Ki67) spread higher (0–20 µm) and the enteroendocrine cells organized between the base and the mid‐section of the µGut (5 and 40 µm). Paneth cells are another cell type found closer to the base (0–20 µm) and Goblet cells (MUC2) spread across the height of the µGut (0–60 µm) (Figure S5b, Supporting Information). Due to such a spatial arrangement of the epithelial cells, we refer to the 3D projections as the “crypt‐villus axis” or “villi‐like” in the following sections.
Taken together, we have developed a novel tfGMoC that mimics the biomechanical cues of an in vivo intestine by replicating a back‐and‐forth flow profile, emulating the hydrodynamics from peristalsis and segmentation of gut motility. This was achieved through a simple modification of the GMoC[ 19 ] by altering the deflectability of the cell culture channel to tune the fluid flow through pneumatic actuation. Simultaneously, the chip supports the formation of an intact 3D biomimetic gut epithelium that more closely resembles in vivo spatial organization as opposed to the shear‐only condition. Additionally, the chip's unique arrangement facilitates easy integration with high‐magnification microscopy for in situ visualization of sub‐micron features suitable for deep learning and parallelization for high throughput operations, a distinction from existing mechanically active gut‐on‐a‐chip systems.
2.2. Hydrodynamics in the tfGMoC and its Associated Impact on 3D µGut Epithelium
To understand the influence of cell channel deflection on fluid dynamics and subsequent impact on the 3D µGut epithelium, we performed computational fluid dynamic analysis and cultured cells under static culture (no fluid perfusion + no cell channel deflection), shear mode (steady fluid perfusion + no cell channel deflection), and expansion mode (steady fluid perfusion + cell channel deflection). As expected, the pressure drops and shear rate across the channel remained constant at 0.4 Pa and 0.03 dyne cm−2, respectively under the shear mode conditions (Figure 1k). In the expansion mode, the cell channel deflection was induced by air withdrawal from the air chamber, reaching a maximum at 5 s and returning to its equilibrium (0% channel compression) state within 10 s (Figure 1l). From CFD analysis, a spatio‐temporal variation in shear stress and pressure change was observed under expansion mode (Video S5, Supporting Information). In tandem with the velocity profile (Figure 1d), shear stress and pressure assumed negative values at T = 2.5 s owing to the reversal in fluid flow. Furthermore, the pressure and shear stress reached a maximum of (2.3 Pa and 0.17 dyne cm−2, respectively) at T = 7.5 s, before reducing to their equilibrium values corresponding to T = 0 (0.4 Pa and 0.03 dyne cm−2, respectively).
To assess the impact of various mechanical stimuli on gut epithelium cultured on‐chip, Caco‐2 cells were cultured for 7 days and the height of the 3D crypt‐villus axis and the fold change in mucin secretion by the µGut was quantified. Under static conditions, Caco‐2 proliferates as a monolayer over 7 days, reaching a maximum height of 10 µm (Figure 1m; Figure S6a, Supporting Information). A dynamic fluid microenvironment generated by shear flow, with or without mechanical actuation, results in the formation of the crypt‐villus axis with comparable villi heights between shear flow and expansion modes (≈90 µm) (Figure 1m; Figure S6b, Supporting Information).
Altered mechanical stimuli also impact the mucin secretion by Caco‐2 cells. The on‐chip µGut epithelium cultured under different stimuli was stained using Alcian blue to quantify the mucin production (Figure 1n; Figure S7, Supporting Information). As expected, mucin levels were the lowest in static culture (Figure 1n; Figure S7a, Supporting Information). In contrast, shear flow demonstrated a 3.5 times higher mucin secretion as compared to static culture, while the expansion mode exhibited significantly elevated mucin secretion at 4.5 times greater than that observed in static culture (Figure 1n; Figures S5b,c, Supporting Information).
Apart from expansion mode, we examined the impact of compressive channel deflections on the fluid flow profile (Figure S8, Supporting Information). For the compression mode, the cell channel was deflected by pumping into the air chamber based on the calibration curve in Figure S2 (Supporting Information) to achieve a 15% channel compression. In brief, at T = 0 s, the cell channel deflection was set at 15% compression following which air was withdrawn from the air chamber to cause a channel expansion and eventually back to the 15% compression by T = 10 s. While the membrane could be deflected further to create higher percentages of channel compression, 15% was identified as the optimal condition for compression mode from empirical observations. We observed significant cell detachment for higher degrees of channel compression (>30%). CFD simulation of velocity, shear stress, and pressure under compression mode (Figure S8; Video S5, Supporting Information) revealed directional changes to the fluid flow similar to that in expansion mode with reverse flow at T = 2.5 s and a net forward flow for a cycle (10 s). The maximum velocity in compression mode was 60% higher than in expansion mode (2 mm−1 s vs 1.2 mms s−1), while the maximum shear stress increased by 20% (0.2 dyne cm−2 vs 0.17 dyne cm−2) and pressure drop was higher by 90% (4.3 Pa vs 2.3 Pa) in compression mode. These fluid dynamic parameters resulted in stunted villi (≈60 µm) and reduced mucin secretion (25% lower than in expansion mode) over the 7‐day cell culture period (Figure S9, Supporting Information).
Notably, mucin secreted under compression mode and shear flow conditions was comparable. These results corroborate previous observations that favorable mechanical stimuli coupled with shear stress can lead to increased mucin secretion in Caco‐2 cells.[ 29 ] Cyclic changes in shear rate and channel pressure drop represent crucial mechanical stimuli that influence cell growth and contribute to the development of a functional and biomimetic 3D µGut model. Caco‐2 self‐organization, spatial organization, and mucin secretion show favorable results under expansion mode while stunted Caco‐2 crypt‐villus axis and reduced mucin secretion highlight the adversarial impact of compression mode. Given these observations, compression mode did not qualify for subsequent studies. Importantly, the structural and biochemical components of the established µGut, in conjunction with the mechanical stimuli generated by tfGMoC, mirror those found in the human intestine. This combination fosters the creation of a conducive and naturally representative environments for mimicking gut bacterial behaviors within the intestine, thereby highlighting this system as a useful platform for conducting in‐depth studies on gut microorganisms.
2.3. Effects of Mechanical Forces on 3D Spatial Exploration Behaviors of Motile Bacteria in a 3D µGut
To comprehend the influence of in vivo‐like gut motility on bacterial spatial exploration, we chose two model organisms with distinct morphologies and motility mechanisms: E. coli Nissle 1917 (EcN), which exhibits flagellum‐driven swimming motility in fluid and swarming motility on surfaces,[ 5a ] and Lactobacillus rhamnosus GG (LGG), which lacks motility mechanisms[ 30 ] (Figure S10, Supporting Information). Two modes of fluid flow‐ shear (control) and expansion mode (motile gut)‐ were applied to assess varied bacterial responses in attachment, phenotype, and spatial exploration of motile and nonmotile bacteria within the µGut. Notably, we avoided using static mode as a control due to indiscriminate bacterial proliferation under no‐flow conditions, which compromised gut epithelium within a few hours.
Due to the mucin layer produced by the µGut, motile EcN efficiently attaches to the outer surface of the µGut under both shear and expansion flow conditions (Figure 2a,b; Videos S6 and S7, Supporting Information). Confocal imaging revealed the spatial distribution of motile EcN throughout the 3D µGut surface, spanning from the base to the top of the villus, with consistent patterns observed between shear and expansion modes (Figure 2c–f; Videos S6 and S7, Supporting Information).
Figure 2.

Motile bacteria utilize inherent motility for 3D spatial exploration in the µGut, with minimal influence from hydrodynamic forces. Top and cross‐sectional view of motile EcN attachment to the µGut surface under a) shear and b) expansion modes. c) Shear‐induced colonization of motile EcN on the 3D µGut, displaying the spatial presence throughout the 3D µGut. The top view of EcN colonization was captured at three spatial locations (villus base, side, and top) along the Z‐axis of the crypt‐villus axis. d) Deep learning‐based quantification of motile EcN distributed on the 3D µGut under the shear mode reveals 3D spatial presence but a gradient spatial distribution, predominantly localized near the villus base. e) Expansion‐induced spatial distribution of motile EcN on the 3D µGut. f) The 3D bacterial spatial presence and gradient spatial distribution of motile EcN on the µGut under expansion. g) Abundance of motile EcN colonizing 3D µGut under different mechanical forces. h) Schematics illustrating the 3D spatial exploration behavior of motile EcN and the resulting spatial distribution on the µGut under different mechanical modes.
Spatial distribution analysis using deep learning‐based bacterial quantification (Figure S11, Supporting Information) revealed the spatial presence of motile bacteria at the villus top but with high bacterial density at the villus base under both shear and expansion modes (Figure 2d,f). This suggests that motile EcN can colonize the entire surface regardless of varied hydrodynamic forces but prefers to localize near the base compared to the villus side and top (Figure 2d,f). Motile EcN exhibits individual bacterial forms under both shear and expansion forces, indicating that hydrodynamic forces have a less significant influence on the motile bacteria's phenotype (Figure 2c). In addition, denser bacterial layers on the µGut (Figure 2e) and increased abundance of motile EcN (Figure 2g) indicate enhanced bacterial growth promoted by the expansion mode.
CFD simulation of the velocity field in the crypt‐villus axis of the µGut revealed that the expansion mode generates a dynamic flow profile in both the horizontal and vertical directions (Figure S12a,b, Supporting Information), with each cycle exhibiting alternating flow directions and higher fluid velocity‐ contrasting with the steady flow profile generated by shear mode (Figure S12a; Video S8, Supporting Information). Additionally, both mechanical modes exhibited spatially varying shear gradients along the height of the crypt‐villus axis, displaying high shear stress at the villus top but low shear stress at the villus base, although the levels were significantly higher in the expansion mode (Figure S12c, Supporting Information).
Enhanced bacterial growth and abundance under expansion mode (Figure 2g) could be attributed to efficient agitation of the media by dynamic flow during cyclic expansion, refreshing local oxygen and nutrients required for bacterial growth. The 3D spatial presence of motile EcN indicates that motile bacteria can explore the 3D space using their inherent motility mechanisms rather than relying on surrounding flows. However, the gradient spatial distribution indicates that they were influenced by the shear gradient generated within the crypt‐villus axis and favored colonizing the low‐shear stress region, which is the base of the crypt‐villus axis (Figure S12c, Supporting Information).
Overall, motile bacteria were likely to initially attach near the base and villus top due to the flat surface and diffusive forces (Figure 2h). The 3D spatial presence of motile bacteria observed under both shear and expansion modes indicates that the mechanical force has limited influence on the spatial exploration behaviors or phenotypes of bacteria with inherent motility mechanisms. However, the gradient spatial distribution and enhanced bacterial abundance under the expansion mode suggest that hydrodynamics generated by motility, and the resulting peristaltic flow dynamics, impact colonization and growth of motile bacteria on the 3D‐structured µGut.
2.4. Expansion Promotes 3D Spatial Exploration and Phenotype Changes of Nonmotile Bacteria
Unlike motile bacteria, which were less affected by different mechanical modes, bacteria lacking motility mechanisms were significantly influenced by expansion‐generated forces in terms of 3D spatial distribution and phenotypes. Nonmotile LGG attached to the mucin layer of the µGut exhibited an elongated chain morphology[ 31 ] under both shear and expansion modes (Figure 3a,b). Confocal imaging and deep‐learning quantification of initial LGG attachment revealed a sparse distribution within the tfGMoC, predominantly diffusing to the bottom of the villus‐like structures or settling at the roof of the villus (Figure S13, Supporting Information), with limited presence along the villus sides. After 24 h under shear mode, LGG localized predominantly near the base (Figure 3c,d; Video S9, Supporting Information), showcasing two types of bacterial phenotypes: a predominant individual form and a low‐abundance clustered form (Figure 3c). Notably, bacterial phenotypes depended on their spatial locations. Specifically, the individual form was mainly at the base and side of the villus, while LGG clusters were observed on top. Moreover, above the villus, interconnected bacterial streamers[ 4 , 32 ] that connected LGG clusters between villi were also observed (Figure 3c). This indicates that shear mode induced nonmotile bacteria to adopt varied phenotypes at different spatial locations along the crypt‐villus axis. However, the absence of initial 3D spatial presence and crypt‐localized spatial distribution of nonmotile LGG indicates that these bacteria were unable to freely explore the 3D gut space, unlike motile bacteria, and that shear mode did not contribute to improving their 3D spatial presence.
Figure 3.

Hydrodynamics generated by expansion facilitates efficient dispersal of nonmotile LGG, enabling 3D spatial exploration in the µGut. Top and cross‐sectional view of nonmotile LGG attachment to the µGut surface under a) shear and b) expansion modes. c) Shear‐induced nonmotile LGG colonizing in the 3D µGut, displaying localized spatial distribution, predominantly colonized near the base. The top view of LGG colonization was captured at five spatial locations along the Z‐axis of the crypt‐villus axis (base, side, and top of the villus), above the villus top and inter‐villus space. d) Deep learning‐based quantification of nonmotile LGG distributed on the 3D µGut under the shear mode. e) Expansion‐induced nonmotile LGG colonizing in the 3D µGut, displaying relatively even spatial distribution throughout the crypt‐villus axis. f) Quantification of nonmotile LGG under expansion, displaying even spatial distribution throughout the crypt‐villus axis. g) Abundance of nonmotile LGG under shear and expansion modes. h) Spatially varying shear stress along the Z‐axis of the crypt‐villus axis, influencing phenotype changes of nonmotile LGG in distinct spatial locations. i) Increased hydrostatic pressure under expansion, promoting cluster formation of nonmotile LGG. j) Schematics illustrating how hydrodynamic forces altered 3D spatial exploration behaviors of nonmotile LGG, resulting in distinct 3D spatial distribution and phenotypes in the 3D µGut.
In contrast, the expansion mode promoted a relatively even spatial distribution of nonmotile LGG throughout the crypt‐villus axis compared to the shear mode (Figure 3e,f; Video S10, Supporting Information). However, a high density of LGG was still observed at the villus base, with less presence on the sides and top of the villus (Figure 3f).
Compared to the shear mode, which exhibited abundant individual bacterial forms but fewer clusters, the expansion mode induced more clustering phenotypes and fewer individual forms, indicating that nonmotile bacteria switch their dominant phenotypes in response to different mechanical forces. Fewer individual bacterial forms were found near the base, while increased LGG clusters and filamentous aggregates[ 33 ] were observed on the villus sides and top (Figure 3e). Similar to the shear mode, interconnected LGG streamers were also observed above the villus under expansion (Figure 3e). Expansion force also contributed to an increased abundance of nonmotile bacteria compared to shear mode (≈1.7 folds), indicating expansion‐induced bacterial growth (Figure 3g).
The enhanced 3D spatial distribution promoted by the expansion mode demonstrated the capability of nonmotile bacteria for 3D spatial exploration, utilizing a peristaltic‐driven environment and even exploiting the upper region of the 3D villus that was previously unreachable under shear mode. This observation was supported by the CFD simulations of the Z‐velocity field under expansion mode. The analysis unveiled dynamic flows due to the cyclic upward and downward deflection of the membrane (Figure S12b; Video S8, Supporting Information). This dynamic flow facilitated the 3D spatial presence and distribution of LGG along the height of the villi. Coupled with cyclic backflow (Figure S12a; Video S8, Supporting Information), the dynamic flow profiles induced by expansion enabled continuous mixing and redistribution, allowing nonmotile bacteria to efficiently disperse and explore 3D µGut. The enhanced spatial presence of bacteria contributed to bacterial growth through increased spatial resource acquisition, as evidenced by the bacterial abundance in the expansion mode (Figure 3g). In comparison, the laminar flow profile generated by the shear mode was insufficient to facilitate bacterial dispersion, resulting in localized spatial distribution and limited 3D spatial presence, with lower bacterial abundance. Notably, both shear and expansion modes resulted in a significant increase in bacterial count per unit area compared to the initial bacterial count, as observed in Figure S13 in the Supporting Information.
Phenotype differences by spatial locations, displaying the individual form in the crypt and clustering form in the upper region of the villus, can be attributed to spatially varying shear stress within the 3D crypt‐villus axis (Figure S12, Supporting Information). Gradually increasing shear stress from the base to the top can promote cluster phenotypes that increase the adhesive force to the µGut surface through collective group behavior under a mechanical environment, minimizing the risk of mechanical flushing and resistance.[ 4 , 34 ] Furthermore, the enhanced hydrostatic pressure caused by cell channel expansion (≈4.5 times) (Figure 3i) may further contribute to bacterial clusters and aggregations, explaining the abundant bacterial cluster formation under the expansion mode compared to the shear mode. These findings suggest that nonmotile bacteria adopt niche‐specialized phenotypes under biomechanically active environments for survival.
Taken together, the lack of motility mechanisms hampers the ability of nonmotile bacteria to exploit the 3D spatial resource, resulting in bacterial proliferation at the initial attached sites; the base and top of the villi (Figure 3j). While flows generated by shear mode are insufficient to facilitate bacterial movement, the strong velocity and dynamic flows generated by expansion efficiently disperse bacteria, enabling nonmotile bacteria to engage in 3D spatial exploration. Under the expansion mode, nonmotile LGG not only colonized onthe µGut surface but also expanded their spatial presence above the villus top by forming longer and denser clusters, despite mechanical stress in that spatial location (Figure S12c, Supporting Information). These observations suggest that nonmotile bacteria can sense and harness hydrodynamics‐induced flows in the surrounding environment and exploit them to increase their spatial presence. Furthermore, their inability to escape from spatial locations with high mechanical stress leads them to develop coping strategies, such as adopting clustering phenotypes to resist such stress through collective group behavior. The gut motility‐generated hydrodynamic forces induce varied levels of 3D spatial exploration behavior due to their interplay with inherent bacterial motility. Strong hydrodynamic forces and the resulting dynamic flow generated by the expansion mode promote efficient dispersal of nonmotile bacteria, contributing to 3D spatial exploration with enhanced growth.
2.5. Intermixed Spatial Organization in the Shear‐Induced Bacterial Community
Behavioral changes in one species may influence other species in ecological communities, such as gut microbiota. Alterations in spatial exploration behaviors of one species within the shared spatial resource can impact the spatial organization of the entire community. Although the underlying mechanisms remain unknown, intestinal motility is known to influence the composition of the gut microbiota.[ 3a–c ] We hypothesized that intestinal motility‐induced hydrodynamic forces and the resulting changes in spatial exploration behaviors might induce shifts in both composition and spatial organization of bacterial communities. To study this, a mixed‐motility bacterial community, comprising motile EcN and nonmotile LGG, was introduced into the tfGMoC system and subjected to both mechanical forces: shear mode and expansion mode. We examined the spatial organization, species abundance, and phenotypes of each species as influenced by mechanical forces. Additionally, based on species abundance and spatial structures, we analyzed the diversity and stability of the bacterial communities.
Under shear mode, a spatially intermixed community organization was established. Motile EcN predominantly colonized throughout the crypt‐villus axis, while nonmotile LGG primarily occupied the villus base (Figure 4a; Video S11, Supporting Information). Deep learning‐based quantification revealed that motile EcN exhibited a 3D spatial presence with a local gradient distribution, while nonmotile LGG displayed a base‐localized distribution, resembling the spatial patterns of each species in mono‐colonized conditions under shear mode (Figures 2, 4, and 3d). In this shear‐induced community, the spatial presence of these species overlapped, leading to competition for the shared spatial resource.[ 9 , 35 ] High EcN abundance and low LGG abundance indicated EcN dominance, resulting in an imbalanced community composition, with 78.1% motile bacteria and 21.9% nonmotile bacteria, indicating competition favoring motile bacteria (Figure 4c).
Figure 4.
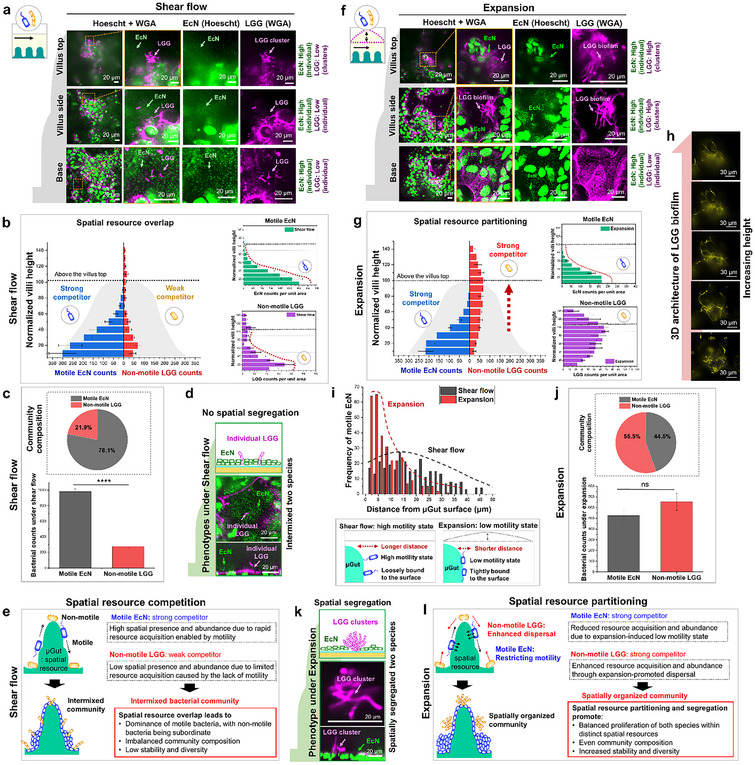
Impact of hydrodynamic forces on spatial organization of bacterial communities with mixed motility, influencing compositions, diversity, and stability. a) Confocal imaging of the shear‐promoted spatially intermixed community, displaying motile EcN predominantly colonizing throughout the crypt‐villus axis while nonmotile LGG occupies the villus base in the 3D µGut. b) Deep learning‐based quantification of motile EcN and nonmotile LGG in the shear‐induced community reveals an overlapping spatial distribution of both bacterial species in the lower region of the villus. Because the motility of EcN enables efficient 3D spatial exploration, motile EcN becomes a strong competitor and dominates the shared spatial resource (µGut). c) Quantified species abundances and the resulting composition of the shear‐induced bacterial community exhibit imbalanced community composition. n = 5, ****p < 0.0001. d) Individual forms of nonmotile LGG surrounded by abundant EcN fail to provide spatial segregation. e) Schematics illustrating the intermixed spatial organization of the shear‐induced bacterial community. Motile EcN acquires spatial resources more efficiently than nonmotile LGG due to motility difference, dominating resources and resulting in a community with low diversity and stability. f) Confocal imaging of the expansion‐promoted spatially organized community reveals motile EcN predominantly localized in the lower region of the villus and nonmotile LGG localized in the upper region of the villus in the 3D µGut. g) Quantification of motile and nonmotile bacteria in the expansion‐induced community displays partitioning of spatial resources, with each species occupying a distinct spatial niche in the 3D µGut. h) Dense cluster formation of nonmotile LGG emanating from the top of the villus promoted by expansion. i) The distance distribution of motile EcN from the µGut surface under both mechanical modes. Broader distribution under shear mode suggests loosely bound bacteria with a high motility state, while a narrower distribution under expansion suggests tight bacterial adhesion inducing a low motility state. j) Quantified species abundance and the resulting composition of the expansion‐induced bacterial community, highlighting balanced composition. n = 5, ns > 0.05. k) The cluster phenotype adopted by nonmotile LGG under expansion force provides spatial segregation from motile EcN, contributing an additional strategy for the spatial organization of the bacterial community. l) Schematics illustrating the spatial organization of the expansion‐induced bacterial community. While expansion restricts rapid spatial resource acquisition of motile EcN by limiting its motility state, the same force enables resource acquisition of nonmotile LGG through dispersal, resulting in a diverse and stable community with a balanced composition.
Phenotypically, motile EcN consistently displayed the individual form, while nonmotile LGG exhibited both individual (base) and cluster forms (top) in spatially distinct locations (Figure 4a,d; Video S11, Supporting Information). Under the same shear mode, nonmotile LGG in the community formed slightly more small clusters than in mono‐colonized conditions, suggesting a response to ecological competition in the presence of motile EcN[ 36 ] (Figure 4a). Nevertheless, the low population of nonmotile LGG in its individual form was surrounded by an abundant population of EcN in the µGut (Figure 4d). Although a few clusters provided spatial segregation, the lack of defined spatial structures (Figure 4b,d) indicated low community stability. The diversity of the shear‐induced bacterial community, calculated based on the abundance of each species, resulted in a Simpson's diversity index (DI)[ 37 ] of 0.34 and a Shannon diversity index[ 38 ] of 0.526, with a species evenness of 0.759.
In a bacterial community with limited resources shared by two species, competition is expected[ 8a ] (Figure 4e). Motile bacteria leverage active motility mechanisms and are strong competitors in 3D spatial resource competition, whereas nonmotile bacteria, being inefficient in spatial resource acquisition, are weak competitors. Under shear mode, the intermixed bacterial community maintains the intrinsic 3D spatial exploration behaviors of both motile and nonmotile bacteria (Figure 4e). Due to overlapping spatial resource utilization, competition between the two species intensifies, leading motile bacteria (strong competitors) to dominate spatial resources and exhibit high abundance. In contrast, nonmotile bacteria (weaker competitors), with limited resource acquisition ability, show low spatial presence and abundance, increasing the risk of competitive exclusion and extinction.[ 8 , 11 , 35 ] Furthermore, the individual form of the nonmotile bacterial phenotype likely fails to provide spatial segregation from the strong competitor, accelerating the exclusion of nonmotile species. This shift in species dynamics further impacts the community, leading to an imbalance in composition and reduced diversity. Additionally, the lack of defined spatial organization and low spatial segregation, combined with increased competition, suggests that the shear‐induced bacterial community is unstable.[ 10 , 11 ]
2.6. Expansion Fosters the Spatially Organized Bacterial Community, Leading to a Balanced Composition with Increased Stability and Diversity
In expansion mode, a spatially segregated bacterial community organization was observed, with each species establishing its own spatial niche. Motile EcN exhibited a 3D spatial presence with a gradient distribution, predominantly localizing at the villus base and side. In contrast, nonmotile LGG displayed a relatively even distribution along the crypt‐villus axis, with greater localization on the villus side and top, and reduced presence at the villus base (Figure 4f; Video S12, Supporting Information). Compared to the shear‐induced community, the expansion‐promoted bacterial community exhibited distinct 3D spatial resource partitioning, with each species occupying spatially separate regions of the crypt‐villus axis (Figure 4g). Motile EcN was primarily distributed in the lower region, while nonmotile LGG localized in the upper region of the villus, although some spatial overlap occurred along the villus sides.
Furthermore, expansion promoted the spatial presence of nonmotile LGG above the villus top by forming denser and longer clusters emanating from the villus top (Figure 4h), contributing to a more defined spatial organization in which two species were spatially partitioned, securing their respective spatial niche. The reduced presence at the villus base, combined with a significant shift towards the upper region, suggests that nonmotile LGG avoids highly competitive areas (villus base), where strong competitors dominate, and instead explores a less contested spatial niche (villus sides and top) through expansion‐promoted dispersal (Figure 4g; Figure S12, Supporting Information).
Expansion also influenced the spatial distribution of motile EcN within the community. Under the expansion mode, EcN exhibited a narrower distance distribution from the µGut surface, positioning the bacteria closer to the µGut, in contrast to the broader distribution observed under shear flow, where loosely attached bacteria were more prevalent (Figure 4i). This pattern was not observed in mono‐colonized EcN exposed to the same expansion force (Figure S14, Supporting Information), suggesting that within a community, EcN must tightly attach to the µGut surface to resist mechanical flushing. This immobilization state can restrict the spatial exploration of motile species. Loosely attached bacteria in a high motility state can move freely to explore their environment, whereas tightly attached bacteria, immobilized on the surface and exhibiting a low motility state,[ 39 ] become spatially constrained. Expansion appears to induce a transition in motile bacteria from a high motility state to a low motility state, reducing the efficiency of spatial resource acquisition and ultimately leading to reduced bacterial growth (Figure 4i,c,j).
Under expansion, a relatively similar abundance of motile EcN and nonmotile LGG was observed (Figure 4j). Compared to the shear‐induced community, EcN abundance was reduced, while LGG abundance became comparable (Figure 4c,j). These results suggest that hydrodynamic forces generated by expansion negatively regulate the motility of motile bacteria while promoting the dispersal of nonmotile bacteria, thereby enabling both species to access 3D spatial resources and ultimately achieve more balanced growth. This dual modulation of bacterial motility, combined with spatial organization and resource partitioning, results in a more balanced community composition, with 44.5% motile bacteria and 55.5% nonmotile bacteria in the expansion‐induced community (Figure 4j).
Furthermore, the enhanced cluster formation of nonmotile bacteria observed under expansion contributes to maintaining LGG abundance under mechanical stress as well as providing a strategy for spatial segregation from strong competitors (Figure 4k). Structured and filamentous clusters of nonmotile LGG were found in the community rather than in individual forms of bacteria under expansion mode, indicating that ecological cues (competition) together with mechanical cues (expansion) (Figure 3h,i) induce enhanced formation of clusters. These clusters or aggregated biofilms not only offer spatial segregation from competitor encroachment[ 10b ] but also enhance resource capture and resistance, serving as an effective survival strategy in a community subjected to both competitive interactions and mechanical stress.[ 10 , 40 ]
Together with spatial partitioning (Figure 4g) and segregation through resistant phenotypes (Figure 4k), the community becomes spatially compartmentalized, with effectively partitioned resources. This well‐defined spatial structure established under expansion is likely to confer higher community stability.[ 11 ] Moreover, in a spatially organized community, interspecies competition is reduced, as each species secures its own spatial resources for growth, allowing weaker competitors to coexist alongside strong ones without facing extinction.[ 9 , 12 ] As a result, biodiversity within the expansion‐promoted community is enhanced, as reflected in a calculated Simpson's diversity index of 0.5 and Shannon's diversity index of 0.689, yielding a species evenness of 0.994. These metrics highlight that the expansion‐promoted bacterial community exhibits higher diversity and greater species evenness compared to the shear‐induced community.
Under expansion mode, hydrodynamic forces simultaneously promote the dispersal of nonmotile bacteria and restrict the motility of motile bacteria (Figure 4l). This dual effect alters the spatial exploration behaviors of both species, enhancing the spatial dispersal of nonmotile bacteria while limiting that of motile bacteria. As a result, both species exhibit altered spatial mobility under expansion, enabling effective spatial partitioning and segregation of the µGut as a resource. This spatial organization reduces interspecies competition by securing distinct spatial niches for each species.[ 12 ] The spatial structuring of the community, along with altered spatial resource acquisition dynamics, fosters comparable species abundances, contributing to a more balanced community composition and supporting coexistence.[ 9b ] Additionally, the formation of structured clusters by nonmotile bacteria under expansion mode further reinforces spatial segregation, providing protection for weaker competitors from strong ones. This enhances overall community resilience and stability. Collectively, these expansion‐induced behavioral changes and the resulting spatial organization lead to a community with a more balanced composition, increased diversity, and enhanced ecological stability.[ 8 , 11 , 12 ]
3. Discussion
In this study, we developed a tunable flow Gut Microbiome‐on‐a‐Chip (tfGMoC) and provided a novel insights into gut microbial community behaviors under the influence of intestinal motility. The tfGMoC was designed to mimic the dynamic environment of the gut, incorporating compression and expansion movements of the intestinal wall alongside a 3D biomimetic gut epithelium. The peristaltic hydrodynamics supported the creation of a stratified gut epithelium with increased mucin secretion compared to static or shear flow conditions. Furthermore, this physiologically relevant setup allowed us to host and observe gut microorganisms. By integrating high‐magnification microscopy and deep‐learning‐based bacterial analysis, we were able to explore the effects of mechanical forces on gut microbial dynamics.
The tfGMoC facilitated a comprehensive investigation into how gut motility‐driven hydrodynamics forces shape the behavior of gut microorganisms. We uncovered intricate interactions between these forces and microbial motility, which led to distinct spatial exploration patterns. At the community level, hydrodynamic forces conferred competitive advantages to nonmotile species, enabling spatial resource partitioning and niche specialization. This, in turn, promoted the formation of a diverse, stable, and coexisting microbial community with an organized structure. Our findings surpasses conventional 2D models of microbial ecology, providing unprecedented insights into the spatial organization of gut microbiota.
Beyond showcasing the technical advances of the tfGMoC platform, our work also offers valuable insights into the mechanical forces that shape gut microbiota. The tfGMoC's ability to recreate a biomechanically active and physiologically relevant gut environment opens new avenues for addressing biomedical questions that were previously difficult to explore in conventional settings. Although other gut‐on‐a‐chip systems have showcased the ability to integrate gut microbiota,[ 41 ] we have highlighted the ability to monitor microbial community organization and behaviors under various conditions. The ability to investigate and discriminate bacterial species could significantly advance our understanding of disease pathogenesis, the impact of environmental and host factors, and the development of community‐scale therapeutic interventions.
While our primary emphasis is on the observable mechanical impact on gut bacterial behavior, mechanical cues may also trigger feedback mechanisms[ 4b ] that influence the functional and metabolic dynamics of the gut microbial community. Future research into the effect of various environmental and host factors on these interactions could deepen our understanding of the complex dynamics of gut microbial communities, paving the way for novel therapeutic approaches.
4. Conclusion
In summary, our novel tfGMoC serves as an ecological platform to explore diverse aspects of gut microorganisms and their community dynamics in a physiologically relevant environment. Our study highlights that hydrodynamics mimicking gut motility induce distinct spatial exploration behaviors in gut bacteria, significantly influencing the formation of a diverse and stable gut bacterial community. Additionally, the ability to control cyclic peristaltic flow dynamics allows us to recreate gut motility disorders, enabling a deeper understanding of their impact on gut epithelial functions and the microbial community. The model may thus prove useful for studying disease progression and developing therapeutic applications.
5. Experimental Section
Fabrication of the tfGMoC
The tfGMoC, which consists of two layers (top and bottom), was fabricated by PDMS soft lithography. This was based on SU‐8 photoresist‐based Si molds, which were created by photolithography. Briefly, a positive relief of both the top and bottom layers was fabricated using SU‐8‐based photolithography on a silicon (Si) wafer. Before casting PDMS, each Si mold underwent salinization with trichloro(1H,1H,2H,2H‐perfluorooctyl) silane (Sigma Aldrich). The top PDMS layer was fabricated by mixing the elastomer and curing agent in a 10:1 weight ratio. The mixture was poured over the SU‐8 mold and then thermally cured at 70 °C for 2 h. For the bottom PDMS layer, the degassed PDMS mixture (weight ratio of elastomer:curing agent = 15:1) was applied to the Si mold using spin‐coating (Laurell Technologies Corporation) at 500 rpm for 10 s. This was followed by curing PDMS at 70 °C for 1.5–2 h. The surface of the top PDMS layer was cleaned with IPA by sonication in an ultrasonic bath (Sono Swiss) for 15 min, followed by removing excess IPA with a nitrogen gun and drying in the 70 °C oven for 1–2 h. The bottom PDMS layer was initially bonded to a glass coverslip through oxygen plasma treatment (Tergeo, Pie Scientific LLC), then baked in a 70 °C oven for 1 h. Onto the glass bonded bottom PDMS layer, the top PDMS layer was bonded by oxygen plasma treatment (Tergeo, Pie Scientific LLC) and the assembled chip was placed in a 70 °C oven overnight to strengthen bonding.
Establishment of the 3D µGut Culture within the tfGMoC
Caco‐2 cells between passages 63 and 70 were maintained in EMEM (Lonza), supplemented with 20% FBS (Lonza) and 1% penicillin/streptomycin mix (Lonza), and were used in the experiment. Before seeding the cells, the tfGMoC was sterilized under UV light for 30 min. Subsequently, collagen (rat tail Type I collagen (Ibidi GmbH) was added to the ECM channel. After 30 min thermal collagen gelation at 37 °C, the culture channel was coated with 50 µg mL−1 of rat tail Type I collagen (Ibidi GmbH) for 1.5 h. After washing the channel with serum‐free media, Caco‐2 cells (8 × 10⁶ cells mL−1) were seeded onto the coated culture channel and incubated overnight to promote attachment. While the culture chamber of the chip was under constant media perfusion at 45 µL h−1 (shear stress ≈ 0.034 dyne cm−2) continuously for 6–7 days (Chemyx pumps, USA), the air chamber was connected to the syringe containing air and continuous infusion and withdrawal cycles were applied using a syringe pump to simulate cyclic compressions and expansions (Chemyx pumps, USA) (Figure S3, Supporting Information).
Calibration of Cell Channel Deflection
To understand the relationship between the volume of air pumped or withdrawn to the percentage of cell channel deflection, fluorescein isothiocyanate (FITC, Sigma Aldrich) was loaded into abiotic (without Caco‐2 cells) tfGMoC. A 5 mL syringe (Terumo) mounted on a syringe pump was used as the actuator to pump air into and withdraw from the air chamber. The air was progressively pumped at steps of 100 µL and fluorescence images were acquired using an inverted microscope (Nikon Eclipses Ti; Nikon). Line distribution of FITC intensity was measured across the width of the cell channel to understand the extent of deflection using Fiji (Figure S2, Supporting Information). The calibration was tested on at least 3 chips and continuously for at least 3 d to observe any deviations in performance. This method of cell channel deflection was found to be reproducible.
Bacteria Culture
E. coli Nissle 1917 (EcN) was a kind gift from an Associate Professor. Gan Yunn Hwen from the Department of Biochemistry at the National University of Singapore. Lactobacillus rhamnosus strain GG (LGG) (ATCC 53 103) was purchased from ATCC and cultured by the ATCC culture guide.
Establishment of µGut Coculture with Individual Bacterial Species and Community
From Day 5 of the µGut culture, which was grown under shear and cyclic expansion, the culture media were replaced with the antibiotic‐free media (EMEM with 20% FBS) for bacterial introduction. Each bacterial species was cultured in the media recommended by ATCC. The density‐optimized bacterial cells (EcN: 1–2×10⁷ cfu mL−1 and LGG: 1–2×10⁸ cfu mL−1) were then resuspended in the antibiotic‐free culture media and introduced into the disconnected culture chamber. After 3–5 h incubation without flow and then washing, the microchannels were reconnected to the pump, and media perfusion and cyclic expansion were applied. For bacterial community coculture with µGut, the density‐adjusted LGG was first introduced into the disconnected microchannel and allowed to incubate for 4–5 h without flow. The microchannels were then washed with antibiotic‐free media and the density‐adjusted EcN was subsequently introduced, followed by a 2–3 h incubation period. After the sequential introduction of each bacterial species, the washed microchannel was reconnected and subjected to the perfused system with cyclic expansion for 24 h.
Immunofluorescence Staining of the µGut
To conduct immunofluorescence staining on the microfluidic µGut culture, it was first fixed with 4% PFA (Pierce) for 10 min and then permeabilized with 0.2% Triton‐X100 (Sigma‐Aldrich) for 15 min. After blocking the µGut with 1% BSA (Sigma‐Aldrich) for 2 h, it was incubated with a primary antibody overnight at 4 °C. This was followed by washing and further incubation with a secondary antibody at room temperature (r.t.) for 1 h in the dark. Primary antibodies for gut markers were purchased from various suppliers: Anti‐ZO‐1 (Invitrogen, 61–7300), and Anti‐Villin1[R814] (Cell Signaling Technology, 2369). The secondary antibody, Goat Anti‐Rabbit IgG H&L (Alexa Fluor 488) was purchased from Abcam (Abcam, ab150077). For staining the µGut's nucleus and actin filaments, Hoescht 33 342 (Thermo Fisher Scientific, 62249) and Phalloidin‐iFluor 647 (Abcam, ab176759) were used.
Fluorescent Gram Staining of Bacterial Species Colonizing the µGut
The bacteria colonizing the µGut were stained using a modified method from the recommended protocol of the live bacterial gram staining kit (Biotium, 32 000). Briefly, the disconnected µGut‐bacteria coculture within the microchannel was washed with the BSA‐NaCl buffer (0.25% BSA, 0.15 m NaCl in PBS). It was then incubated with the CF594 wheat germ agglutinin (WGA) dye for 10 min. Afterward, the co‐culture was washed twice with the BSA‐NaCl buffer and subsequently stained with Hoescht 33 342 (Thermo Fisher Scientific, 62 249) for an additional 5 min, followed by being fixed with 4% PFA.
Morphological Analysis of µGut
Bright‐field images of the µGut were captured using an inverted phase‐contrast microscope (Nikon Eclipses Ti; Nikon) equipped with an Evolve camera. The µGut, both with and without bacterial species, was visualized using a spinning disk confocal microscopy comprising an inverted microscope (Ti‐E, Nikon), a spinning disk scan head (CSU‐W1; Yokogawa), an sCMOS camera (Prime95B; Teledyne Photometrics) and a laser system (iLaunch; GATACA Systems). Images of the µGut samples were captured using CFI plan Apo objective, with laser excitation at 404/561/642 nm, and were scanned in Z‐series at step size 1 µm. The acquired images were then processed using MetaMorph (Molecular Devices), IMARIS (Bitplane Scientific software), and Image J software.
Mucin Detection and Quantification of µGut
Mucin produced by the µGut was visualized and assessed using the Alcian blue staining method.[ 42 ] In brief, the fixed µGut culture (4% PFA w/v) was incubated with 1x diluted Alcian blue 8GX solution in 3% acetic acid (pH 2.5) (Sigma‐Aldrich, 66 011) for 16 h under continuous flow at 30 µL h−1, followed by PBS washing. The stained µGut culture was imaged using an inverted microscope (Olympus IX73) mounted with an EMCCD camera (Andor iXon X3). The amount of mucin secreted by the µGut under various mechanical conditions was quantified by measuring the light absorbance of the stained layer, using a blank chip without cells for normalization.
Computational Fluid Dynamics Simulation and Beads Tracking
The geometric model of the tfGMoC comprises a fluid domain with a deformable upper wall. The wall delineates the interface between the gut microchannel and the actuating air chamber. Simulations for the fluid domain were executed using the Fluent application in the ANSYS Workbench software (version 2023 R2, ANSYS Inc., Canonsburg, PA, USA). The fluid mesh was generated in ANSYS Workbench Mesh, and the mesh independent test led to a final mesh comprising 291 067 elements. The fluid material, representing the culture media, was modeled to have properties similar to water, with a density of 1000 kg m−3 and Newtonian viscosity of 0.001 Pa s. Given the low Reynold number (<1) of media flow, a laminar model was selected, excluding the body force term. The governing equations of mass and momentum are as follows
| (1) |
| (2) |
where u and p represent the velocity vector and pressure, respectively. The equation was solved using a Coupled solver with a second‐order discretization scheme. To simulate the cell channel deflection, a rectangular mesh of 60 000 elements was created on top of the cell channel. The cell channel roof was modeled as a linear elastic material, with density, Young's modulus, and Poisson's ratio of 1.05 g cm−3, 1.5 MPa, and 0.49, respectively. The governing equation for the solid domain is the Cauchy equation
| (3) |
Where u s is the velocity vector, σ s is the stress tensor and b s is body force. ANSYS system coupling application was used for the fluid‐structure interaction (FSI) simulation. A time‐dependent implicit scheme was employed since the wall deflection rendered the flow profile inherently unsteady. A constant inlet flow rate of 45 µL h−1 was chosen to replicate the flow rate conditions of the experimental setup. The cyclic deformation of the upper wall had a period T = 10 s, with both up‐deflection and down‐deflection lasting 4 s each, and a stabilization phase between them lasting 1 s. The simulation ran for three cycles with a time step of 0.1 s, and data were collected from the final deformation cycle.
For the beads tracking experiments, 1 µm fluorescent beads (Fluospheres, Invitrogen) were pumped through the chip under different conditions: shear flow, expansion mode, and compression mode. High‐speed images were captured using a Photron FastCam and the images were processed using ImageJ.
Quantification of Bacteria Colonizing the µGut using a Deep Learning Algorithm
Images for bacteria quantification were captured using fluorescence confocal microscopy. To create the dataset for supervised learning, the contour of individual bacterial cells or biofilms was outlined using Label Studio, an open‐source tool. All images were pre‐processed to achieve zero mean and unit standard deviation. For Hoescht‐positive EcN, each training image had dimensions of a 32 × 32 × 1 size. This compact size was ideal for capturing 5–6 EcN nuclei without including Caco‐2 nuclei from the µGut, thereby minimizing the chance of misclassification. Given the spherical appearance of EcN under the microscope, the Stardist2D[ 43 ] algorithm with default parameters was utilized for segmentation and quantification. The LGG chains and biofilm exhibited irregular geometries, including both straightened and folded chain‐like structures, thus a different U‐net architecture was employed for LGG segmentation. The training set consisted of 256×256×3 tiles because the structures could span to larger area than Caco‐2 cells in the µGut. The need to capture three channels arose from the observation that WGA stained both mucin layers adjacent to villi and microvilli as well as the peptidoglycan of gram‐positive LGG. Including the Hoescht signal from the Caco‐2 nucleus could help minimize false positive results. After each convolution layer and before the dropout layer in the U‐net network, batch normalization was implemented to accelerate convergence and improve generalization. The loss function for our neural network combines binary focal loss and Dice loss. The binary focal loss addressed pixel‐by‐pixel classification to address the high number of background pixels, while the Dice loss correlated with the intersection of predicted and ground truth data. The formulae for the loss functions are
| (4) |
| (5) |
| (6) |
In the formulae, the loss was calculated for N data points per batch during the training process; pi is the estimate of the probability for the positive (LGG) class, and gi represents the ground truth label. The values for focusing parameter γ in the focal loss formula and the numerical stabilizer ε were 2 and 10−7, respectively. The performance of the models was validated using IOU and Dice metrics (Figure S9, Supporting Information). All simulations and neural network models ran on an Intel Core i7‐13700 CPU, equipped with NVIDIA GeForce RTX A5000 GPU and 64 GB of RAM.
Diversity Calculations
The Simpson's diversity index and the Shannon diversity index were calculated by previously published methods.[ 37 , 38 ]
Statistical Analysis
All data were generated from a minimum of three repeated chips (n = 3). Unless otherwise noted, numerical data were presented as mean ± standard deviation (SD). The statistical significance between the two groups was determined using Student's t‐test with P < 0.05 indicating a significant difference.
Conflict of Interest
The authors declare no conflict of interest.
Supporting information
Supporting Information
Supplemental Video 1
Supplemental Video 2
Supplemental Video 3
Supplemental Video 4
Supplemental Video 5
Supplemental Video 6
Supplemental Video 7
Supplemental Video 8
Supplemental Video 9
Supplemental Video 10
Supplemental Video 11
Supplemental Video 12
Acknowledgements
J.L., and N.M. contributed equally to this work. This work was financially supported by the Institute for Health Innovation and Technology Seed Grant (R‐722‐003‐750), the Start‐up Grant (A‐8001‐301‐00‐00) from the National University of Singapore (NUS), and the Mechanobiology Institute Mid‐sized Grant (A‐8001978‐04‐00) funded by the National Research Foundation, Singapore. The authors express their appreciation to Assoc. Prof. Gigi N.C. Chiu for generously providing the Caco‐2 cell line and to Assoc. Prof. Yunn Hwen Gan for supplying E. coli Nissle 1917. The gratitude extends to Baopu Zhang from Tsinghua University for his valuable assistance with the flow simulation, and to Assoc. Prof. Shaofei Shen from Shanxi Agricultural University for engaging in insightful discussions. Furthermore, the authors acknowledge and appreciate the support provided by the Nano and Microfabrication Core, Microscopy Core, and Wet Lab Core at Mechanobiology Institute, NUS.
Lee J., Menon N. V., Truong H. D., Lim C. T., Dynamics of Spatial Organization of Bacterial Communities in a Tunable Flow Gut Microbiome‐on‐a‐Chip. Small 2025, 21, 2410258. 10.1002/smll.202410258
Contributor Information
Jeeyeon Lee, Email: ihtljy@nus.edu.sg.
Chwee Teck Lim, Email: ctlim@nus.edu.sg.
Data Availability Statement
The data that support the findings of this study are available in the supplementary material of this article.
References
- 1.a) Bayliss W. M., Starling E. H., J. Physiol. 1899, 24, 99; [DOI] [PMC free article] [PubMed] [Google Scholar]; b) Gregersen H., Biomechanics of the Gastrointestinal Tract: New Perspectives in Motility Research and Diagnostics, Springer, London: 2003. [Google Scholar]
- 2. Consortium H. M. P., Nature 2012, 486, 207.22699609 [Google Scholar]
- 3.a) Kashyap P. C., Marcobal A., Ursell L. K., Larauche M., Duboc H., Earle K. A., Sonnenburg E. D., Ferreyra J. A., Higginbottom S. K., Million M., Tache Y., Pasricha P. J., Knight R., Farrugia G., Sonnenburg J. L., Gastroenterology 2013, 144, 967; [DOI] [PMC free article] [PubMed] [Google Scholar]; b) Touw K., Ringus D. L., Hubert N., Wang Y., Leone V. A., Nadimpalli A., Theriault B. R., Huang Y. E., Tune J. D., Herring P. B., Farrugia G., Kashyap P. C., Antonopoulos D. A., Chang E. B., Physiol. Rep. 2017, 5, 13182; [DOI] [PMC free article] [PubMed] [Google Scholar]; c) Murakami T., Kamada K., Mizushima K., Higashimura Y., Katada K., Uchiyama K., Handa O., Takagi T., Naito Y., Itoh Y., Digestion 2017, 95, 55; [DOI] [PubMed] [Google Scholar]; d) Kim H. J., Li H., Collins J. J., Ingber D. E., Proc. Natl. Acad. Sci. USA 2016, 113, E7. [DOI] [PMC free article] [PubMed] [Google Scholar]
- 4.a) Persat A., Nadell C. D., Kim M. K., Ingremeau F., Siryaporn A., Drescher K., Wingreen N. S., Bassler B. L., Gitai Z., Stone H. A., Cell 2015, 161, 988; [DOI] [PMC free article] [PubMed] [Google Scholar]; b) Dufrêne Y. F., Persat A., Nat. Rev. Microbiol. 2020, 18, 227; [DOI] [PubMed] [Google Scholar]; c) Rusconi R., Garren M., Stocker R., Annu. Rev. Biophys. 2014, 43, 65; [DOI] [PMC free article] [PubMed] [Google Scholar]; d) Cremer J., Segota I., Yang C. Y., Arnoldini M., Sauls J. T., Zhang Z., Gutierrez E., Groisman A., Hwa T., Proc. Natl. Acad. Sci. USA 2016, 113, 11414. [DOI] [PMC free article] [PubMed] [Google Scholar]
- 5.a) Wadhwa N., Berg H. C., Nat. Rev. Microbiol. 2021, 20, 161; [DOI] [PubMed] [Google Scholar]; b) Harshey R. M., Annu. Rev. Microbiol. 2003, 57, 249. [DOI] [PubMed] [Google Scholar]
- 6. Tilman D., Kareiva P., Spatial Ecology: The Role of Space in Population Dynamics and Interspecific Interactions (MPB‐30), Princeton University Press, Princeton, NJ, 1997. [Google Scholar]
- 7. Gilbert J. A., Lynch S. V., Nat. Med. 2019, 25, 884. [DOI] [PMC free article] [PubMed] [Google Scholar]
- 8.a) Hibbing M. E., Fuqua C., Parsek M. R., Peterson S. B., Nat. Rev. Microbiol. 2009, 8, 15; [DOI] [PMC free article] [PubMed] [Google Scholar]; b) Coyte K. Z., Schluter J., Foster K. R., Science 2015, 350, 663. [DOI] [PubMed] [Google Scholar]
- 9.a) Schoener T. W., Science 1974, 185, 27;17779277 [Google Scholar]; b) Chesson P., Annu. Rev. Ecol. Evol. Syst. 2000, 31, 343; [Google Scholar]; c) Ghoul M., Mitri S., Trends Microbiol. 2016, 24, 833. [DOI] [PubMed] [Google Scholar]
- 10.a) Wu F., Ha Y., Weiss A., Wang M., Letourneau J., Wang S., Luo N., Huang S., Lee C. T., David L. A., You L., Nat. Chem. Biol. 2022, 18, 394; [DOI] [PMC free article] [PubMed] [Google Scholar]; b) Nadell C. D., Drescher K., Foster K. R., Nat. Rev. Microbiol. 2016, 14, 589. [DOI] [PubMed] [Google Scholar]
- 11. Kim H. J., Boedicker J. Q., Choi J. W., Ismagilov R. F., Proc. Natl. Acad. Sci. USA 2008, 105, 18188. [DOI] [PMC free article] [PubMed] [Google Scholar]
- 12. Levine J. M., HilleRisLambers J., Nature 2009, 461, 254. [DOI] [PubMed] [Google Scholar]
- 13. Lozupone C. A., Stombaugh J. I., Gordon J. I., Jansson J. K., Knight R., Nature 2012, 489, 220. [DOI] [PMC free article] [PubMed] [Google Scholar]
- 14. Gude S., Pince E., Taute K. M., Seinen A. B., Shimizu T. S., Tans S. J., Nature 2020, 578, 588. [DOI] [PubMed] [Google Scholar]
- 15. Cheng L., Liu T., Liu Q., Lian L., Tang G., Mille L. S., García F. R., Engstrand L., Zhang Y. S., Du J., Research 2023, 6, 0058. [DOI] [PMC free article] [PubMed] [Google Scholar]
- 16.a) Gore J., Wiles T. J., Jemielita M., Baker R. P., Schlomann B. H., Logan S. L., Ganz J., Melancon E., Eisen J. S., Guillemin K., Parthasarathy R., PLoS Biol. 2016, 14, 1002517; [DOI] [PMC free article] [PubMed] [Google Scholar]; b) Logan S. L., Thomas J., Yan J., Baker R. P., Shields D. S., Xavier J. B., Hammer B. K., Parthasarathy R., Proc. Natl. Acad. Sci. USA 2018, 115, E3779. [DOI] [PMC free article] [PubMed] [Google Scholar]
- 17.a) Li X., Zhu H., Gu B., Yao C., Gu Y., Xu W., Zhang J., He J., Liu X., Li D., Adv. Mater. 2024, 36, 2305268; [DOI] [PubMed] [Google Scholar]; b) Kim R., Sung J. H., Adv. Healthcare Mater. 2024, 13, 2302777; [Google Scholar]; c) Ashammakhi N., Nasiri R., Barros N. R., Tebon P., Thakor J., Goudie M., Shamloo A., Martin M. G., Khademhosseini A., Biomaterials 2020, 255, 120196; [DOI] [PMC free article] [PubMed] [Google Scholar]; d) Cameron O., Neves J. F., Gentleman E., Adv. Sci. 2023, 11, 2302165. [DOI] [PMC free article] [PubMed] [Google Scholar]
- 18.a) Grassart A., Malarde V., Gobaa S., Sartori‐Rupp A., Kerns J., Karalis K., Marteyn B., Sansonetti P., Sauvonnet N., Cell Host Microbe 2019, 26, 435 ; [DOI] [PubMed] [Google Scholar]; b) McCoy R., Oldroyd S., Yang W., Wang K., Hoven D., Bulmer D., Zilbauer M., Owens R. M., Adv. Sci. 2023, 11, 2306727. [DOI] [PMC free article] [PubMed] [Google Scholar]
- 19. Lee J., Menon N., Lim C. T., Adv. Sci. 2024, 11, 2302113. [DOI] [PMC free article] [PubMed] [Google Scholar]
- 20. Unger M. A., Chou H. P., Thorsen T., Scherer A., Quake S. R., Science 2000, 288, 113. [DOI] [PubMed] [Google Scholar]
- 21. Witjas F. M. R., van den Berg B. M., van den Berg C. W., Engelse M. A., Rabelink T. J., Stem Cells Transl. Med. 2019, 8, 375. [DOI] [PMC free article] [PubMed] [Google Scholar]
- 22.a) Lentle R. G., Janssen P. W., J. Comp. Physiol., B 2008, 178, 673; [DOI] [PubMed] [Google Scholar]; b) Ishikawa T., Sato T., Mohit G., Imai Y., Yamaguchi T., J. Theor. Biol. 2011, 279, 63. [DOI] [PubMed] [Google Scholar]
- 23. Traber P. G., Yu L., Wu G. D., Judge T. A., Am. J. Physiol. 1992, 262, G123. [DOI] [PubMed] [Google Scholar]
- 24. Toribara N. W., Gum J. R., Culhane P. J., Lagace R. E., Hicks J. W., Petersen G. M., Kim Y. S., J. Clin. Investig. 1991, 88, 1005. [DOI] [PMC free article] [PubMed] [Google Scholar]
- 25. O'Connor D. T., Burton D., Deftos L. J., Life Sci. 1983, 33, 1657. [DOI] [PubMed] [Google Scholar]
- 26. Porter E. M., Bevins C. L., Ghosh D., Ganz T., Cell. Mol. Life Sci. 2002, 59, 156. [DOI] [PMC free article] [PubMed] [Google Scholar]
- 27. Bastide P., Darido C., Pannequin J., Kist R., Robine S., Marty‐Double C., Bibeau F., Scherer G., Joubert D., Hollande F., Blache P., Jay P., J. Cell. Biol. 2007, 178, 635. [DOI] [PMC free article] [PubMed] [Google Scholar]
- 28. Basak O., van de Born M., Korving J., Beumer J., van der Elst S., van Es J. H., Clevers H., EMBO J. 2014, 33, 2057. [DOI] [PMC free article] [PubMed] [Google Scholar]
- 29. Kim H. J., Huh D., Hamilton G., Ingber D. E., Lab Chip 2012, 12, 2165. [DOI] [PubMed] [Google Scholar]
- 30. Cousin F. J., Lynch S. M., Harris H. M. B., McCann A., Lynch D. B., Neville B. A., Irisawa T., Okada S., Endo A., O'Toole P. W., Elkins C. A., Appl. Environ. Microbiol. 2015, 81, 1297. [DOI] [PMC free article] [PubMed] [Google Scholar]
- 31. Goldstein E. J., Tyrrell K. L., Citron D. M., Clin. Infect. Dis. 2015, 60, S98.25922408 [Google Scholar]
- 32. Rusconi R., Lecuyer S., Guglielmini L., Stone H. A., J. R. Soc. Interface 2010, 7, 1293. [DOI] [PMC free article] [PubMed] [Google Scholar]
- 33. Lebeer S., Verhoeven T. L., Velez M. P., Vanderleyden J., De Keersmaecker S. C., Appl. Environ. Microbiol. 2007, 73, 6768. [DOI] [PMC free article] [PubMed] [Google Scholar]
- 34.a) Weaver W. M., Milisavljevic V., Miller J. F., Di Carlo D., Appl. Environ. Microbiol. 2012, 78, 5890; [DOI] [PMC free article] [PubMed] [Google Scholar]; b) De La Fuente L., Montanes E., Meng Y., Li Y., Burr T. J., Hoch H. C., Wu M., Appl. Environ. Microbiol. 2007, 73, 2690. [DOI] [PMC free article] [PubMed] [Google Scholar]
- 35. Hardin G., Science 1960, 131, 1292. [DOI] [PubMed] [Google Scholar]
- 36. Cornforth D. M., Foster K. R., Nat. Rev. Microbiol. 2013, 11, 285. [DOI] [PubMed] [Google Scholar]
- 37. Simpson E. H., Nature 1949, 163, 688. [DOI] [PubMed] [Google Scholar]
- 38. Shannon C. E., Bell Labs Tech. 1948, 27, 379. [Google Scholar]
- 39.a) Vigeant M. A., Ford R. M., Wagner M., Tamm L. K., Appl. Environ. Microbiol. 2002, 68, 2794; [DOI] [PMC free article] [PubMed] [Google Scholar]; b) Petrova O. E., Sauer K., J. Bacteriol. 2012, 194, 2413. [DOI] [PMC free article] [PubMed] [Google Scholar]
- 40. Flemming H. C., Wingender J., Szewzyk U., Steinberg P., Rice S. A., Kjelleberg S., Nat. Rev. Microbiol. 2016, 14, 563. [DOI] [PubMed] [Google Scholar]
- 41. Jalili‐Firoozinezhad S., Gazzaniga F. S., Calamari E. L., Camacho D. M., Fadel C. W., Bein A., Swenor B., Nestor B., Cronce M. J., Tovaglieri A., Levy O., Gregory K. E., Breault D. T., Cabral J. M. S., Kasper D. L., Novak R., Ingber D. E., Nat. Biomed. Eng. 2019, 3, 520. [DOI] [PMC free article] [PubMed] [Google Scholar]
- 42. Matsuo K., Ota H., Akamatsu T., Sugiyama A., Katsuyama T., Gut 1997, 40, 782. [DOI] [PMC free article] [PubMed] [Google Scholar]
- 43. Schmidt U., Weigert M., Broaddus C., Myers G., In Lecture Notes in Computer Science, (Eds.: Frangi A. F.), Springer, Cham, Switzerland: 2018, Vol. 265, Ch. 30. [Google Scholar]
Associated Data
This section collects any data citations, data availability statements, or supplementary materials included in this article.
Supplementary Materials
Supporting Information
Supplemental Video 1
Supplemental Video 2
Supplemental Video 3
Supplemental Video 4
Supplemental Video 5
Supplemental Video 6
Supplemental Video 7
Supplemental Video 8
Supplemental Video 9
Supplemental Video 10
Supplemental Video 11
Supplemental Video 12
Data Availability Statement
The data that support the findings of this study are available in the supplementary material of this article.