

Abstract
Contrast agents are very persistent compounds that are detected in increasing concentrations in sewage and water. This study aimed to determine whether the presence of iodinated contrast agent – diatrizoate impacts microorganisms in activated sludge. During the 100-day experiment, an attempt was made to find the most sensitive microbial indicator that would inform about changes in the structure or activity of microbial communities as a result of exposure to diatrizoate. Biochemical and genetic factors were tested, and it was found that the most sensitive indicators were dehydrogenase activity and indexes related to the oxidation of specific substrates. On the last day of the experiment, the values of all analysed functional diversity indicators were worse when a higher concentration of diatrizoate was added. Dehydrogenase activity was half lower, the Gini coefficient was 0.15 higher and the Shannon and Richness indices were 0.31 and 6 lower, respectively, compared to the control. Simultaneously, an increased intensity of glycogen, α-cyclodextrin, α-ketobutyric and D-malic acid oxidation was revealed. In conclusion, the long-term exposition to diatrizoate, affects microbial metabolism and causes significant adverse changes in their functional diversity. This work demonstrates the importance of long-term studies of the impact of pharmaceuticals on microorganisms in aquatic ecosystems.
Supplementary Information
The online version contains supplementary material available at 10.1038/s41598-025-02321-3.
Keywords: Diatrizoate, Activated sludge, Functional capacity, Microbial activity, Gene expression, Environmental stress indicators
Subject terms: Applied microbiology, Microbial communities, Environmental microbiology, Industrial microbiology, Microbiology
Introduction
The problem of the presence of pharmaceuticals in water is currently the subject of wide discussion among ecologists, hydrobiologists, doctors, vets, ethicists, etc. Pharmaceuticals are emerging pollutants because of their widespread and continuous usage. It is known that some xenobiotics already in micro-concentrations have negative effects on aquatic organisms. At the same time, there are pharmaceuticals whose single dose administered to a patient is high, even in grams, and their consumption is increasing year after year. An example are iodine contrast media (ICMs), which global annual demand exceeds 3,500 tons1. The ageing population in many countries, the increasing incidence of chronic diseases and comorbidities, as well as the incidence of cancer are leading to an increase in the number of diagnostic imaging tests, especially with computed tomography and magnetic resonance. These techniques use ICMs - derivatives of 2,4,6-triiodinated benzoic acid with a very stable structure resulting from the covalent bonding of three iodine atoms to the aromatic ring, which reduces the risk of toxic effects of free iodide2. Contrast agents are excreted unchanged from the body within 24 h after the test, discharged into the sewage system, and then directed to a wastewater treatment plant. Conventional treatment methods do not eliminate ICMs from wastewater. The stability of the ICMs structure makes them practically non-biodegradable by biological methods, while applying physicochemical methods leads to products of unknown harm to aquatic organisms. Consequently, ICMs are released into the environment to reach the surface waters, and their further fate is unclear.
The measure of variability in microbial populations is their biodiversity. ICMs can affect the biodiversity of microorganisms, especially those found in activated sludge (AS) but this issue is not well described in the literature yet. The strategy for preserving the biodiversity of ecosystems is an important issue discussed not only at the level of European Union authorities3, but also globally4. Biodiversity is determined by various methods, both genetic (taxonomic/structural diversity) and biochemical (functional diversity). It is worth noting that sewage treatment plants are characterised by extremely diverse microbial communities, and the best way to assess their quality is to determine their functional diversity instead of taxonomic richness. This is due to the fact that the taxonomically distinct species may have the same ecological function. This phenomenon is described as functional redundancy5. It means that processes that are carried out by different taxonomically distinct microorganisms would not necessarily be impacted by structural diversity losses.
When establishing a strategy for the protection and monitoring of biodiversity, it is rather necessary to define indicators as a way to present and manage complex information in a simple and clear manner. For continuous monitoring, where analyses are performed relatively frequently, rather simple biochemical methods are suggested, which provide a quick response, are less time-consuming, and are definitely cheaper than advanced omics analyses. It has also been stated that these indicators should be significant, uniform, and measurable6. For example, community-level physiological profiling or fatty acid analysis are listed as simple indicators of microbial diversity7.
Attention should also be given to how risk assessments and determinations of xenobiotics’ impact on the ecosystem should be conducted. While this is necessary, the majority of toxicological risk assessments focus on acute toxicity and the determination of LD50/EC50 values. Although this approach is essential from a pharmacological and therapeutic perspective, it is less relevant from an ecotoxicological standpoint. In environmental contexts, most xenobiotics are detected at concentrations well below their LD50/EC50 values. Pharmaceuticals are designed to be active therapeutic or diagnostic agents, intended to be effective at minimal concentrations and/or stable enough to perform their intended function. This raises concerns about the potential impact of xenobiotics on non-target organisms. Unfortunately, current regulatory frameworks do not mandate the assessment of effects on organisms that might be exposed to pharmaceuticals in the environment. Nevertheless, the ecotoxicity of xenobiotics often increases with prolonged exposure, but this process is gradual, complicating reliable assessments of actual impact8,9. ICMs, in particular, present unique challenges due to their stability, allowing them to persist in the environment for extended periods. Although they do not bioaccumulate, their high solubility enables them to disperse through the trophic chain. Despite their resistance to biodegradation, they are vulnerable to physicochemical degradation. ICMs contain iodine, and physicochemical degradation can lead to the release of reactive intermediates with toxic iodine, posing additional environmental risks.
The presented study assesses the influence of diatrizoate (DTZ) on the structure and activity of activated sludge through different indices. DTZ (3,5-diacetamido-2,4,6-triiodobenzoic acid) is one of the most commonly used ICM, included in the World Health Organization’s Model List of Essential Medicines (WHO/MHP/HPS/EML/2023.02). Our study aimed to determine whether the commonly used contrast agent, although it is only slightly toxic to humans, does have a negative impact on microorganisms in sewage treatment plants. An attempt was also made to select the most sensitive indicator among biochemical (dehydrogenase activity, fatty acid analysis, different carbon sources utilisation) and genetic (the expression level of 16 S rRNA, P450, and C230 genes) factors of AS changes after 100-day exposure to DTZ. To the best of our current knowledge, this is the first report on the effect of ICMs on AS microorganisms, analysed in terms of changes in their metabolism.
Results and discussion
The influence of diatrizoate on the activated sludge physicochemical properties
In our experiment, the analyses were carried out in the AS contaminated with DTZ in the 0.2–20 mg/L concentration range. This was intended to reflect the concentrations of ICMs detected in various types of wastewater. Concentrations of tenths of mg/L were detected in municipal sewage10, while levels of mg/L were detected in hospital sewage11. A concentration of 20 mg/L was considered a concentration that may occur incidentally. It has been shown that after seven days of incubation in each cycle, the DTZ at a concentration of 2 mg/L was not detected in the AS and a significant depletion of DTZ introduced at a concentration of 20 mg/L was noted (Table S1). This loss may be mainly due to the binding of this compound to AS flocks and some biotransformation processes12.
At the beginning of the experiment and after seven days of incubation, a particular analysis of the physicochemical properties of sewage from control and DTZ contaminated (20 mg/L) AS was performed to compare how applied DTZ concentration changed tested parameters during 7-day intervals (Fig. 1B). The choice of analysis of sewage with the highest concentration of diatrizoate was dictated by the fact that changes in physicochemical parameters were the most significant in the most loaded sewage. The differences between the control and AS contaminated with 20 mg/L of DTZ were obtained for the following parameters: COD, BOD, TSS, TOC, total nitrogen, ammonium nitrogen, phosphates and sulfates (Table 1). The biodegradability index (BOD/COD ratio) values in control and sewage contaminated with 20 mg/L of DTZ on the first day were 0.36 and 0.68, respectively, which indicates that the sewage could be easily purified by biological treatment13, while the addition of the DTZ caused a 1.4-fold increase in the COD value and a 2.7-fold increase in the BOD value. Due to the very stable diatrizoate structure, it is practically non-biodegradable in AS; hence, it is not surprising that the COD and BOD values remain high. After seven days of incubation, the biodegradability index values in both cases were 0.28, which indicates that, regardless of the presence of DTZ, the level of treatment of control and contaminated sewage was similar. The TSS value after seven days was three times higher in sewage contaminated with the DTZ compared to the control. The explanation might be the dependence of high TSS values in the effluent related to excessive solids generation due to increased BOD loading.
Fig. 1.

Scheme of the experiment: experimental systems and conducted analyses (A), cycle of AS operation (B).
Table 1.
Physico-chemical characteristics of contaminated (20 mg/L DTZ) and not contaminated (control) sewage at the beginning of the experiment and before the exchange of synthetic wastewater on the 7th day.
| Parameter | Control | 20 mg/L DTZ | Method/source | ||
|---|---|---|---|---|---|
| 1st day | 7th day | 1st day | 7th day | ||
| pH | 6.4 ± 0.2 | 6.7 ± 0.2 | 6.2 ± 0.2 | 6.3 ± 0.2 | ISO 10523:2012 |
| COD, mg/L O2 | 4220 ± 634 | 880 ± 132 | 5910 ± 886 | 3800 ± 571 | ISO 15705:2002 |
| BOD, mg/L | 1500 ± 300 | 240 ± 48 | 4000 ± 800 | 1100 ± 220 | ISO 5815–1:2019 |
| SVI, mL/L | 104.6 ± 0.0 | 142.5 ± 0.0 | 99.1 ± 0.0 | 101.7 ± 0.0 | EN 14,702–1:2006 |
| TSS, mg/L | 3100 ± 306 | 700 ± 70 | 2400 ± 242 | 2200 ± 216 | EN 872:2007 |
| TOC, mg/L | 1810 ± 362 | 310 ± 62 | 1410 ± 282 | 962 ± 92 | EN 1484:1999 |
| PO4 −, mg/L | 166 ± 25 | 36.1 ± 5.4 | 164 ± 25 | 158 ± 24 | ISO 6878:2004 |
| Total nitrogen, mg/L | 243 ± 24 | 42.8 ± 6.4 | 229 ± 23 | 219 ± 21 | PB/FCH/6/ D:10.04.2017* |
| N-NH4 +, mg/L | 14 ± 1 | 0.10 ± 0.02 | 12 ± 1 | 11 ± 1 | ISO 11732:2005 |
| N-NO2−mg/L | < 0.020 | < 0.020 | < 0.020 | < 0.020 | ISO 13,395: 1996 |
| N-NO3 − mg/L | 0.20 ± 0.05 | 0.54 ± 0.14 | 0.20 ± 0.05 | 0.20 ± 0.05 | ISO 13,395: 1996 |
| Chlorides Cl−mg/L | 170 ± 17 | 210 ± 21 | 170 ± 16 | 170 ± 17 | ISO 10,304–1:2007 |
| Sulfates SO4 2− mg/L | 70 ± 7 | 120 ± 12 | 80 ± 7 | 81 ± 8 | ISO 10,304–1:2007 |
*Internal calculation method, total nitrogen calculated as the sum of nitrogens: nitrate, nitrite and Kjeldahl nitrogen according to ISO 5663:1984. All experiments were performed in at least three replicates.
Shifts in the number of heterotrophic bacteria and dehydrogenase activity in activated sludge exposed to diatrizoate
The number of total heterotrophic bacteria (THB) has changed during 100 days of incubation. The highest values (6.11 and 6.44 log CFU/mL) were recorded at the beginning of the experiment, and the lowest (4.57 and 4.64 log CFU/mL) on the 21st day in AS exposed to 0.2 and 2.0 mg/L of DTZ, respectively (Fig. 2A). However, at the end of the experiment, THB abundance was found to be in the range 5.52 (0.2 mg/L) to 5.74 (control) log CFU/mL, but this difference was statistically insignificant. Interestingly, by day 40 of the experiment, the number of bacteria in AS with 20 mg/L DTZ was higher than in the other samples. This could be due to the production of spores by bacteria in unfavourable conditions and their subsequent germination on the plates.
Fig. 2.

The number of THB (A) and changes in the TPF (1,2,3-triphenyltetrazolium chloride) concentration (µg/h·mL) (B) in the activated sludge exposed for 100 days to different concentrations of diatrizoate (DTZ). The means with different letters in each sampling day are significantly different (p < 0.05, LSD test) considering the effect of DTZ concentration. The means without any letters did not differ among others on the adequate sampling day.
In parallel with the THB counts, the activity of dehydrogenase was measured. After three weeks of incubation, compared to the control, a 60% decrease in the activity of these enzymes was found in all samples containing DTZ (Fig. 2B). On the 40th day, the activity in the control increased twice compared to the beginning of the experiment and 1.87, 1.78 and 1.64-times in the AS with 0.2, 2.0 and 20 mg/L of DTZ, respectively. Simultaneously, dehydrogenase activity was significantly lower in the AS exposed to DTZ, and the lowest activity values were recorded for samples containing the highest concentration of DTZ. On the last day of the experiment, dehydrogenase activity in AS exposed to 20 mg/L DTZ was half lower compared to the control (Fig. 2B). Dehydrogenases catalyse the oxidation-reduction reactions thus they can effectively participate in the degradation of organic compounds in AS. This group of enzymes is considered a good and sensitive indicator of the rate and intensity of microbial oxidation14,15. Among the key enzymes engaged in the metabolism of pollutants in sewage, such as esterases and catalase, dehydrogenase turned out to be the most sensitive to the presence of toxic substances14. Based on the obtained results, it can be clearly stated that the increase in DTZ concentration caused a decrease in the activity of microorganisms in the AS. Interestingly, changes in dehydrogenase activity did not correlate with changes in THB abundance. It can be assumed that the measured increase in dehydrogenase activity (observed from day 40) came from the uncultured fraction of microorganisms. A similar relation was observed by Michalska et al.16 and Matyja et al.17, who examined the impact of leachate from the Kalina Pond and exposure to heavy metals, respectively. Both observed that the decrease in dehydrogenase activity was not the result of a decline in the number of THB. An increase in dehydrogenase activity observed in our study between days 30 and 40 of incubation may indicate a stabilisation of microbial activity under these conditions. Such a long period needed for stabilisation may suggest that microbial activity was determined by slow-growing microorganisms, such as nitrifying bacteria, which take at least three weeks to develop into a mature population18.
The assessment of functional diversity indicators of activated sludge exposed to diatrizoate
Functional diversity indices are considered a sensitive tool for detecting perturbations occurring in microbial populations under different environmental conditions19,20. Therefore, the present study examined whether AS exposure to different DTZ concentrations affects the values of functional diversity indices of the tested AS microorganism populations. However, the results obtained on the 30th day of the experiment do not clearly indicate whether increasing concentration of the DTZ in the AS had impact on microbial functional diversity (Table 2). Values of the Gini coefficient - the measure of inequality of substrate oxidation - did not change significantly. The most significant changes were recorded for AS exposed to 2 mg/L DTZ, where a decrease in the number of metabolised substrates (R) from 28.60 at the beginning to 18.67 on day 30 was accompanied by a significant decline in the value of the Shannon index - the measure of the diversity of oxidised substrates. This may indicate the elimination or metabolism inhibition of a group of microorganisms capable of oxidising specific substrates. The impact of DTZ concentration on AS diversity indices changed after 100 days of exposure. The values of all analysed indicators were worse the higher the concentration of DTZ was added. Moreover, the activity of AS exposed to 20 mg/L of DTZ (AWCD 0.07 ± 0.02) was 12 times lower compared to control (AWCD 0.84 ± 0.02) with a simultaneous significant decrease of richness (from 26.33 to 20.33) and diversity (from 1.27 to 0.96) of utilised substrates (Table 2). This clearly indicates a negative impact of DTZ on the populations of AS microorganisms related to long-term exposure to this compound. One explanation may be the acquisition of the ability to biotransform DTZ by AS microorganisms into intermediates that are more harmful than the initial compound. This hypothesis may be supported by the results of Rastogi et al.21, who pointed out that some DTZ photodegradation transformation products were predicted to be active for mutagenicity and genotoxicity. So far, there are scarce literature reports on the microbiological biotransformation or biodegradation of DTZ without its previous physicochemical treatment. However, the transformation pathways of this compound after treatment with physicochemical factors have been developed and it was shown that the most stable elements are the aromatic ring substituted with three iodine atoms and amide groups, which remain in the structure of subsequent intermediates2,22. Our HPLC analyses showed some depletion of DTZ during 7-day cycle incubation, but no additional peaks as potential intermediates were detected.
Table 2.
The functional diversity indices for the contaminated with DTZ and control activated sludge at the beginning (start), 30th and 100th day of exposition to different concentrations of diatrizoate (0.2; 2.0 and 20 mg/L). The numbers in captions after underlying means the sampling day.
| G | H’ | R | AWCD | |
|---|---|---|---|---|
| Start | 0.43 ± 0.05 | 1.38 ± 0.01 | 28.60 ± 0.55 | 1.46 ± 0.04 |
| Control_30 | 0.67 ± 0.06* | 1.17 ± 0.05a* | 23.67 ± 4.51a | 0.94 ± 0.19ab |
| 0.2 mg/L_30 | 0.69 ± 0.01* | 1.11 ± 0.01a* | 24.67 ± 1.15a | 0.80 ± 0.04a* |
| 2 mg/L_30 | 0.69 ± 0.01* | 1.01 ± 0.07b | 18.67 ± 1.53b | 1.03 ± 0.03b* |
| 20 mg/L_30 | 0.69 ± 0.01 | 1.09 ± 0.03ab | 23.67 ± 1.53a | 1.26 ± 0.09c* |
| Control_100 | 0.54 ± 0.01A* | 1.27 ± 0.02A* | 26.33 ± 0.58A | 0.84 ± 0.02A |
| 0.2 mg/L_100 | 0.62 ± 0.01B* | 1.18 ± 0.02A* | 26.67 ± 1.15A | 0.44 ± 0.07B* |
| 2 mg/L_100 | 0.65 ± 0.02C* | 1.15 ± 0.11A | 22.67 ± 2.08B | 0.23 ± 0.04C* |
| 20 mg/L_100 | 0.69 ± 0.01D | 0.96 ± 0.16B | 20.33 ± 1.53B | 0.07 ± 0.02D* |
G—Gini coefficient; H’—Shannon index; R—substrate richness; AWCD—average well colour development. The plus/minus values represent SD. The means with different letters in each column are significantly different (p < 0.05, LSD test) considering the effect of DTZ concentration on the 30th day (lowercase letters) or the 100th day (higher case letters). The means without any letters did not differ among others on the adequate sampling day. In each column, the pairs of means with the same concentration of DTZ marked with an asterisk are significantly different (p < 0.05, the independent samples t-test) considering the effect of time.
Substrate utilisation profiling by microorganisms in activated sludge contaminated with diatrizoate
To determine whether the presence of DTZ affected the utilisation patterns, substrates on EcoPlates® were grouped by their biochemical guild (Fig. 3A). Statistical analyses were carried out depending on the DTZ concentration and exposure time. On the 30th day of the experiment, the intensity of carbohydrates and carboxylic acids usage increased with the DTZ concentration increase (carbohydrates - from 48 to 61%, and carboxylic acids - from 19 to 26%, in control and AS with 20 mg/L of DTZ, respectively). The utilisation of amino acids and polymers decreased (from 10 to 2% and 10–3%, respectively). In turn, on the 100th day, the metabolic pattern was different - the higher the concentration of DTZ, the greater the utilisation of surfactants (from 7% in control to 22% in 20 mg/L of DTZ) and polymers (from 2 to 11%), with the percentage of carboxylic acid decrease (from 30 to 12%).
Fig. 3.

Changes in the utilisation of distinguished groups of carbon sources in control AS and AS treated with 0.2, 2.0, or 20 mg/L of DTZ (A). Projection of carbon sources from Biolog® EcoPlates™ along PC1 and PC2 (B) and metabolic profiles of the control and treated AS (C). The profile captions X_Y - X – DTZ concentration, Y- sampling day. The means of each group of carbon source with different letters are significantly different (p < 0.05, LSD test) considering the effect of DTZ concentration on the 30th day (lowercase letters) or the 100th day (higher case letters). The means without any letters did not differ among others on the adequate sampling day. The pairs of means with the same concentration of DTZ marked with an asterisk are significantly different (p < 0.05, the independent samples t-test) considering the effect of time (30th vs. 100th day).
To define in more detail which substrates influenced the variability in the metabolic profiles of AS microorganisms depending on the DTZ concentration and exposure time, a principal components analysis (PCA) was performed (Fig. 3B). The PCA included 24 carbon sources and explained 74.54% of the variance (Fig. 3C). Only these substrates that were correlated with the PC1 or PC2 in the range of -0.5 to 0.5 were taken into account (Table S2). It was indicated that PC1 differentiated the metabolic profiles of controls from the others, and PC2 differentiated the profiles of the control obtained on the 30th and 100th day (Fig. 3B). It was found that in the controls, amino acids, amines and carbohydrates were intensively oxidised. In the profiles obtained after 30 days of exposure, higher consumption of phenylethylamine and D-cellobiose could be distinguished, while putrescine and D-lactose were more strongly correlated with the profile obtained after 100 days (Fig. 3B and C). The substrates that differentiated AS treated with various concentrations of DTZ from the control were D-xylose, for metabolic profiles obtained after 30 days of exposure (2 mg/L_30 and 20 mg/L_30) and glycogen, α-ketobutyric acid, α-cyclodextrin, Tween 80 and D-malic acid for the profile obtained on the 100th day from AS treated with 20 mg/L of DTZ (20 mg/L_100).
The correlation of D-xylose with AS exposed to DTZ and D-cellobiose with the control (on day 30 of the experiment) may indicate the development of different populations of microorganisms, at least in terms of the ability to metabolise sugars that are cellulose components. D-xylose is the most abundant pentose sugar in nature, the element of a hemicellulosic fraction of lignocellulose. Some microorganisms are not able to assimilate xylose, and more importantly, among the microorganisms that can utilise it, xylose uptake and metabolism are inhibited by glucose23. In light of this information and taking into consideration that after 30 days, the activity (AWCD) of the microorganism population exposed to 2 and 20 mg/L DTZ was significantly higher than in the control (Table 2), it can also be assumed that during the 7-day cycle, there was no glucose in the medium, which allowed the microorganisms capable of oxidising xylose to more intensively uptake this pentose as a carbon source. At the same time, microorganisms in the control preferred the oxidation of D-cellobiose, which is hydrolysed into two glucose monomers24.
In turn, AS microbial populations exposed to 20 mg/l DTZ for 100 days showed the most intense glycogen oxidation, which may indicate starvation conditions since enzymes engaged in the glycogen degradation pathway, such as glycogen phosphorylase (EC 2.4.1.1) and debranching enzyme (EC 3.2.1.-), are induced by a deficit of carbon and/or nutrient sources25. This is described in the literature as the “stringent response”, a process that switches the cell from growth-related to maintenance/survival mode26. Additionally, after 100 days of incubation, the obtained metabolic profiles differed in the intensity of oxidation of compounds involved in amino acid metabolism - α-ketobutyric acid and putrescine, correlated with samples containing 20 mg/L of DTZ and control, respectively (Fig. 3B and C). Α-ketobutyric acid is an intermediate in branched-chain amino acids metabolism, toxic when it accumulates in the cell27. Branched amino acids are important compounds in protein synthesis, signalling, and fine-tuning adaptation to amino acid starvation28. Putrescine, in turn, is involved in the metabolism of arginine and ornithine, which are its precursors. It was proved that putrescine catabolism is a metabolic response to stress conditions like high temperature, sublethal concentration of antibiotics or oxidative stress29. It is also engaged in regulating biofilm formation - a process that also confers resistance to environmental stress. Liu et al.30 indicated that exogenous putrescine induced biofilm formation in Pseudomonas aeruginosa, which was dependent on putrescine uptake and biosynthesis pathway. All this information may suggest the occurrence of stress conditions in AS after 100 days of incubation in both the presence of DTZ and the control. However, it is important to note that the metabolic response of the microbial population in these systems was different. Another interesting reaction was the more intensive oxidation of α-cyclodextrin by microorganisms treated with 20 mg/l of DTZ for 100 days. It is known that this substrate is used only by microorganisms that have a specific cyclodextrin translocation machinery that allows their uptake. The literature mainly indicates bacteria of the genus Bacillus capable of depolymerising starch into smaller molecules, such as cyclodextrin and oligosaccharides, outside the bacterial cells and transported through the cell membrane by specific transport proteins31. The ability to oxidise such a specific substrate under DTZ exposure conditions indicates an increase in the activity of specific groups of microorganisms that were not found in the control (negative correlation of the control profile – control_100 with the intensity of α-cyclodextrin oxidation was stated – Fig. 3B and C, Table S2).
2.5 The influence of the presence of diatrizoate on the composition of fatty acids in activated sludge.
Directional changes in microorganisms’ cellular fatty acid composition are considered a rapid indicator of changes in their growth environment32–34. This is because the adaptive response of microorganisms to changes in external conditions is a quick shift in the fluidity of their biological membranes through modifications of membrane fatty acids. Since the research focuses on assessing the impact of DTZ on the physiological state of the microbial populations in AS, fatty acids were also analysed. The analysis of FAME profiles isolated directly from AS showed that changes in the FAME compositions were caused by exposure time rather than DTZ concentration. The PCA analysis involved 20 fatty acids and explained 74.54% of the variance (Fig. 4A). It was indicated that the profiles obtained at the beginning of the experiment and after 30 days were differentiated along the first axis (PC1) from those obtained after 100 days of exposure (Fig. 4B). The FAME profiles on day 30 were characterised by a higher content of hydroxylated (14:0 3OH, 16:0 3OH) and unsaturated (16:1 ω5c, 16:1 ω7c, 17:1 ω8c, 18:1 ω7c) fatty acids, while those on day 100 contained a higher percentage of branched (14:0 iso, 16:0 iso, 18:0 me), straight-chain (14:0, 18:0) and unsaturated (17:1 ω7c and 18:1 ω9c) fatty acids (Fig. 4A and B). Based on the percentages of particular fatty acids obtained, the stress indicators - a ratio of saturated to unsaturated fatty acids (SAT/UNSAT) and the mean fatty acid chain length - were calculated (Table 3). The presence of DTZ in the tested concentration range did not cause significant changes in the values of both indices. SAT/UNSAT ratios for samples collected on the 30th day of the experiment were significantly lower (1.01–1.49) compared with those from the 100th day (1.85–2.24), which, according to the literature, might be interpreted as a signal of the occurrence of stressful conditions32. The mean fatty acid chain length was slightly longer after 100 days, although these changes were not statistically significant (Table 3). Neither a month nor 100 days of AS exposure to DTZ influenced the values of both FAME indicators. It might be supposed that DTZ did not significantly impact the biological membranes of AS microorganisms and did not induce a defensive reaction of bacterial cells. The observed increase in the SAT/UNSAT ratio after 100 days of exposure compared to the values obtained after 30 days was rather related to other changes in the growth conditions of microorganisms, as this value also increased significantly in the control.
Fig. 4.

Projection of fatty acids along PC1 and PC2 (A) and FAME profiles of the control and treated AS (B). The percentages of distinct FAME markers for the control AS and AS treated with DTZ (C). The profile captions X_Y - X – DTZ concentration, Y- sampling day. The means of each FAMEs marker with different letters are significantly different (p < 0.05, LSD test) considering the effect of DTZ concentration on the 30th day (lowercase letters) or the 100th day (higher case letters). The means without any letters did not differ among others on the adequate sampling day. The pairs of means with the same concentration of DTZ marked with an asterisk are significantly different (p < 0.05, the independent samples t-test) considering the effect of time (30 vs. 100 day).
Table 3.
The ratio of saturated to unsaturated fatty acids (SAT/UNSAT) and mean fatty acid chain length of AS microorganisms exposed to different DTZ concentrations. The numbers in captions after underlying means the sampling day.
| SAT/UNSAT | Mean chain length | |
|---|---|---|
| Start | 1.17 ± 0.11 | 15.58 ± 0.05 |
| Control_30 | 1.27 ± 0.14* | 15.58 ± 0.01 |
| 0.2 mg/L_30 | 1.49 ± 0.18 | 15.63 ± 0.06 |
| 2 mg/L_30 | 1.01 ± 0.53* | 15.35 ± 0.34 |
| 20 mg/L_30 | 1.31 ± 0.02* | 15.64 ± 0.24 |
| Control_100 | 1.87 ± 0.18* | 15.37 ± 0.09 |
| 0.2 mg/L_100 | 1.85 ± 0.29 | 15.43 ± 0.11 |
| 2 mg/L_100 | 2.24 ± 0.28* | 15.26 ± 0.36 |
| 20 mg/L_100 | 1.90 ± 0.0.16* | 15.22 ± 0.05 |
The plus/minus values represent SD. The means with different letters in each column are significantly different (p < 0.05, LSD test) considering the effect of DTZ concentration on the 30th day (lowercase letters) or the 100th day (higher case letters). The means without any letters did not differ among others on the adequate sampling day. In each column, the pairs of means with the same concentration of DTZ marked with an asterisk are significantly different (p < 0.05, the independent samples t-test) considering the effect of time.
Based on the literature, changes in fatty acid patterns may indicate changes in AS microbial communities16,35. In our studies, the percentage of the FAME markers for Gram-negative bacteria was the highest at two specific time points: at the beginning of the experiment and after 30 days, particularly at the 0.2 mg/L DTZ concentration and in the control group (Fig. 4C). Their content in the AS after 100 days decreased in the range from 1.3-fold (2 mg/L) to 2.2-fold (0.2 mg/L) compared to data from 30th day. Simultaneously, the percentage of Gram-negative bacteria markers differed significantly after 100 days of exposure depending on the DTZ concentration and was the highest for the concentration of 20 mg/l. The second group of biomarkers whose content changed significantly were FAMEs characteristic for Gram-positive bacteria. Between 30 and 100 days, their content increased by 1.1 (20 mg/L) to 2.0 times (2 mg/L). However, no statistically significant differences were found when comparing the percentage of these biomarkers on day 100 of the experiment among all used concentrations of DTZ. It has been reported that Gram-positive bacteria may have a high metabolic capacity against various pollutants and unfavourable conditions, which may result in their advantage in polluted environments36. This may explain the significantly higher percentage of their biomarker fatty acids after long-term incubation. The next group of biomarkers whose content underwent significant changes were FAMEs typical of fungi. Their content doubled between 30 and 100 days, regardless of the DTZ concentration.
Based on the results obtained, it can be concluded that exposure to DTZ caused significant changes in the biomarker fatty acids of Gram-negative bacteria. In contrast, changes in the percentage of the remaining groups of microorganisms resulted rather from the time of exposure and the influence of other factors than the presence of this contrast medium.
Functional gene expression quantification
Quantification of the expression of the 16 S rRNA gene and the genes encoding cytochrome P450-type alkane hydroxylase (CYP153) and catechol 2,3-dioxygenase (C230) was conducted to investigate changes in the total activity of bacteria from AS and the activity of two main enzymes catalysing oxidation-reduction reactions under the influence of different concentrations of DTZ during the experimental period. No significant differences were observed between samples from various treatments at either of the analysed time points for all analysed genes (Fig. 5A-C). However, significantly higher transcription levels of these genes were noted for some treatments when comparing results obtained on day 100 with those from day 30. In the case of the 16 S rRNA gene (Fig. 5A), this increase was reported in the control sample. For the CYP153 gene (Fig. 5B), a significant increase in transcript levels on day 100 compared to day 30 was observed only in the sample treated with DTZ at a concentration of 2 mg/L. For the C230 gene (Fig. 5C), a significant increase in transcript levels was noted in both the 0.2 mg/L_100 and 2 mg/L_100 samples. These results are consistent with the determination of dehydrogenase activity which increased in the latter part of the experimental period. They also align with findings from FAME analysis, which indicated that microbial community structure changed over the course of the experiment. Consequently, these structural changes may have led to alterations in the activity of these organisms37,38. It is also worth noting that the number of C230 transcripts was three orders of magnitude lower than the number of transcripts estimated for the CYP153 gene, which indicated a lower activity of catechol 2,3-dioxygenase in AS, compared to the activity of cytochrome P450-type alkane hydroxylase.
Fig. 5.
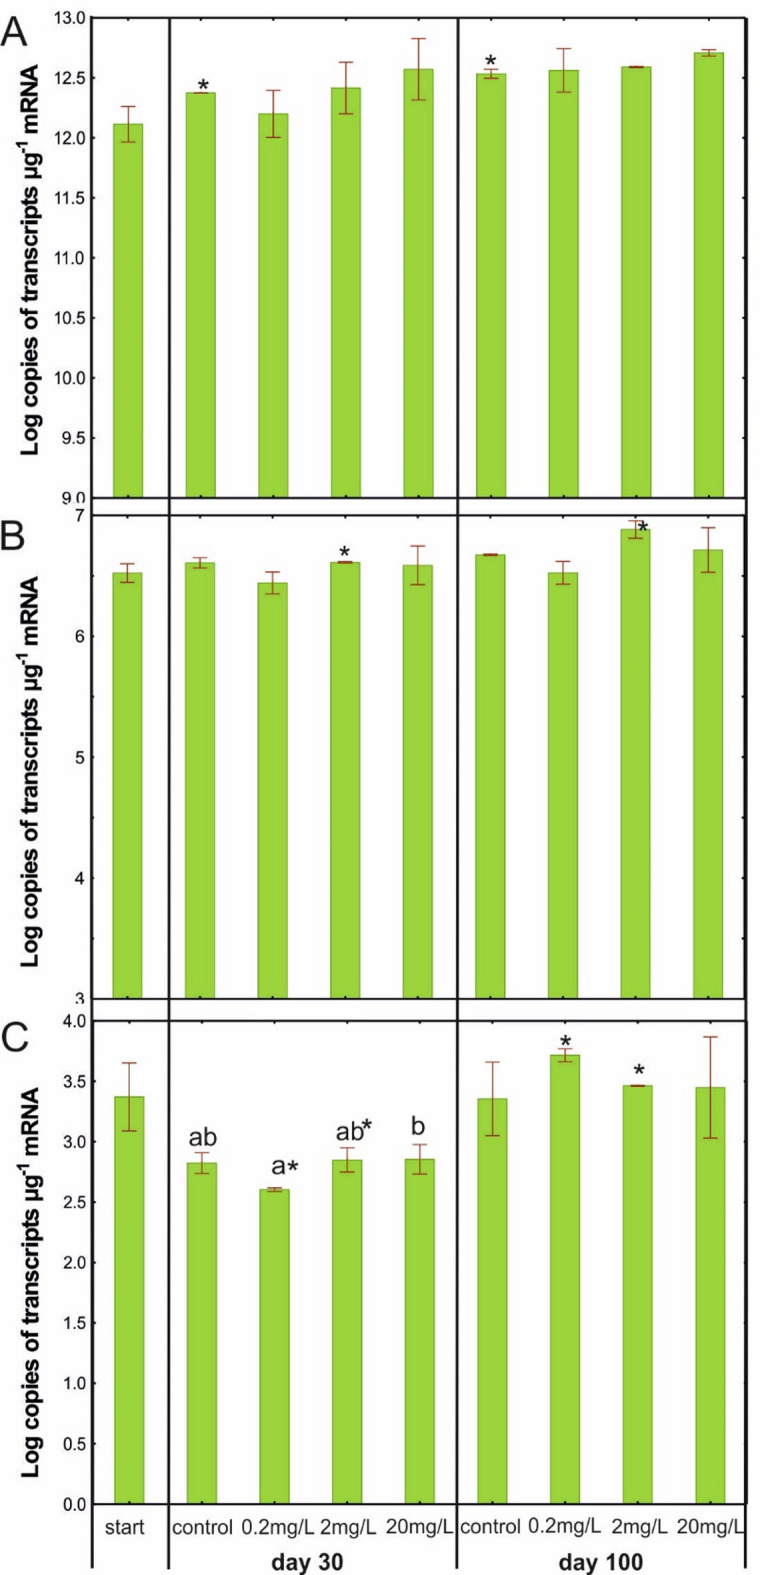
Number of 16 S rRNA (A), CYP153 (B) and C230 (C) transcript copies in control AS and AS treated with 0.2, 2.0, or 20 mg/L of DTZ on days 30 and 100.
The obtained results may indicate a lack of impact of DTZ on the activity of the tested enzymes. However, it is important to note that in our study standard primers were used to study the gene expression levels, capturing only a fraction of the CYP153 and C230 gene pool, which may not fully reflect the overall situation. This limitation was highlighted in the research by Frostegård et al.39 and Pacwa-Płociniczak et al.40. They compared the expression levels of the selected bacterial genes in soil using RT-qPCR and metatranscriptomic analysis, observing differences between the two methods. This suggests that the RT-qPCR technique may not always provide a complete picture of bacterial gene expression levels in analysed environments.
Conclusion
The long-term exposure of AS microorganisms to DTZ negatively affected their activity and functional diversity. Among the analysed biochemical and genetic indicators, the ones best in demonstrating changes occurring in AS microorganisms under the influence of exposure to DTZ are those related to the utilisation of substrates on EcoPlates®. Dehydrogenase activity turned out to be an equally sensitive indicator. Only after a longer period of time (after 100 days) the negative changes begin to be noticeable. This, in a sense, shows how important long-term studies are. Changes, even over a period of one month, do not have to be linear, especially in such complex systems as activated sludge. This also shows that the assessment of the quality of microbial populations in activated sludge should be considered in the context of their functioning rather than species composition because this mainly determines the effectiveness of wastewater treatment, i.e. the basic role they play.
Materials and methods
Sample collection and experimental set-up
The activated sludge (AS) was collected from the aeration tank of the wastewater treatment plant Klimzowiec (Chorzów, Poland). Firstly, AS was diluted with the synthetic wastewater according to Michalska et al.16 to obtain the initial concentration of the sludge biomass of 3.0 ± 0.5 g/L. AS was transferred to the 1-L laboratory-scale activated sludge systems in triplicates. Next, AS was contaminated with diatrizoate (DTZ) at concentrations of 0.2, 2.0, and 20 mg/L (Fig. 1A). AS without the addition of DTZ was treated as a control. Sample “start” was control AS at the beginning of the experiment. All AS systems were operated under a stable temperature in a thermostatic room (21 °C) and aerated under shaking conditions (130 rpm) for 100 days. At 7-day intervals, AS was sedimented for 30 min, the overlying liquid was removed, and AS was supplemented with fresh synthetic sewage and the appropriate amount of DTZ, enabling the achievement of the assumed initial DTZ concentrations (Fig. 1B).
Activated sludge physico-chemical analysis
Physicochemical parameters of AS (pH, chemical oxygen demand (COD), biological oxygen demand (BOD), sludge volume index (SVI), total suspended solids (TSS), total organic carbon (TOC), PO4−, total nitrogen, ammonium nitrogen (N-NH4 +), nitrite nitrogen (N-NO2 −), nitrate nitrogen (N-NO3 −), chlorides and sulfates) were determined according to the standards at the accredited chemical laboratory (Eurofins OBiKŚ Poland Sp. z o.o.). All methods are listed in Table 1.
Enumeration of the total heterotrophic bacteria
Before the sedimentation, 20 mL samples of AS were collected and homogenised according to Michalska et al.16 to extract bacteria from AS flocks. After homogenisation, 2 mL of AS was transferred to 18 mL of sterile 0.9% NaCl for shaking (15 min, 130 rpm) and serial ten-fold dilutions were prepared for the plate counts. The inoculated plates with LB (Luria Bertani) Agar (Miller) were incubated at 21 °C for 24–48 h. The number of THB was expressed as the log CFU/mL.
Measuring dehydrogenase activity
The activity of the AS microorganisms was determined weekly by quantifying the activity of dehydrogenase (EC.1.1.1) according to Miksch41 based on the reduction of 2,3,5-triphenyltetrazolium chloride (TTC) into red, insoluble 1,2,3-triphenyltetrazolium chloride (TPF).
Determination of diatrizoate concentration
The concentration of DTZ in AS was monitored by RP-HPLC (Nexera LC-40, Shimadzu, Japan) equipped with a ReproSil-Pur Basic C-18 column (150 mm × 4.6 mm, 5 μm, Dr Maisch HPLC GmbH, Ammerbuch, Germany) and PDA detector. The mobile phase consisted of acetonitrile and 1% acetic acid (5:95 v/v). Separation was carried out using an isocratic flow of 1 mL/min. The detection wavelength was set at 238 nm. The obtained samples were collected once a week before the AS sedimentation and were centrifuged at 14,000 rpm for 25 min prior to HPLC analysis.
Community-level physiological profiling (CLPP)
The community-level physiological profiles (CLPPs) in the AS samples were obtained using 96-wells Biolog® EcoPlates™ (BIOLOG Inc., Hayward, USA) and the Spark® Multimode Microplate Reader (Tecan Group Ltd., Männedorf, Switzerland). At the beginning of the experiment, and then after 30 and 100 days, 10 mL samples were collected from each AS system, homogenised (10 s at 11,000 x g) (IKA© Ultra-Turrax T-25 digital homogeniser, IKA® Works, Guangzhou, China) and 100-fold diluted with sterile 0.9% NaCl. Then, 120 µl of the obtained suspensions were used to inoculate each well of the EcoPlates™. The plates were incubated at 21 °C in the dark for five days. The absorbance in each well was measured at 590 nm at the beginning and at equal time intervals. The functional diversity indices were calculated according to Nowak and Mrozik42. The Gini coefficient (G) was calculated according to Al-Mutairi (2008)43. The carbon sources utilised in EcoPlates™ were divided into six guilds42.
MIDI-FAME analysis
Extraction and identifying fatty acid methyl esters (FAMEs) were performed according to Michalska et al.16. At the beginning (“start” sample), on 30 and 100 days of the experiment, The isolated FAMEs were separated with a gas chromatograph (Hewlett-Packard 6890) equipped with an HP-Ultra 2 capillary column (25 m, 0.22 mm ID), an injection volume was 2 µL, pressure 10.7 psi (71.33 kPa) and hydrogen was used as a carrier gas with flow velocity 0.54 mL/min. During analysis, an oven temperature ramp from 170 °C to 260 °C (at 5 °C/min). FAMEs were detected by a flame ionisation detector (FID) and identified using the MIDI Microbial Identification System software (Sherlock TSBA 6.1 method and TSBA6 library; MIDI Inc., Newark, DE, USA).
The mean fatty acid chain length (Mean FA) was calculated as per an equation of Yang et al.44. To study the changes in the structure of microbial communities in the AS exposed to different concentrations of DTZ, FAME biomarkers of Gram-positive and Gram-negative bacteria, fungi, and actinomycetes were analysed. Specific biomarkers were selected and divided among the identified fatty acids, according to Nowak and Mrozik (2018)42.
RNA extraction and RT-qPCR analysis
RNA was extracted from AS samples (n = 3 for –“start” sample, and for each treatment on days 30 and 100) using the RNeasy PowerSoil Total RNA Kit (Qiagen, Germantown, MD, USA), following the manufacturer’s instructions. The RNA quantity and quality were evaluated using an Implen NanoPhotometer® spectrophotometer (Implen GmbH, Munich, Germany). To remove any residual DNA contamination from the total RNA, RQ1 RNase-free DNase (Promega, Madison, WI, USA; 1 U/µg RNA, 30 min, 37 °C) was applied. The cDNA was synthesised using the RevertAid First Strand cDNA Synthesis Kit (Thermo Scientific™, Waltham, MA, USA). The remaining RNA samples were stored at − 80 °C, while the cDNA samples were stored at − 20 °C.
Quantification of the expression level of 16 S rRNA gene and genes encoding cytochrome P450-type alkane hydroxylase (CYP 153) and catechol 2,3-dioxygenase (C230), was performed using qPCR protocol according to Pacwa-Płociniczak45. Briefly, qPCR was carried out in triplicate using a LightCycler® 96 Real-Time PCR System (Roche Diagnostics, Florham Park, NJ, USA). Each 10 µl reaction mixture included 2 µl of cDNA, 1 µl of the primer pair mixture (10 µM), and 5 µl of 2 × Master Mix (FastStart Essential DNA Green Master) (Roche Diagnostics, Florham Park, NJ, USA). Fluorescence data were measured at 81 °C at the end of each extension step to avoid detecting primer dimers. For the melting curve analysis of the products, the temperature was increased from 65 to 95 °C. A serial dilution of the ready-to-use positive selection cloning vector pJET1.2/blunt (Thermo Scientific™, Waltham, MA, USA) containing the target gene product served as the DNA standards.
Statistical analysis
Statistical analysis was performed using STATISTICA 13.1 PL software (TIBCO Software Inc., Palo Alto, CA, USA) based on one-way ANOVA tests and the independent samples t-test with the significance level set at p < 0.05. One-way ANOVA analysis of variance and the independent samples t-test were used to test the differences between the control and treated AS on the same measurement day and to compare the same treatments on the 30th and 100th day, respectively. Additionally, in order to find any differences in the metabolic and FAME profiles between the tested systems with AS, principal component analysis (PCA) was used.
Electronic supplementary material
Below is the link to the electronic supplementary material.
Author contributions
Conceptualisation, A.N.; data curation, A.N.; formal analysis, A.N.; funding acquisition, A.N.; investigation, A.N.; methodology, A.N. and M. P-P.; project administration, A.N.; resources, A.N. and M. P-P.; software, A.N., M. P-P. and A.M.; supervision, A.N.; validation, A.N. and M. P-P.; visualisation, A.N. and A.M.; writing—original draft, A.N; writing—review and editing, A.N., M. P-P. and A.M.; All authors have read and agreed to the published version of the manuscript.
Funding
The article was prepared on the basis of funding under the National Science Centre (Poland), project: Miniatura 5, 2021/05/X/NZ9/00457, The influence of selected iodine contrast agents on the activity and diversity of activated sludge microorganisms.
Data availability
The datasets used and/or analysed during the current study are available from the corresponding author upon request.
Declarations
Competing interests
The authors declare no competing interests.
Footnotes
The original online version of this Article was revised: The original version of this Article contained an error in the names of the authors in which the given names and the family names were reversed.
Publisher’s note
Springer Nature remains neutral with regard to jurisdictional claims in published maps and institutional affiliations.
Change history
7/30/2025
A Correction to this paper has been published: 10.1038/s41598-025-13544-9
References
- 1.Zhang, W., Soutrel, I., Amrane, A., Fourcade, F. & Geneste, F. Improvement of the biodegradability of diatrizoate by electroreduction of its amido groups. Sep. Purif. Technol.285, 120317 (2022). [Google Scholar]
- 2.Nowak, A., Pacek, G. & Mrozik, A. Transformation and ecotoxicological effects of iodinated X-ray contrast media. Rev. Environ. Sci. Biotechnol.19, 337–354 (2020). [Google Scholar]
- 3.European Commission. EU Biodiversity strategy for 2030. Bringing nature back into our lives. https://op.europa.eu/pl/publication-detail/-/publication/31e4609f-b91e-11eb-8aca-01aa75ed71a1 (2021).
- 4.World Economic Forum. The global risks report 2020. 15th Edition. https://www.weforum.org/publications/the-global-risks-report-2020/ (2020).
- 5.Stadler, L. B., Vela, J. D., Jain, S., Dick, G. J. & Love, N. G. Elucidating the impact of microbial community biodiversity on pharmaceutical biotransformation during wastewater treatment. Microb. Biotechnol.11, 995–1007 (2017). [DOI] [PMC free article] [PubMed] [Google Scholar]
- 6.Panagos, P. et al. How the EU soil observatory is providing solid science for healthy soils. Eur. J. Soil. Sci.75, e13507 (2024). [Google Scholar]
- 7.Turbé, A. et al. Soil Biodiversity: Functions, Threats and Tools for Policy Makers (Bio Intelligence Service, IRD, and NIOO, Report for European Commission (DG Environment) (2010).
- 8.Cardoso, D. N., Oliveira, M., Soares, A. M. V. M. & Loureiro, S. Susceptibility of Folsomia candida to agrochemicals after multigenerational exposure to human pharmaceuticals. Environ. Toxicol. Chem.41, 592–600 (2022). [DOI] [PubMed] [Google Scholar]
- 9.Guimarães, B., Rombke, J. & Amorim, M. J. B. On the importance of longer-term exposure to stressors - A critical review and proposal for multigenerational testing in standard soil invertebrates. Sci. Total Environ.854, 158680 (2023). [DOI] [PubMed] [Google Scholar]
- 10.Seitz, W. et al. Monitoring of iodinated X-ray contrast media in surface water. Chemosphere64, 1318–1324 (2006). [DOI] [PubMed] [Google Scholar]
- 11.Zhang, W., Fourcade, F., Amrane, A. & Geneste, F. Removal of iodine-containing X-ray contrast media from environment: the challenge of a total mineralisation. Molecules28, 341 (2023). [DOI] [PMC free article] [PubMed] [Google Scholar]
- 12.Bartels, Y., Jekel, M. & Putschew, A. Impact of the reductive deiodination on the sorption of iodinated X-ray contrast media to filter sand and activated carbon. Water Res.258, 121801 (2024). [DOI] [PubMed] [Google Scholar]
- 13.Al-Sulaiman, A. M. & Khudair, B. H. Correlation between BOD5 and COD for Al-Diwaniyah wastewater treatment plants to obtain the biodegradability indices. Pak J. Biotechnol.15, 423–427 (2018). [Google Scholar]
- 14.Michalska, J., Piński, A., Żur, J. & Mrozik, A. Analysis of the bioaugmentation potential of Pseudomonas putida OR45a and Pseudomonas putida KB3 in the sequencing batch reactors fed with the phenolic landfill leachate. Water12, 906 (2020). [Google Scholar]
- 15.Chukhchin, D., Varakin, E., Rudakova, V., Vashukova, K. & Terentyev, K. Express-method for determination of the oxidising capacity of activated sludge and its biofilms in pulp and paper mill. Water13, 1553 (2021). [Google Scholar]
- 16.Michalska, J., Greń, I., Żur, J., Wasilkowski, D. & Mrozik, A. Impact of the biological cotreatment of the Kalina pond leachate on laboratory sequencing batch reactor operation and activated sludge quality. Water11, 1539 (2019). [Google Scholar]
- 17.Matyja, K., Wasiela, A., Dobicki, W., Pokorny, P. & Trusek, A. Dynamic modeling of the activated sludge microbial growth and activity under exposure to heavy metals. Bioresour Technol.339, 125623 (2021). [DOI] [PubMed] [Google Scholar]
- 18.Woznica, A., Nowak, A., Beimfohr, C., Karczewski, J. & Bernas, T. Monitoring structure and activity of nitrifying bacterial biofilm in an automatic biodetector of water toxicity. Chemosphere78, 1121–1128 (2010). [DOI] [PubMed] [Google Scholar]
- 19.Goswami, M., Bhattacharyya, P., Mukherjee, I. & Tribedi, P. Functional diversity: an important measure of ecosystem functioning. Adv. Microbiol.7, 82–93 (2017). [Google Scholar]
- 20.Németh, I., Molnár, S., Vaszita, E. & Molnár, M. The biolog ecoplate™ technique for assessing the effect of metal oxide nanoparticles on freshwater microbial communities. Nanomaterials11, 1777 (2021). [DOI] [PMC free article] [PubMed] [Google Scholar]
- 21.Rastogi, T., Leder, C. & Kümmerer, K. Qualitative environmental risk assessment of photolytic transformation products of iodinated X-ray contrast agent diatrizoic acid. Sci. Total Environ.482–483, 378–388 (2014). [DOI] [PubMed] [Google Scholar]
- 22.Hu, C. Y., Xu, L., Lin, Y. L. & Li, C. A comparative study on the degradation of Iohexol and diatrizoate during UV/persulfate process: kinetics, degradation pathways and iodinated disinfection by-products. Environ. Sci: Water Res. Technol.10, 718 (2024). [Google Scholar]
- 23.Zhao, Z., Xian, M. & Zhao, G. Biochemical routes for uptake and conversion of xylose by microorganisms. Biotechnol. Biofuels. 13, 21 (2020). [DOI] [PMC free article] [PubMed] [Google Scholar]
- 24.Eriksen, D. T., Hsieh, P. C. H., Lynn, P. & Zhao, H. Directed evolution of a cellobiose utilisation pathway in Saccharomyces cerevisiae by simultaneously engineering multiple proteins. Microb. Cell. Fact.12, 61 (2013). [DOI] [PMC free article] [PubMed] [Google Scholar]
- 25.Goh, Y. J. & Klaenhammer, T. R. Insights into glycogen metabolism in Lactobacillus acidophilus: impact on carbohydrate metabolism, stress tolerance and gut retention. Microb. Cell. Fact.13, 94 (2014). [DOI] [PMC free article] [PubMed] [Google Scholar]
- 26.Wilson, W. A. et al. Regulation of glycogen metabolism in yeast and bacteria. FEMS Microbiol. Rev.34, 952–985 (2010). [DOI] [PMC free article] [PubMed] [Google Scholar]
- 27.Fang, Y. et al. Metabolic detoxification of 2-oxobutyrate by remodelling Escherichia coli acetate bypass. Metabolites11, 30 (2021). [DOI] [PMC free article] [PubMed] [Google Scholar]
- 28.Kaiser, J. C. & Heinrichs, D. E. Branching out: alterations in bacterial physiology and virulence due to branched-chain amino acid deprivation. mBio9, e01188–e01118 (2018). [DOI] [PMC free article] [PubMed] [Google Scholar]
- 29.Schneider, B. L., Hernandez, V. J. & Reitzer, L. Putrescine catabolism is a metabolic response to several stresses in Escherichia coli. Mol. Microbiol.88, 537–550 (2013). [DOI] [PMC free article] [PubMed] [Google Scholar]
- 30.Liu, Z., Hossain, S. S., Moreiram, Z. M. & Haney, C. H. Putrescine and its metabolic precursor arginine promote biofilm and c-di-GMP synthesis in Pseudomonas aeruginosa. J. Bacteriol.204, e00297–e00221 (2022). [DOI] [PMC free article] [PubMed] [Google Scholar]
- 31.Saini, K., Pathak, V. M., Tyagi, A. & Gupta, R. Microbial cyclodextrin glycosyltransferases: sources, production, and application in cyclodextrin synthesis. Catal. Res.2, 1–69 (2022). [Google Scholar]
- 32.Min, B., Kim, K., Li, V., Cho, S. & Kim, H. Changes in cell membrane fatty acid composition of Streptococcus thermophilus in response to gradually increasing heat temperature. J. Microbiol. Biotechnol.30, 739–748 (2020). [DOI] [PMC free article] [PubMed] [Google Scholar]
- 33.Mező, E. et al. Effect of culture conditions on fatty acid profiles of bacteria and lipopolysaccharides of the genus Pseudomonas—GC-MS analysis on ionic liquid-based column. Molecules27, 6930 (2022). [DOI] [PMC free article] [PubMed] [Google Scholar]
- 34.Yoon, Y., Lee, H., Lee, S., Kim, S. & Choi, K. H. Membrane fluidity-related adaptive response mechanisms of foodborne bacterial pathogens under environmental stresses. Food Res. Int.72, 25–36 (2015). [Google Scholar]
- 35.Werker, A. G., Becker, J. & Huitema, C. Assessment of activated sludge microbial community analysis in full-scale biological wastewater treatment plants using patterns of fatty acid isopropyl esters (FAPEs). Water Res.37, 2162–2172 (2003). [DOI] [PubMed] [Google Scholar]
- 36.Erdoğan, E., Şahin, F. & Namlı, A. Phospholipid fatty acids analysis-fatty acid methyl ester (PLFA-FAME) changes during bioremediation of crude oil contamination soil. Afr. J. Biotechnol.12, 6294–6301 (2013). [Google Scholar]
- 37.Garibay, V. M., del Fernández, A., de Anda, J., Senes-Guerrero, C. & Gradilla-Hernández, M. S. Structure and activity of microbial communities in response to environmental, operational, and design factors in constructed wetlands. Int. J. Environ. Sci. Technol.19, 11587–11612 (2022). [Google Scholar]
- 38.Ma, H. et al. Changes in composition and function of soil microbial communities during secondary succession in Oldfields on the Tibetan plateau. Plant. Soil.495, 429–443 (2024). [Google Scholar]
- 39.Frostegård, Å., Vick, S. H. W., Lim, N. Y. N., Bakken, L. R. & Shapleigh, J. P. Linking meta-omics to the kinetics of denitrification intermediates reveals pH-dependent causes of N2O emissions and nitrite accumulation in soil. ISME J.16, 26–37 (2022). [DOI] [PMC free article] [PubMed] [Google Scholar]
- 40.Pacwa-Płociniczak, M. et al. The potential of enhanced phytoremediation to clean up multi-contaminated soil – insights from metatranscriptomics. Microbiol. Res.284, 127738 (2024). [DOI] [PubMed] [Google Scholar]
- 41.Miksch, K. Aplication of dehydrogenase activity determinations in biodegradation of refinery sewage. Gas Water Civ. Technol.51, 234–235 (1977). (in Polish). [Google Scholar]
- 42.Nowak, A. & Mrozik, A. Degradation of 4-chlorophenol and microbial diversity in soil inoculated with single Pseudomonas Sp. CF600 and Stenotrophomonas maltophilia KB2. J. Environ. Manag. 215, 216–229 (2018). [DOI] [PubMed] [Google Scholar]
- 43.Al-Mutairi, N. Z. Variable distributional characteristics of substrate utilisation patterns in activated sludge plants in Kuwait. Bioresour Technol.100, 1524–1532 (2008). [DOI] [PubMed] [Google Scholar]
- 44.Yang, X., Hang, X., Zhang, M., Liu, X. & Yang, H. Relationship between acid tolerance and cell membrane in Bifidobacterium, revealed by comparative analysis of acid-resistant derivatives and their parental strains grown in medium with and without tween 80. Appl. Microbiol. Biotechnol.99, 5227–5236 (2015). [DOI] [PubMed] [Google Scholar]
- 45.Pacwa-Płociniczak, M., Czapla, J., Płociniczak, T. & Piotrowska-Seget, Z. The effect of bioaugmentation of petroleum-contaminated soil with Rhodococcus erythropolis strains on removal of petroleum from soil. Ecotoxicol. Environ. Saf.169, 615–622 (2019). [DOI] [PubMed] [Google Scholar]
Associated Data
This section collects any data citations, data availability statements, or supplementary materials included in this article.
Supplementary Materials
Data Availability Statement
The datasets used and/or analysed during the current study are available from the corresponding author upon request.